performance of foam ceramic elements in log wood stoves hans hartmann.pdf · p 15 b mc 011 folie 2...
TRANSCRIPT

P 15 B Mc 011
October 29th, 2015, Berlin
Hans Hartmann • Robert Mack
Performance of foam ceramic elements
in log wood stoves
IEA Task 32 Workshop: “Highly efficient clean log wood stoves"

P 15 B Mc 011 Folie 2
Filter material for measurement of long term feasibility
Mack • Hartmann
15B Mc 42
New foam ceramic
Foam ceramic
after 200 batches
Foam ceramic after
2 heating seasons
Approx. 550 batches (Filter had been washed after
1st heating season)
Porosity: 35 ppi

P 15 B Mc 011 Folie 3
Retrofit catalyst for stoves using foam ceramic filters
Mack • Hartmann
15B Mc 43
Manufacturer Linder Katalysatoren GmbH
Thermal resistance > 1450 °C
Carrier material SiC- foam ceramic (SiC – SiO2 + 3 C SiC + 2 CO and Al2O3)
(Al2O3 components fired at 2300-2500°C)
Coating Platinum (Pt78), Palladium (Pa45),
Rhodium (Rh46)
Reduction CO, OGC, NOx, PM
Structure > 70% open porous surface
Porosity PPI 8, PPI 10, PPI 20, PPI 30,
Product specification data as declared by manufacturer:

P 15 B Mc 011 Folie 4
Construction of an equivalent flow reducion (“Dummy”-Filter)
Mack • Hartmann
Fan
Velocity meter
Filter
Pressure
measurement
Frequency
converterTFZ-Dummy:
Material: Vermiculite (25 mm)
Drill holes: 8 and 10 mm

P 15 B Mc 011 Folie 5
Measurement of filter temperature
Mack • Hartmann
15B Mc 44
150
300
450
°C
750
T F
lue g
as [
°C]
T Flue gas [°C]
T Filter [°C]
6
12
%
24/0
O2/C
O2 [
%]
O2 % [%]
CO2 % [%]
2.000
4.000
mg/Nm³
8.000/0
CO
CO mg/Nm³ [mg/Nm³]
0 1 2 3 4 h 60
500
1.000
mg/Nm³
2.000/0
OG
C m
g/N
m³
Duration
OGC mg/Nm³ [mg/Nm³]
Nox mg/Nm³ [mg/Nm³]

P 15 B Mc 011 Folie 6
Determination of the actual flue gas flow path
Mack • Hartmann
Flow rate: 35.4 Nm³/h
Draught at socket: -11.8 Pa
Pressure drop, burning
chamber to socket: 3.2 Pa
Leakage?
Pressure
measurement

P 15 B Mc 011 Folie 7
Determination of the actual flue gas flow path (2)
Mack • Hartmann
Flow rate: 33.9 Nm³/h
Draught at socket: -11.9 Pa
Pressure drop, burning
chamber to socket: 3,8 Pa
1. Masking
the filter
plates with
air tight
tape

P 15 B Mc 011 Folie 8
Determination of the actual flue gas flow path (3)
Mack • Hartmann
Flow rate = 21.2 Nm³/h
Draught at socket = -11,8 Pa
Pressure drop, burning chamber to
socket: 9,1 Pa
2. Masking all
suspected
leakages with air
tight tape
Flow rate ↓pressure drop ↑

P 15 B Mc 011 Folie 9
Determination of the actual flue gas flow path (4)
Mack • Hartmann
Flow rate = 33.9 Nm³/h
Draught at socket: -12.0 Pa
Pressure drop, burning
chamber to socket: 3,9 Pa
3. Cutting the
air tight tape
from the filter
plates
Similar flow rate and
pressure drop to variant 1.

P 15 B Mc 011 Folie 10
Flowchart of the testing procedure used
Mack • Hartmann
15B Mc 060
150
300
450
°C
750
T F
lue
gas
[°C
] T Flue gas [°C]
T Filter [°C]
6
12
%
24/0
O2/C
O2 [
%]
O2 % [%]
CO2 % [%]
2.000
4.000
mg/Nm³
8.000/0
CO
CO mg/Nm³ [mg/Nm³]
0 1 2 3 4 5 6 °C0
500
1.000
mg/Nm³
2.000/0
OG
C m
g/N
m³
Duration
OGC mg/Nm³ [mg/Nm³]
Nox mg/Nm³ [mg/Nm³]
Flue gas sampling
PM 1 PM 2 PM 3 PM 4 PM 5 PM 6 PM 7 PM 8 Cool down
full load operation partial load operation= Refilling criteria

P 15 B Mc 011 Folie 11
Evaluation of measuring cycle (full load and part load)
Mack • Hartmann
15B Mc 45
Part load: time weighted average value of batch 1,2,6,7,8
Full load: time weighted average value of batch 1-5

P 15 B Mc 011 Folie 12
Comparison of foam ceramic filters: Full load cycle (1)
Mack • Hartmann
15B Mc 46
• 3 testing days per filter
• All tests at natural draught
• One weighted average value of batch 1-5
• Same damper settings for all tests
• Test fuel: Beech with bark
• PM sampling starts before refilling and ends
before next refilling

P 15 B Mc 011 Folie 13
Comparison of foam ceramic filters: Full load cycle (2)
Mack • Hartmann
15B Mc 047
P 15 B Mc 011 Folie 14
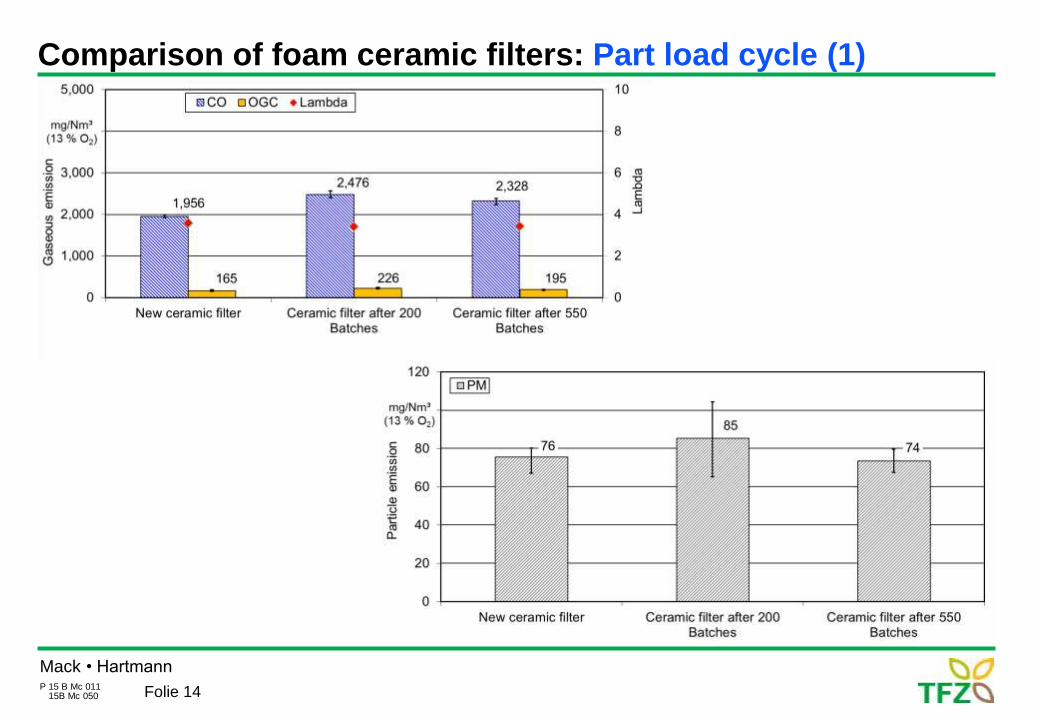
Comparison of foam ceramic filters: Part load cycle (1)
Mack • Hartmann
15B Mc 050

P 15 B Mc 011 Folie 15
CO conversion
Mack • Hartmann
15 B Mc 067
Filter Catalyst
38 % 43 %
Nominal load Partial load
Dummy Catalyst
46 % 47 %
Nominal load Partial load

P 15 B Mc 011 Folie 16
Non-Methane-OGC conversion
Mack • Hartmann
15 B Mc 068
Filter Catalyst
Nominal load Partial load
19 % 23 %
Dummy Catalyst
Nominal load Partial load
21 % 23 %

P 15 B Mc 011 Folie 17
Methane conversion
Mack • Hartmann
15 B Mc 069
Filter Catalyst
Nominal load Partial load
-6 % -14 %
Dummy Catalyst
Nominal load Partial load
10 % 2 %
P 15 B Mc 011 Folie 18
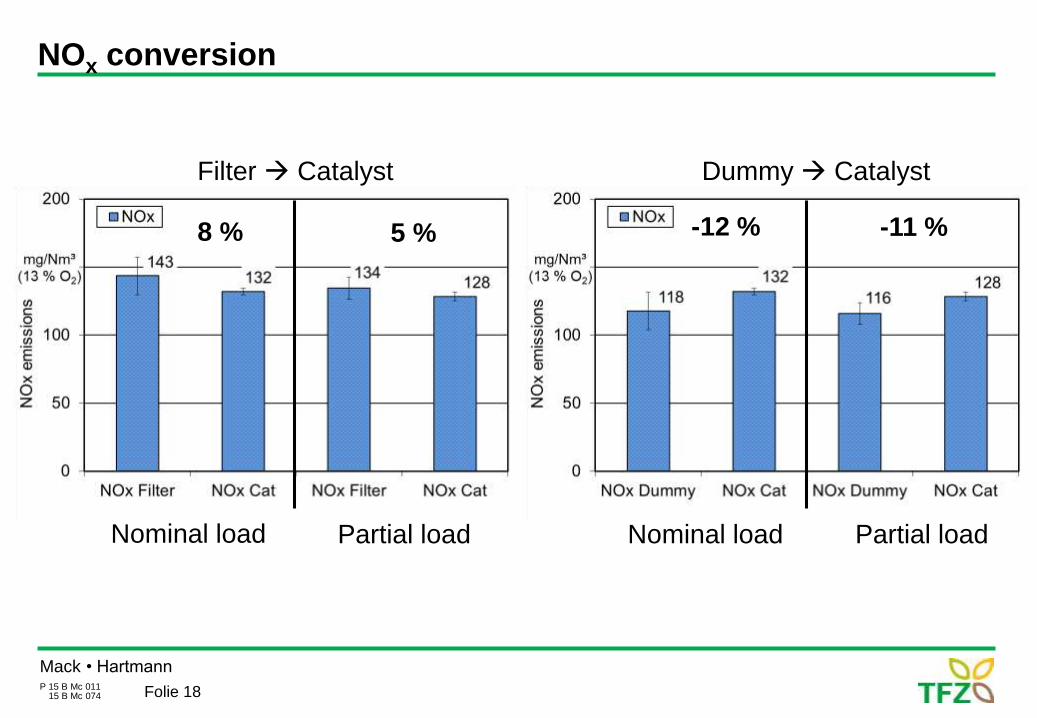
NOx conversion
Mack • Hartmann
15 B Mc 074
Filter Catalyst
Nominal load Partial load
8 % 5 %
Dummy Catalyst
Nominal load Partial load
-12 % -11 %

P 15 B Mc 011 Folie 19
PM reduction
Mack • Hartmann
15 B Mc 070
Filter Catalyst
Nominal load Partial load
6 % 8 %
Dummy Catalyst
Nominal load Partial load
10 % 12 %

P 15 B Mc 011 Folie 20
Conclusions
Mack • Hartmann
15 B Mc 070
Expectations for PM reductions by foam ceramic elements were not met
(particularly for non-catalytic elements).
Catalytic foam ceramic elements can reduce gaseous flue gas emissions
(CO, OGC).
Log term monitoring of this effect is required (field tests).
Regarding the flue gas flow through the foam ceramics there is still some
potential for optimisation.
It is desirable to achieve higher surface temperatures (< 700 °C) on
catalytic elements.
Retrofitting of catalytic foam ceramic elements may be an interesting option.

P 15 B Mc 011
Thanks for your attention!
www.tfz.straubing.de