performance of a nongrouted,. thin bonded pcc overlay
TRANSCRIPT

Performance of a Nongrouted,. Thin Bonded PCC Overlay
Highway Research Advisory Board Project HR - 291
Final Report
January 1992 Highway Division
Iowa Department

TECHNICAL REPORT STANDARD TITLE PACE
3. RECIPIENT'S CATALOG NO.
5 . REPORT DATE January 1992
6. PERFORUING ORGANIZATION CODE
8 . PERFORUING ORGANIZATION REPORT
10. WORK UNIT NO.
11. CWTRACT OR GRANT NO.
13. TYPE OF REPORT AND PERIOD COVERED
F i n a l Report June 1985 - December 1991
14. SPONSORING AGENCY CODE
I. REPORT NO.
HR-291 2. GOVERNHENT ACCESSION NO.
4 . TITLE AN0 SUBTITLE
Performance o f a Nongrouted Thin Bonded PCC Overlay
7. 'AUTHORlSl
Gary H a r r i s -
9 . PERFORUING ORGANIZATION ADDRESS
Iowa Department o f Transpor ta t ion Highway D i v i s i o n 800 L i n c o l n Way Ames, I A 50010 -
12. SPONSORING AGENCY NAUE AN0 ADDRESS
Iowa Department o f Transpor ta t ion Highway D i v i s i o n 800 L inco ln Way Ames. I A 50010
15. SUPPLEUENTARY NOTES
Performed i n cooperat ion w i t h t h e wape1lo and Monroe County Secondary Road Departments
16. ABSTRACT
The use o f a t h i n bonded concrete ove r lay atop an o l d e r sur face has been w ide ly incorporated f o r pavement r e h a b i l i t a t i o n i n Iowa s ince the e a r l y 70's. Two t e s t sec t ions were constructed i n 1985 o n county road T61 on t h e Monroe-Wapello County l i n e w i thout the use o f g rou t as a bonding agent t o determine i f adequate bond cou ld be achieved,and s t r u c t u r a l capac i t y uncompromised.
Both t e s t sect ions have performed w e l l w i t h one sec t i on having h igher bond strengths, lower roughness values. h igher s t r u c t u r a l capacity, and l ess debonding a t t h e j o i n t s than t h e o the r sect ion. Overa l l , bo thungrouted sect ions have performed w e l l under subs tan t i a l t r u c k t r a f f i c w i t h minimal surface d i s t ress . More a t t e n t i o n should be given, however, t o r e c t i f y i n g apparent debonding a t t h e j o i n t s when no grout i s used as a bonding agent.
17. KEY WORDS
Grout, Concrete Overlay
18. MSTRIBUTI? STATEHEN?
No r e s t r i c t i o n s . This p u b l i c a t i o n i s a v a i l - ab le from t h e O f f i c e o f Materials-Research, Iowa DOT.
1S.SECURITY CLASSIF.(OF THIS REPORT)
Unc lass i f i ed
21.NO. OF PAGES
2 1 2O.SECURITY CLASSIF.(OF THIS PAGE)
Unc lass i f ied
22.PRICE

Performance of a Nongrouted Thin Bonded PCC Overlay
Final Report for
Highway Research Advisory Board Research Project HR-291
Gary Harris Secondary Road Coordinator
515-239-1382 Materials Office Highway Division
Iowa Department of Transportation Ames, Iowa 50010
January 1992

syathrne International
1 inch = 2.54 centimeters (cm)
1 foot = 0.304 8 meters (m)
1 cubic foot = 0.028 316 8 cubic meters (m3)
1 cubic yard = 0.764 555 cubic meters (m3)
1 mile = 1.609 34 kilometers (km)
1 pound (mass) = 0.453 592 kilograms (kg)
1 pound (force) = 4.448 218 Newtons (N)
1 PSI = 6.894 733 kN/m (kPa)
1 gallon = 0.003 785 cubic meters (m3)
I square yard = 0.836 127 sq. meters (m2)
1 pound/cubic foot = 16.01 8 477 kilograms/cubic meter (kg/m3)
1 acre = 0.404 686 hectares (ha)

TABLE OF CONTENTS
Page
Introduction .......................................... 1.
Objective ............................................. 2
Evaluation ........................................... 3
Preliminary Investigation ............................. 3
Construction Criteria and Procedures .................. 4
Performance ....................................... 4
Initial Test Results .............................. 5 ..................................... Shear Testing 6 Delamtect Results ................................. 7 Vehicle and Traffic Considerations ................ 8 Road Rater ........................................ 10 .............................. Profilometer Testing 13
Discussion and Summary ................................ 14 Conclusions . . . . . . . . . . . . . . . . . . . . . . . . . . . . . . . . . . . . . 15
........................................ Aknowledgement 16
References ......................................... 16 Appendix A . Method of Test for Determining the
the Shearing Strength of Bonded Concrete .............................. 17
Appendix B - Specification for Thin-Bonded Portland Cement Concrete Overlay ............... 20
DISCLAIMER
The contents of this report reflect the views of the author and do not necessarily reflect the official views of the Iowa Department of Transportation . This report does not constitute a standard. specifi- cation or regulation .

PAGE 1
INTRODUCTION
The Iowa road system has approximately 13,000 miles (20,900
km) of portland cement concrete (pcc) pavements, many of which
are reaching the stage where rehabilitation may be required.
Age, greater than anticipated traffic, heavier loads and dete-
rioration related to coarse aggregate in the original pavement
are some of the reasons that these pavements are nearing the
end of their service life.
One method utilized to rehabilitate pcc pavements is the thin
bonded pcc overlay. Since the introduction of thin bonded
overlays on highway pavements in 1973, progress has been made
in reducing the construction costs of this rehabilitation
technique. With the advent of the shotblast machine, surface
preparation costs have decreased from more than $4.00 per
square yard ($4.78/m2) to most recently $1.50 per square yard
($1.79/m2). Other construction costs, including placement,
grouting and sawing, have also declined. With each project,
knowledge and efficiency have improved.
In an effort to further reduce the construction costs, elimi-
nation of the grouting operation in the thin bonded overlay
techniques has been proposed. The grout has been used in the
past to facilitate bond between the new slab and the existing
slab, however, the grout with the necessary high water cement
ratio may actually impede both the bond strength growth and
the ultimate bond strength. The bond strencth may also be

PAGE 2
susceptible to high temperatures and windy conditions which
cause the grout to dry prematurely before the concrete is
placed. Preliminary work with nongrouted successfully bonded
overlays has included field trials on several pavement overlay
projects and on new bridges which use precast stay-in-place
floor panels with cast-in-place concrete wearing surface. A
nongrouted section was an experimental feature on secondary
road project RS-7701(9) on the Monroe-Wapello County line con-
structed in the summer of 1985. Additionally, two Strategic
Highway Research Program (SHRP) SPS-7 experimental sections
will be built on 1-35 in Hamilton County in 1992. These SHRP
sections will study the use of grout versus ungrouted, differ-
ent overlay thicknesses, and various surface preparations.
The results should contribute to the knowledge base of bonded
over lays .
OBJECTIVE
The objective of HR-291 is to evaluate the performance of two,
250 foot (76.2 m) overlay sections which were placed without
using grout to bond the overlay to the original concrete sur-
face. If sufficient bond can be achieved and maintained with-
out using grout, savings in time and money can be realized by
eliminating the grouting operation in future overlay work.
PAGE 3
EVALUATION
The evaluation consisted of bond shear strengths, pavement de-
flection data and a visual inspection of both the pavement
structure and the individual cores.
PRELIMINARY INVESTIGATION
County road T61 is located on the Monroe-Wapello County line
in southeast Iowa. After it was originally paved in 1972, it
carried mostly local traffic [380-410 average daily traffic
(ADT) with 15% trucks]. In 1984, Cargill Inc. constructed a
corn sweetener refinement plant near the north end of the
project approximately one-half mile (800 m) south of the junc-
tion with IA 137. The anticipated traffic growth due to this
new development was expected to be equivalent to one hundred
5-axle, 80,000 pounds (360 kN) semi tractor trailers per day.
This was an addition of 175 18-kip (80 kN) ESALs (equivalent
single axle loads) per lane per day.
The original road was built in 1972 to the specifications of
that time. It was constructed by Central Construction Company
of Indianola, Iowa, 22 feet (6.7 m) wide on natural subgrade
with an initial PSI rating of 4.2. The road segment was 2.96
miles (4.76 km) long and had 40 foot (12 m) joint spacings
with aggregate interlock for load transfer. The existing
pavement showed no signs of unusual distress or wear. The
maintenance history indicated that very little repair work had
been required.

PAGE 4
CONSTRUCTION CRITERIA AND PROCEDURES
The 4 inch (10 cm) thin bonded overlay was constructed during
the month of June 1985. The existing pavement surface was
prepared by shotblasting. Prior to the paving operation,
areas seriously distressed were full-depth patched. Where the
grout was applied, it was pressure sprayed per Iowa Department
of Transportation specifications (Appendix B). Concrete mixed
in a central mix batch plant was hauled in dump trucks, which
discharged in front of the paver. A Rex Town and County
slipform paver finished up to 6400 L.F. (1951 m) per day of
the 4 inch (lo cm) thin bonded overlay 22 feet (6.7 m) wide.
The new slab was transversely textured and a white pigmented
curing compound was applied at 1.5 times the normal applica-
tion rate. Transverse joints were sawed full depth over the
existing transverse joints at 40 ft. (12 m) spacing, and addi-
tional 20 ft. (6.1 m) intermediate joints were sawed while the
longitudinal joint was sawed T/2, or 2" (5 cm), over the ex-
isting centerline joint. After sand and air cleaning, the
joints were sealed with a hot pour Sof-Seal per Iowa DOT spec-
ification.
PERFORMANCE
As outlined previously, this research project is intended to
evaluate the performance of bonded overlays constructed with-
out the use of grout. Cores were taken from the project soon
after construction, and tested for shear strength by the Iowa
Shear l ~ s t (Appendix A). In an effort to evaluate the per-

PAGE 5
formance of these sections over time, cores have been taken
and tested at regular intervals.
Initial Test Results
The two nongrouted overlay sections are located between
stations 4 1 9 i 7 5 and 422+25 (Section 1 ) and stations 443+25 and
445+75 (Section 2 ) . Current Iowa DOT specifications for
bonded overlays require a minimum bond shear strength of 200
psi (1380 kPa). Bond shear strength tests taken from cores
drilled 14 days after construction showed very high bond
strengths for the nongrouted test sections; 634 psi (4370 kPa)
for Section 1 and 663 psi (4570 kPa) for Section 2 . Shear
strength tests of grout bonded cores drilled adjacent to the
test sections averaged 300 psi (2070 kPa) near Section 1 and
476 psi (3280 kPa) near Section 2.
Bond shear strength tests of pavement cores from the test
sections one year after construction showed the grouted areas
continued to gain strength while the nongrouted sections re-
mained rather constant. The reason for the appearance of a
substantial bond strength gain in the grouted sections is not
fully understood. Average values are given in Table I.
The third year evaluation of the research project test
sections was undertaken the summer of 1988. Again, cores were
drilled in and adjacent to the nongrouted sections for shear
strength tes .ing .

PAGE 6
Shear Testing
Compared to its first year average value, Section 1's shear
strength decreased by more than 200 psi (1380 kPa). In con-
trast, the average shear strength of cores taken from the
grout bonded overlay area adjacent to Section 1 increased by
nearly 200 psi (1380 kPa).
Table I Shear Strengths Average Values
Location Average Shear Strength, PSI (kPa) 14 days 1 Year 3 Year 6 year
Section 1 (Nongrouted) 634 (4370) 623 (4300) 396 (2730) 525 (3620) Area Adjacent Section 1 300 (2070) 449 (3100) 627 (4320) --- (Grouted)
Section 2 (Nongrouted) 663 (4570) 654 (4510) 933 (6430) 807 (5560) Area Adjacent Section 2 476 (3280) 921 (6350) 1018 (7020) 1022 (7050) (Grouted)
Section 2 and its adjacent grout bonded area continued to show
increased bond strengths. Cores were again taken in the sum-
mer of 1991. The shear strength for Section 1 improved
slightly to 525 psi (3620 kPa) while for Section 2 it de-
creased to 807 psi (5560 kPa), but still greater than the
shear strength of Section 1. When these values are averaged
(666 psi or 4590 kPa), it closely parallels the shear
strengths for the ungrouted sections after 14 day and 1 year
evaluations.

PAGE 7
Delamtect Results
The delamtect is an instrument capable of determining delami-
nations occurring beneath the pavement surface. The instru-
ment sends sound waves through the concrete and measures the
time needed for the wave to reflect back to the surface. De-
laminations in the concrete will cause the wave to reflect
back at the point of delamination. The resulting shorter
travel time is then registered as a delaminated area on the
instrument printout.
Delamtect tests of the ungrouted test sections indicated some
delaminations in Section 1. The debonding is occurring at
transverse joints at 40 to 80 foot (12 to 24 m) intervals.
The underlying pavement has a joint spacing of 40 feet (12 m).
Joints in the overlay are spaced 20 feet (6.1 m) apart, with
every other joint being aligned over a joint in the original
pavement. The debonding is occurring at those overlay joints
lying between the original pavement joints. Differential
movement between the overlay and the original pavement is the
likely cause of this debonding. The fact that Section 1 is on
a fairly steep grade may contribute to some degree of differ-
ential movement of the slabs and subsequent debonding. The
debonded areas extend approximately 12 inches (.3 m) on each
side of a joint and cover the full width of the pavement.
This debonding has shown very little increase in the past two
years. The Section 2 test results showed no conclusive evi-
dence of any debonding occurring a the joints. If delami-

PAGE 8
nations have appeared in these sections, they are very small
at this stage.
Vehicle And Traffic Considerations
Traffic data complete with vehicle classification counts were
conducted in 1986 and 1990 to be converted into a number of
equivalent 18-kip (80 kN) single axle loads (ESAL) that indi-
cate the magnitude of loads applied to the pavement research
sections south of the Cargill plant.
formrn7W 10.88 lowa Department of lransportation
VEHICULAR TURNING MOVEMENTS Oftlce of Transportatton Inventory
Ames, lowa
county Wapello Count NO 90 31 8101 0991
D~~~ June 9. 1986 Locatton I A 137 & Co. Rd. T61 NW Cor. 5ec 7, 773, R15
Avg Ann Dally Traff~c .
Figure 1

PAGE 9
The 1986 analysis showed an ADT of 835 from the south with 19%
trucks (Figure 1). By contrast, the 1990 traffic analysis
showed an ADT of 1056 with 24% trucks over the test sections
(Figure 2). This represents greater than a 1 percent increase
per year in overall truck traffic. However, analysis of more
detailed data shows a marked increase of 83% in combination
trucks over the 1986 figures, giving rise to a substantially
larger growth in ESALs (pegged at 7 or 8 percent) than the 1
percent per year overall growth of truck traffic. Based on
the data, the total load applied to the bonded overlay is in
excess of 400,000 ESALs to date.
fWm22DtOI 10.w f+' lowa ~epartment of Transportation
Y - 7 VEHICULAR TURNING l~oveMENrs Off~ce of Transportation inventory
Ames, lowa
County WaPello count No 90 31 8101 0991
oate Auaust 11, 1990 Locatlo,, I A 137 & Co. Rd. T61 NW Cor. Sec. 7. T73. R15
Avg Ann Dally Traff~c
No Road I 0 I
1 2147 1 Co. Rd. T61
Figure 2

PAGE 10
Road Rater
Road Rater testing has been conducted annually on the entire
project. The Road Rater is a dynamic deflection measuring de-
vice used to determine the structural adequacy of pavements.
It can be seen from Figure 3 that the annual structural
ratings for the northbound lane are higher than those for the
southbound lane, except for an anomalous value in 1990. Fig-
ure 4 bears a similar relationship for structural ratings over
joint locations with an anomalous rating for 1991. The con-
trasting difference in values between the north and south
lanes over the entire project can be attributed essentially to
a variation in traffic loadings. A majority of the trucks en-
tering the Cargill corn sweetener refinement plant turn south
off of Highway 137 onto T61 and then unload their grain. It
follows that the southbound lane has experienced a greater
share of 18-kip (80 kN) ESAL loadings, and thus has consist-
ently lower structural ratings than the northbound lane.
It is interesting to note a converse relationship in struc-
tural ratings among the ungrouted test sections 1 and 2 with
that aforementioned (Figure 5). These sections lie south of
the Cargill plant on which the loaded grain traffic must
travel north to unload. Thus, the northbound lane has experi-
enced the larger degree of 18 kip (80 kN) ESAL loadings, and
consequently has a lower structural rating than the southbound
lane. Again, there is an anomaly in the results for Section 2
in 1989. This may be explained by the fact tiat annual test-

PAGE 11
ing is performed in the outside wheeltrack during the months
of April and May when the roadway exhibits the greatest insta-
bility, and depending upon the amount of moisture in the soil
at the time of freezing, the structural rating can vary from
one year to the next.
Annual Road Rater Results HR-29 1
-c South
0 1986 1987 1988 1989 1990 1991
YEAR
Figure 3

PAGE 12
Annual Road Rater Results
+ North
-+ South

PAGE 13
Annual Road Rater Results HR-29 1 (Ungrouted Sections)
~~1 Seetion 1 Section t
3 w - s1ctl0n2
[iTd North
South
1988 1989 YEAR
Figure 5
Profilometer Testing
The Iowa Department of Transportation uses a California-Type
25-Foot Profilograph to test pavements and bridge decks for
smoothness. The 25-Foot Profilograph is a rolling straight
edge essentially measuring vertical deviations from a moving
25-foot reference plane. The pavement profile is graphically
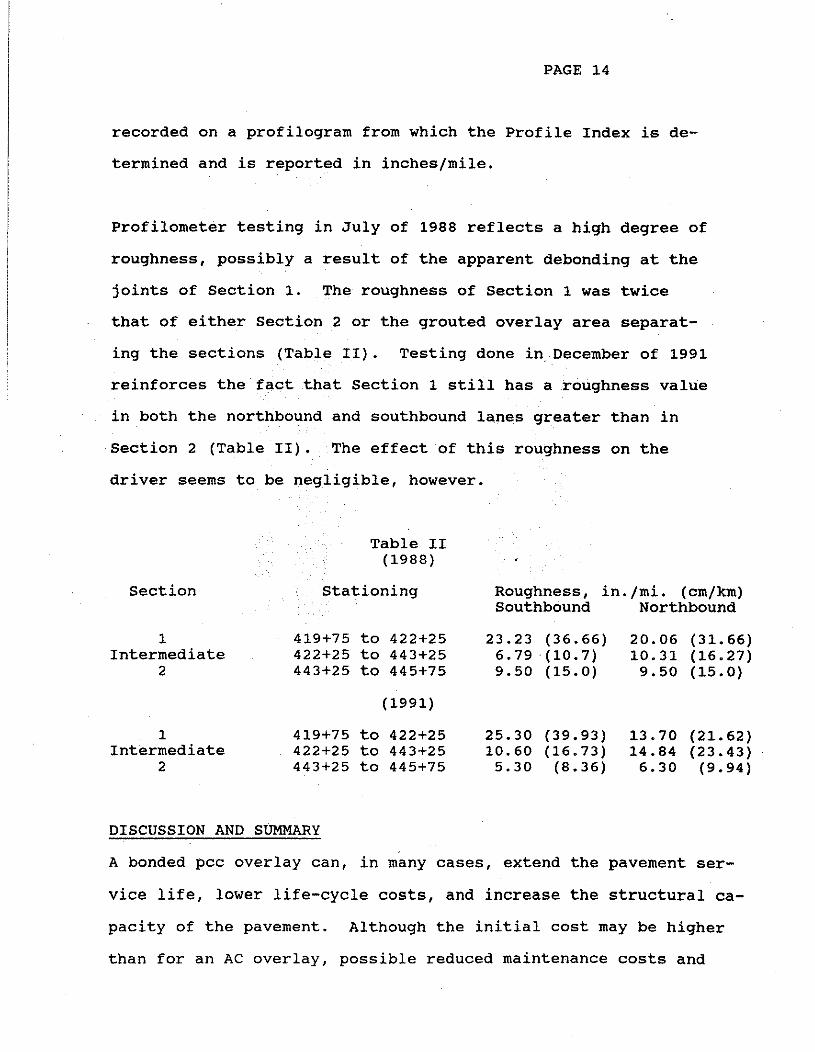
PAGE 14
recorded on a profilogram from which the Profile Index is de-
termined and is reported in incheslmile.
Profilometer testing in July of 1988 reflects a high degree of
I roughness, possibly a result of the apparent debonding at the
I joints of Section 1. The roughness of Section 1 was twice I I i that of either Section 2 or the grouted overlay area separat-
ing the sections (Table 11). Testing done in December of 1991
reinforces the fact that Section 1 still has a roughness value
in both the northbound and southbound lanes greater than in
Section 2 (Table 11). The effect of this roughness on the
driver seems to be negligible, however.
Table I1 (1988)
Section Stationing Roughness, in./mi. (cm/km) Southbound Northbound
1 419+75 to 422+25 23.23 (36.66) 20.06 (31.66) Intermediate 422+25 to 443+25 6.79 (10.7) 10.31 (16.27)
2 443+25 to 445+75 9.50 (15.0) 9.50 (15.0)
1 419+75 to 422+25 25.30 (39.93) 13.70 (21.62) Intermediate 422+25 to 443+25 10.60 (16.73) 14.84 (23.43)
2 443+25 to 445+75 5.30 (8.36) 6.30 (9.94)
DISCUSSION AND SUMMARY
A bonded pcc overlay can, in many cases, extend the pavement ser-
vice life, lower life-cycle costs, and increase the structural ca-
pacity of the pavement. Although the initial cost may be higher
than for an AC overlay, possible reduced maintenance costs and

PAGE 15
greater pavement life are reasons that bonded overlays can be a vi-
able resurfacing alternative. If sufficient bonding can be
achieved and maintained without using grout, even more savings in
time and money can be realized.
While the pavement shows little sign of surface distress, the ap-
parent debonding occurring at the joints in Section 1 is a cause
for concern. It is entirely possible that horizontal and vertical
movements of the pavement contribute to debonding. Had in-depth
documentation been done on the original pavement after full-depth
or patch repairs, any contributing causes of deterioration in the
overlay by the underlying slab could be ascertained.
CONCLUSIONS
From this research it can be concluded that:
1. Adequate bond (>200 psi or 1380 kPa) between the original slab
and pcc overlay can be achieved both with and without grout.
2. What little debonding ( 12 inches or .30 m) on each side of the
ungrouted joints that has occurred in Section 1 has not wors-
ened over the past two years.
3. The lack of debonding at the joints in Section 2 indicates that
the non-use of grout here has performed well.

PAGE 16
ACKNOWLEDGEMENT
This research project was suggested by the Iowa Concrete Paving As-
sociation and sponsored by the Iowa Department of Transportation
through the Highway Research Advisory Board. Partial funding for
this project was from the Secondary Road Research Fund in the
amount of $14,200.
The author wishes to extend appreciation to Wendell Folkerts,
Wapello County Engineer; Gordon Smith, Iowa Concrete Paving Associ-
ation; and the Iowa DOT for their support in conducting this
project. Central Paving Corporation also deserves recognition for
their cooperation on the project. Finally, many thanks go to Kathy
Davis, Chris Anderson, and Vernon Marks of the Iowa DOT Materials
Office for their assistance in writing this report.
REFERENCES
1. Lane, John, **Performance of Nongrouted Thin Bonded PCC Over-
lays,** Construction Report, Iowa Highway Research Board,
HR-291, August 1986.
2. Peshkin, D. G., Mueller, A. L., "Field Performance and Evalu-
ation of Thin Bonded Overlays,*@ Transportation Research Record
1286, TRB, National Research Council, Washington, D.C. 1990,
pp 84-94.

Appendix A Method of Test for Determining
the Shearing Strength of Bonded Concrete
PAGE 18
Page 1 of 2 Test Method No. Iowa 406-8 September 1984
IOWA DEPARTMENT OF TRANSPORTATION
Office of Uaterials
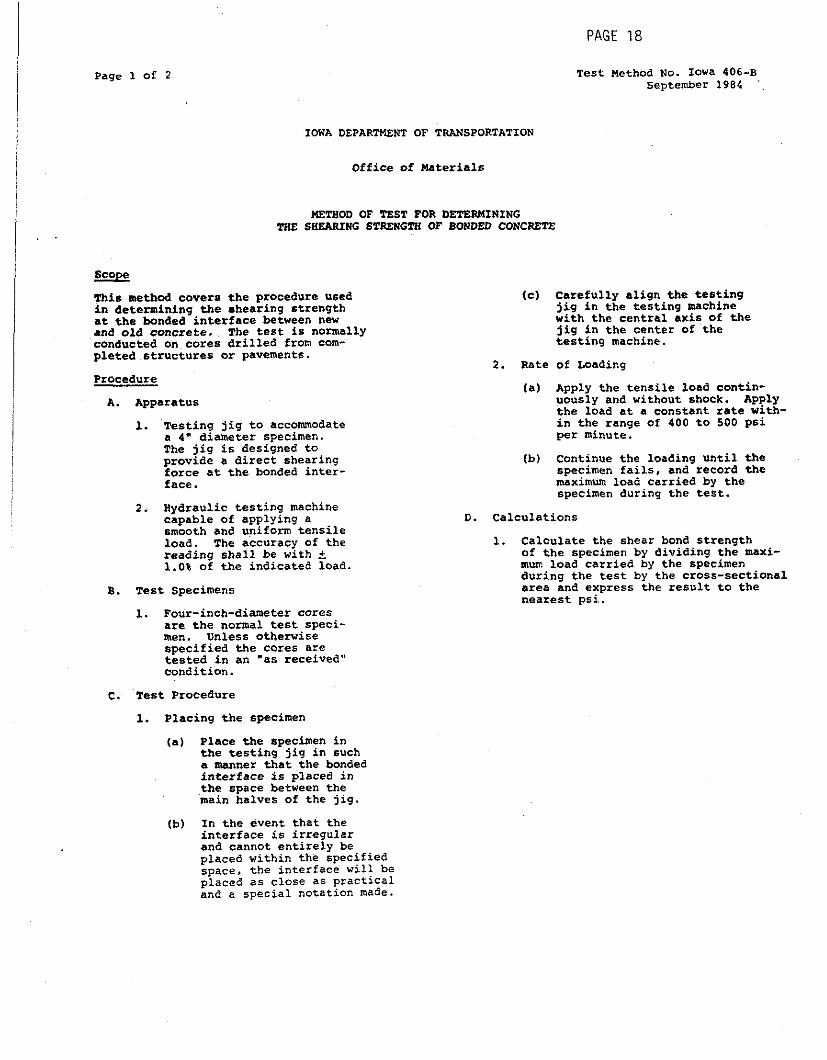
METBOD OF TEST FOR DETERMINING TEE SKEARING STRENGTH OF BONDED CONCRETE
This method covers the procedure used in determining the shearing strength at the bonded interface between new and old concrete. The test is normally conducted on cores drilled from com- pleted structures or pavements.
Procedure
A. Apparatus
1. Testing jig to accommodate a 4" diameter specimen. The jig is designed to provide a direct shearing force at the bonded inter- face.
2. Hydraulic testing machine capable of applying a smooth and uniform tensile load. The accuracy of the reading shall be with t 1.0s of the indicated load.
6 . Test Specimens
1. Four-inch-diameter cores are the nonnal test speci- men. Unless otherwise specified the cores are tested in an 'as received* condition.
C. Test Procedure
I. Placing the specimen
(a) Place the specimen in the testing jig in such a manner that the bonded interface is placed in the space between the main halves of the jig.
(c) Carefully align the testing jig in the testing machine with the central axis of the jig in the center of the testing machine.
2. Rate of Loading
(a) Apply the tensLle load contin- uously and without shock. Apply the load at a constant rate wath- in the range of 400 to 500 psi per minute.
(b) Continue the loading until the specimen fails, and record the maximum load carried by the s~ecimen durins the test.
D. Calculations
1. Calculate the shear bond strength of the specimen by dividing the maxi- mum load carried by the specimen during the test by the cross-sectional area and express the result to the nearest psi.
(b) In the event that the interface is irregular and cannot entirely be placed within the specified space, the interface will be placed as close as practical and a special notation made.

Test Method No. Iowa 406-B September 1984
PAGE 19
Page 2 of 2
Figure 1 Testing Jig
Figure 2 Hydraulic Testing Machine. Testing J i g and Specimen

Appendix B Specification for Thin-Bonded Portland
Cement Concrete Overlay

Section 2310. Thin-Bonded Portland Cement Concrete Overlay
2310.01 DESCRIPTION. This work consists of a PCC resurfacing overlay of an existing PCC pavement, and it may include associated patching and widening work.
2310.02 MATERIALS. All materials shall meet the requirements for the respective items in Part IV of the Standard Specifications, with the following modifications:
A. Cement. Article 4101 shall apply. The use of Type 111 cement will not be permitted. B. Aggregate. Sections 41 10 and 41 15 shall apply. Coarse aggregate shall be of gradation 3 o r 5 and of the durability class specified for PCC pavement; however, aggregate of Class 1 durability will not be permitted. Unless otherwise specified, the coarse aggregate shall be crushed limestone. C. Concrete. Mix No. C-4WR, as specified in 2301.04, shall be used for resurfacing. D. Grout for bonding new concrete to previously placed concrete shall consist of equal parts by weight of portland cement and concrete sand, mixed with sufficient water to form a stiff slurry. The consistency shall be such that it can be applied with a stiff brush or broom to the concrete in a thin, even coating that will not run o r puddle in low spots. The grout shall be agitated prior to and during its use. The cement-to-water contact time of the grout shall not exceed 90 minutes before it is placed. An equivalent grout of por- tland cement and water, applied by pressure spray, may be substituted with approval of the Engineer. E. JointFilIerandSealer shall meet requirements of Section 4136.02A. For a part of this material, a white or gray filler may be required by 2310.08E.