143 bonded concrete overlay performance in illinois · 143 bonded concrete overlay performance in...
TRANSCRIPT

143
Bonded Concrete OverlayPerformance In Illinois
FINAL REPORTPHYSICAL RESEARCH REPORT NO. 143JUNE 2002

Technical Report Documentation Page1. Report No.
FHWA/IL/PRR 1432. Government Accession No. 3. Recipient’s Catalog No.
4. Title and Subtitle 5. Report DateApril 2002
BONDED CONCRETE OVERLAY PERFORMANCE IN ILLINOIS 6. Performing Organization Code
8. Performing Organization Report No.7. Author(s)
Thomas J. Winkelman Physical Research No. 1439. Performing Organization Name and Address
Illinois Department of Transportation
10. Work Unit ( TRAIS)
Bureau of Materials and Physical Research126 East Ash StreetSpringfield, Illinois 62704-4766
11. Contract or Grant No.
IHR – R07
12. Sponsoring Agency Name and Address
Illinois Department of TransportationBureau of Materials and Physical Research126 East Ash Street
13. Type of Report and Period Covered
Final ReportJuly, 1995 – December, 2001
Springfield, Illinois 62704-4766 14. Sponsoring Agency Code
15. Supplementary Notes
16. AbstractTwo bonded concrete overlay rehabilitation projects were constructed in Illinois during the 1990’s. The first project wasconstructed in 1994 and 1995 on Interstate 80, east of Moline. The second project was constructed in 1996 on Interstate88 near Erie. The existing pavements for both the Interstate 80 and Interstate 88 projects were 8-inch thick continuouslyreinforced concrete pavements. The Interstate 80 rehabilitation was designed as a 4-inch thick plain concrete overlay. Thisproject includes six experimental sections using various percentages of microsilica added to the standard mix design. Inaddition, microsilica grout was used as a bonding agent between the original pavement and the new bonded concreteoverlay in some sections. The Interstate 88 project was designed as a 3-inch thick plain concrete overlay. This projectincludes two experimental sections, which incorporate different surface preparation methods prior to the overlay placement.This report summarizes the performance of these two bonded concrete overlays. The design, construction, maintenance,and costs of these projects are addressed. Visual distress surveys were conducted annually for both the Interstate 80 andInterstate 88 projects. In addition, these projects were tested annually for an International Roughness Index value.Condition Rating Surveys were conducted every two years to define the overall condition of the pavement. Results of thesetests and visual surveys are included within this report.The performance of these two projects has been quite different. The Interstate 80 project has shown significant distress,and was in need of maintenance only four years after construction. The Interstate 88 project has not developed significantearly distresses. Potential explanations for the difference in performance, including initial pavement condition, trafficvolume, and overlay construction are explored.
17. Key Words
pavement rehabilitation, bonded concrete overlay,microsilica, International Roughness Index, ConditionRating Surveys
18. Distribution Statement
No restrictions. This document is available to the publicthrough the National Technical Information Service,Springfield, Virginia, 22161
19. Security Classif. (of this report)Unclassified
20. Security Classif. (of this page)Unclassified
21. No. of Pages 53
22. Price
Form DOT F 1700.7 (8-72) Reproduction of completed page authorized

Final Report
BONDED CONCRETE OVERLAY PERFORMANCE IN ILLINOIS
By:
Thomas J. WinkelmanResearch Engineer
Illinois Department of TransportationBureau of Materials and Physical Research
Springfield, Illinois 62704
June 2002

ABSTRACT
Two bonded concrete overlay rehabilitation projects were constructed in Illinois during
the 1990’s. The first project was constructed in 1994 and 1995 on Interstate 80, east of
Moline. The second project was constructed in 1996 on Interstate 88 near Erie. The
existing pavements for both the Interstate 80 and Interstate 88 projects were 8-inch thick
continuously reinforced concrete. The Interstate 80 rehabilitation was designed as a 4-
inch thick plain concrete overlay. This project includes six experimental sections using
various percentages of microsilica added to the standard mix design. In addition,
microsilica grout was used as a bonding agent between the original pavement and the
new bonded concrete overlay in some sections. The Interstate 88 project was designed
as a 3-inch thick plain concrete overlay. This project includes two experimental sections,
which incorporate different surface preparation methods prior to the overlay placement.
This report summarizes the performance of these two bonded concrete overlays. The
design, construction, maintenance, and costs of these projects are addressed. Visual
distress surveys were conducted annually for both the Interstate 80 and Interstate 88
projects. In addition, these projects were tested annually for an International Roughness
Index value. Condition Rating Surveys were conducted every two years to define the
overall condition of the pavement. Results of these tests and visual surveys are
included within this report.
The performance of these two projects has been quite different. The Interstate 80
project has shown significant distress, and was in need of maintenance only four years
after construction. The Interstate 88 project has not developed significant early
distresses. Potential explanations for the difference in performance, including initial
pavement condition, traffic volume, and overlay construction are explored.
ii

TABLE OF CONTENTS
CONTENTS
Abstract………………………………………………………………………….Disclaimer / Acknowledgements……………………………………………...List of Figures…………………………………………………………………...List of Tables……………………………………………………………………
Executive Summary…………………………………………………………….
Introduction……………………………………………………………………...Planning and Design…………………………………………………………...Preconstruction Conditions……………………………………………………
Interstate 80…………………………………………………………….Interstate 88…………………………………………………………….
Overlay Construction…………………………………………………………..Interstate 80…………………………………………………………….Interstate 88…………………………………………………………….
Performance…………………………………………………………………….Visual Distress Surveys……………………………………………….International Roughness Index……………………………………….Condition Rating Surveys……………………………………………..
Maintenance / Patching………………………………………………………..Project Costs……………………………………………………………………Traffic Factors…………………………………………………………………..Conclusions……………………………………………………………………..
Interstate 80…………………………………………………………….Interstate 88…………………………………………………………….
Recommendations……………………………………………………………..References………………………………………………………………………
Appendix A – Mixture Designs………………………………………………..Appendix B – Visual Distress Surveys……………………………………….
PAGE
iiivvvi
1
46121213151517202022242730323434353637
3841
DISCLAIMER
The contents of this paper reflect the views of the author who is responsible for the facts
and accuracy of the data presented herein. The contents do not necessarily reflect the
official views, or policies, of the Illinois Department of Transportation or the Federal
Highway Administration. This report does not constitute a standard, specification, or
regulation.
ACKNOWLEDGEMENTS
The author would like to gratefully acknowledge the assistance of Ms. LaDonna Rowden
for her work with the design and construction of both projects. Also, the assistance of
Ms. Tessa Volle for her help with the research and data collection work throughout the
project is greatly appreciated. In addition, the construction and operations personnel
from District 2 of the Illinois Department of Transportation are recognized for their
assistance with data collection. Finally, the author would like to acknowledge the
assistance of Ms. Laura Heckel, Mr. Matthew Mueller, and Ms. LaDonna Rowden for
their assistance in manuscript review.
iv

LIST OF FIGURES
Figure 1. Interstate 80 Bonded Concrete Overlay Test Sections…...
Figure 2. Interstate 88 Bonded Concrete Overlay Test Sections…...
Figure 3. Interstate 80 Before Rehabilitation………………………….
Figure 4. Partial-Depth Patch Reinforcement…………………………
Figure 5. Interstate 88 Before Rehabilitation………………………….
Figure 6. Microsilica Grout Application…………………………………
Figure 7. Experimental “Soff-Cut” Saw………………………………..
Figure 8. Interstate 88 After Cold Milling and Shot Blasting…………
Figure 9. Interstate 88 After Cold Milling and Shot Blasting
(Close-Up)……………………………………………………..
Figure 10. Interstate 88 Paving Process………………………………..
Figure 11. Interstate 80 High Severity Crack…………………………...
Figure 12. Interstate 80 High Severity Crack…………………………...
Figure 13. Interstate 80 Edge-Of-Pavement Punch-Out………………
Figure 14. Interstate 80 Average International Roughness Index……
Figure 15. Interstate 88 Average International Roughness Index……
Figure 16. Interstate 80 Condition Rating Survey………………………
Figure 17. Interstate 88 Condition Rating Survey………………………
Figure 18. Full-Depth CRC Patch………………………………………..
Figure 19. Partial-Depth Patch…………………………………………...
PAGE
10
11
12
13
14
15
16
17
18
19
21
21
21
23
23
25
25
28
28
v

8
LIST OF TABLES
Table 1. Interstate 80 and Interstate 88 Bonded Concrete
Overlays………………………………………………………..
Table 2. Interstate 80 Patching Quantities by Year………………….
Table 3. Interstate 80 Patching Quantities by Test Section………...
Table 4. Interstate 80 Construction and Maintenance Costs……….
Table 5. Interstate 88 Construction and Maintenance Costs……….
Table 6. Interstate 80 Traffic Conditions……………………………...
Table 7. Interstate 88 Traffic Conditions……………………………...
PAGE
9
27
29
30
30
32
32
vi

1
EXECUTIVE SUMMARY
The Illinois Department of Transportation constructed two bonded concrete overlays to
investigate alternatives to bituminous concrete overlays for the rehabilitation of existing
Portland cement concrete pavements. The first bonded concrete overlay was
constructed in the fall of 1994 and spring of 1995 on Interstate 80 near Moline. The
second overlay was constructed during the summer of 1996 on Interstate 88 near Erie.
The Interstate 80 overlay is four inches thick, while the Interstate 88 overlay is three
inches thick.
Design information was gathered from the American Association of State Highway and
Transportation Officials Guide for Design of Pavement Structures and the National
Cooperative Highway Research Program Synthesis of Highway Practice 99. Design
information, construction problems, and performance criteria from other states with
bonded concrete overlays were also considered. An overlay thickness of four inches
was selected for Interstate 80 based on design criteria and the condition of the existing
pavement. Three inches was selected as the overlay thickness for Interstate 88. This
project was initially considered for the Federal Highway Administration’s Long-Term
Pavement Performance program, which required a thickness of three inches, however it
was never included in the program.
Experimental research sections were incorporated into each of these projects. The
Interstate 80 overlay has six different experimental combinations of microsilica in the
concrete mixture and grout for a bonding agent. The experimental microsilica additions
were zero percent, three percent, and five percent by mass of total solids. Each of these
mixtures was placed in an area with, and without, microsilica grout used as a bonding
agent. The entire surface of the Interstate 80 project was prepared with shot blasting.
The Interstate 88 project included two experimental types of surface preparation for the
existing pavement. The eastbound lanes were cold milled and shot blasted, while the
westbound lanes were shot blasted only. No grout was used on the Interstate 88
project.
The necessary patching and surface preparation was completed on both projects prior to
the overlay placement. This included the removal of all foreign material such as paint,

2
tire residue and bituminous spot patches from the surface. Full-depth and partial-depth
patches were placed in areas with moderate to severe distress and in areas with
unsound surface material. Construction for both projects included slip-form paving of the
driving and passing lanes monolithically. The fresh concrete was dumped directly in
front of the paving machine on Interstate 80, while the Interstate 88 project incorporated
the use of a belt placer.
The initial construction cost for these bonded concrete overlays was nearly twice that of
a standard bituminous concrete overlay. However, the anticipated design life of the
bonded concrete overlays was nearly twice that of a bituminous concrete overlay.
Optimum performance from both types of overlays would produce an equivalent cost if
based on a life cycle cost.
The design traffic loading for the Interstate 80 and Interstate 88 projects were 19.5 and
13.1 million Equivalent Single-Axle Loads, respectively. These traffic volumes were
based on a 20-year design life. The actual total traffic loading for each of these routes,
to date, is slightly higher than the design projected total loading by 2002.
Performance of the bonded concrete overlay on Interstate 80 has been unsatisfactory.
Transverse cracking of medium to high severity appeared within three years after
construction. Patching contracts were awarded in 1998, 2000, and 2001 for the repair of
this project. Many of the concrete patches placed in 1998 and nearly all of the concrete
patches placed in 2000 were replaced in the subsequent patching contract due to poor
performance. These concrete patching contracts included a combination of both full-
depth and partial-depth patches. Based on the number and area of these patches, the
experimental sections with no microsilica additions have performed the best, followed by
those with three percent added and five percent added. In addition, the sections with
microsilica grout used as a bonding agent performed better than those without the grout
in two out of three cases. The margin of improvement of the grouted sections, however,
was minimal, which questions the benefit of using the grout as a bonding agent. The
International Roughness Index and Condition Rating Surveys for this project have shown
a steady decline in pavement performance.

3
The Interstate 88 project has displayed very good performance to date. There have
been no patching contracts awarded for this overlay. The International Roughness
Index and Condition Rating Surveys have shown consistently good pavement
performance since the time of construction.
In conclusion, the performance of the Interstate 80 bonded concrete overlay has been
unsatisfactory. The project has not been cost effective due to the amount of patching
required. The addition of microsilica to the concrete mixture did not prove to be
beneficial, and may have initiated some of the early age distress by producing a more
brittle concrete pavement. Also, the use of microsilica grout as a bonding agent did not
prove to be effective. The performance of the Interstate 88 project has been very good
to date. No patching or maintenance has been required.
Based on the observations of these two projects, the Illinois Department of
Transportation does not recommend bonded concrete overlays for high volume
interstates. If this type of rehabilitation is performed, it is recommended to focus
extreme attention on the condition of the existing pavement and the surface preparation
of that pavement. In addition, the use of microsilica as a concrete admixture and the use
of microsilica grout as a bonding agent are not recommended.

4
INTRODUCTION
A primary focus for the Illinois Department of Transportation (IDOT) is the rehabilitation
and maintenance of existing interstates, state highways, and local agency roadways.
Many of these facilities have surpassed their design lives and they are beginning to
deteriorate rapidly. Rising construction costs and tighter constraints on material
selection and construction practices have hindered the amount of rehabilitation that may
be accomplished each year.
The current IDOT policy for rehabilitation of interstate concrete pavements is a 3.25-inch
bituminous concrete overlay. Research indicates that this type of overlay will last
approximately 10 to 12 years on a pavement with no concrete D-cracking [1]. The
structural capacity, or ability of the pavement to carry traffic, is only slightly increased
with this type of rehabilitation. An alternative option is the Portland cement bonded
concrete overlay (BCO). The theoretical design life of the BCO is nearly twice that of a
bituminous concrete overlay, because the structural capacity is increased.
The bonded concrete overlay consists of placing a layer of Portland cement concrete
(PCC) directly on top of the existing PCC pavement. Any existing failed pavement joints,
cracks, and serious distresses should be patched before placement of the BCO. The
existing pavement surface should be textured by milling or abrasive blasting before the
overlay is placed. The existing pavement should also be free of all contamination such
as dirt, oil stains, paint markings, and tire marks. The overlay concrete will react with the
rough surface of the existing pavement to bond the two layers as one monolithic slab [2].
This new monolithic slab should hinder the deterioration of the existing pavement and
increase the structural capacity of the facility.
IDOT has experimented with two bonded concrete overlays. These overlays were both
plain concrete overlays of continuously reinforced concrete pavements. Experimentation
included concrete mixtures with various percentages of microsilica added, microsilica
grout as a bonding agent, and surface texturing. The constructibility and performance of
these projects were evaluated. Previous reports have covered the preliminary laboratory
research, construction and interim performance of these projects [2,3].

5
This report briefly covers the site selection, planning, and design for both of these
projects. In addition, the pre-construction requirements, construction practices, and
construction costs are reviewed. Finally, the performance over the last five years of
each project is evaluated through the use of visual distress surveys, maintenance
requirements, and traffic considerations. Performance was also monitored through the
International Roughness Index and Condition Rating Surveys.
Conclusions on the general performance of these two projects are included. Based on
these conclusions and the performance of each project, recommendations are made
concerning the construction of bonded concrete overlays.

6
PLANNING AND DESIGN
In 1992 and 1993, IDOT’s Bureau of Materials and Physical Research (BMPR) and
Pavement Review Team searched the interstate system for a section of pavement that
would be suitable for an experimental feature BCO rehabilitation. The desired pavement
criteria for the experimental section included each of the following:
Ø a thin pavement (7 – 8 inches thick),
Ø a continuously reinforced concrete pavement (CRCP),
Ø a bare concrete surface (no bituminous concrete overlay),
Ø minimal required surface preparation, and
Ø a section not currently in the state’s 5-year program for rehabilitation.
These criteria were set for several reasons. A thin pavement was desired in order to see
the increased serviceability of the new monolithic slab under increased traffic loadings.
A CRCP was desired to reduce the number of distresses and possible faulted joints that
might reflect through the BCO. Also, if a jointed pavement were selected, all of the joints
would have to be sawed into the BCO. Typically, a pavement that has a bituminous
concrete overlay would be too deteriorated for a BCO. In addition, the increased surface
preparation of milling the bituminous overlay is expensive. Finally, a section in the
state’s 5-year program for rehabilitation may be too deteriorated for a BCO.
In 1993, a portion of Interstate 80 was selected as the first project, and in 1994 a section
of Interstate 88 was selected as the second project. These pavement sections are both
located in the northwest portion of Illinois near the city of Moline. The selected section of
Interstate 80 is an 8-inch thick CRCP constructed on a 4-inch thick bituminous
aggregate mixture (BAM) subbase. Original construction was in 1965. The selected
section of Interstate 88 is also an 8-inch thick CRCP constructed on a 4-inch thick BAM
subbase. Original construction was in 1975.
The American Association of State Highway and Transportation Officials (AASHTO)
Guide for Design of Pavement Structures [4], and the National Cooperative Highway
Research Program (NCHRP) Synthesis of Highway Practice 99 [5] were the manuals

7
used for designing the thicknesses of these bonded concrete overlays. These methods
use the following equations.
AASHTO Design Procedure
Dol = Df - Deff [Equation 1]
where:
Dol = required thickness of the BCO
Df = future slab thickness determined from existing slab conditions,
future traffic projections, sub-structure support, sub-structure
drainage, serviceability loss, and design reliability
Deff = effective thickness of the existing slab determined from the
condition survey method
NCHRP Design Procedure
ho = hd – hb [Equation 2]
where:
ho = required thickness of the BCO
hd = required monolithic thickness of a concrete pavement for the
design loading (determined from regular concrete pavement
design analysis)
hb = thickness of the existing pavement
The design overlay thickness for Interstate 80 was 3.5 inches according to AASHTO and
2.0 inches according to the NCHRP design. Due to the existing pavement condition and
a desired factor of safety, a final thickness of 4.0 inches was selected.
The Interstate 88 designs were 2.0 inches according to AASHTO and 1.5 inches
according to NCHRP. This project was initially intended to be included in the Federal
Highway Administration’s Long Term Pavement Performance (LTPP) program as a
Specific Pavement Study 7 site. The requirements for inclusion in this study were to
study thickness (3.0 inches and 5.0 inches), bonding agents (neat grouts and no grout),
and surface preparation (cold milling, sand blasting, and shot blasting). The BMPR did
not want to pursue the study of bonding agents and thickness, and therefore the project

8
was rejected from the LTPP program. A final thickness of 3.0 inches was selected for
Interstate 88.
The Interstate 80 project was constructed as an experimental feature, which
incorporates additional federal funding for the experimentation of new materials and
construction practices. Therefore, this project includes experimental sections with three
different amounts of microsilica added to the concrete mix. In addition, microsilica grout
was used as a bonding agent between the existing pavement and the new concrete
overlay. A total of six experimental combinations, listed below, were incorporated into
both directions of the Interstate 80 overlay:
Ø no microsilica in the overlay mix with no bonding agent,
Ø no microsilica in the overlay mix with a microsilica grout bonding agent,
Ø 3% microsilica in the overlay mix with no bonding agent,
Ø 3% microsilica in the overlay mix with a microsilica grout bonding agent,
Ø 5% microsilica in the overlay mix with no bonding agent, and
Ø 5% microsilica in the overlay mix with a microsilica grout bonding agent.
Prior to construction, the BMPR conducted several laboratory experiments with the
addition of microsilica into concrete mixtures, and the use of grouts for bonding agents.
The goals of this investigation were to determine: 1) the difference in compressive
strengths for mixture designs with various percentages of microsilica, and 2) the bond
strengths for various types of bonding agents. Bond strengths were determined through
direct tensile and slant shear tests.
Concrete mixtures with 0 percent, 5 percent, and 8 percent microsilica were tested in the
laboratory. No significant differences were noted from the compressive strength testing
of these mixtures. Bond strength tests were performed with no grout, a plain grout, and
a microsilica grout. No significant differences were noted between the bond strength
testing of these various combinations. To fulfill the experimental feature’s project
requirements, field testing of concrete mixtures with microsilica and the various bonding
agents were tried on the Interstate 80 overlay. Figure 1 illustrates the project layout and
the locations of the experimental and research test sections. The mixture design for

9
each experimental section may be found in Appendix A. The laboratory testing is
discussed in detail in the 1996 construction report [2].
The Interstate 88 project incorporated two experimental sections. The eastbound lanes
were cold milled, followed by a light shot blasting, before the overlay was placed. The
westbound lanes were shot blasted only before the overlay placement. No grout was
used as a bonding agent for this project and no microsilica was added to the concrete
mixture. Figure 2 illustrates this project’s layout and the locations of the research test
sections. The mixture design for this project may also be found in Appendix A.
Table 1 summarizes the locations and paving dates for both projects.
Table 1
Interstate 80 and Interstate 88 Bonded Concrete Overlays
Marked
Route
Contract
Number
Direction Milepost
Limits
Paving
Dates
Eastbound 1.0 to 2.7 October 7 – October 13, 1994Interstate
8084815
Westbound 2.7 to 1.0 April 21 – April 28, 1995
Eastbound 13.3 to 16.4 April 18 – May 1, 1996Interstate
8884988
Westbound 16.4 to 13.3 June 4 – June 14, 1996

Interstate 80 Bonded Concrete Overlay Test Sections
Mississippi R
iver
Bridge
Bridge
I-88IL 5
AC OverlayWith Bridge
AC OverlayWith Bridge
IL 84IL 84
MS = Microsilica
Sta 89+25
Sta 88+15
Sta 100+00
Sta 100+00
Sta 110+00
Sta 110+00
Sta 120+00
Sta 120+00
Sta 155+00
Sta 155+00
Sta 165+00
Sta 177+75
Sta 177+75
Sta 165+00
WeighStation
WeighStation
1185' 1000' 1000' 3500' 1000' 1275'
1075' 1000' 1000' 3500' 1000' 1275'
WB
EB
5% MS WithMS Grout
5% MS WithMS Grout
3% MS With No Grout
3% MS With No Grout
3% MS WithMS Grout
3% MS WithMS Grout
5% MS With No Grout
5% MS With No Grout
No MS WithMS Grout
No MS With No Grout
No MS WithMS Grout
No MS With No Grout
500 ft. Test Sections
Figure 1
10

Rock Island C
ounty Line
945+70
1100+70
Cold Milling with Light Shot Blasting
1000 ft. Test Section
CH25
Sand R
oad
Sta 1060+00
Sta 1050+00
Sta 980+00
Sta 990+00
Sta 1025+00
Sta 1015+00
Sta 980+00
Sta 990+00
Sta 1025+00
Sta 1015+00
Sta 1060+00
Sta 1050+00
Shot Blasting
EB
WB WB
EB
Interstate 88 Bonded Concrete Overlay Test Sections
Figure 2
11

12
PRECONSTRUCTION CONDITIONS
INTERSTATE 80
The existing 8-inch CRC pavement on Interstate 80 was constructed in 1965. The
shoulders were 12-inch bituminous concrete and there were no underdrains placed
during original construction. The existing pavement displayed a frequent amount of
medium severity, transverse cracking and a significant amount of centerline distress
prior to the rehabilitation. Figure 3 illustrates a representative area of the Interstate 80
pavement before rehabilitation. Prior to placing the bonded concrete overlay, the
existing pavement was patched with full-depth and partial depth patches. In addition,
any bituminous patch material found on the surface was removed.
Figure 3Interstate 80 Before Rehabilitation
Full-depth patches were placed at areas with medium to high severity distresses.
Eleven patches were placed in the eastbound lanes and 28 were placed in the
westbound lanes. These patches were “Class A” patches, which included full-depth
pavement removal and CRCP replacement. The combined area of these patches was
1.23 percent of the total project roadway area.

13
One partial-depth patch was required in the eastbound direction and eight were required
in the westbound direction. These patches were placed over severe longitudinal cracks.
The existing surface was milled down to a depth of 2.5 inches by 36 inches wide. The
crack was reinforced with #5 tie bars placed at 90 degree angles to the crack on 30-inch
centers. These concrete patches were placed monolithically with the concrete overlay.
Figure 4 illustrates the placement of the reinforcement bars within a partial depth patch
area. The combined area of these patches was 0.28 percent of the total project roadway
area.
Figure 4Partial-Depth Patch Reinforcement
Any bituminous patching material found on the pavement surface was removed prior to
the overlay placement. Cold milling was used for any large areas, while jackhammers
were used to remove cold patch material from areas of spalling. The loose and unsound
concrete associated with these areas of distress was also removed. These areas were
filled monolithically with the concrete overlay.
INTERSTATE 88
The existing 8-inch CRC pavement on Interstate 88 was constructed in 1975. The
shoulders were 11-inch bituminous concrete and there were crushed stone french
drains placed with the original construction. The pavement displayed minor distress

14
prior to the overlay. Figure 5 is a typical view of this section prior to the overlay. Full-
depth and partial-depth patches were placed in the existing pavement before the overlay
was constructed.
Figure 5Interstate 88 Before Rehabilitation
Full-depth patches were placed at areas with medium to high severity distresses. Thirty
patches were placed between the eastbound and westbound lanes. These patches
were “Class A” patches, which included full-depth pavement removal and CRCP
replacement. The combined area of these patches was 0.55 percent of the total project
roadway area.
Eight partial-depth patches were required in the eastbound lanes and one was required
in the westbound direction. These patches were placed over longitudinal cracks, in the
same fashion as the partial-depth patches on the Interstate 80 project. The combined
area of these patches was 0.10 percent of the total project roadway area.
15
OVERLAY CONSTRUCTION
INTERSTATE 80
The existing pavement surface of Interstate 80 was shot blasted prior to overlay
placement. A 50/50 mix of S-390 and S-550 cast steel shot was used for this process.
The shot blasting removed approximately 0.125 inches of the pavement surface. Sand
blasting with wet bottom boiler slag was used in areas where the shot blaster could not
operate, including areas of distress and the pavement edge. The pavement surface was
thoroughly cleaned immediately before the overlay placement. Excess sand blasting
dust, tire residue, and oil drips were cleaned up to minimize areas of debonding.
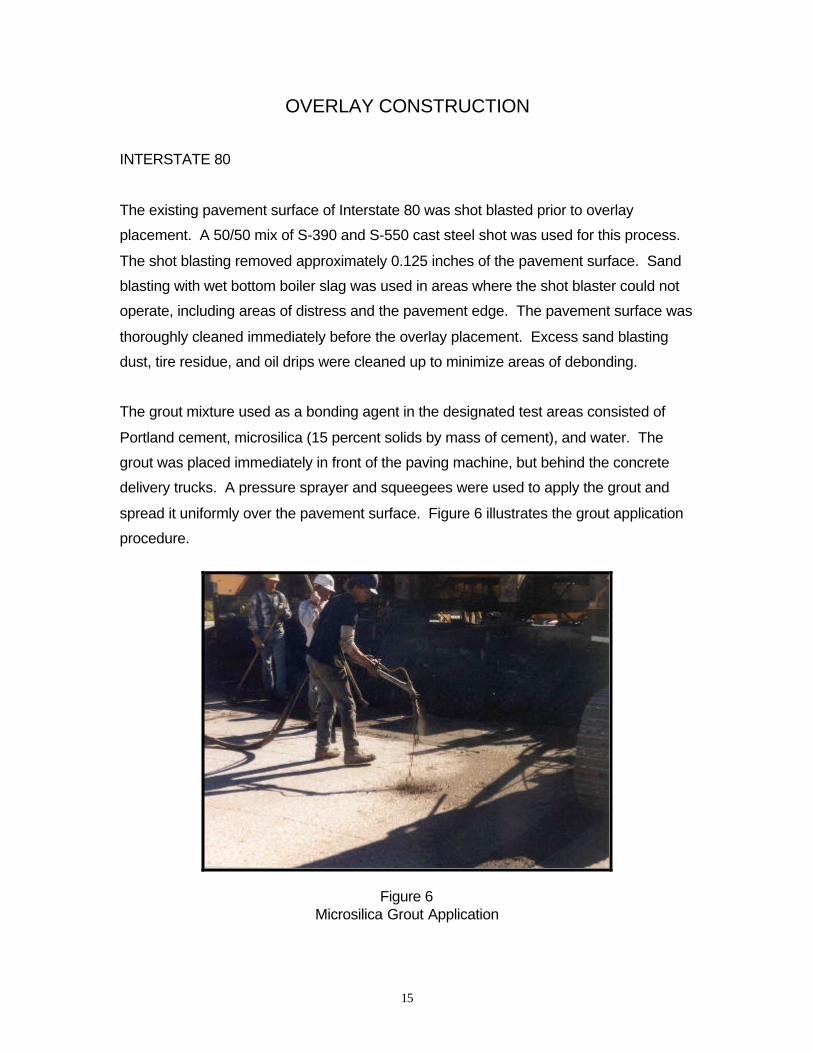
The grout mixture used as a bonding agent in the designated test areas consisted of
Portland cement, microsilica (15 percent solids by mass of cement), and water. The
grout was placed immediately in front of the paving machine, but behind the concrete
delivery trucks. A pressure sprayer and squeegees were used to apply the grout and
spread it uniformly over the pavement surface. Figure 6 illustrates the grout application
procedure.
Figure 6Microsilica Grout Application

16
The overlay was placed monolithically over both lanes with a slip-form paver guided by a
string line. The concrete was placed on the existing pavement directly in front of the
paving machine. The pavement was hand finished with bullfloats and trowels, followed
by a burlap drag for longitudinal texture. The finished pavement was also transversely
tined at a uniform spacing of 0.75 inch for additional texture. The final process was the
application of two coats of a white pigmented curing compound. Each application was at
the rate of 1.5 gallons per 250 square feet. This rate is slightly higher than for a
standard pavement to ensure moisture retention in the thin overlay.
The centerline joint was sawed with an experimental lightweight saw. This experimental
saw weighed less than 300 pounds, had an upward cutting diamond tip blade, and
maintained 2500 RPM while in operation. The experimental saw may be seen in
Figure 7. The intent was to saw this joint within two hours of the concrete placement;
however, the cool weather and excess curing compound prevented this. In order to
remedy this problem, the amount of curing compound was reduced to one application at
the rate of 1.5 gallons per 250 square feet. In addition, the rate was also reduced at the
centerline after the first day’s paving.
Figure 7Experimental “Soff-Cut” Saw

17
INTERSTATE 88
The eastbound lanes of Interstate 88 were cold milled and shot blasted prior to the
overlay placement. The cold milling operation involved removing the top 0.25 inch of the
existing pavement. Once milling was completed, the surface was lightly shot blasted to
remove any loose particles and foreign matter. Figures 8 and 9 illustrate the surface
texture resulting from this procedure. The westbound lanes of this project were shot
blasted only. The shot blasting was intended to expose the coarse aggregate and
provide a rough surface texture to increase the bond of the overlay. The cold milling and
shot blasting combination proved to be a better method of preparing the existing
pavement than shot blasting alone. The milled pavement could easily be inspected for
complete removal of the surface and the resulting texture was rougher, allowing more
surface area for the overlay bond. The westbound lanes, with shot blasting alone,
resulted in inspection problems and concerns over the complete removal of the existing
surface.
Figure 8Interstate 88 After Cold Milling And Shot Blasting

18
Figure 9Interstate 88 After Cold Milling And Shot Blasting (Close-Up)
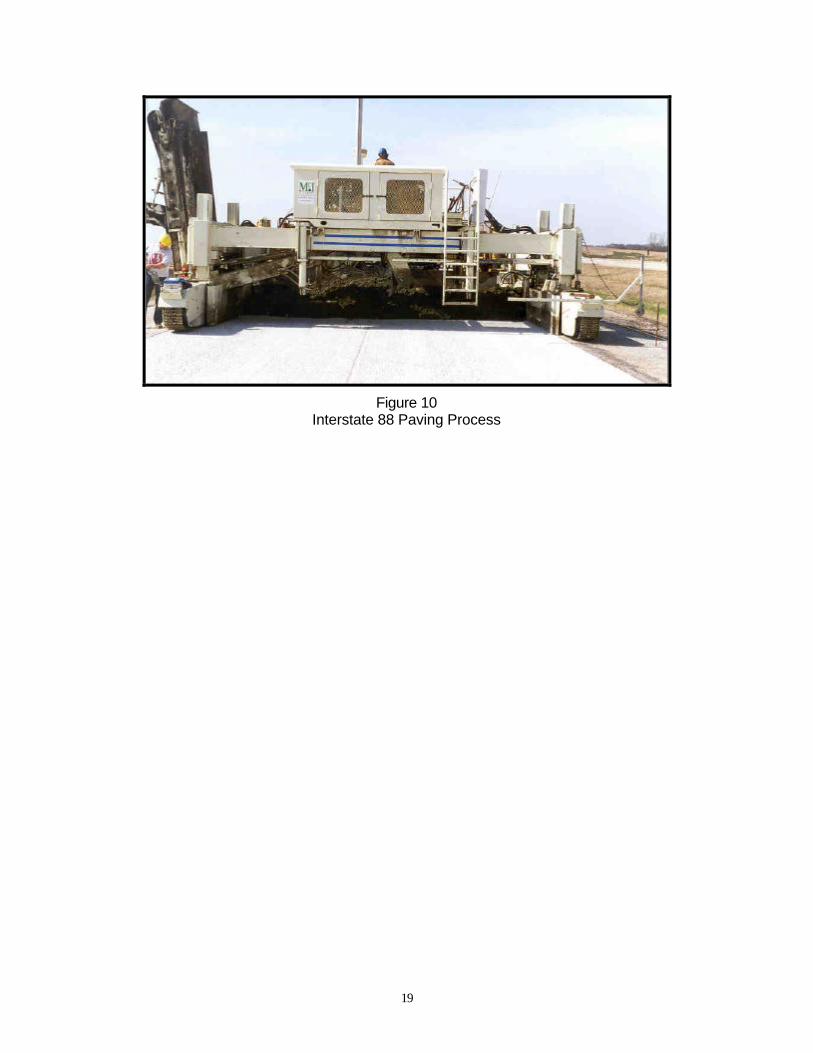
The concrete overlay was placed monolithically over both lanes using a slip-form paver
with stringline guides. The concrete was fed to the paving machine by the use of a belt
placer. Figure 10 illustrates the paving process. This process eliminated the
contamination of the existing pavement, as the shoulder was used for a haul road.
However, the belt placer tended to segregate the mix between lanes, placing more
coarse material in the driving lane and fine material in the passing lane. The pavement
was hand finished followed by a burlap drag for longitudinal texture. The finished
pavement was transversely tined at a uniform tine spacing of 0.75 inch. The final
process was the application of two coats of a white pigmented curing compound at the
rate of 1.5 gallons per 250 square feet per application. The centerline joint was sawed
with a standard concrete saw on this project, with the operation beginning 3 to 4 hours
after the overlay was placed.
19
Figure 10Interstate 88 Paving Process

20
PERFORMANCE
VISUAL DISTRESS SURVEYS
Research test sections for each of the various design criteria were identified for both the
Interstate 80 and 88 projects. The project layout maps in the Planning and Design
section of this report, on pages 10 and 11, show the locations for each test section.
Visual surveys of these test sections were taken before construction and on an annual
basis after construction. The most recent distress surveys (Spring 2001) may be found
in Appendix B. The distresses that are noted in these surveys are only those which are
considered medium to high in severity according to the “Distress Identification Manual
for the Long-Term Pavement Performance Project [6].” This manual is used by the
BMPR as a basis for evaluating the condition of research pavements.
The Interstate 80 BCO contains two test sections for each of the six different
experimental areas. One test section was placed in each of the traveling directions, for
a total of 12 test sections. Each test section is 500 feet long and is used for the visual
distress survey. The Interstate 88 project contains three test sections within each of the
two different experimental areas for a total of six test sections. Each test section is
1,000 feet long and was also used for the visual distress survey.
The pre-construction surveys of the Interstate 80 project indicated that the eastbound
and westbound lanes were in the same condition prior to the overlay. The eastbound
lanes exhibited a common occurrence of working transverse cracks in all sections.
There was a significant amount of centerline popouts and spalling in all sections except
the area of “no microsilica with no grout.” The westbound lanes displayed a common
occurrence of working transverse cracks throughout all the experimental sections. The
westbound lanes also had a significant amount of the centerline spalling and popouts.
The post-construction distress surveys of the Interstate 80 project indicated that the
eastbound lanes have deteriorated more rapidly than the westbound lanes. A large
number of working, low severity, transverse cracks were found in the eastbound lanes
within two years after construction. The three year survey indicated that many of these
cracks had propagated into medium and high severity cracks. Examples of this type of

21
distress may be found in Figures 11 and 12. Eventually, these cracks developed into
areas of edge-of-pavement punch-outs and centerline spalling. An example of this may
be found in Figure 13. The eastbound lanes continue to deteriorate at an increasing
rate.
Figure 11 Figure 12 Interstate 80 High Severity Crack Interstate 80 High Severity Crack
Figure 13Interstate 80 Edge-Of-Pavement Punch-Out

22
The westbound lanes initially deteriorated at a slower rate than the eastbound lanes.
Working transverse cracks were noted within the first two years of the overlay’s life. By
2000 and 2001, however, the number of distresses and working cracks had dramatically
increased to match the performance of the eastbound lanes.
Patching was completed in both directions of Interstate 80 in 1998, 2000, and 2001, and
is discussed in detail in the Maintenance / Patching section of this report.
The pre-construction surveys of the Interstate 88 project indicated that both directions
were in very good condition prior to the overlay. Each direction contained a few low
severity cracks and one to two small punchout areas. There was no centerline distress
noted on this project, as compared to the Interstate 80 project.
The post-construction surveys for Interstate 88 have indicated little to no significant
distress in either direction. The three test sections within the cold milling with light shot
blasting area (eastbound lanes) have a few working cracks of low to medium severity.
The three test sections within the shot blasting only area (westbound lanes) have only
three to four working cracks per 1,000-foot test section. There have been no patches
placed within this project to date. The overall visual performance of this project has
been very good.
INTERNATIONAL ROUGHNESS INDEX
The International Roughness Index (IRI) is an indication of the deviation of a given
pavement surface from an ideal smooth pavement [7]. This value is measured in inches
per mile, with higher IRI values indicating increased pavement roughness. However,
there is no rating system or scale used with the IRI data to indicate ranges for smooth or
rough pavements. The statewide data are collected using video inspection vehicles and
sorted into four equal groups from smoothest to roughest pavements. An average of all
the data is found, and comparisons to this statewide average may be used. The graphs
in Figures 14 and 15 indicate the average IRI values for both the Interstate 80 and 88
projects. The data have been separated for the eastbound and westbound directions,
and the statewide average has been included for comparison.

23
Figure 14
Interstate 80 Average International Roughness Index
Figure 15Interstate 88 Average International Roughness Index
Interstate 80 Average International Roughness Index
020406080
100120140160180
1994 1995 1996 1997 1998 1999 2000 2001
Year of Testing
IRI
Eastbound Westbound State Average
Interstate 88 Average International Roughness Index
0
20
40
60
80
100
120
140
160
1995 1996 1997 1998 1999 2000 2001
Year of Testing
IRI
Eastbound Westbound State Average

24
The data for the Interstate 80 project indicate that the BCO dramatically improved the
pavement smoothness in the eastbound direction, while only slightly improving the
westbound direction. By 1997, both directions were rougher and comparable to the level
of the statewide average. The patching completed in 1998 improved the pavement
smoothness in both directions. The patching and maintenance that has been completed
since 1998 has had little effect on the IRI in either direction. The IRI values for the
eastbound lanes are increasing rapidly (from 82 to 134 over the last four years), while
the westbound lanes have only increased from 70 to 87 over the same four years.
The IRI data for the Interstate 88 project indicates a much smoother pavement as a
result of the bonded concrete overlay. The existing pavement prior to construction was
much rougher than the statewide average. The IRI trend of this overlay has been very
consistent since the time of construction, with nearly a constant value for both directions
over the last six years.
CONDITION RATING SURVEYS
IDOT conducts a Condition Rating Survey (CRS) on interstate pavements on a biennial
basis. The video inspection vehicles videotape the pavement surface and collect sensor
data including IRI, rutting, and faulting. This video is viewed at a processing workstation
to determine the predominant pavement distresses. A computerized mathematical
model is then used to develop a CRS value based on the sensor data and the type,
severity, and extent of the pavement distresses. The CRS values for the bonded
concrete overlay projects may be found in Figures 16 and 17. The following scale is
used to categorize the current condition of the pavement [8].
CRS Range Category
1.0 to 4.5 Poor
4.6 to 6.0 Fair
6.1 to 7.5 Good
7.6 to 9.0 Excellent
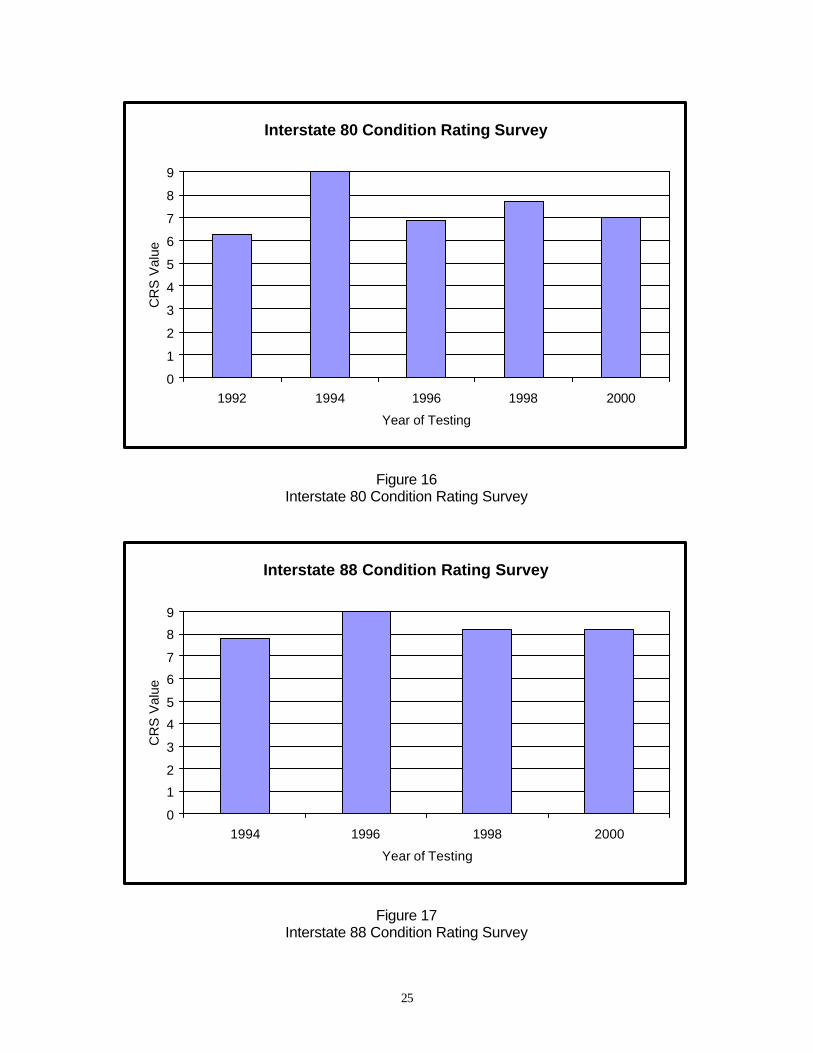
25
Figure 16Interstate 80 Condition Rating Survey
Figure 17Interstate 88 Condition Rating Survey
Interstate 80 Condition Rating Survey
0
1
2
3
4
5
6
7
8
9
1992 1994 1996 1998 2000
Year of Testing
CR
S V
alue
Interstate 88 Condition Rating Survey
0
1
2
3
4
5
6
7
8
9
1994 1996 1998 2000
Year of Testing
CR
S V
alue

26
The pre-overlay CRS value for Interstate 80 had fallen to a 6.3 value. This is still within
the “good” category; however, a section of interstate that falls below a rating of 6.5
typically is scheduled for rehabilitation. Due to the construction of the overlay in 1994
and 1995, the 1994 CRS value was set at 9.0. The CRS value quickly fell back into the
“good” category with a 6.9 by 1996 and only improved to a 7.7 with the patching contract
in 1998. In spite of the patching contract in 2000, the CRS value was determined to be
7.0.
The Interstate 88 pre-overlay CRS value was determined to be 7.8, which falls within the
“excellent” category. Construction of the overlay in 1995 improved the value to 9.0 for
1996. The CRS value fell to 8.2 in 1998 and has remained there through the 2000
rating. This value is still well within the “excellent” category, indicating minimal
distresses and good sensor data from the video inspection vehicles.

27
MAINTENANCE / PATCHING
Three PCC patching contracts have been awarded for the Interstate 80 BCO since
construction in 1994 and 1995. The amount, and cost, of patching has increased for
each of the three contracts in 1998, 2000, and 2001. Table 2 below indicates the
amount of full-depth and partial-depth patching that was completed in each direction for
the three patching contracts. The values given in this table include the driving and
passing lanes. In addition, the percentage of the total project area patched by direction
has been included.
Table 2
Interstate 80 Patching Quantities by Year
Year/
Direction
Number of
Full-Depth
Patches
Area of
Full-Depth
Patches (yd2)
Number of
Partial-Depth
Patches
Area of
Partial-Depth
Patches (yd2)
Percent of
Total Area
Patched
1998
Eastbound 33 915.9 3 182.8 4.7
Westbound 0 0.0 2 16.7 0.1
2000
Eastbound 11 96.5 85 969.6 4.5
Westbound 8 71.2 50 417.5 2.0
2001
Eastbound 2 16.4 151 1084.7 4.7
Westbound 2 26.6 44 321.7 1.5
The decision to use a full-depth or partial-depth patch was based on a visual survey and
sounding of the pavement around a crack. Working cracks that developed into edge-of-
pavement punchouts were rehabilitated with a full-depth patch. All moderate to severe
transverse cracks were rehabilitated with a partial-depth patch. The size of the partial-
depth patches was determined by sounding the pavement around the crack to determine
the area of delamination. In some cases, a partial-depth patch was converted to a full-
depth patch once the original pavement was exposed and the condition was rated.

28
A full-depth patch included replacement of the CRC pavement and the overlay as one
monolithic patch. The CRC reinforcement was replaced in the original pavement;
however, there was no reinforcement added to the concrete overlay. Partial-depth
patches included replacement of the overlay only. The existing overlay was removed in
these areas, and the original surface was cleaned and sand blasted for texture. Figures
18 and 19 illustrate a full-depth and partial-depth patch, respectively.
Figure 18Full-Depth CRC Patch
Figure 19Partial-Depth Patch

29
Table 3 indicates the amount of patching that has been required for each of the test
sections. The values given in Table 3 are a combination of all three patching contracts
and a combination of the eastbound and westbound test sections. The values only
indicate patches within the test sections and not the entire experimental section, so that
all sections may be compared on an equal area basis. All patches that fell within the
boundaries of a previous patch were counted separately and added to the total area
patched.
Table 3
Interstate 80 Patching Quantities by Test Section
Test Section Number of
Full-Depth
Patches
Area of
Full-Depth
Patches (yd2)
Number of
Partial-Depth
Patches
Area of
Partial-Depth
Patches (yd2)
Percent of
Total Area
Patched
0% MS no MSG 0 0.0 14 86.9 3.3
0% MS w/ MSG 2 25.0 9 52.5 2.9
3% MS no MSG 1 6.1 19 119.6 4.7
3% MS w/ MSG 4 32.7 14 122.9 5.8
5% MS no MSG 4 149.2 41 486.6 23.8
5% MS w/ MSG 4 37.5 16 88.6 4.7
Note: MS = Microsilica, and MSG = Microsilica grout
Evidence from Table 3 indicates that the test sections with no microsilica additive in the
concrete mixture have performed better than those with the microsilica additive. It also
appears that the use of microsilica grout was effective in two out of three cases when
compared to those test sections without the microsilica grout.

30
PROJECT COSTS
The initial cost of constructing a bonded concrete overlay is much higher than a standard
bituminous concrete overlay. However, based upon pre-construction estimates of the
total life cycle cost over 20 years, the two are similar. The pre-construction expected life
for both BCO projects was 20 years, whereas the average expected life for a bituminous
overlay in Illinois is approximately 10 years. Tables 4 and 5 depict the construction
costs for each of the BCOs constructed, as well as the costs that have been incurred
since construction. Items included in these tables are only those that affect the traveling
lanes.
Table 4
Interstate 80 Construction and Maintenance Costs
Pay Item Units Quantity Total Cost
Patching (Existing Pavement) Sq. Yd. 580 $65,130.00
Concrete Pavement Scarification Sq. Yd. 51,801 $108,782.10
Bonded PCC Overlay 4 inches Sq. Yd. 51,801 $732,984.15
Average Construction Cost Per Two-Lane Mile $266,891.19
Maintenance Patching 1998 Sq. Yd. 1,116 $103,705.30
Maintenance Patching 2000 Sq. Yd. 1,555 $133,272.15
Maintenance Patching 2001 Sq. Yd. 1,449 $767,888.95
Total Cost To Date $1,911,762.65
Table 5
Interstate 88 Construction and Maintenance Costs
Pay Item Units Quantity Total Cost
Patching (Existing Pavement) Sq. Yd. 561 $64,616.70
Concrete Pavement Scarification Sq. Yd. 86,274 $258,822.00
Bonded PCC Overlay 3 inches Sq. Yd. 86,274 $979,209.90
Average Construction Cost Per Two-Lane Mile $210,104.61
Total Cost To Date $1,302,648.60

31
The average cost of construction for these projects was $235,000 per two-lane mile.
The average construction cost for a 3.25-inch bituminous concrete overlay during the
same time period would have been $115,000 per two-lane mile (the same pre-overlay
patching being completed). The additional expense for patching on Interstate 80 has
made this project a very costly venture for the Department. At this time, it appears that
the Interstate 80 project will not survive for 20 years without a major rehabilitation
project. However, the Interstate 88 project has proven effective to date with regard to
initial expense and maintenance requirements. This project may prove to be cost
effective.

32
TRAFFIC FACTORS
The traffic conditions on Interstate 80 and Interstate 88 should be considered when
comparing the performance of these two projects. Tables 6 and 7 below indicate the
traffic conditions for each route, respectively. The percent trucks column includes both
single unit and multiple unit truck types.
Table 6
Interstate 80 Traffic Conditions
YearAverage Annual Daily
Traffic (AADT)
Percent
Trucks
ESALs
(million)
Cumulative
Design Lane
ESALs (million)
1995 19,200 28.4 1.44 1.44
1996 19,975 29.5 1.55 2.99
1997 21,300 30.5 1.73 4.71
1998 23,050 31.2 1.96 6.67
1999 25,400 31.5 2.25 8.92
2000 28,350 32.1 2.60 11.52
2001 31,800 32.2 3.01 14.53
Table 7
Interstate 88 Traffic Conditions
YearAverage Annual Daily
Traffic (AADT)
Percent
Trucks
ESALs
(million)
Cumulative
Design Lane
ESALs (million)
1996 10,250 26.3 0.76 0.76
1997 10,800 26.4 0.81 1.57
1998 11,100 26.6 0.84 2.40
1999 11,300 27.0 0.86 3.27
2000 11,500 27.0 0.87 4.14
2001 11,650 26.9 0.89 5.03

33
The average annual daily traffic for Interstate 80 is twice that of Interstate 88. In
addition, the traffic volume on Interstate 80 is increasing at a faster rate than the volume
on Interstate 88. The percent of heavy truck traffic is also higher for Interstate 80. The
higher traffic volume and percent heavy trucks on Interstate 80 have resulted in a higher
ESAL count for Interstate 80 as well.
The actual traffic volumes are higher than the design projected traffic volumes for each
of these interstates. The 2002 design projected traffic volume (AADT) for Interstate 80 is
21,100 vehicles, while the actual traffic volume for 2001 was 31,800 vehicles. The 2005
design projected traffic volume (AADT) for Interstate 88 is 11,700 vehicles, while the
actual traffic volume for 2001 was already 11,650.
The actual percent trucks is much higher than the design projected percent trucks for
both interstates. The 2002 design projected percent trucks for Interstate 80 is 17.5
percent, while the actual percent in 2001 was 32.2 percent. The 2005 design projected
percent trucks for Interstate 88 is 20.9 percent, while the actual percent in 2001 was
26.9 percent.

34
CONCLUSIONS
Two bonded concrete overlay (BCO) projects were constructed in Illinois to investigate
the potential of this type of rehabilitation for interstate pavements. These projects were
located on Interstates 80 and 88 in the northwest section of the state, near the city of
Moline. The Interstate 80 project (4-inch overlay) was constructed in the fall of 1994 and
spring of 1995. The Interstate 88 project (3-inch overlay) was constructed during the
summer of 1996. Both projects were built upon continuously reinforced concrete
pavement that was in good to excellent condition.
Performance has been variable to date. Increased performance of the bonded concrete
overlay may be insured through rehabilitation and maintenance before the pavement is
severely distressed. This may occur several years before other rehabilitation options are
considered. This should be considered when selecting a bonded concrete overlay as a
rehabilitation technique.
INTERSTATE 80
The Interstate 80 project incorporated six different experimental sections. The purpose
of these sections was to investigate the effects of adding various amounts of microsilica
to the overlay concrete mixture. These sections were also used to investigate the
effects of using grout to enhance the bond between the overlay and the existing
pavement. All six sections were constructed in each direction so that each section
would have a comparative section in the opposite direction.
Evidence from visual distress surveys and patching quantities indicate that the sections
with no microsilica added to the concrete mixture have performed the best. In addition,
the test sections with three percent microsilica added performed much better than those
with five percent added. The addition of microsilica was shown to increase the amount
of medium to high severity transverse cracking at an early age.
The application of grouts as a bonding agent proved to be very difficult and time
consuming. Problems were encountered with applying a uniform layer of grout and with
placing the concrete before the grout dried out and set-up. Visual surveys and

35
pavement performance have shown that the areas with grout did not show a substantial
improvement over the areas with no grout application.
The International Roughness Index values indicate that the overlay did improve the
smoothness of this section. However, with the early distresses and cracking, the IRI
values quickly increased. The patching contract in 1998 improved the IRI values
considerably, but they quickly began to increase again. The patching contracts in 2000
and 2001 have had little effect on the IRI value.
The Condition Rating Survey value for this section was also improved, however it quickly
decreased after the overlay placement. The patching contracts in 1998 and 2000 have
only slightly improved the CRS rating for this section.
INTERSTATE 88
The cold milling and shot blasting techniques used on Interstate 88 were shown to
perform very well based on visual surveys and maintenance requirements of the BCO.
At this time, there is no clear evidence as to whether the eastbound lanes (cold milling
with shot blasting) or westbound lanes (shot blasting only) are performing better. No
patching or maintenance has been required on this bonded concrete overlay.
The International Roughness Index values indicate that the overlay has dramatically
improved the smoothness of this section. The IRI values also indicate that this same
level of smoothness has been maintained for the life of the overlay.
The Condition Rating Survey values also indicate that the overlay has improved the
condition of this section based on pavement distresses. A high CRS value has been
maintained for the life of this overlay.

36
RECOMMENDATIONS
1. It is recommended to place these overlays on pavements with very few major
distresses or areas that require patching (CRS Rating of 7.0 or better).
2. Cold milling and shot blasting of the existing pavement surface for texture is
recommended.
3. The addition of microsilica to the overlay concrete mixture is not recommended.
4. The use of grout as a bonding agent is not recommended.
5. Late season construction is not recommended.
6. If considering a bonded concrete overlay, pavement designers should understand
that existing pavements qualifying for this rehabilitation should not require major
repairs for several years. This should be considered in an economic analysis when
comparing rehabilitation alternatives.
7. Following the above recommendations does not guarantee a successful project.
Extreme caution is urged if considering a bonded concrete overlay.

37
REFERENCES
1. Vespa, J. W., K. T. Hall, M. I. Darter, and J. P. Hall, “Performance of Resurfacing ofJRCP and CRCP on the Illinois Interstate Highway System,” University of Illinois andIllinois Department of Transportation, Report No. FHWA-IL-UI-229, June, 1990.
2. Rowden, L. R., “Thin Bonded Concrete Overlay and Bonding Agents,” IllinoisDepartment of Transportation, Bureau of Materials and Physical Research, PhysicalResearch Report No. 123, 1996.
3. Volle, T.H., “Performance of Thin Bonded Concrete Overlays in Illinois,” IllinoisDepartment of Transportation, Bureau of Materials and Physical Research, PhysicalResearch Report No. 134, 2000.
4. American Association of State Highway and Transportation Officials, AASHTO Guidefor Design of Pavement Structures, American Association of State Highway andTransportation Officials, Washington, D. C., 1993.
5. National Cooperative Highway Research Program, Synthesis of Highway Practice99, Transportation Research Board, Washington, D. C., 1982.
6. Strategic Highway Research Program, “Distress Identification Manual for the Long-Term Pavement Performance Project, Strategic Highway Research Program,Publication No. SHRP-P-338, Washington, D. C., 1993.
7. Illinois Department of Transportation, 2000 Interstate Surface Quality – An Analysisof International Roughness Index and Rut Depths on Illinois Interstate PavementsIncluding Tollways, Illinois Department of Transportation, Springfield, Illinois,March, 2001.
8. Illinois Department of Transportation, 1999 Illinois Condition Rating Survey, IllinoisDepartment of Transportation, Springfield, Illinois.

38
Appendix
A
Mixture Designs

39
Interstate 80 Bonded Concrete OverlayMixture Designs(2)
0% Microsilica PCC Design Mixturea
Material Type Producer Name Theoretical Weight, lbs (kg)Cement Type I Dixon - Marquette 430 (195)Fly Ash Type C National Minerals (Portage # 2) 135 (61)Water 247 (112)Sand Natural Moline Consumers (Cordova) 1,145 (519)Stone Crushed Moline Consumers (Midway) 1,925 (873)
Total Weight of Mix 3,882 (1,761)
Water / Cementitious Ratio = 0.44Unit Weight of Mixture = 143.8 lb/ft3 (2,303.5 kg/m3)
3% Microsilica PCC Design Mixturea,b
Material Type Producer Name Theoretical Weight, lbs (kg)
Cement Type I Dixon - Marquette 430 (195)Fly Ash Type C National Minerals (Portage # 2) 135 (61)
Microsilica Slurry W. R. Grace 17 (8)Water 230 (104)Sand Natural Moline Consumers (Cordova) 1,172 (532)Stone Crushed Moline Consumers (Midway) 1,925 (873)
Total Weight of Mix 3,909 (1,773)
Water / Cementitious Ratio = 0.40Unit Weight of Mixture = 144.8 lb/ft3 (2,319.5 kg/m3)
5% Microsilica PCC Design Mixturea,b
Material Type Producer Name Theoretical Weight, lbs (kg)
Cement Type I Dixon - Marquette 430 (195)Fly Ash Type C National Minerals (Portage # 2) 135 (61)
Microsilica Slurry W. R. Grace 30 (14)Water 230 (104)Sand Natural Moline Consumers (Cordova) 1,156 (524)Stone Crushed Moline Consumers (Midway) 1,925 (873)
Total Weight of Mix 3,906 (1,772)
Water / Cementitious Ratio = 0.39Unit Weight of Mixture = 144.7 lb/ft3 (2,317.9 kg/m3)

40
Interstate 88 Bonded Concrete OverlayMixture Designa
Material Type Producer Name Theoretical Weight, lbs (kg)Cement Type I Dixon – Marquett 430 (195)Fly Ash Type C American (Louisa) 135 (61)Water 221 (100)Sand Natural Moline Consumers (Cordova) 1,217 (552)Stone Crushed Moline Consumers (Cleveland) 1,939 (880)
Total Weight of Mix 3,942 (1,788)
Water / Cementitious Ratio = 0.39Unit Weight of Mixture = 146.0 lb/ft3 (2,338.7 kg/m3)
a All mixture designs used water reducing admixture and 6.5% air. Coarse aggregate had a top size of ¾ inch. All aggregates were assumed to be saturated surface dry.b Mixture designs with microsilica also incorporated super plasticizer contained in the slurry.

41
Appendix
B
2001 Visual Distress Surveys

Interstate 80 Experimental Bonded Concrete Overlay0% Microsilica With Microsilica Grout
Eastbound Lanes
Westbound Lanes
0' 100'
200'
300'
400'
500'
0'
300'
100'
400'
200'
500'
PatchLocation
DL
PL
DL
PL
DL
PL
DL
PL
Indicates a crack ofmedium to high severity
Not to ScalePL = Passing LaneDL = Driving Lane
42

Interstate 80 Experimental Bonded Concrete Overlay0% Microsilica With No Microsilica Grout
Eastbound Lanes
Westbound Lanes
0' 100'
200'
300'
400'
500'
0'
300'
100'
400'
200'
500'
PatchLocation
Indicates a crack ofmedium to high severity
DL
PL
DL
PL
DL
PL
DL
PL
Not to ScalePL = Passing LaneDL = Driving Lane
43
Interstate 80 Experimental Bonded Concrete Overlay3% Microsilica With Microsilica Grout
Eastbound Lanes
Westbound Lanes
0' 100'
200'
300'
400'
500'
0'
300'
100'
400'
200'
500'
PatchLocation
DL
PL
DL
PL
DL
PL
DL
PL
Indicates a crack ofmedium to high severity
Not to ScalePL = Passing LaneDL = Driving Lane
44

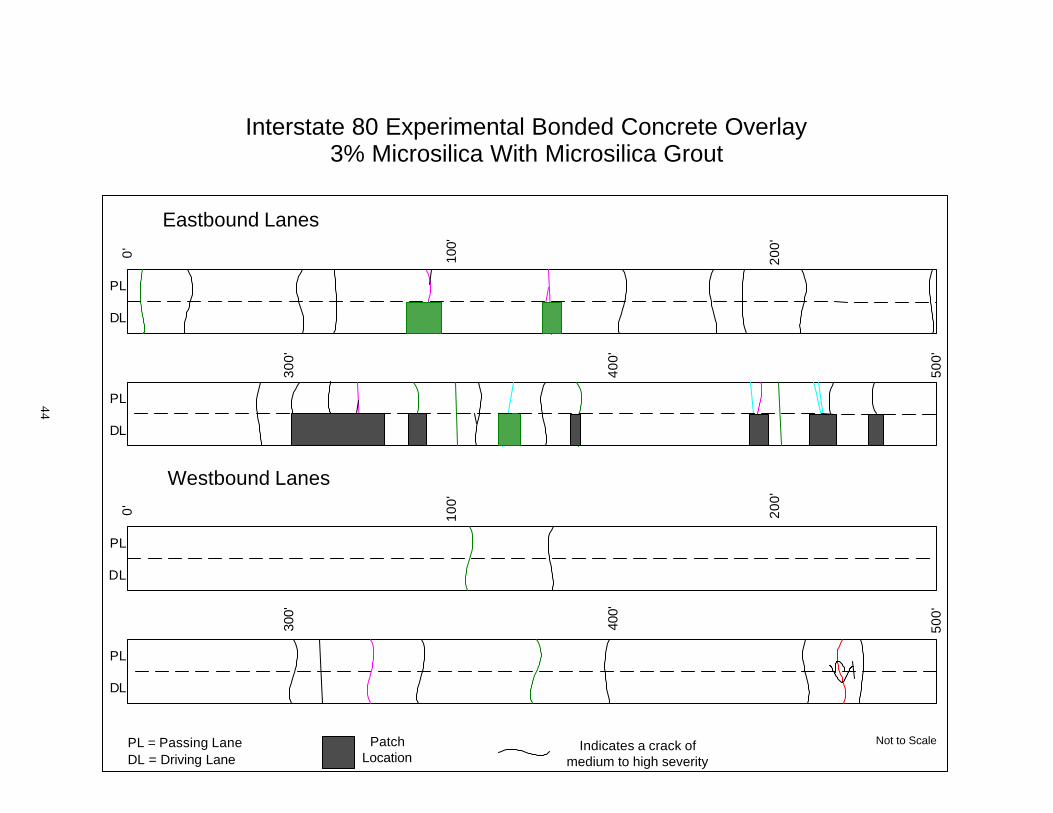
Interstate 80 Experimental Bonded Concrete Overlay3% Microsilica With No Microsilica Grout
Eastbound Lanes
Westbound Lanes
0' 100'
200'
300'
400'
500'
0'
300'
100'
400'
200'
500'
PatchLocation
DL
PL
DL
PL
DL
PL
DL
PL
Indicates a crack ofmedium to high severity
Not to ScalePL = Passing LaneDL = Driving Lane
45

Interstate 80 Experimental Bonded Concrete Overlay5% Microsilica With Microsilica Grout
Eastbound Lanes
Westbound Lanes
0' 100'
200'
300'
400'
500'
0'
300'
100'
400'
200'
500'
PatchLocation
Indicates a crack ofmedium to high severity
DL
PL
DL
PL
DL
PL
DL
PL
Not to ScalePL = Passing LaneDL = Driving Lane
46

Interstate 80 Experimental Bonded Concrete Overlay5% Microsilica With No Microsilica Grout
Eastbound Lanes
Westbound Lanes
0' 100'
200'
300'
400'
500'
0'
300'
100'
400'
200'
500'
PatchLocation
PL
DL
PL
DL
PL
DL
PL
DL
Indicates a crack ofmedium to high severity
Not to ScalePL = Passing LaneDL = Driving Lane
47

Interstate 88 Experimental Bonded Concrete OverlayCold Milling With Light Shot Blasting (Section 1)
Eastbound Lanes
0' 100'
200'
300'
400'
500'
500'
800'
600'
900'
700'
1,00
0'
PatchLocation
DL
PL
DL
PL
DL
PL
DL
PL
Indicates a crack ofmedium to high severity
Not to ScalePL = Passing LaneDL = Driving Lane
48

Interstate 88 Experimental Bonded Concrete OverlayShot Blasting (Section 1)
Shot Blasting
Westbound Lanes
0' 100'
200'
300'
400'
500'
500'
800'
600'
900'
700'
1,00
0'
PatchLocation
DL
PL
DL
PL
DL
PL
DL
PL
Indicates a crack ofmedium to high severity
Not to ScalePL = Passing LaneDL = Driving Lane
49

Interstate 88 Experimental Bonded Concrete OverlayCold Milling With Light Shot Blasting (Section 2)
Eastbound Lanes
0' 100'
200'
300'
400'
500'
500'
800'
600'
900'
700'
1,00
0'
PatchLocation
DL
PL
DL
PL
DL
PL
DL
PL
Indicates a crack ofmedium to high severity
Not to ScalePL = Passing LaneDL = Driving Lane
50

Interstate 88 Experimental Bonded Concrete OverlayShot Blasting (Section 2)
Westbound Lanes
0' 100'
200'
300'
400'
500'
500'
800'
600'
900'
700'
1,00
0'
PatchLocation
DL
PL
DL
PL
DL
PL
DL
PL
Indicates a crack ofmedium to high severity
Not to ScalePL = Passing LaneDL = Driving Lane
51

Interstate 88 Experimental Bonded Concrete OverlayCold Milling With Light Shot Blasting (Section 3)
Cold Milling With Light Shot Blasting
Eastbound Lanes
0' 100'
200'
300'
400'
500'
500'
800'
600'
900'
700'
1,00
0'
PatchLocation
DL
PL
DL
PL
DL
PL
DL
PL
Indicates a crack ofmedium to high severity
Not to ScalePL = Passing LaneDL = Driving Lane
52

Interstate 88 Experimental Bonded Concrete OverlayShot Blasting (Section 3)
Westbound Lanes
0' 100'
200'
300'
400'
500'
500'
800'
600'
900'
700'
1,00
0'
PatchLocation
DL
PL
DL
PL
DL
PL
DL
PL
Indicates a crack ofmedium to high severity
Not to ScalePL = Passing LaneDL = Driving Lane
53
