performance measurements for the gso-based...
TRANSCRIPT

Performance Measurements for the GSO-based Brain PET Camera (G-PET)
S. Surtil Student Member, IEEE) J.S. Karpl Senior Member, IEEE) L.-E. Adam1 Member, IEEE) G. Muchllchncr * Senior Member. IEEE
Abstract- Performance measurements on the high sensi- tivity, high resolution G-PET scanner have been completed. This scanner with a diameter of 42.0cm and axial field-of- view of 25.6cm was designed for brain receptor imaging, as well as regular clinical and blood perfusion studies in the brain. The transverse and axial resolution near the center are 4.0 and 5.0 mm (fwtm of 8.0 and 10.0 mm), respectively. At a radial offset of 1Ocm these numbers deteriorate by less than 12%. The absolute sensitivity of this scanner mea- sured with a 70 cm long line souxe is 4.57 cps/kBq. Scatter fraction measured with a line source in a 20cm diameter by 19cm long cylinder is 34.5%. For the same cylinder, the peak NEC rate is measured to be 75 kcps at an activ- ity concentration of 12.95 kBq/ml (0.35 pCi/cc), while the peak true coincidence rate is 200 kcps. Image contrast mea- sured with six spheres placed in the cylinder with an activity concentration ratio of 8:l is 21-24% for the smallest sphere (diameter of 10mm). However, due to the loss of counts near the sphere edges, the image contrast for this sphere is as high as 36% when using a region half the size of the sphere diameter and a 30 minutes acquisition time. We also show results from the 3D Hoffman brain phantom as well as 18F-FDG patient scans. These images illustrate the high visual quality of images acquired on the G-PET scanner.
I. INTRODTJCTION
A high sensitivity. high resolution PET scarum using a gatlolir~ium orthosilicatc (GSO) crystal basctl Anger-logic tlctcctor [I] has bccri tlcvclopctl for brain imaging (G-PET) [a]. The irltcrdctl applications inclutlc rcscarch stutlics using llC-taggctl radio-ligaritls for ricuro-rcccptor irnag- irlg ~~rotocols. as well as 18F-taggctl ligards and ‘“O-water brain stutlics (Figure 1). This scarmcr was tlcsigrlctl to hvc irnprovctl spatial rcsolutiori. high scrisitivity. arid high count-rate capability cornparctl to the curmnt NaI(Tl)- l-~~tl HEAD PENN-PET (H-PET) scarmcr [3]. The G- PET scmrm uses 4 x 4 x 1Omm” GSO crystals. which have an cncrgy rcsolutior~ of 9-10X at 511 kcV. rclativcly high tlcrisity (or liricar attcmmtiori cocfficicrit j1). arid short tlccay tirnc. Thcsc physical ~mrarnctcrs of GSO cornparc fa- vorably with those of NaI(T1) and LSO. The scarmcr has a tliarnctcr of 42 cm. an axial ficltl-of-view (FOV) of 25.6 cm. and it opcratcs only in the 3D or volume imaging rnotlc (no scpta). The G-PET scmrm will bc critical for study of structures which fall blow tlic tlirmlioltl of most corivcri- tiorml PET tcchology. while its high count-rate capability will bc irriportarit for study of physiological cffccts with fast temporal tlyriamics.
The authors arc with the lDcpartrr~cr~t of Radiology, Lnivcrsity of Pennsylvania, Philadelphia, PA 19104 and ‘ADAC ITGiLl, Philadcl- phia, PA 19104. E-mail: surti~rad.upcnn.cdu
Fig. 1. The G-PET brain scanner installed in the PET Ccntcr at the Hospital of the Lnivcrsity of Pennsylvania.
II. SCANNER DIXSIGN
A schematic tliagrarn of the scarmcr’s $mton tlctcctiorl systcrn is shown in Figure 2. A total of 18560 crystals (320 colurrms by 58 rows) and 288. 39 rnrn tliarnctcr PMTs (36 colurriris by 8 rows in a licxagorial lattice) couplctl to a siri- glc curvctl lightguitlc arc usctl. The lightguitlc thickness is 1.9 cm with 5 rnrn tlccp slots cut in both tlic trarisvcrsc arid axial tlirncrlsiorls. The optimization of the lightguitlc em- thccs tlic best crystal tliscrirniriatiori using a local wciglitctl ccntmitl calculatior~ [I]. The @icat Imrt of the scarmcr is 30 cm in tliarnctcr. with a 2.5 cm thick lcatl sitlc shicltl usctl to rcjcct cvcnts from activity outsitlc the FOV.
An q-amp basctl ydsc shapin, D circuit has bccri tlcvcl- opctl to rnakc the GSO signal symmetric. resulting in irn- ~mnml samplirig (digitization) of tlic signal by tlic flash analog-to-tligital-convcrtc~s (ADCS) running at a clock spcctl of 50 MHz. Optimal sampling of the signal is rquird to acliicvc good cricrgy rcsolutiori at iritcgmtiori tirncs of 120-160 ris. Wc use a triggcririg sclicrric to first tlctcrmiric if an iritcractiori is a coiricitlcrit cvcrit. bcforc ~~crformirig any Imsition calculatior~s. To keep the clcctronics sirnplc. PMT signals arc groupctl into small trigger charmcls which liavc bccri optirnizctl to rcthcc tlic tri ggcririg tlcatltirnc by using a high trigger cncrgy tlmdmltl [4]. Each trigger elm- ml currently cornpriscs of three acljaccrlt colurrms of PMTs with a oric colurriri ovcrlap bctwccri acljaccrit trigger chari- ncls. Overall. the G-PET scarmcr has 18 trigger charmcls with 24 PMTs ~)cr trigger charmcl. With this ammgcmcr~t
0-7803-7324-3/02/$17.00 © 2002 IEEE
1109
Authorized licensed use limited to: University of Pennsylvania. Downloaded on July 6, 2009 at 16:41 from IEEE Xplore. Restrictions apply.

Fig. 2. Schematic of G-PET scanner (transaxial cross-section), withdetector diameter of 42 cm and axial field-of-view of 25.6 cm.
we can set the trigger channel threshold at 400 keV, allow-ing a significant reduction in the number of non-photopeakevents triggering the electronics. Additionally, we havebuilt in the capability to divide each trigger channel ax-ially into two equal halves (five rows each with an overlapof two rows) which would result in a doubling of the totalnumber of trigger channels to 36. Once implemented in thefuture, this could potentially reduce the scanner deadtimeeven further.
B. Data Processing and Image Reconstruction
Three types of corrections are performed before the dataare binned into a sinogram. These are: PMT gain match-ing, energy correction, and distortion removal. Beforeenergy and position calculations, the digitally integratedPMT signals are corrected for PMT gain variations using alookup table. The PMT gain matching is essential in orderto achieve optimum crystal separation as well as good en-ergy resolution. Once the position and deposited energy ofan interaction have been calculated, a position-dependentenergy correction is performed via a lookup table. Energycorrection compensates mainly for systematic variations inthe light collection from crystals near a PMT center com-pared to those crystals near the PMT edge. In princi-ple, this correction also accounts for variations in the lightoutput of individual crystals. However, our measurementshave shown that the standard deviation of the light outputof the 18560 crystals used in G-PET is only 6.8%, and dur-ing assembly, care was taken to use crystals of similar lightoutputs next to each other. The final data correction in-volves removal of distortion in the calculated position dueto the use of a local centroid algorithm, and the eventualplacement of the event within a real crystal position onthe scanner. For this purpose, we developed an automatedsearch algorithm which detects the minima within a floodhistogram, defines the crystal boundaries within it, andeventually assigns a real position to all events which occurwithin each boundary region.
After all these corrections have been performed, the ac-
quired data from the scanner are rebinned into 320 angles(320 crystals/row), 62-63 rays, upto 15 out-of-plane tilts,and 115 axial slices. The radial samples are 4.4 mm apartin the center of the scanner and closer together towardsthe edge (4.4 mm is the crystal-to-crystal spacing along thescanner circumference). The axial pitch of the 58 crystalrows is also 4.4 mm; thus the slice separation is 2.2 mm.Transverse interleaving is performed to improve the radialsampling; the 320 angles × 62 − 63 rays are resorted into160 angles × 125 rays. The radial bins are now 2.2 mmapart in the center of the scanner (closer together at theedge). In order to remove the non-uniform radial samplingand to generate a sinogram compatible with existing soft-ware, data interpolation is performed prior to further datacorrections (normalization, scatter, and attenuation) andreconstruction. During interpolation, the 125 radial bins(unevenly sampled) are interpolated into 256, 1 mm (evenlysampled) bins; 160 angles are interpolated into 192 anglesand 115 slices are interpolated into 128, 2 mm slices. Thisstep may be eliminated in the future to avoid loss of reso-lution associated with interpolation.
III. Scanner Performance Measurements
Performance measurements were done on the G-PETscanner following the procedure outlined in the new NEMANU2-2001 standards.
A. Spatial Resolution
Spatial resolution measurements were performed using apoint source of 18F activity in a thin glass capillary tubewith an inner diameter of less than 1 mm. The axial lengthof the point source was also kept to less than 1 mm. Accord-ing to NEMA requirements, measurements were performedat radial positions of 1 and 10 cm, as well as an in-betweenradial position of 7 cm. The acquired sinograms were recon-structed using Fourier rebinning followed by filtered backprojection with a ramp filter without any smoothing. Theimage was reconstructed into a 256 × 256 × 128 field-of-view array where the pixel size is 1 mm in the transverseand 2 mm in the axial directions. For comparison purposeswe also reconstructed the image into a 128 × 128 × 128field-of-view (pixel size of 2 mm) using 3D RAMLA itera-tive reconstruction [5]. Figure 3 summarizes the resolutionresults.
From Figure 3 we clearly see that the spatial resolutionof the G-PET scanner is 4 mm in the transverse directionafter Fourier rebinning and FBP. This resolution worsensby about 12% due to depth-of-interaction effects at radialdistance of 10 cm. The results from 3D RAMLA recon-struction are generally worse by about 1 mm mainly dueto the optimization of the reconstruction parameters forclinical imaging situations (and not point sources in air),where reduced noise in the image is desired. Only one it-eration was performed in the RAMLA reconstruction witha lambda value of 0.024 and a blob radius of 2.5. TheRAMLA results clearly show that the significant deterio-ration of axial resolution at radial distance of 10 cm (afterFBP), is an artifact arising due to the Fourier rebinning
1110
Authorized licensed use limited to: University of Pennsylvania. Downloaded on July 6, 2009 at 16:41 from IEEE Xplore. Restrictions apply.

44.5
55.5
66.5
77.5
8
0 2 4 6 8 10
Transverse (FBP)
Transverse (3D RAMLA)
Axial (FBP)
Axial (3D RAMLA)
Radial position of source [cm]
FW
HM
[mm
]
89
10111213141516
0 2 4 6 8 10
Transverse (FBP)
Transverse (3D RAMLA)
Axial (FBP)
Axial (3D RAMLA)
Radial position of source [cm]
FW
TM
[mm
]
Fig. 3. Spatial Resolution for a point source in the G-PET scan-ner. The Top and Bottom figures show the measured fwhm andfwtm values, respectively, in the reconstructed images. The 2DFBP projection was performed with a ramp filter without anysmoothing after Fourier rebinning of the data.
process and does not represent the true performance of thescanner.
B. Scatter
The scatter fraction for the G-PET scanner was mea-sured using a line source filled with 18F and placed at threeradial positions (0, 45, and 90 mm) within a water-filled20 cm diameter and 19 cm long cylindrical phantom. Thedata were acquired at low count-rates and rebinned usingsingle slice rebinning (SSRB). The energy gates for thesemeasurements were set at EW1 ([435, 665] keV) and EW2([410, 665] keV). The measurement was performed with theline source at three different radial positions (0, 45, and90 mm) and data analyzed according to the NEMA stan-dard. The maximum scatter fraction (SF) value in the cen-tral slices varies from 44% for source radial position of 0 mmto about 42% and 30% when the source is placed 45 and90 mm radially respectively. The average scatter fractionfor the scanner after using the NEMA weighting schemeis measured to be 34.5% (over central 17 cm of the scan-ner axial length) for EW1. Using a lower energy threshold(EW2) the average scatter fraction increases to about 39%,thus showing the importance of using a high threshold.
C. Sensitivity
As described in the NU2-2001 standard, we measured theabsolute sensitivity of the G-PET scanner using a 70 cm
long line source at the center of the scanner, without andwith four different metal sleeves representing varying atten-uation coefficients. This measurement technique is basedon work described previously by Bailey, et. al. [6]. Themeasured count rate with each metal sleeve was correctedfor activity decay and the log of the results plotted as afunction of sleeve thickness. Linear regression was em-ployed to fit the data and obtain an extrapolated valuefor the absolute sensitivity of the scanner. We performedthis measurement for two different energy windows: EW1([435, 665] keV) and EW2 ([410, 665] keV). The absolutesensitivity was measured to be 4.57 and 4.79 cps/kBq, re-spectively, showing only a 4.8% difference between the twoenergy windows. Figure 4 shows a plot of the axial sensitiv-ity profile obtained with the EW1 energy window. The ax-ial sensitivity profile peaks at 0.08 cps/kBq (3 kcps/mCi).However, this sensitivity measurement is normalized to thetotal activity present in the 70 cm long line source. Sincethe scanner axial FOV is 25.6 cm, the absolute sensitiv-ity for activity within the field-of-view will be about threetimes higher than the value obtained by the NEMA mea-surement.
0
0.01
0.02
0.03
0.04
0.05
0.06
0.07
0.08
0 20 40 60 80 100 120Slice number
Sens
itiv
ity
[cps
/kB
q]
Fig. 4. NU2-2001 axial sensitivity profile for the G-PET scanner.
The scanner sensitivity was also measured using the20 cm diameter by 19 cm long NEMA cylinder. This cylin-der was uniformly filled with water containing a smallamount of 18F activity dissolved in it. Data were collectedat a low count-rate so that random coincidences are negli-gible. The scatter fraction as measured in Section III Bwas used to correct for the scattered events in the col-lected sinograms, and thus estimate the true coincidences(Trues = Total×(1-SF)). Measured this way, we obtaineda sensitivity of about 20 kcps/kBq/ml (680 kcps/µCi/cc).Since the length of this phantom (19 cm) is shorter thanthe axial FOV of the G-PET scanner (25.6 cm), the mea-sured sensitivity is lower than the true value. The slicesensitivity (every 2.0 mm) for this phantom in G-PET isabout 0.4 kcps/kBq/ml/2 mm (16 kcps/µCi/cc/2 mm) nearthe center of the FOV.
D. Count-rate tests
For count-rate measurements, as recommended in theappendix of the NU2-2001 standards, we used the 20 cm
1111
Authorized licensed use limited to: University of Pennsylvania. Downloaded on July 6, 2009 at 16:41 from IEEE Xplore. Restrictions apply.

0
100
200
300
400
500
600
0 0.05 0.1 0.15 0.2 0.25 0.3 0.35 0.4 0.45 0.5
TrueScatterRandomTotal
Activity concentration [µCi/cc]
Cou
nt-r
ate
[kcp
s]0 2 4 6 8 10 12 14 16 18
[kBq/ml]
0255075
100125150175200225
0 0.05 0.1 0.15 0.2 0.25 0.3 0.35 0.4 0.45 0.5
True
NEC
Activity concentration [µCi/cc]
Cou
nt-r
ate
[kcp
s]
0 2 4 6 8 10 12 14 16 18[kBq/ml]
Fig. 5. Count-rate curves for the G-PET scanner as measured witha water-filled 20 cm NEMA cylinder.
NEMA cylinder uniformly filled with water and 18F activ-ity dissolved in it. We started with about 111 MBq (3 mCi)of activity and acquired dynamic scans over several half-lives of the 18F isotope. The tail fitting method usinga parabola was used to estimate the background (scat-ter+random) fraction (background counts/total counts) foreach acquisition frame. The background fraction at lowactivity levels gives the scatter fraction, while at higheractivity concentrations it can be used to estimate the Ran-dom counts. The Noise Equivalent Count (NEC) ratewas then calculated using the formula NEC = T×T
T + Sc + R ,where T is the True, Sc is Scatter, and R is Randomcount-rate. Figure 5 summarizes the results of this count-rate measurement. The energy gates for this measurementwere set at EW2 ([410, 665] keV) and the NEC rate peaksat 75 kcps for an activity concentration of 12.95 kBq/ml(0.35 µCi/cc). Better results could potentially be achievedwith the smaller energy window EW1, which reduces scat-ter in the collected events as well reduces deadtime.
E. Image Contrast
Image contrast measurements were performed using sixsmall spheres in the 20 cm NEMA cylinder. The sphereshad internal diameters (do) of 37, 28, 22, 17, 13, and 10 mmand were placed so that their centers lie in the same ax-ial plane close to the central slice in the scanner. Thismeasurement was performed in analogy to the prescribedimage quality measurement in the NU2-2001 standards forwhole-body scanners with the IEC recovery phantom. Atotal starting activity of 136.9 MBq (1.5 mCi) of 18F was
Fig. 6. A central slice from the reconstructed image for the contrastmeasurements. All spheres, filled with an 8:1 activity concentra-tion with respect to the background, are clearly visible.
used with the six spheres containing a similar activity con-centration of eight times that of the background cylinder.We imaged this phantom for 5 and 30 min. and used 3DRAMLA reconstruction of fully corrected data.
TABLE I
Summary of results obtained with the G-PET scanner for
the contrast measurements with a 20 cm NEMA cylinder and
six hot spheres placed within it. The ratio for the sphere to
background activity concentrations is 8:1.
Sphere dia. Percent contrast (%) Backgrounddo (mm) D = do D = do/2 Variability (%)
5 minutes acquisition with 50 Mcts.10 21.5 24.4 21.913 25.6 34.2 19.217 33.2 47.6 17.022 36.2 60.0 14.928 36.1 68.4 13.437 60.1 75.6 13.2
30 minutes acquisition with 260 Mcts.10 24.4 36.5 15.813 26.3 39.5 14.017 30.9 46.8 12.422 35.4 54.8 11.528 35.9 65.6 10.837 60.0 76.2 11.4
For analysis, we measured the count density for circularregions with diameters (D) similar to the physical dimen-sions, and centered over the six spheres in the central slice.Counts in the volume of the sphere are lost due to the par-tial volume effect. Therefore, we repeated this analysis byreducing the diameter of the circular regions to half thatof the sphere size. The background count density was ob-tained by drawing 12 regions within each of the central and±1 and ±2 cm slices, leading to an average over 60 back-ground regions for each sphere size. As described in theNU2-2001 contrast measurement, the percent contrast for
each sphere is defined as 100 ×CH,jCB,j
−1aHaB
−1, where CH,j is the
count density in the region-of-interest (ROI) for sphere j,CB,j is the average count density in the background ROI’sfor sphere j, and aH and ab are the activity concentrationsin the spheres and background respectively. Figure 6 showsthe central slice through one of these acquired images whichhad a total of 260 Mcts. Table I summarizes these results.
1112
Authorized licensed use limited to: University of Pennsylvania. Downloaded on July 6, 2009 at 16:41 from IEEE Xplore. Restrictions apply.

Fig. 7. Selected slices from the reconstructed image of a 3D Hoffman Brain Phantom measured with the G-PET scanner. Images arereconstructed with fully 3D RAMLA iterative reconstruction algorithm.
F. 3D Hoffman Brain Phantom
Figure 7 shows representative slices acquired for a 3DHoffman Brain Phantom with the G-PET scanner. Thedata were acquired over 45 minutes with about 500 millioncollected events. The image reconstruction was performedusing 3D RAMLA reconstruction algorithm. These imagesshow the high spatial resolution and image quality attainedby this scanner with a good delineation of substructureswithin the brain phantom.
G. Patient Studies
Figure 8 shows transverse, sagittal, and coronal viewsof selected slices from a patient study after an 18F-FDGinjection and scan time of about 30 minutes. High imagecontrast and spatial resolution lead to good visual qualityin routine clinical scans.
IV. Discussion and Conclusion
A high resolution, high sensitivity, and high count-ratebrain scanner using the GSO Anger-logic detector has beendeveloped. Our performance measurements show that thisscanner has a transverse resolution of 4 mm (8 mm fwtm)at the center without significant deterioration at a radialdistance of 10 cm. The 55% solid angle coverage achievedby this scanner in 3D imaging mode, together with theuse of 10 mm long GSO crystals, results in an absolutesensitivity of 4.57 kcps/kBq. Good spatial resolution andhigh sensitivity are essential for imaging certain receptor
systems in the brain which may also have low specific ac-tivity. In addition, brain perfusion studies with 15O-water,as well as studies using other short-lived isotopes such as11C, will require this scanner to operate at high count-ratesin order to achieve good signal-to-noise ratio for imagingrapidly changing processes. With the fast signal decay timeof GSO, together with the restricted light spread in the de-tector design, the G-PET scanner is capable of operating atsignificantly higher count-rates with little deadtime. TheNEC rate for this scanner peaks at 75 kcps (for a 20 cmdiameter by 19 cm long cylinder) for an activity concentra-tion of about 12.95 kBq/ml (0.35 µCi/cc). The true coin-cidence rate at this activity concentration was measuredto be about 200 kcps. The count-rate results presentedhere were measured with a low energy gate of 410 keV, andcould potentially increase when the energy gate is raisedto 435 keV. We have also measured the percent contrastachieved by this scanner by imaging six hot spheres ina uniform warm background. These measurements showthat the small spheres are easily detectable, but even withhigh spatial resolution, the partial volume effect is signifi-cant. For clinical 18F-FDG imaging we currently scan for30 minutes which provides high image quality. The resultswe show for the 3D Hoffman brain phantom, as well as thepatient studies, illustrate the degree of structure which isvisible in these scans.
1113
Authorized licensed use limited to: University of Pennsylvania. Downloaded on July 6, 2009 at 16:41 from IEEE Xplore. Restrictions apply.
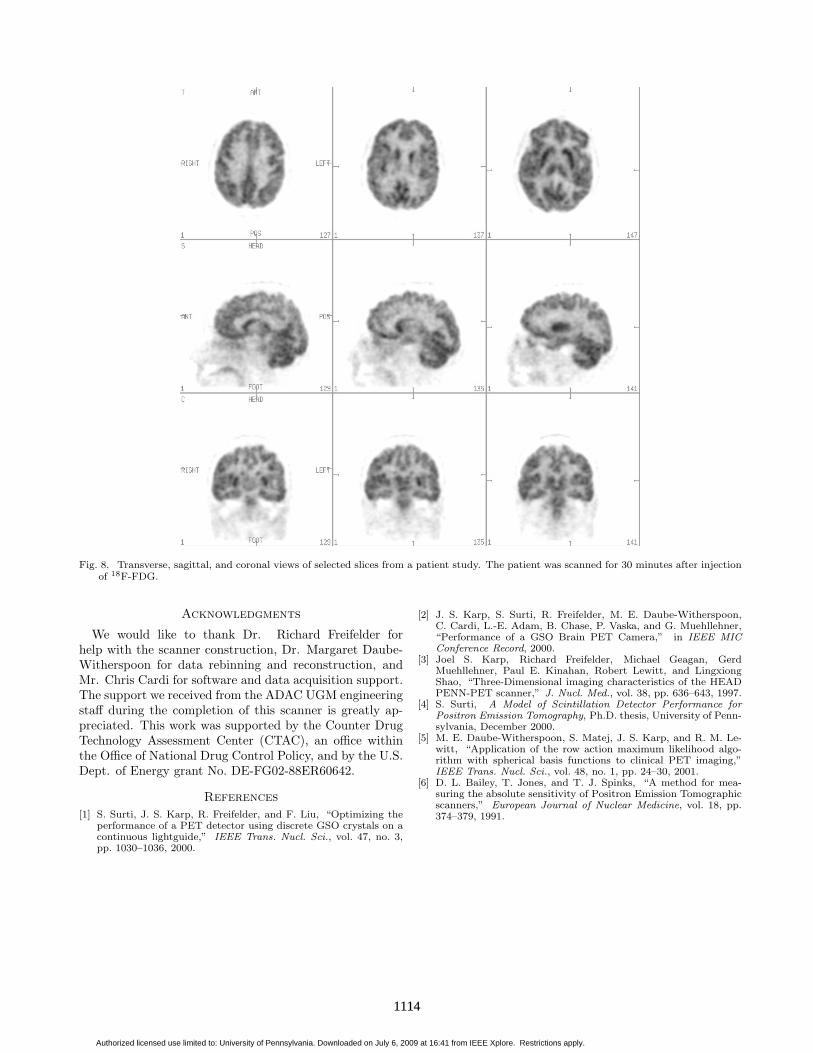
Fig. 8. Transverse, sagittal, and coronal views of selected slices from a patient study. The patient was scanned for 30 minutes after injectionof 18F-FDG.
Acknowledgments
We would like to thank Dr. Richard Freifelder forhelp with the scanner construction, Dr. Margaret Daube-Witherspoon for data rebinning and reconstruction, andMr. Chris Cardi for software and data acquisition support.The support we received from the ADAC UGM engineeringstaff during the completion of this scanner is greatly ap-preciated. This work was supported by the Counter DrugTechnology Assessment Center (CTAC), an office withinthe Office of National Drug Control Policy, and by the U.S.Dept. of Energy grant No. DE-FG02-88ER60642.
References
[1] S. Surti, J. S. Karp, R. Freifelder, and F. Liu, “Optimizing theperformance of a PET detector using discrete GSO crystals on acontinuous lightguide,” IEEE Trans. Nucl. Sci., vol. 47, no. 3,pp. 1030–1036, 2000.
[2] J. S. Karp, S. Surti, R. Freifelder, M. E. Daube-Witherspoon,C. Cardi, L.-E. Adam, B. Chase, P. Vaska, and G. Muehllehner,“Performance of a GSO Brain PET Camera,” in IEEE MICConference Record, 2000.
[3] Joel S. Karp, Richard Freifelder, Michael Geagan, GerdMuehllehner, Paul E. Kinahan, Robert Lewitt, and LingxiongShao, “Three-Dimensional imaging characteristics of the HEADPENN-PET scanner,” J. Nucl. Med., vol. 38, pp. 636–643, 1997.
[4] S. Surti, A Model of Scintillation Detector Performance forPositron Emission Tomography, Ph.D. thesis, University of Penn-sylvania, December 2000.
[5] M. E. Daube-Witherspoon, S. Matej, J. S. Karp, and R. M. Le-witt, “Application of the row action maximum likelihood algo-rithm with spherical basis functions to clinical PET imaging,”IEEE Trans. Nucl. Sci., vol. 48, no. 1, pp. 24–30, 2001.
[6] D. L. Bailey, T. Jones, and T. J. Spinks, “A method for mea-suring the absolute sensitivity of Positron Emission Tomographicscanners,” European Journal of Nuclear Medicine, vol. 18, pp.374–379, 1991.
1114
Authorized licensed use limited to: University of Pennsylvania. Downloaded on July 6, 2009 at 16:41 from IEEE Xplore. Restrictions apply.