performance journey mapping: insights from a
TRANSCRIPT

45
JIOS, VOL. 40, NO. 1 (2016), PP. 45-65
UDC 004:005Survey Paper
JIOS, VOL. 40, NO. 1 (2016) SUBMITTED 06/15; ACCEPTED 05/16
Performance Journey Mapping: Insights from a Methodological Triangulation1
Angelika Höber [email protected] Information Technologies & Business Informatics CAMPUS 02 University of Applied Sciences, Graz, Austria
Doris Weitlaner [email protected] Information Technologies & Business Informatics CAMPUS 02 University of Applied Sciences, Graz, Austria
Elisabeth Pergler [email protected] Information Technologies & Business Informatics CAMPUS 02 University of Applied Sciences, Graz, Austria
Abstract
This paper presents the results of an evaluation of the Performance Journey Mapping (PJM) framework. PJM is a service performance assessment concept with accompanying tools tailored to the specific performance measurement needs of small and medium-sized service providers. The initial evaluation of PJM was performed from three different perspectives. The underlying evaluation framework applied methodological triangulation in order to (i) ensure valid and reliable results and to (ii) evaluate both the framework’s results and its process. Quantitative results were supplemented with insights gained through participant observation. Keywords: performance measurement, service performance assessment, evaluation, methodological triangulation, service engineering
1. Introduction
The ever increasing importance of services for the economy necessitates a thorough understanding of service performance and valid instruments for its measurement. Due to both the services’ heterogeneity and the fact that value is created and captured in the course of their consumption, it is challenging to measure service performance. These and further difficulties create barriers for the adoption of
1 This paper is an extended version of the conference paper [1] published in ISD2014 Proceedings: Information Systems Development: Transforming Organisations and Society through Information Systems, 2014.

46
JIOS, VOL. 40, NO. 1 (2016), PP. 45-65
HÖBER, WEITLANER, AND PERGLER PERFORMANCE JOURNEY MAPPING: ...
performance measurement, especially in small and medium-sized enterprises (SMEs) [2].
The main objective of the presented research project was, thus, to create a performance assessment framework that covers the specific needs of SMEs in the service environment. The identified research gap was addressed by a theory-driven approach: the Performance Journey Mapping (PJM) framework was intended to be easy to implement, to feature acceptance-triggering characteristics, and to foster support by the individual users in the company.
The Technology Acceptance Model (TAM) [3], [4] was employed as a trigger for acceptance. It consists of two basic factors explaining the behavioral intention to use a certain technology, i.e. perceived usefulness and perceived ease of use. They served as guidelines for the design of the assessment framework.
The Goal-setting theory (GST) [5] was engaged as a facilitator for generating commitment. Very few motivational models focus on measures that can be taken in organizations to increase the staff’s motivation to contribute to corporate objectives. The GST provides a comprehensive set of goal characteristics and actual measures that help to improve employee performance. GST was integrated into the framework through stakeholder involvement.
Employees performing certain activities in the service delivery process should actively participate in the creation of the performance measurement system (PMS). In order to keep entry barriers low, the framework was designed as bottom-up-approach which can be implemented with minimum technical requirements.
In the course of an evaluation according to the design science principles by Hevner et al. [6] the resulting PJM framework was assessed and examined from three different perspectives. The evaluation aimed at finding out whether the application of TAM and GST positively contributed to the development of a PMS that meets the defined goals and simultaneously fulfils renowned quality criteria. Methodological triangulation was engaged for achieving these objectives. Quantitative data from questionnaires and ratings was complemented by qualitative data from participant observation which allowed for better insights into the process of service assessment in SMEs. At the same time the triangulation guaranteed more valid and reliable results. The findings represent the input for the further development of PJM and, therefore, initiate a new build-evaluate-loop in the design science methodology.
This article presents the framework as well as the results of its evaluation and is structured as follows. First, the state of practice regarding performance measurement, evaluation of PMSs, and methodological triangulation in the field of information system (IS) research is outlined. Subsequently the PJM framework is introduced. In section 4 the evaluation framework with its quantitative and qualitative methods is illustrated. Section 5 presents and discusses the evaluation results. The paper concludes by summarizing the cornerstones of the development cycle, findings gained by the evaluation, as well as lessons learned and implications derived therefrom. What is more, an outlook on ongoing and future research and development is conveyed.

47
JIOS, VOL. 40, NO. 1 (2016), PP. 45-65
JOURNAL OF INFORMATION AND ORGANIZATIONAL SCIENCES
2. Literature Review and State of Practice
Measuring and enabling high levels of service performance has been targeted by academic publications and tools as well as commercial applications and tools. Predominating approaches of performance measurement and management, hence, need to be sketched and discussed with regard to their applicability in SMEs and in the service context. The development of any artefact typically takes place purposefully. It should, however, not be implemented in the general public until it was evaluated whether the intended aims and benefits are actually achieved. Methodological triangulation can be useful in this regard.
2.1. Performance Measurement
One of the most popular instruments to measure the abstract and elusive service quality construct is the SERVQUAL scale. Although it was intended to develop a measurement tool broadly applicable in the service industries [7] research has shown that the five underlying quality dimensions are varying across them (factor instability) [8]. Moreover both the reasonableness and purposefulness of the perception-minus-expectation measurements were questioned which led to the development of alternative, performance-based measures such as SERVPERF [9]. The factor instability problem, however, remained unresolved [8] – see e.g. [10] for further theoretical and empirical issues raised during the last 20 years. To apply the instrument in a generic way literature suggests to either develop adapted industry-specific versions or to perform reliability and validity analyses after data collection. This implies that statistical capabilities need to be anchored within SMEs as both the original and a new SERVQUAL or SERVPERF scale need to be carefully validated.
The IT Infrastructure Library (ITIL) is a reference model capturing best practices regarding service management. It is designed in such a way that it can be adapted to the specific business environments’ and organizational strategies’ needs [11]. However, the focus of existing literature on the implementation of ITIL was on large firms whereas SMEs were largely neglected in the past. The intersection of ITIL and SMEs is, meanwhile, becoming a topic of central scientific interest. It was assumed that the reference model exhibits a complex and resource-demanding structure of defining processes, roles, et cetera. As a consequence, tradeoffs in terms of adaptations and downscaling would have to be made in the context of SMEs. Younger research, however, provides indication that SMEs can handle the complexity associated with ITIL and indeed apply the reference model on the one hand. It was, on the other hand, even pointed up that the adaption of ITIL depends on the industry sector served [12]. What is more, empirical studies demonstrating ITIL’s impact on enterprises are scarce, especially in the field of quantitative evaluation. First steps into this direction have been made by McNaughton et al. [13] who developed a multi-layer evaluation framework in order to objectively and subjectively assess the benefits resulting from the implementation of ITIL. It appears from the foregoing that the application of ITIL in the SME context is not entirely uncontroversial. Within this research project it is aimed at developing a framework

48
JIOS, VOL. 40, NO. 1 (2016), PP. 45-65
HÖBER, WEITLANER, AND PERGLER PERFORMANCE JOURNEY MAPPING: ...
that can be utilized in a generic way, i.e. for measuring the performance of any kind of service, implying sector independency. It appears, thus, that the reference model cannot be employed for the intended purpose in its original form, as it relates to the management and alignment of IT services. The service performance assessment framework should, however, be applicable in non-IT-based settings.
The Balanced Scorecard (BSC) [14] is a management tool that is based on cause-effect relationships. Its principles have been transferred to the context of service management in the form of a service strategy scorecard [15]. The service strategy scorecard adopted the basic dimensions from the BSC. A causal analysis of the four dimensions was conducted among SMEs with regard to software-as-a-service adoption. The results indicate support of the underlying assumptions with regard to causal relationships between the dimensions [16].
2.2. Evaluation of Performance Measurement Systems
There is a shortage of literature addressing the evaluation of PMSs. Jonsson and Lesshammer [17] elaborated six crucial requirements that an overall manufacturing performance system needs to meet based on a literature review – referring to both what and how to measure. Their proposition was investigated by means of three case studies among medium to large-sized manufacturers from different industries. The fact that flow orientation and external effectiveness remained unaddressed in measurement constitutes one of the major revealed weaknesses of the manufacturer’s PMSs. Tangen [18] developed a set of tools for evaluating and revising existing PMSs. Besides a classification scheme the author introduced a guide to systematically evaluate and revise PMSs in nine steps in a tool-based manner. The latter was titled performance measurement progression map and can be applied independently from the PMS’s origin.
SMEs have individual needs in regard to performance measurement. It is, hence, reasonable to primarily evaluate the single measures representing the core of PMS design. According to Bourne [19] there is a strong consensus in contemporary PMS design research that good performance measures are tightly connected to the business strategy (e.g. [20]). Moreover all measures should be derived from the corporate strategy. This can hardly be realized for SMEs as many of them do not have an explicit strategy [21]. This might represent a circumstance militating against the employment of the BSC in its original sense, as it aims at translating strategic goals into relevant performance measures. Neely et al. [22] follow an alternative approach and provide a list of performance measure characteristics which can be easily adapted and applied to evaluate any set of key figures.
Especially in the context of SMEs the sole consideration of the PMSs’ formal quality is insufficient. Their acceptance and associated usage are fundamental requirements as well. PMSs must, therefore, feature characteristics fostering the acceptance of its users. This is also related with motivational issues. In SMEs, where decisions are depending on a small number of people, it is vital that all employees are committed to improve their individual and, thus, the company’s performance.

49
JIOS, VOL. 40, NO. 1 (2016), PP. 45-65
JOURNAL OF INFORMATION AND ORGANIZATIONAL SCIENCES
2.3. Methodological Triangulation in Information Systems Research
According to Venkatesh et al. [23], research in the field of ISs was limited to quantitative methods until the middle of the 90s. Studies applying other methods were not accepted. This attitude has undergone a change after a number of researchers discovered the potential comprised in greater methodological diversity, especially at a point of time where traditional methods did not suffice for investigating fast changing phenomena anymore [23]. In September 2000 MIS Quarterly published a Special Issue on Intensive Methods which made a first definition of criteria of excellence for qualitative research in ISs [24].
Still, the amount of studies published in the Senior Scholars’ Basket of Journals did not exceed five percent in the following years. According to Conboy et al. [25], this small amount is a result of lacking competencies on the part of researchers. Venkatesh et al. [23] see the reasons for this circumstance, in contrast, in the persistent lack of guidelines for both the execution and the assessment of methodological triangulations. They propose to learn from the social and behavioral sciences which dispose of extensive experience in that field.
3. Performance Journey Mapping Framework
SMEs have little to no resources at their disposal for data collection and tend to emphasize productive activities [21]. Focusing on the SMEs’ experience (and business) realm a bottom-up-approach was developed. It helps to design performance measures that are tightly connected to SMEs’ daily business and supports them to improve rather than to monitor their performance.
Instead of deriving performance goals from the company’s strategy the starting point is the firm’s core service, thus, taking its service process as a basis and the internal stakeholders as reference points. The aim is to create a PMS with full coverage of the service process. For this purpose a three-step approach is employed as outlined in Figure 1.
Step 1 includes an analysis of the current state identifying the performance measures already in use. Step 2 proceeds from the status quo to the desired state. Gaps in performance measurement are thereby identified and covered. Step 3 completes the PMS design by adding target values for the new measures. The three steps are conducted in form of one or two workshops involving all relevant stakeholders of the service delivery process in question.
At the beginning of Step 1 performance measures already in use are collected. The blueprint of the core service is taken as a starting point for this purpose. A service blueprint [26] is a visual representation of the service process consisting of different layers showing customer touch points, activities, and processes from both customer and company perspective. The activities and processes on the part of the company are in the center of the further proceedings. In a first iteration one after another is focused on and examined: Which stakeholder is involved? Which measures are already used by them? The identified measures are listed in an overview table and assigned to the dimensions of the BSC [14]. Subsequently the

50
JIOS, VOL. 40, NO. 1 (2016), PP. 45-65
HÖBER, WEITLANER, AND PERGLER PERFORMANCE JOURNEY MAPPING: ...
content of the resulting overview table is merged with the service blueprint in a new graphical representation which is depicting the performance measure coverage of the service process and simultaneously providing insights into the balance or imbalance of current measures among the BSC dimensions. The resulting representation is the so-called performance journey map. Measurement gaps appear in the map in form of activities without any performance measurement or activities with imbalanced measurement according to the BSC dimensions.
Figure 1. Outline of the three-step Performance Journey Mapping process.
Step 2 is initiated by a thorough collection of needs and requirements with regard to future performance measurement, followed by the second iteration along the service process. This iteration focusses on the question What (else) could or should be measured there? for each activity within the process. Especially measurement gaps that were identified in the course of the first iteration are addressed. The new measures are listed in an overview table, assigned to the dimensions of the BSC, and integrated into the former performance journey map. The resulting map provides a holistic overview of all (current and future) performance measurement activities connected to the service.
As new measures have been added to the performance journey map Step 3 addresses data collection methods and the assessment of these measures. Once this challenge is resolved the target values can be defined and joined to the overview list. The target values are defined by the respective stakeholders of the activity as they are the ones who will be measured against these goals. The final map (see Figure 2) is disposing an overview of the PMS and the overview list is dedicated to its operationalization.
The process is suggested to be applied in regular iterations, e.g. annually, to enable evolving performance measurement. This is necessary to ensure appropriateness for the current needs of an SME as well as effective benchmarking with competitors. At the same time the adaptive nature of the PMS will cause a lack

51
JIOS, VOL. 40, NO. 1 (2016), PP. 45-65
JOURNAL OF INFORMATION AND ORGANIZATIONAL SCIENCES
of historic comparability within the SMEs but this is a negligible loss compared to the advantages of competitive performance benchmarking [27].
Figure 2. Exemplary performance journey map based on a conference’s workshop process.
4. Evaluation Framework
In order to evaluate the PJM procedure a separate evaluation framework was designed and applied. The concept is based on both the theory-driven development of the PJM framework and prior research on PMS evaluation an evaluation. It addresses the three dimensions (i) TAM, (ii) GST, and (iii) a quality criteria list (QCL) which was derived from the research of Neely et al. [22], [28]. To ensure the results’ validity and reliability the dimensions are, additionally, assessed from three perspectives (Figure 3). The quality perspective corresponds to the researcher’s view. It provides insights from the perspective of the participating researchers and evaluates in a formal and formative way. The user perspective represents the users

52
JIOS, VOL. 40, NO. 1 (2016), PP. 45-65
HÖBER, WEITLANER, AND PERGLER PERFORMANCE JOURNEY MAPPING: ...
or addressees of the PMS (the single stakeholders of the service delivery process within a company). Since the framework is applied in a highly interactive workshop and the outcome, hence, depends on collaborative processes, it is not sufficient to evaluate the two perspectives in an isolated way. The bird’s eye perspective is introduced to obtain data in a collaborative setting on the one hand and to identify potential problems and/or risks in the interactive setting on the other hand. The latter are approached by means of participant observation. An extensive presentation of the methods applied in the different perspectives can be found in [2].
Figure 3. Evaluation dimensions and perspectives.
In order to assess technology acceptance, Davis’ [3] questionnaire was slightly adapted. After the workshop the participants (on company side) were asked to rate the ten propositions by means of a five-point scale ranging from “likely” to “unlikely”. In contrast, the same participants marked their perceived usefulness and ease of use of PJM on a flipchart along a scale between a happy and a sad smiley. This was performed twice: after the first and after the second iteration along the service blueprint. Locke and Latham’s [5] moderators served as a basis for assessing the outcome of goal setting. A simple questionnaire was deployed which operationalizes four moderators by means of seven statements which can be rated on a four-point scale anchored at “fully applies” and “does not apply at all”. The questionnaire is completed by the participants on company side after the workshop. The formal evaluation was assessed by means of the QCL. It consists of two checklists covering the quality criteria of performance measures. The first one serves to assess the uniform distribution of the measures by calculating and comparing sums at the end. The second one is a matrix deduced from yes/no-judgments for

53
JIOS, VOL. 40, NO. 1 (2016), PP. 45-65
JOURNAL OF INFORMATION AND ORGANIZATIONAL SCIENCES
each measure/criteria-combination. In addition to that, at the end of the workshop the participants received a set of cards containing the items of the QCL. In the light of the final performance journey map’s measures, they were asked to return only those cards with statements they agreed expressly.
The previously described methods rely on ratings on behalf of the workshop participants and the contributing researchers. All of these ratings present valuations of the PMS. The PMS on its side is the result of the interactive process that took place in the workshop. Interactive processes are, however, neither linear nor goal-oriented exchanges of statements. They are complicated by varying interpretations of the different actors. The more these interpretations vary, the harder it gets to communicate effectively. Furthermore, messages always comprise additional information (transferred through intonation, mimic, and gestures). Finally, there is also a relationship aspect in every message. It is influenced by the relationship between the actors and provides the recipient with additional information about how a sender wants his message to be understood [29].
Interactive processes are, thus, complex occurrences and even if – as in the case of the PJM workshop – a common goal is defined, many things can go wrong on the way. It was hence indicated to observe the interactive setting. In this way, at a later stage, it would be possible to distinguish difficulties rooted in the framework from those arising in the workshop. Participant observation was deemed a promising method. Scientific observation differs from observations in daily life in that respect that it aims not only at capturing single actions but also at comprehending the sequence and meanings of the single events. Participant observation is particularly qualified and utilized for analyzing phenomena which are not static but rather undergo a continuous change throughout the observation, such as behavioral sequences or social processes. Participatory refers to the fact that the observer is located within the interactive field of the observed actors, even though he/she does not enter the actors’ interactions [30].
Before the preparation of a participant observation can be started, several demarcations are needed [30]: Which situation(s) should be observed? Where does the observation period begin and end? What are the limitations in term of spatial extension? Table 1 gives an overview of the observation range.
Observed situation(s) The PJM workshop, performed as part of a pilot project together with a company.
Participants: Company delegation (staff, management), researchers
Observation period The content-related part of the workshop, including steps 1 and 2. In case that the workshop is terminated at an intermediate point, the formal end of the workshop will be considered as finish. Excluded from the observation are: welcome, goodbye, small talk, opening explanations and private talks (e.g. during breaks).
Spatial extension The meeting room (or other room) where the workshop takes place.
Table 1. Demarcations for the participant observation.
Since a variety of approaches for realizing participant observations exists (overt/covert, systematic/unsystematic, etc.), further confinement is required. The planned observation was conceptualized to be overt and systematic. Overt signifies

54
JIOS, VOL. 40, NO. 1 (2016), PP. 45-65
HÖBER, WEITLANER, AND PERGLER PERFORMANCE JOURNEY MAPPING: ...
that the actors are informed about the ongoing observation (in contrast to covert observations). Systematic indicates that the researchers are not focusing their attention spontaneously [30]. The observation had to be overt as it should take place in a natural working setting, whereas covert evaluation would require a laboratory environment. The systematic approach was predetermined by the given observation interests. The latter is captured in a guideline instructing the researchers’ attention [30]. That way, the role of a guideline for participant observations corresponds to guidelines used for semi-structured interviews. Having the guide in mind, the researchers put down so-called “field notes” about relevant occurrences.
Figure 4. Bales’ observation categories [31].
The guideline was constructed to cover two levels: the content and the context of the interactions. The content level focused on the topic of the single messages. It aimed at documenting how often single issues were addressed. Subjects of interest were the TAM factors, GST moderators, and QCL subjects. The context level, in contrast, covered the interaction details, e.g. Who addressed a topic, in which manner? To grasp the full bandwidth of interaction modes the researchers drew on

55
JIOS, VOL. 40, NO. 1 (2016), PP. 45-65
JOURNAL OF INFORMATION AND ORGANIZATIONAL SCIENCES
Bales’ interaction process analysis [31] which constitutes a tool for the investigation of small group interaction. Bales lists twelve interaction categories and classifies them in four areas of socio-emotional and task-oriented interactions. Figure 4 gives a full listing of Bales’ dimensions.
The participant observation was executed by two researchers. The observation guideline was meant to focus their attention, so that they should record exclusively interactions which covered one of the relevant subjects. It turned out that the interaction occurred in such a fast way, that it was not possible to filter the interaction in real time. The researchers consequently started to write informal observation protocols, putting down all observed interactions in short notes. At the end of the workshop six pages filled with chronologically ordered observations were available. The handwritten pages were typed and the resulting documents constituted the material for the subsequent data analysis.
The analysis was started with a coding process as described in the Grounded Theory Methodology defined by Strauss and Corbin [32]. Textual data are, thereby, broken up into pieces and codes are assigned which represent the content of a single piece of text. Although Grounded Theory proposes to develop the codes exclusively from the material, the researchers used a set of preselected ones which corresponded to the subjects defined in the observation schema. This approach made up for the lacking filtering throughout the observation. After a first iteration of coding, which was executed independently by two researchers, the individual coding results were contrasted and discussed. A consolidated document constituted the final result of the coding process. To provide an overview and to facilitate the fusion of quantitative and qualitative evaluation results, the attributed codes were quantified by means of an interaction protocol. The latter was designed in the form of a simple matrix, listing the single subjects on the y-axis and actors as well as interaction categories on the x-axis. Table 2 shows a simplified form of the interaction protocol. First, all text sections attributable to a certain code were gathered. Then the frequencies for the single interaction modes and participating actors were calculated and filled in the corresponding matrix lines.
Subject Actor 1 Actor 2 Actor 3
...
Shows Solidarity
Shows tension release
Agrees
...
Responsibility 5 9 6 1 2
Improvement 7 2 1 1
Non-Monetarity 1 2 1 1 3
Distribution along the dimensions of the BSC
2 2 1 2
...
Table 2. Interaction protocol (schema).

56
JIOS, VOL. 40, NO. 1 (2016), PP. 45-65
HÖBER, WEITLANER, AND PERGLER PERFORMANCE JOURNEY MAPPING: ...
5. Evaluation Results
PJM was evaluated in a pilot project where the workshop concept was complemented by the evaluation framework. The singe evaluation measures were executed at different points in time during and after the workshop, as previously described. The workshop was conducted in the first half of 2014 in a SME offering IT-services. The executive manager and ten employees (two project managers, the marketing executive, and software development staff on different professional levels – representing nearly the entire staff) participated. The research team consisted of two workshop moderators, one assistant, and two participatory observers. The workshop took place in the firm’s meeting room on a workday morning and had a firm-driven timely limitation of two hours.
The assessment results gained through questionnaires and ratings have already been discussed in detail in [2]. A brief summary is provided in the next subsection. The present paper focuses on the findings from the participant observation which are subsequently particularized.
5.1. Assessment Results
In summary it can be said that the questionnaires and ratings yielded predominantly positive results. It became apparent that both the TAM and the GST indeed contribute to the development of a PMS tailored to SMEs in the service sector. The two related evaluation dimensions were entirely positively rated, especially from user perspective. However, the evaluation along the quality dimension resulted in varying consistency. The strengths of the elaborated PMS were clearly the comprehensibility and freedom of conflict of its performance indicators. In contrast, its weakness could be found in the balance issue, especially concerning the performance measures’ balance along company levels and the service blueprint. The remaining quality criteria achieved mediocre results.
5.2. Observation Results
The interaction protocol can be analyzed from different angles, depending on the guiding interest. In a first perspective, the interaction protocol shows the frequency with which single topics have been mentioned. In a second, it reveals the activity of the single actors, and in a third one, it displays the share of the single interaction modes.
The total number of attributed codes was 112. The most frequently mentioned topic was Responsibility, which held 20.5 percent of the codes (Table 3). Usefulness was in second place with 12.5 percent, followed by Improvement and Importance ex aequo with each 11.6 percent. In contrast, Self-efficacy resulted in 0.9 percent, Absence of conflict and Balance along company levels had never been addressed. The remaining subjects yielded results between 4.5 and 7.1 percent

57
JIOS, VOL. 40, NO. 1 (2016), PP. 45-65
JOURNAL OF INFORMATION AND ORGANIZATIONAL SCIENCES
Number of mentions
Person(s) engaged
Subject Total % CEO PL1 PL2
QC
L Responsibility 23 20.5 5 9 6
Improvement 13 11.6 7 2 1
Non-Finance 8 7.1 1 2 1
Balance along BSC dimensions 8 7.1 2 2 1
Comparability 7 6.3 1 2
Objectiveness 5 4.5 3
Balance along service blueprint 5 4.5 2 1 3
Comprehensibility 3 2.7 1
2
Absence of conflict 0 0.0
Balance along company levels 0 0.0
GST
Importance 13 11.6 2 4 3
Feedback 6 5.4 2
2
Goal commitment 3 2.7 1 2 1
Self-efficacy 1 0.9
TAM
Usefulness 14 12.5 5 2 2
Ease of use 3 2.7
1
Total 112 32 27 22
% 100 28.6 24.1 19.6
Table 3. Interaction protocol (reduced view) – part 1.
The CEO was the most active person in terms of interactions, since he was engaged in 28.6 percent of all interactions. The two project leaders held 24.1 and 19.6 percent respectively of the interactions. Other actors reached values between 0.9 and 5.4 percent, one participant did not engage in interactions at all.
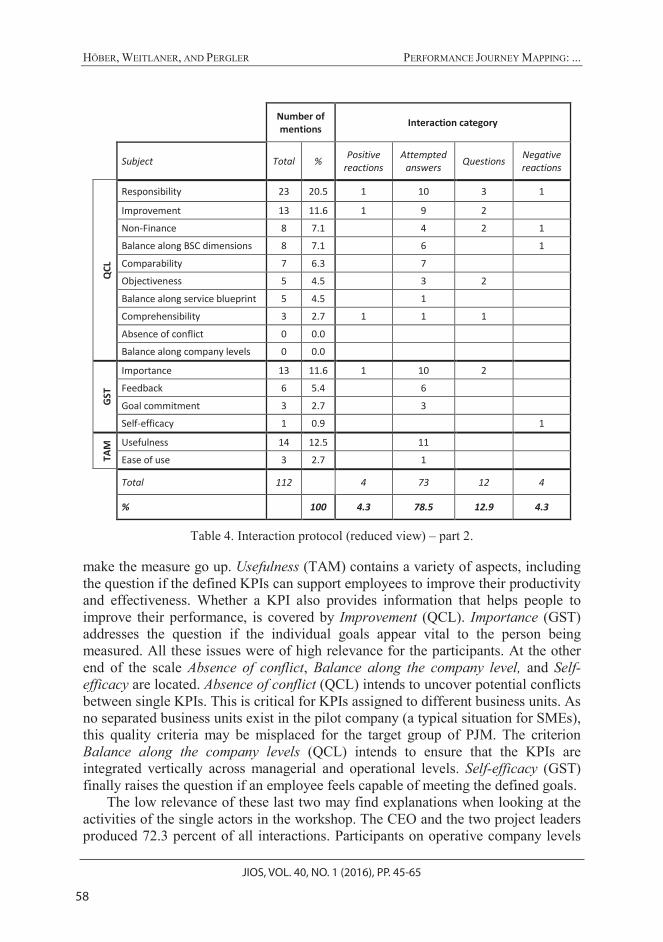
With 91.4 percent task-oriented interactions prevailed clearly (see Table 4). They split up into 78.5 percent in the category of attempted answers and 12.9 percent in the area of questions. The share of socio-emotional interactions amounts to 8.6 percent, with equal parts for positive and negative reactions. The biggest share of interaction modes is achieved by Opinions with 34.4 percent, followed by Suggestions with 24.7 and Explanations with 19.4 percent. The midfield was populated by Asking for opinions (6.5), Asking for suggestions (4.3) and Showing of tension (4.3). The other categories did not amount for more than 2.2 percent, Showing of disagreement and Antagonism were not registered at all.
According to the number of mentions the topics can roughly be clustered into three groups: high, medium, and low relevance. In the top area Responsibility, Usefulness, Improvement, and Importance can be found. Responsibility (from QCL) refers to the question whether the person being measured really has the control to
58
JIOS, VOL. 40, NO. 1 (2016), PP. 45-65
HÖBER, WEITLANER, AND PERGLER PERFORMANCE JOURNEY MAPPING: ...
Number of mentions
Interaction category
Subject Total % Positive
reactions Attempted
answers Questions
Negative reactions
QC
L
Responsibility 23 20.5 1 10 3 1
Improvement 13 11.6 1 9 2
Non-Finance 8 7.1
4 2 1
Balance along BSC dimensions 8 7.1
6
1
Comparability 7 6.3
7
Objectiveness 5 4.5
3 2
Balance along service blueprint 5 4.5
1
Comprehensibility 3 2.7 1 1 1
Absence of conflict 0 0.0
Balance along company levels 0 0.0
GST
Importance 13 11.6 1 10 2
Feedback 6 5.4
6
Goal commitment 3 2.7
3
Self-efficacy 1 0.9
1
TAM
Usefulness 14 12.5
11
Ease of use 3 2.7
1
Total 112 4 73 12 4
% 100 4.3 78.5 12.9 4.3
Table 4. Interaction protocol (reduced view) – part 2.
make the measure go up. Usefulness (TAM) contains a variety of aspects, including the question if the defined KPIs can support employees to improve their productivity and effectiveness. Whether a KPI also provides information that helps people to improve their performance, is covered by Improvement (QCL). Importance (GST) addresses the question if the individual goals appear vital to the person being measured. All these issues were of high relevance for the participants. At the other end of the scale Absence of conflict, Balance along the company level, and Self-efficacy are located. Absence of conflict (QCL) intends to uncover potential conflicts between single KPIs. This is critical for KPIs assigned to different business units. As no separated business units exist in the pilot company (a typical situation for SMEs), this quality criteria may be misplaced for the target group of PJM. The criterion Balance along the company levels (QCL) intends to ensure that the KPIs are integrated vertically across managerial and operational levels. Self-efficacy (GST) finally raises the question if an employee feels capable of meeting the defined goals.
The low relevance of these last two may find explanations when looking at the activities of the single actors in the workshop. The CEO and the two project leaders produced 72.3 percent of all interactions. Participants on operative company levels

59
JIOS, VOL. 40, NO. 1 (2016), PP. 45-65
JOURNAL OF INFORMATION AND ORGANIZATIONAL SCIENCES
were solely engaged in 21.4 percent of all cases. This disequilibrium indicates a top-down dominance and clearly disposes that the bottom-up approach of PJM has not yet developed fully.
To enable an analysis of the share of interaction categories, Bales [31] provides an empirical norm with average values and limits. This constitutes a typical pattern of interaction within an average interactive problem-solving setting. He states that “departures from the average picture can be used as diagnostic indicators of the nature of the conditions under which interaction takes place” [31, p. 261]. The comparison of the results from the interaction protocol and Bales’ average values reveals following insights (cf. Table 5).
Task oriented interactions usually hold a bigger share than socio-emotional interactions, with an average ratio of 66.1 percent to 33.9 percent. This relativizes the imbalance in the present case, although the ratio is still considerably higher (with 91.4 to 8.6 percent). Within this number of task oriented interactions the ratio between attempted answers and questions is almost equal to Bales’ average values (with 1 to 5.8 versus 1 to 6.1 percent). The values of 8 out of 12 interaction categories lie between Bales’ limits, among them Opinions hold the biggest share, which is analogous to the average values. The part of Suggestions is clearly outside the boundaries with a value of 24.7 beyond the upper limit of 11.0. Four categories have values below the lower limits: Tension release (1.1 versus 3.0), Agreement (1.1 versus 6.0), and Disagreement (0.0 versus 3.0). Facing these results it is obvious that the socio-emotional share of the interactions was below normal values. The question whether more interaction on socio-emotional level would contribute to better workshop and evaluation outcomes, cannot be answered based on the present data. Further evaluations are needed to enable comparison and comprehension.
PJM
evaluation values Bales‘
empirical norm values
Average values Suggested limits for profile
inspection
Solidarity 2.2 1.0 0.0 5.0
Tension release 1.1 7.3 3.0 14.0
Agreement 1.1 12.2 6.0 20.0
Suggestion 24.7 5.5 2.0 11.0
Opinion 34.4 30.0 21.0 40.0
Explanation 19.4 21.2 14.0 30.0
Asking for orientation 2.2 5.4 2.0 11.0
Asking for opinion 6.5 3.5 1.0 9.0
Asking for suggestion 4.3 0.8 0.0 5.0
Disagreement 0.0 6.6 3.0 13.0
Showing tension 4.3 4.4 1.0 10.0
Showing antagonism 0.0 2.4 0.0 7.0
Table 5. Average and case values for single interaction categories.

60
JIOS, VOL. 40, NO. 1 (2016), PP. 45-65
HÖBER, WEITLANER, AND PERGLER PERFORMANCE JOURNEY MAPPING: ...
6. Conclusion and Outlook
This article provides insight into a research project aiming at developing a PMS which considers the particular needs of both SMEs and services. The resulting PJM framework constitutes a unification of useful tools from different areas, i.e. service blueprinting, the BSC, and collaborative workshops. Its development rests upon the design science principles of Hevner et al. [6] to ensure that both the process itself and its outcome are scientific. It does, however, not clearly emerge from the explanations of the principles’ authors how a particular artefact should be evaluated. To overcome this shortage, the theory-driven development was incorporated. Against this backdrop, the PJM framework was built upon three theoretical foundations, namely technology acceptance [3], GST [5], and quality criteria of performance measures [22]. By this means it is possible to develop SME-specific service PMSs that are easy to implement, feature acceptance-triggering characteristics, and to foster support by the individual users in the company. The three theories simultaneously serve as the basis for the framework’s evaluation. The chosen approach for developing and evaluating a PMS for SMEs in the service environment is unique in its kind and, hence, makes an original scientific contribution.
Pilot testing and evaluation of PJM respectively took place in the field, i.e. the framework was applied in a small-scale enterprise offering IT-services. In order to ensure that on the one hand the evaluation results are valid as well as reliable and on the other hand both the framework’s results and its process are regarded, an own evaluation concept was designed using methodological triangulation and incorporating different perspectives. As already noted, the considered evaluation criteria were derived from the three theoretical pillars.
The results indicate that it is, indeed, possible to collaboratively create PMSs by means of PJM that are of high acceptance and take a motivating effect. This is not least attributable to the direct involvement of the affected employees in the process (shared commitment). However, some deficiencies – mainly connected to the quality criteria of the defined KPIs – were revealed which are accounted for by the (limited) setting of pilot testing to a greater extent. Especially due to time famine it was not possible to go once more through all service activities (partially done in haste) which led to a final imbalance of KPIs along both the activities and the BSC dimensions. The former circumstance might have also been caused by the larger number of participants and their distribution regarding their position.
Certain lessons learned arise in this connection for the PJM framework’s future application. The blueprint of the service to be performance-measured already needs to be available before starting the PJM workshop(s), as its development consumes additional amounts of time. It is also advantageous if this activity is performed jointly so that the involved staff possesses transparency regarding the blueprint’s structure and the service process itself. Moreover, terms used in the PJM framework should be clarified beforehand. All the points raised could be subsumed in a preceding “step 0” in the PJM process depicted in Figure 1. It might prove of use to define an upper limit of workshop participants to ensure that some groups and

61
JIOS, VOL. 40, NO. 1 (2016), PP. 45-65
JOURNAL OF INFORMATION AND ORGANIZATIONAL SCIENCES
service activities are not over or under-represented. It became evident that the idea of a bottom-up framework has not been reached yet. Further PJM workshops need to be performed in order to spot weather this circumstance was caused either by the methodology itself (future improvement) or the pilot company and the stakeholders involved (corporate culture). Finally, it should be noted that the resulting PMS (and its size) is contingent upon the granularity of the service blueprint. Especially in SMEs care has to be taken that the procedure does not lead to too complex PMSs and excessive demand. The more KPIs the greater the effort to ascertain them with limited resources available (unless automatic computation).A prioritization of KPIs may be a necessary activity in “step 3” as appropriate.
Taken all together this paper extends research in the field of PMS in the context of both SMEs and services. In consent to the request of learning from social and behavioral sciences and apply utilized methods also in the field of IS research, the evaluation of the PJM framework made use of methodological triangulation and examined theory-driven criteria from three different perspectives. This enabled not only valid results but extended the range of possible insights. The integration of qualitative and quantitative methods allowed for a broad picture of the workshop setting and its results that goes beyond the possibilities of exclusively quantitative or qualitative research. In addition, first steps have been taken in developing both SME-specific service PMSs and useful guidelines for those companies having limited resources at their disposal. From a practical point of view all these measures let to a framework for developing service PMSs for SMEs in a collaborative manner thereby fostering employee commitment. Moreover, transparency on the service process and (available) KPIs is improved and comprehension of performance on multiple levels (BSC) is provided.
PJM is actively further developed. The activities include the implementation of additional build-and-evaluate loops (in accordance with [6]), to iteratively optimize PJM based on the application experience in different industries and workshops as well as to further verify the three foundations of the theory-driven development.
In its original form, the PJM framework makes use of analogous tools such as posters, sticky notes, forms or pens. In order to increase the application independence in time and place, facilitate the PJM’s extensibility, and support history management, the PMS design process should also be feasible in a computerized manner. A first prototype was realized, on that account, in the form of a web application considering aspects of GST and TAM which was also evaluated. Taken as a whole, it was well received by the small test group, with potential for improvement exiting, though. This situation is not unusual for a prototypical artefact. The web application shall be enhanced in two major areas in future. First, the monitoring functionality of KPIs needs to be extended to the effect that not only the course of development is visible but also defined ranges of tolerance can be included to take additional corrective actions. Second, the web application requires interfaces to integrate it into the existing corporate system landscape as well as to utilize and automatically obtain available data. The feature of giving KPI feedback was already implemented which was perceived as motivating – this is in line with the findings of Bandura and Cervone [33]. Fine tuning regarding usability and

62
JIOS, VOL. 40, NO. 1 (2016), PP. 45-65
HÖBER, WEITLANER, AND PERGLER PERFORMANCE JOURNEY MAPPING: ...
functionality, however, still needs to be done. The implementation of these improvement measures would enhance the actual usage of the web application, as the users draw a larger profit from its utilization.
It is planned to evolve the KPI pool – a collection of key figures available as tool support for searching suitable KPIs – into a community-based platform. Members should be put into the position to assess single KPIs and, in further consequence, share their experience. With a sufficiently large data repository it would be possible to even realize a recommender system for KPIs. It was recognized within the scope of the web application’s pilot testing that the usefulness of the KPI pool could be sufficiently raised by a search box with autocomplete as well as an alphabetical sorting of the drop-down lists. Although KPI categories are available, the pool is currently perceived as too unclear.
What is more, PJM is presently extended in its scope (see [34]). Companies are frequently insecure when it comes to service pricing owing to a lack of applicable tools and methods supporting them in finding appropriate prices for their offered services. Value-based pricing approaches turned out to be superior to other ones but again proper tools and adaptations for service pricing are missing. The integration of value assessment and service pricing in the PJM framework and the development of a supporting tool set shall enable enterprises to perform value-based service pricing to obtain performance growth.
Acknowledgements
The research project was funded by the regional government of Styria, Department “Wissenschaft und Forschung” (Science and Research) within the “High Tech” funding program.
References
[1] E. Pergler et al., “Performance journey mapping: a tool-supported framework for service performance assessment in SMEs,” in Proc. of the Information Systems Development: Transforming Organisations and Society through Information Systems, Varaždin, Croatia, 2014.
[2] A. Höber et al., “Performance journey mapping: a service performance assessment framework, “ The Total Qual. Manage. J., vol. 27, no. 2, pp. 231-246, 2015.
[3] F. D. Davis, “Perceived usefulness, perceived ease of use, and user acceptance of information technology,” MIS Quart., vol. 13, no. 3, pp. 319-340, Sept. 1989.
[4] V. Venkatesh et al., “User acceptance of information technology: toward a unified view,” MIS Quart., vol. 27, no. 3, pp. 25-478, Sept. 2003.

63
JIOS, VOL. 40, NO. 1 (2016), PP. 45-65
JOURNAL OF INFORMATION AND ORGANIZATIONAL SCIENCES
[5] E. A. Locke and G. P. Latham, “Building a practically useful theory of goal setting and task motivation: a 35-year odyssey,” Am. Psychol., vol. 57, no. 9, pp. 705-717, Sept. 2002.
[6] A. R. Hevner et al., “Design science in information systems research,” MIS Quart., vol. 28, no. 1, pp. 75-105, Mar. 2004.
[7] A. Parasuraman et al., “SERVQUAL: a multiple-item scale for measuring consumer perceptions of service quality,” J. Retailing, vol. 64, no. 1, pp. 12-40, Mar. 1988.
[8] J. J. Cronin and S. A. Taylor, “SERVPERF versus SERVQUAL: reconciling performance-based and perceptions-minus-expectations measurement of service quality,” J. Marketing, vol. 58, no. 1, pp. 125-131, Jan. 1994.
[9] J. J. Cronin and S. A. Taylor, “Measuring service quality: a reexamination and extension,” J. Marketing, vol. 56, no. 3, pp. 55-68, July 1992.
[10] R. Ladhari, “A review of twenty years of SERVQUAL research,” Int. J. Quality Service Sci., vol. 1, no. 2, pp. 172-198, 2009.
[11] C. Rudd and Office of Government Commerce, ITIL V3 Planning to Implement Service Management. Norwich: The Stationary Office, Norwich, 2010.
[12] M. Marrone et al., “IT service management: a cross-national study of ITIL adoption,” Commun. Assoc. Inform. Syst., vol. 34, no. 1, pp. 865-892, 2014.
[13] B. McNaughton et al., “Designing an evaluation framework for IT service management, “ Inform. Manage., vol. 47, no. 4, pp. 219-225, May 2010.
[14] R. S. Kaplan and D. P. Norton, “The balanced scorecard: measures that drive performance,” Harvard Bus. Rev., vol. 70, no. 1, pp. 71-79, July 1992.
[15] E. Kreuzer et al., “The concept of service strategy scorecard - an integrated approach for lean service engineering and service improvement: theoretical framework and implications for service science,” in Proc. of the 2011 Naples Forum on Service - Service Dominant Logic, Network & Systems Theory and Service Science, Naples, Italy, 2011.
[16] S. Lee et al., “Using balanced scorecards for the evaluation of “software-as-a-service”,” Inform. Manage., vol. 50, no. 7, pp. 553-561, Nov. 2013.
[17] P. Jonsson and M. Lesshammar, “Evaluation and improvement of manufacturing performance measurement systems – the role of OEE,” Int. J. Oper. Prod. Man., vol. 19, no. 1, pp. 55-78, 1999.

64
JIOS, VOL. 40, NO. 1 (2016), PP. 45-65
HÖBER, WEITLANER, AND PERGLER PERFORMANCE JOURNEY MAPPING: ...
[18] S. Tangen, “Evaluation and revision of performance measurement systems,” Ph.D. dissertation, Dept. Prod. Eng., The Royal Inst. of Technol., Stockholm, Sweden, 2004.
[19] M. Bourne et al., “Designing, implementing and updating performance measurement systems,” Int. J. Oper. Prod. Man., vol. 20, no. 5, pp. 754-771, 2000.
[20] S. Globerson, “Issues in developing a performance criteria system for an organization,” Int. J. Prod. Res., vol. 23, no. 4, pp. 639-646, May 1985.
[21] P. Garengo et al., “Performance measurement systems in SMEs: a review for a research agenda,” Int. J. Manage. Rev., vol. 7, no. 1, pp. 25-47, Mar. 2005.
[22] A. Neely et al., “Performance measurement system design: developing and testing a process-based approach,” Int. J. Oper. Prod. Man., vol. 20, no. 10, pp. 1119-1145, 2000.
[23] V. Venkatesh et al., “Bridging the qualitative-quantitative divide: guidelines for conducting mixed methods research in information systems,” MIS Quart., vol. 37, no. 1, pp. 21-54, Mar. 2013.
[24] S. Sarker et al., “Qualitative studies in information systems: a critical review and some guiding principles,” MIS Quart., vol. 37, no. 4, pp. iii-xviii, Dec. 2013.
[25] K. Conboy et al., “Qualitative methods research in information systems: motivations, themes, and contributions,” Eur. J. Inform. Syst., vol. 21, no. 2, pp. 113-118, 2012.
[26] G. L. Shostack, “Designing services that deliver,” Harvard Bus. Rev., vol. 62, no. 1, pp. 133-139, Jan. 1984.
[27] R. G. Eccles, “The performance measurement manifesto,” Harvard Bus. Rev., vol. 69, no. 1, pp. 131-137, Jan. 1991.
[28] A. Neely et al., “Performance measurement system design: a literature review and research agenda,” Int. J. Oper. Prod. Man., vol. 25, no. 12, pp. 1228-1263, 2005.
[29] P. Watzlawick et al., Pragmatics of Human Communication: A Study of Interactional Patterns, Pathologies and Paradoxes. New York, NY: W. W. Norton & Co, 2014.
[30] H. Kromrey, Empirische Sozialforschung: Modelle und Methoden der standardisierten Datenerhebung und Datenauswertung, in German. Stuttgart: Lucius & Lucius, 2009.
[31] R. F. Bales, “A set of categories for the analysis of small group interaction,” Am. Sociol. Rev., vol. 15, no. 2, pp. 257-263, Apr. 1950.

65
JIOS, VOL. 40, NO. 1 (2016), PP. 45-65
JOURNAL OF INFORMATION AND ORGANIZATIONAL SCIENCES
[32] A. L. Strauss and J. Corbin, Basics of Qualitative Research: Grounded Theory Procedures and Techniques. Thousand Oaks, CA: Sage Publications, 1990.
[33] A. Bandura and D. Cervone, “Self-evaluative and self-efficacy mechanisms governing the motivational effects of goal systems,” J. Pers. Soc. Psychol., vol. 45, no. 5, pp. 1017-1028, Nov. 1983.
[34] E. Pergler et al., “Connecting value assessment and dynamic pricing of services to the performance journey mapping framework,” in Proc. of the Central European Conf. on Information and Intelligent Systems, Varaždin, Croatia, 2015.