performance improvement through benchmarking of water resources projects in maharashtra, india-a...
TRANSCRIPT

1

2
Benchmarking can be defined as
a systematic process for securing
continual improvement through
comparison with relevant and
achievable internal or external
norms and standards.

3
1. Managementa. Evaluation of performanceb. Management of resources (water,
manpower, finances)c. Policy decisions 2. Service provisiona. Efficiency, transparency and
accountabilityb. Commitment to excellence3. Usersa. Develop confidence about serviceb. Enhance Agricultural productivityc. Effective PIM

4
• Internal assessment of project.
• Comparison with the best performing project.
• Determining performance gap between
current practice and best practice.
• Selecting best practices and implementing
them.

5
6 Monitoring
and Evaluation
1Identification And Planning
2Data Collection
3Analysis
5 Action
4Integration
Benchmarking
Process

6
• Irrigation and drainage service providers operate in a natural monopoly environment.
• Irrigation and drainage entails complex and interacting physical, social, economic, political,
technical and environmental processes.
• Performance of irrigation and drainage schemes is site specific.

7
• Increasing water scarcity & competition between various sectors of water use.
• Need to improve the productivity of water in the agriculture sector (Rs/m3)
• Need to achieve financial sustainability of irrigation schemes & phase out State subsidy.
• Need to promote participatory management of schemes by the users.
• Need to establish a basis of accountability of the service providers.

8
The Maharashtra State Water
Policy advocates use of benchmarking
as a management tool for improving
the efficiency, transparency and
accountability of the personnel
responsible for providing services &
seeking participation of users.

9
Evaluation and improvement in
performance of
•Service Providers (Irrigation Circles)
•Irrigation projects
•Water Users’ Associations

10
Year Major Medium Minor Total Indicators
2000-01 6 - - 6 15
2001-02 30 26 28 84 10
2002-03 49 142 61 254 11
2003-04 49 144 69 262 12
2004-05 49 144 69 262 12
2008-09 48 145 69 262 12
2009-10 50 166 1052 1288 12

11
• Government of Maharashtra
• Water Resources Department at various levels of organisation
• GOM has institutionalised the benchmarking process
• A State level core group is formed.

12
• Some data required for various
performance indicators is collected
from the stakeholders.
• Benchmarking of WUAs is also being
carried out.

13
The indicators are for
a) System Performance
b) Financial Indicators
c) Agricultural Productivity
d) Environmental Aspects
e) Social Aspects

14
Sr.No
Indicator Objective
System Performance
1 Annual Irrigation Water Supply per unit Irrigated Area
To improve Water Use Efficiency
1a Annual Area Irrigated per unit of Water Supplied
-do-
2 Potential Created and Utilised To improve utilisation of potential developed
Agricultural Productivity
3 Output per unit Irrigated Area To Improve irrigated agricultural production
4 Output per unit Irrigation water supply
To improve productivity of water.

15
Financial Indicators
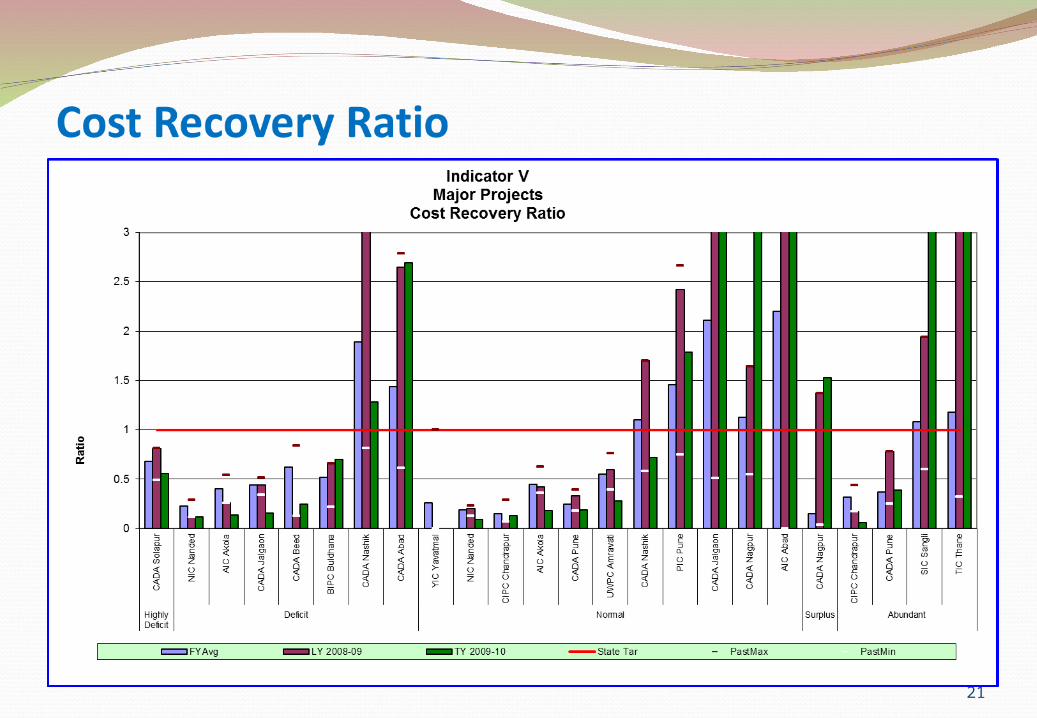
5 Cost Recovery Ratio To make the system self sustainable.
6 O & M Cost per unit Area
To minimise the O & M cost.
7 O & M Cost per unit water supplied
To minimise cost of supply of water.
8 Revenue per unit of Water Supplied
To Maximise the revenue. Every drop of water be used efficiently & economically.
9 Assessment Recovery Ratio
a) Irrigationb) Non irrigation
To check whether water charges for different uses are recovered fully or not.

16
Environmental Aspects
10 Land Damage Index To monitor land damage due to excess use of water & to adopt measures for reclamation of land.
Social Aspects
11 Equity Performance To ensure equity in distribution of water to head, middle & tail reach farmers.

17
Particulars
Year2002
Year2003
Year2004
Year2008
Year 2010
No.of Projects
6 84 254 262 1288
ICA covered
2,88,000 12,98,960 24,71,370
24,76,461
26,98,050
Reporting Format
Individual projects
Individual projects grouped by type & region
Grouped by type @ circle level
Grouped by type & plan group of basin
Grouped by type & plan group of basin

18

19

20
21

22

23

24
04/19/23
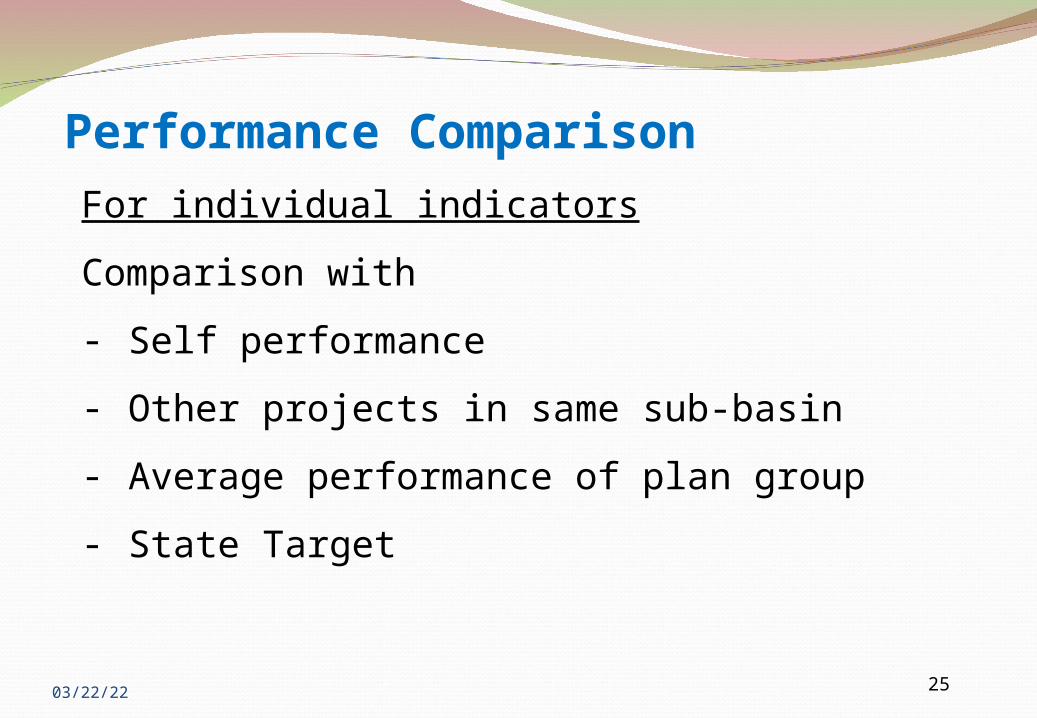
Performance Comparison
25
For individual indicators
Comparison with
- Self performance
- Other projects in same sub-basin
- Average performance of plan group
- State Target

TargetsIndicator Type Target value
I) Annual Irrigation Water Supply per unit Irrigated Area
a) Annual Area Irrigated per unit of Water Supplied
Major & MediumMinor
76926667
II) Potential Created and Utilised All 1
III ) Output per unit Irrigated Area (@ price level 1998-99 )
MajorMediumMinor
23000 to 3200023000 to 4000016000 to 36000
IV) Output per unit Irrigation water supply (@ price level 1998-99 )
MajorMediumMinor
2.69 to 4.162.99 to 5.42.4 to 5.4
26

v) Cost Recovery Ratio All 1
vi) O & M Cost per unit Area
MajorMediumMinor
125012001150
vii) O & M Cost per unit water supplied
Major & MediumMinor
0.160.17
viii) Revenue per unit of Water Supplied
Major & MediumMinor
0.180.19
27

Indicator Type Target value
ix) Assessment Recovery Ratio
a) Irrigationb) Non irrigation
Major No target
X) Land Damage Index All 1
XI) Equity Performance All 1
28

29
Coupling of benchmarking with water auditing Water Audit
• Water accounting & audit for all projects is now
compulsory.
• Profarmas are prescribed for maintaining water account
• Annual Water Account to be submitted to MWRDC
• Three Water Auditing Cells in MWRDC
• Manual for water auditing
• Annual inspection of divisions for verification

30
Calendar of Activities
Activity Scheduled Date
Submission of Water Accounts 14th August
Communication of Remarks 31st October
Compliance of remarks 30th November
Consolidation of data and Draft Report
15th January
Approval to Report 20th February
Publication 22nd March

How Are the Results Shared?
31
• Annual benchmarking report and water audit reports are published
• Report is available on websites (www.mahawrd.org & www.mwrdc.org)
• Circle wise results are discussed in meetings among water providers.
• State, Regional seminars / workshops are conducted.
• Reports are circulated to NGOs working in the field of public awareness about water use.

32
Useful management tool
Improvement of Water Use Efficiency
Increase in revenue.
Improvement in overall performance
Step towards self sustainability.

Water Use Efficiency
33
0
50
100
150
200
250
2000-01
2001-02
2002-03
2003-04
2004-05
2005-06
2006-07
2007-08
2008-09
2009-10
2010-11
Year
Ha/M
cu
m
ISP on CanalsISP on Wells

O & M Cost and Recovery
34
490450
377333
376453
416466
555
709745
195252
377 378448
413
494
627673
803746
0
100
200
300
400
500
600
700
800
900
2000-01 2001-02 2002-03 2003-04 2004-05 2005-06 2006-07 2007-08 2008-09 2009-10 2010-11
Year
Rs.
Cro
res
O&M Expenditure Recovery

35
Extending it further to Division and section level
Comparison with National and International schemes
Increasing participation of users in benchmarking process
Real time collection of data through ICIS

36
THANKs web site:- www.mahawrd.org & www.mwrdc.org