performance corporate scorecard - · pdf filethese performance targets are used to identify...
TRANSCRIPT

FREMANTLE PORTS ANNUAL REPORT 2012
18
Service Delivery
<1% 0.01% <5 3.7
Total vessels affected Average hours per delay
Inner Harbour – Container VesselUnavailability of Services
Unavailability of Berths
<12% 11% <20 24
Total vessels affected Average hours per delay
<1% 0% <5 0
Total vessels affected Average hours per delay
Kwinana Bulk TerminalUnavailability of Services
<25% 47% <80 85
Total vessels affected Average hours per delay
Unavailability of Berths
Kwinana Bulk JettyUnavailability of Services
<2% 0% <5% 0
Total vessels affected Average hours per delay
<25% 23% <50 67
Total vessels affected Average hours per delay
Unavailability of Berths
94% of shipping line customers satisfied or very satisfied with services provided by Fremantle Ports, based on shipping line/agents survey.
Maintain at least 80 to 90% overall customer satisfaction with agents/shipping lines.
RESULT 94%TARGET 80-90%
Customer Satisfaction
$13.346m profit after tax
$19.364m profit after tax
Financial Results
RESULTTARGET
Performance Corporate Scorecard
Each year in the Annual Report, Fremantle Ports publishes a range of key targets covering economic, social and environmental performance. These performance targets are used to identify and respond to emerging trends in trade development, measure Fremantle Ports’ capability for the future, monitor the financial performance of operations and ensure business excellence and sustainability. The following corporate scorecard shows the extent to which these business objectives were achieved.
Economic
Containers - Annual growth rate
9.8%
4%
How We Planned To Succeed
TARGET RESULT
Trade Results
Total trade - Annual growth rate
7.7%8.7%

FREMANTLE PORTS ANNUAL REPORT 2012
19
Performance Corporate Scorecard
Certification to ISO 14001 was maintained in external audit of safety, environment and quality management systems.
Continue to comply with ISO 14001, and further improve Environmental Management System
RESULT
Best practice environmental, safety and other business systems
Compliance with international environmental standard ISO 14001
TARGET
The number of risks rated greater than moderate increased from 22 to 27, with the increase largely attributable to a revision of risk ratings in this category.
Continue to implement treatment actions to ensure risk profile is reduced
RESULTOverall risk profile TARGET
9Zero lost time injuries RESULTTime lost to injuries TARGET
Lost time injury frequency rate was 15.3 compared with 19.4 the previous year.
20% reduction in lost time injury frequency rate.
RESULTTARGET
The number of workplace injuries was 64 compared with 74 the previous year.
Reduce workplace injuries.RESULTTARGET
Certification to AS/NZS 4801 (Occupational Health and Safety Management Systems) was maintained following a triennial audit in May 2012.
Maintain certification to AS/NZS 4801
RESULTTARGET
Social
Overall satisfaction (based on community survey results): Inner Harbour 59% Outer Harbour 69%
Support for the Inner Harbour in its role as a busy working port was: Inner Harbour 77% Outer Harbour 87%
70 to 80% overall satisfaction
RESULTCommunity satisfaction
TARGET
Complaints followed up with actions electronically monitored. Good progress made in reducing rail noise impacts with water spray used to lubricate the tracks.
Follow up all complaints and continue to implement improvement opportunities
RESULTActions on complaints and suggestions
TARGET

FREMANTLE PORTS ANNUAL REPORT 2012
20
Performance Service Delivery
OBJECTIVE: Providing reliable and efficient services that meet customer expectations
KEY OUTCOMES SOUGHT:• Understanding changing customer needs and being responsive to them.
• Successful completion of major projects.
New Export Opportunity RealisedUpgrading of export infrastructure at the Kwinana Bulk Terminal was completed during the year following the signing of commercial agreements with Australian-based company Mineral Resources Limited and Indian business conglomerate Lanco Infratech, new owner of Griffin Coal.
The $44 million project has improved export capacity and efficiency at this terminal, which is owned and operated by Fremantle Ports. It represents major benefits to Western Australia in terms of jobs creation, mining royalties and local spend on infrastructure, equipment and services.
Mineral Resources contributed most of the funding, with most of the installation of the new system undertaken by its construction arm, Crushing Services International.
Significant infrastructure works were required to provide the required increase in capacity at the terminal for handling iron ore. This included reinstatement of rail to accept standard gauge rolling stock, upgrading the train unloading system, new and upgraded conveyors, new product sample and weigh station, installation of a stacker, ship loader upgrading and provision of services such as electrical and water.
Under agreement with Fremantle Ports, Mineral Resources will export up to 4.4 million tonnes of iron ore, principally from its Carina mine site north east of Koolyanobbing in the Yilgarn Shire. The ore is railed to the Kwinana Bulk Terminal and the first shipment went out on 16 November 2011.
Griffin Coal has a capacity allocation for the export of 750,000 tonnes of coal annually for four years via the Kwinana Bulk Terminal and also contributed to the cost of the upgrading.
The project was delivered with a high level of local content and minimising impacts on other users of the terminal and the community was a priority in planning and implementing the works program.
The $44 million project has improved export capacity and efficiency at this terminal, which is owned and operated by Fremantle Ports. It represents major benefits to Western Australia in terms of jobs creation, mining royalties and local spend on infrastructure, equipment and services.
New export conveyor at the Kwinana Bulk Terminal

FREMANTLE PORTS ANNUAL REPORT 2012
21
Performance Service Delivery
Rous Head Development At year end, plans were well advanced for leasing the new land reclaimed at Rous Head as a by - product of the 2010 -11 Inner Harbour and channel deepening.
The 27 hectares, representing about 20 percent of the overall area of Rous Head, have provided an important opportunity to expand the availability of Inner Harbour land and to plan the area to improve landside access and efficiency. The overall aim is to ensure that the land uses complement port activity and contribute to operational efficiency.
Designs of works and services were completed during the year and preliminary ground works began in June 2012.
The reclaimed land has been split into five main parcels. One of these will be used as the truck marshalling area with an associated service station and truck stop amenities. The truck parking facility will provide much-needed improvement to traffic flows within the Rous Head area, especially during times when truck congestion occurs.
Two of the other areas will be used for container logistics, storage and short term warehousing and the others will be developed as empty container parks. Also included in the development will be a new public road along the seawall to improve community access to the North Mole.
Leasing and development of the new land is expected to be completed by the end of 2013.
Through the Western Australian Planning Commission, Fremantle Ports initiated an amendment to the Metropolitan Region Scheme to change the reservation for the newly reclaimed land at Rous Head from Waterways to Port Installation. This amendment has now come into effect.
Reclaimed land at Rous Head.
Preliminary ground works were scheduled to begin July 2012.
Shared bike / pedestrian path
Road for light vehicles to North Mole
Truck marshalling and facilities
Future rail terminalextension
Port Beach Rd
N
S E
WN
S E
W
Indian OceanIndian Ocean
Diagram shows new areas for leasing and development.

FREMANTLE PORTS ANNUAL REPORT 2012
22
Performance Service Delivery
Electrical Substation UpgradingA project to replace a high voltage sub station on North Quay is in progress. The sub station, which is beyond its economic serviceable life, will be replaced by two sub stations. This means that if there is a failure in one there will be automatic transfer to the secondary sub station, thus avoiding costly outages to port customers and tenants.
Remote switching capability will replace manual high voltage switching, removing electrical employees from the risk of apparatus failure during switching operations. Long - term service life and the installation of smart metering are among other benefits. Changes being made will enable more detailed reporting of energy consumption to help users reduce their carbon emissions.
The target completion date is December 2012
FenderingUpgrading of the fendering system on North Quay Berth 2 was completed in May 2012.
This common user berth, which is used for livestock exports and break bulk cargo such as steel and machinery imports, was built in 1949. The condition of the fendering, which protects the wharf from the impact of ships, had deteriorated to the point where replacement was essential.
The new system has been designed to be independent of the existing berth, which consists of a reinforced concrete deck supported by a timber sub-structure. The fendering can be incorporated into any future new wharf structure.
Fendering at the O’Connor Landing on Victoria Quay is subject to quite heavy wave action and had been loosened and damaged by ferries since the landing was constructed in 2001. Additional support to the fendering has been provided this year.
Unloader DamageFremantle Ports’ high capacity Siwertell ship unloader at the Kwinana Bulk Jetty was damaged in mid 2011. The vertical arm was bent when it slewed and came in contact with a ship’s hatch.
Temporary repairs involving some replating were carried out. A replacement conveyor arm has been manufactured locally and is due to be installed in October 2012.
Berth 2, North Quay has new fendering.
Temporary repairs enabled the Siwertell to go back into service.

FREMANTLE PORTS ANNUAL REPORT 2012
23
Performance Service Delivery
Rail Bridge ProtectionFremantle Ports participated in a risk assessment conducted by the Public Transport Authority (PTA) on the potential for vessels to collide with the Fremantle Rail Bridge. This followed an incident on 3 May 2011 when the bunkering vessel Parmelia 1 up came up against the bridge while manoeuvring in a strong tide and damaged the overhead power supply, putting the passenger and freight rail service out of action.
The PTA plans to install protective piers on either side of the bridge to reduce the risk of any future such marine incident occurring. Fremantle Ports is working with the PTA on the design development and will oversee the project under a Memorandum of Understanding.
A simulation study undertaken by the Harbour Master has confirmed that vessels with greater than 7 metres draft could not hit this bridge because of the protection provided by the Wangara shoal within the Harbour.
Woodman Point LighthouseThe Woodman Point Lighthouse, which assists the navigation of shipping, has been fitted with a more modern lighting system.
A green LED (light emitting diode) light with a range of 8 nautical miles was installed in May 2012 to replace the existing navigation light. The sector light delineates safe passage and is used by marine pilots to guide shipping into Woodman Channel, one of the two channels that can be used to access the Australian Marine Complex in Henderson and Alcoa at Kwinana.
A sector light facing Gage Roads has also been replaced with a green/white/red LED sector light that can be seen at night from a distance of 18 nautical miles.
This advanced navigational technology will increase reliability and reduce maintenance costs.
Asset & Infrastructure Mamanagement DivisionAsset Maintenance & Service Costs 2011/2012
33.9% Cargo Handling Equipment
12.0% Buildings and Improvements
4.8% Land Improvements
0.9% Railways2.2% Roads
15.2% Utilities
0.7% Land Unimproved
18.2% Interface Structures
3.0% Navigational Aids
0.5% Dredged Areas
8.6% Plant and Equipment
Fremantle Ports Asset & Infrastructure Management Division Asset Maintenance &
Service Costs 2011/2012
The Woodman Point Lighthouse was constructed in 1902.

FREMANTLE PORTS ANNUAL REPORT 2012
24
Performance Service Delivery
Maritime Security Identification Cards Fremantle Ports is an issuing agency for Maritime Security Identification Cards (MSIC), which are required under federal legislation for access to maritime security zones within the port area. Applications for the MSIC are referred to ASIO and the Australian Federal Police for background checks.
The total number of Fremantle Ports MSIC processed in 2011-12 financial year was 4676, with a further 6294 processed for regional ports in Western Australia.
Since the introduction of the Maritime Security Identification Card system on 1 May 2006, Fremantle Ports’ MSIC Service Centre has processed more than 50,000 applications.
To make the card renewal year process easier for MSIC holders at larger companies, Fremantle Ports has continued to operate a mobile unit so that applicants do not have to leave their workplaces to lodge their forms.

FREMANTLE PORTS ANNUAL REPORT 2012
25
Performance Capability for the Future
OBJECTIVE: Ensuring sound planning for all aspects of our business, including resources, services and infrastructure
KEY OUTCOMES SOUGHT:• Understanding future requirements of our various trade sectors
• Successful completion of important planning projects critical to our future
Port PlanningFremantle Ports released its Inner Harbour Port Development Plan in 2000 to guide the growth and development of Fremantle Harbour. Over the past decade, key initiatives have been implemented to ensure Fremantle Ports remains a sustainable 21st century port able to efficiently handle trade needs for the foreseeable future.
Planning was progressed this year on some of the remaining elements including:
• developing land at Rous Head and improving road layout (described in more detail elsewhere in this report);
• extending the rail terminal on North Quay to handle longer trains; and
• extending container terminal stevedoring areas to provide direct access to the rail terminal.
These initiatives will be implemented over the coming years.
Looking ahead to 2031, further planning has occurred this year to set out the priorities, challenges and opportunities. This work is taking into account State and local government planning documents and is being prepared to be consistent with broader planning as set out by Infrastructure Australia and the WA Planning Commission.
Based on current forecasts the Inner Harbour is likely to reach capacity by 2025, although this will depend on trade trends and other factors, and additional port facilities will be needed beyond that time to supplement its activities.
The State Government last year confirmed the long-term role of the Inner Harbour as a container and general cargo port and announced on 29 June 2012 that it was proceeding with a comprehensive assessment of the planning, environmental, transport and community issues associated with container port operations in the coastal areas from Naval Base to James Point. Extensive research undertaken by Fremantle Ports and other
Development planned for Rous Head will improve efficiency in container handling.

FREMANTLE PORTS ANNUAL REPORT 2012
26
Performance Capability for the Future
agencies over many years has identified this coastal area as the most suitable location for additional container-handling port facilities.
The Western Australian Planning Commission will engage a consultant to assess the project proposals that have been identified to date.
Victoria Quay WaterfrontThe Victoria Quay Waterfront Working Group, chaired by Stuart Hicks AO, was formed by Fremantle Ports in 2011 to review and consider new opportunities relating to the Commercial Precinct site on Victoria Quay as well as exploring development options for other sites within the Fremantle Waterfront Masterplan.
The Group’s report, which has been completed, sets out the key imperatives as seen by the Group to achieve the best possible outcomes for the onward development of the western end of Victoria Quay, mindful of the need to ensure that any development is compatible with the needs of the working port. Significant attention has been paid to the important aim of achieving successful integration with the Fremantle Railway Station and the City of Fremantle, and key learnings from the work to date on the development of the Victoria Quay Waterfront are included.
Some specific consultation on the potential development of the Commercial Precinct site will be the next step, with stakeholder groups and individuals invited to participate in this discussion.
Meanwhile, Victoria Quay branding, developed in consultation with community representatives, has been launched.
Planning Guidelines Reviewed Fremantle Ports’ Planning Guidelines for land use and development in the Inner and Outer Harbour areas have been reviewed and simplified.
The new version, completed in June 2012, is clearer and more user friendly, setting out the development criteria and how to make application to Fremantle Ports for planning approval.
The Planning Guidelines have been designed to:
• assist with the development and use of land within the port;
• ensure that development and uses within Fremantle Port boundaries are consistent with Fremantle Ports’ strategic plans and policies; and
• guide development and growth over the short and longer terms.
Landscape Style GuideA Landscape Style Guide has been produced by Fremantle Ports to help achieve a cohesive character in the working port environment.
A series of heritage banners has been produced as part of the Victoria Quay branding.

FREMANTLE PORTS ANNUAL REPORT 2012
27
OBJECTIVE: Promoting and facilitating trade and business growth opportunities
KEY OUTCOMES SOUGHT:• Maintaining existing trade and business and capturing new trade
and business opportunities
• Improving landside logistics performance
Working with Customers Fremantle Ports has continued to liaise closely with customers to understand their current and future needs. Regular meetings are held, with value chain analysis one of the techniques being used to understand what is critically important for business success for individual customers and how we can add value for them.
In the bulk business area, where there has been strong trade growth, we have continued to explore further opportunities to increase capacity through improved services and more efficient use of facilities. Planning for further development of the Kwinana Bulk Jetty has been put on hold following the State Government’s commitment to increase export capacity at the Port of Esperance.
Fremantle Ports is also working with customers to increase the efficiency of use of the on-berth storage areas for break-bulk (non-containerised) cargoes. Break-bulk trades contribute significantly to the port’s economic performance particularly when that contribution is measured in terms of dollar value per square metre of wharf space occupied. This is another sector of our business continuing to experience strong growth, creating unprecedented demand for stacking space.
The demolition of a large shed on common-user Berth 12 on North Quay was completed in September 2011, opening up more space for cargo handling and enabling improved efficiency in cargo discharge and loading.
The feasibility of tiered decking for temporary storage of new motor vehicles is being explored to create more stacking space for that industry on Victoria Quay and to free up more space for the increasing volume of project-related cargo being imported through Fremantle.
Performance Trade and Business Growth
Catering for trade growth is a focus of customer liaison.

FREMANTLE PORTS ANNUAL REPORT 2012
28
Performance Trade and Business Growth
Forums organised by Fremantle Ports for break bulk customers this year have been useful in understanding what is working well and where there are issues of concern, with suggestions for improvement.
Customer satisfaction levels measured in annual surveying this year were within or above target ranges.
New Customer Relationship Management SystemA new and much improved information technology system for tracking customers, other contacts and stakeholders was developed during the year. Replacing an older, less efficient system, the new web-based Contact Relationship Management System makes it easier to maintain contact details and to keep track of interaction with customers and other stakeholders.
Two of the big advantages of the system are its capacity to integrate with other data systems used by Fremantle Ports and the ease with which information can be retrieved in useable formats.
The new system, which is being progressively introduced, integrates with Microsoft Outlook, making it easy to access and quick to update as details change and new information needs to be included.
Landside Logistics Fremantle Ports has continued to work with the Department of Transport, Main Roads WA, the Public Transport Authority and industry on a number of activities to make freight transport to and from the port more efficient.
One of the key strategies is to increase the amount of freight moved by rail. This reduces the growth of truck traffic, reduces road congestion and is important for the amenity of people living near road links to the port.
The rail share for container trade travelling to and from the port has made up ground lost in the trade downturn which occurred as a result of the global financial crisis. The volume of container trade on rail this year averaged 13 per cent, up from 11.5 per cent last year. This is the equivalent of some 85,000 standard containers, compared with 69,000 the previous year. In the last quarter of this financial year, the rail share was about 15 per cent.
Despite the continuing per box subsidy from the State Government, current commercial realities favour road over rail, hence the importance of other strategies such as increased efficiency to make rail commercially more attractive for users and service providers. A competitive tender process was undertaken during the year for the provision of rail services and the operation of rail terminals at North Quay and Kewdale/Forrestfield. In evaluating proposals, considerable weight has been given to efficiency improvements and strategies for achieving market share growth. A preferred tender has been identified.
Increased use of rail for container freight transport compares favourably with other Australian capital city ports.

FREMANTLE PORTS ANNUAL REPORT 2012
29
Performance Trade and Business Growth
Significant rail infrastructure development is planned to meet future increase in rail volume and to improve competitiveness. This includes the extension of the North Quay Rail Terminal to take longer trains and provision for a crossing loop for trains on the North Fremantle/Cockburn line to improve line capacity.
Improvements in truck productivity have focused on the container terminal vehicle booking system to improve scheduling. A key aim, working with industry, is to increase two-way loading of trucks (delivering a container and departing with another on the same journey).
The newly-reclaimed land at Rous Head offers a unique opportunity to improve the overall supply chain through planning and design of lots, selection of the right blend of functions on these lots and the use of lease provisions to promote operations that will contribute to overall supply chain efficiency. The tendering process for this land progressed during the year to a point where key developments are expected to begin during 2012-13.
Discussions are continuing with industry to address empty container park issues, in particular the scope for developing more inland container parks. This would reduce the need for trucks to come to the port to pick up or deliver empty containers. Other significant initiatives include the introduction of a booking system to smooth out the flow of trucks to the parks, and shifting high volume container movements to off-peak times to reduce demand on container parks and terminals.
Such measures involve changes to long-standing industry practices and require significant consultation and development. Fremantle Ports will continue to work with other members of the WA Freight and Logistics Council, the WA Port Operations Task Force, Department of Transport and industry to achieve the necessary changes.
TE
Us
(Tho
usan
ds)
Market Share of Container on Rail - TEU2002/03 to 2011/12
0
100
200
300
400
500
600
700
2011/122010/112009/102008/092007/082006/072005/062004/052003/042002/03
Rail 11
2%
98%
3%
97%
7%
93%
6%
94%
4.5%
95.5%
8%
90%
13%
87%
15%
85%
11%
89%
11%
89%
28 26 20 42 77
354 375 409 426 464 503
85
480
61
496
68
522
87
564Road
Market Share of Containers on Rail
TEUs 2002/03 to 2011/12
Improved truck productivity increases port efficiency and reduces community impacts.

FREMANTLE PORTS ANNUAL REPORT 2012
30
Performance Trade and Business Growth
Freight Studies
A new study to provide current information on the origin and destination of containers travelling to and from Fremantle Port was completed in March 2012.
The work was undertaken by Fremantle Ports with assistance from the Department of Transport, Main Roads WA and the Freight and Logistics Council of Western Australia. It updates information from the March 2004 Origin and Destination Study which has provided the basis for Fremantle Port-related supply chain decision making since that time.
The main aim of the Fremantle Ports Container Movement Study 2012 was to gain an up-to-date understanding of the transport, storage and distribution of full import and export containers as well as the movement of empty containers. The findings will assist in improving industry planning.
On behalf of the WA Port Operations Task Force, Fremantle Ports also undertook a study of exporters of containerised cargo using Fremantle Inner Harbour.
The aim of the Fremantle Port Exporter Survey 2011 was to better understand exporter views on the container export chain and, in particular, to explore the potential for development of off-port facilities.
One of the primary ways in which congestion can be managed is to develop more container handling facilities away from the port, thus reducing the need for importers and exporters to send trucks to Fremantle. At present, the only significant off-port facilities are the rail terminal and associated container park located at Forrestfield. Until recently, these have been under-used but at current rates of growth, their capacity will start to be challenged over the next 12 to 19 months (hence the importance of the rail initiatives mentioned).
Rous Head MarinaFremantle Ports, in consultation with the WA Department of Transport, has been actively progressing plans for the development of a recreational marina at Rous Head. This is in support of the State Government’s commitment to address the need for more boat pens.
Following preliminary planning and feasibility analysis by Fremantle Ports, 11 proposals were received in response to a public request for expressions of interest.
Short-listed proponents were invited to prepare more detailed proposals under a request for proposals process, which concluded in September 2011.
Negotiations with a preferred proponent for development of the proposed marina have begun. The focus is on agreeing the terms of a development agreement and associated long term lease under which the proponent will develop and operate the proposed facility.

FREMANTLE PORTS ANNUAL REPORT 2012
31
International 5 5 7 11 7 8
13 8 18 5 9 17
14
14
14
25
11
18
17
23
13
19Home Base
Ves
sels
0
5
10
15
20
25
30
est 12/1320011/1220010/112009/102008/092007/082006/072005/062004/052003/042002/03
Cruise vessels visiting Fremantle Ports
Cruise Vessels Visiting Fremantle Port
Performance Trade and Business Growth
The integrated marina will combine high quality recreational boating facilities with complementary landside commercial development.
Cruise ShippingThe popularity of Fremantle Port as a destination for cruise ships is continuing, with 40 visits in 2011-12.
The total number of calls was impacted by the cancellation of nine planned visits by the Pacific Sun in the second half of 2012, with a further nine that had been scheduled for 2013. This followed an announcement by Carnival Australia that the ship had been sold and her cruises in Australia would cease in July 2012.
Among the highlights were two visits from Queen Mary 2 on 8 and 28 February and first time visits from Celebrity Century and Costa Deliziosa.
At the time of preparation of this report, 32 cruise ship visits had been scheduled for 2012-13. One of the visitors calling for the first time at Fremantle will be the huge cruise liner, Voyager of the Seas, which carries up to 3,500 passengers.
Transit Pax 20,492 10,386 4,954 8,181 2,920 9,000
850 3,669 3,775 2,933 3,700 11,500
13,788
12,080
17,763
37,127
11,134
20,508
14,705
37,207
9,321
30,293Disembarking Pax
Pas
seng
ers
0
5000
10000
15000
20000
25000
30000
35000
40000
est 12/1320011/1220010/112009/102008/092007/082006/072005/062004/052003/042002/03
Passengers visiting Fremantle Port
950 1,745 4,060 2,991 3,500 12,500 12,366 37,644 20,679 38,053 30,400Embarking Pax
Passengers through Fremantle Port
Crystal Serenity and Celebrity Century were in port on 17 February 2012.

FREMANTLE PORTS ANNUAL REPORT 2012
32
Performance Trade and Business Growth
Trade Results Total port trade reached a record 28.2 million tonnes in 2011-12, 7.9 per cent up on the 26.1 million mass tonnes in 2010-11. The main reason for the increase in trade volumes in 2010-11 was a rise in Outer Harbour bulk exports, particularly iron ore and grain exports.
Total imports increased by 0.5 million tonnes or 4.1 per cent and total exports increased by 1.5 million tonnes or 11.8 per cent for this period.
Bulk cargo contributed 20.9 million mass tonnes or 74.2 per cent of total port trade in 2011-12, 0.5 per cent higher than last year. Bulk grains and oilseeds exports increased by 1.1 million tonnes or 41.4 per cent following the Western Australian crop of around 15 million tonnes in 2011-12. The port’s principal bulk cargo, petroleum products, decreased from 8.6 million mass tonnes in 2011-12 to 8.1 million mass tonnes in 2011-12. Crude petroleum imports were at a similar level to last year. Refined petroleum imports increased by 23.8 per cent and refined petroleum exports (including bunkers) decreased by 20.4 per cent.
Total value of trade through Fremantle Ports in 2011/12 was $30.1 billion.
Inner Harbour imports increased by 15.5 per cent and exports decreased by 5.5 per cent. Total containers handled increased by 9.8 per cent in 2011-12 to 656,912 TEU, an increase of 58,378 TEU on the previous year. Container trade is almost five times the level in 1991-92, representing an average annual growth of 8.4 per cent for this period.
Non container cargoes in the Inner Harbour increased by 10.2 per cent compared with the previous year. Imports increased significantly by 43.6 per cent compared with the previous year, mainly due to industrial and
Total Port Trade 2002/2003 to 2011/2012
0
5
10
15
20
25
30
11/1210/1109/1008/0907/0806/0705/0604/0503/0402/03
Imports 11.023 11.727 11.434 11.175 12.010 13.009 12.545 12.103 13.091
Exports
Total
13.632
Mas
s T
onn
es (
Mill
ions
)
12.467 14.212 14.112 13.937 13.043 13.122 14.058 14.065 13.032 14.580
23.490 25.939 25.546 25.112 25.053 26.131 26.603 26.168 26.123 28.212

FREMANTLE PORTS ANNUAL REPORT 2012
33
Performance Trade and Business Growth
agricultural vehicles, other transport equipment, new motor vehicles and iron and steel products. Exports decreased by 12.8 per cent compared with last year mainly due a decline in animal feeds and livestock.
In volume terms the port’s principal export commodities are grain, alumina, iron ore, refined petroleum and coal which together account for 76.9 per cent by volume of total exports.
Major Trading Regions Trade with East, South East and Southern Asia amounted to 58.9 per cent of total port trade in 2011-12, 1.9 percentage points higher than 2010-11. Over the period 2001-02 to 2011-12, trade with East, South East and Southern Asia has grown from 45 per cent to 59 per cent of Fremantle’s total trade.
Trade with East Asia increased by 40.1 per cent compared with last year due only to an increase of 70.3 per cent in trade with China. Trade with Japan, South Korea and Taiwan decreased compared with last year. South East Asia trade has by increased by 1.3 per cent mainly due to trade with Thailand and Vietnam. Trade with Indonesia, Malaysia and Singapore decreased compared with last year.
Australian coastal cargo accounts for 13 per cent of total port trade, the Middle East accounts for 16 per cent, UK and Europe five per cent, North America four per cent, Africa two per cent and New Zealand one per cent.
A cautionary note is that some of these figures could be deflated because of trans-shipments through Singapore. (A graphical presentation showing the link with world trade is shown in the appendix of Statistical Information).
6% Iron Ore
2% Barley
1% Manufacturers of Metal
1% Canola Seed1% Metal Scrap
1% Animal Feeds
1% Sulphur
2% Iron and Steel Products
2% Chemicals and Related Products
2% Phospahtes - Fertilisers
3% Caustic Soda
3% Cement Clinker
2% Black Coal
11% Wheat
10% Alumina
23% Other
28% Petroleum
Principal Commodities Imports/Exports 20011/2012
Principal Commodities Imports/Exports 2011/2012
Coal and iron ore stockpiles at the Kwinana Bulk Terminal.

FREMANTLE PORTS ANNUAL REPORT 2012
34
Performance Trade and Business Growth
ImportsTotal imports increased by 4.1 per cent during 2011-12 to 13.6 million tonnes. Inner Harbour imports increase by 15.5 per cent mainly due to a rise in containerised and non containerised cargo.
The main commodities responsible for the increase are industrial and agricultural vehicles, manufactures of metal and iron steel products. Imports in the Outer Harbour decreased by 0.2 per cent mainly due to crude petroleum and cement clinker. Outer Harbour commodities to increase significantly were refined petroleum, urea ammonium nitrate, and fertilisers.
New motor vehicle imports through Fremantle Ports totalled 104,451 units in 2011-12, an increase of 13.0 per cent on the previous year. New motor vehicle imports from Japan and South Korea increased by 28.2 per cent and 18.7 per cent respectively in 2011-12 compared with last year. Japan’s share of total motor vehicle imports was 42.0 per cent in 2011-12 compared with 37.0 per cent last year. Imports from South Korea and Thailand accounted for 18.3 per cent and 15.9 per cent of the total respectively. Motor vehicle imports from Europe increased by 39.0 per cent compared with last year and accounted for 11.2 per cent of the total.
0
10000
20000
30000
40000
50000
60000
70000
80000
90000
100000
110000
120000
11/1210/1109/1008/0907/0806/0705/0604/0503/0402/03
Veh
icle
s
New Mototr Vehicles - Imports 2002/03 to 2011/12
Vehicles 51,680 61,745 69,845 85,556 103,734 104,253 75,348 94,933 92,545 104,541
New Motor Vehicles - Imports 2002/2003
to 2011/2012
Vehicle imports temporarily stored on Victoria Quay

FREMANTLE PORTS ANNUAL REPORT 2012
35
Performance Trade and Business Growth
Import Cargo Classified According to Cargo Class
- Thousands of Tonnes
Bulk 2010-11 2011-12
Petroleum Crude 5,536 5,360
Petroleum Refined 743 920
Caustic Soda 784 790
Cement Clinker 959 766
Phosphates - Fertilisers 447 541
Sulphur 418 348
Urea 116 193
Slag Residue Ex Steel Furnace 194 191
Urea Ammonium Nitrate (Uan) 36 143
Ammonia 117 128
Other 268 212
Totals 9,619 9,594
Non Container General Cargo 2010-11 2011-12
Vehicles - Industrial and Agricultural 83 187
Iron and Steel Products 157 175
Motor Vehicles - New 145 167
Other Transport Equipment and Parts 24 57
Machinery - Agricultural, Industrial 29 37
Miscellaneous Manufactured Articles 2 20
Ammonium Nitrate 0 20
Manufactures of Metal 7 16
Rubber Manufactures 9 15
Lime 6 4
Other 9 6
Totals 471 706
Container 2010-11 2011-12
Iron and Steel Products 312 375
Chemicals and Related Products 356 353
Manufactures of Metal 169 256
Paper, Paperboard and Articles of Paper Pulp 197 167
Machinery - Agricultural, Industrial 174 163
Plastic Wares and Other Manufactures 136 150
Furniture 119 128
Bricks, Tiles, Pavers, etc 126 117
Rubber Manufactures 89 114
Ale, Beer and Stout; Cider (Alcoholic) 101 111
Other 1,234 1,400
Totals 3,013 3,334
Loading gypsum at the Kwinana Bulk Terminal
Unloading from a roll-on roll-off (Ro-Ro)ship at North Quay

FREMANTLE PORTS ANNUAL REPORT 2012
36
Performance Trade and Business Growth
ExportsTotal exports increased by 11.8 per cent during 2011-12 to 14.6 million tonnes. Inner Harbour exports decreased by 5.5 per cent compared with the previous year. Non containerised cargo decreased 12.8 per cent in 2011-12 mainly due to livestock and animal feeds. Containerised cargo decreased by 3.6 per cent in 2011-12 mainly due to falls in mineral sands, titanium dioxide and wheat.
Outer Harbour exports increased by 18.5 per cent mainly due to the increase of coarse grains and iron ore. Bulk wheat exports increased by 19.3 per cent or 465,159 tonnes in 2011-12. Bulk exports of barley and canola seed increased by 505,492 tonnes and 169,405 tonnes respectively compared with the previous year.
In 2011-12 Fremantle Ports’ major overseas export markets by volume (percentage of total exports) were China, 32.6 per cent, Japan 7.6 per cent, South Korea 6.3 per cent, Indonesia 6.1 per cent, Malaysia 3.5 per cent, Singapore 3.4 per cent and Thailand 3.2 per cent. Exports to China increased by 13.6 per cent in 2011-12 and represent 4.75 million tonnes or 32.6 per cent of total exports, making China Fremantle’s principal export trading partner. Iron ore and alumina are the major exports to China representing 1.8 million tonnes and 1.2 millions tonnes respectively in 2011-12. Iron ore exports to China are estimated to grow to 4 million tonnes within 5 years.
Exports to other Australian ports were 2.1 million tonnes in 2011-12, 8.7 per cent lower than last year, predominantly due to a decrease in refined petroleum exports.
Livestock exports decreased significantly in 2011-12.
FREMANTLE PORTS ANNUAL REPORT 2012
37
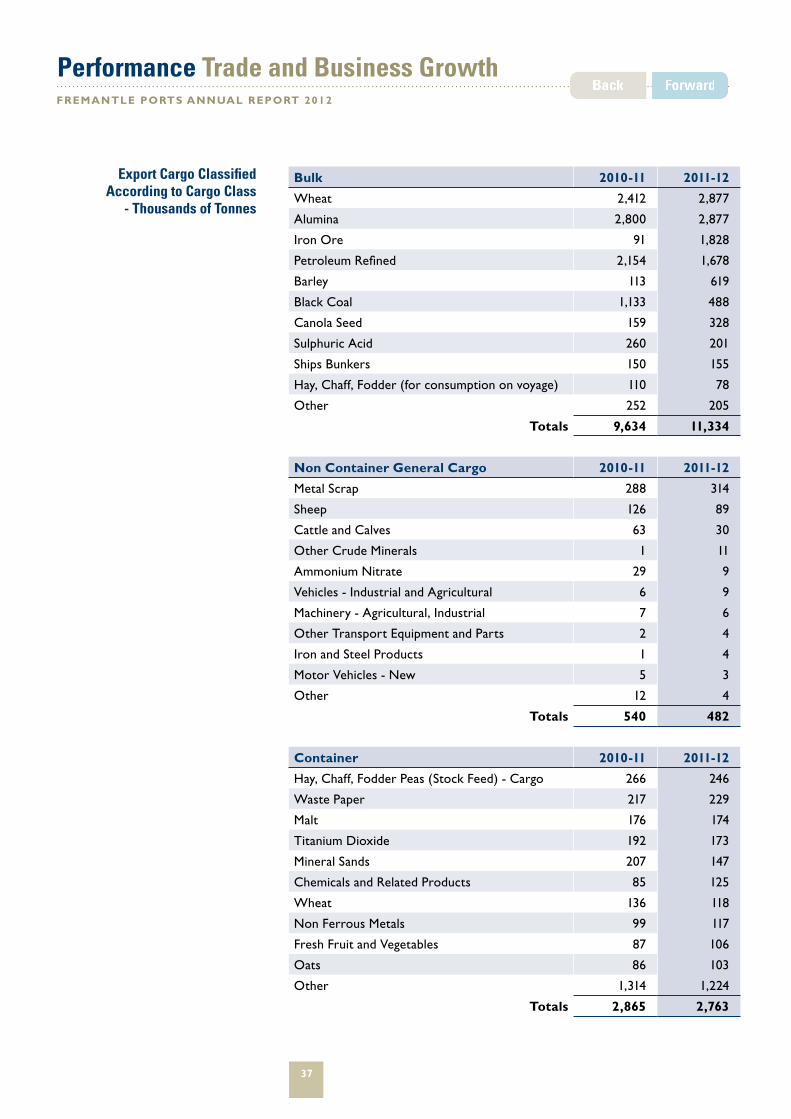
Performance Trade and Business Growth
Export Cargo Classified According to Cargo Class
- Thousands of Tonnes
Bulk 2010-11 2011-12
Wheat 2,412 2,877
Alumina 2,800 2,877
Iron Ore 91 1,828
Petroleum Refined 2,154 1,678
Barley 113 619
Black Coal 1,133 488
Canola Seed 159 328
Sulphuric Acid 260 201
Ships Bunkers 150 155
Hay, Chaff, Fodder (for consumption on voyage) 110 78
Other 252 205
Totals 9,634 11,334
Non Container General Cargo 2010-11 2011-12
Metal Scrap 288 314
Sheep 126 89
Cattle and Calves 63 30
Other Crude Minerals 1 11
Ammonium Nitrate 29 9
Vehicles - Industrial and Agricultural 6 9
Machinery - Agricultural, Industrial 7 6
Other Transport Equipment and Parts 2 4
Iron and Steel Products 1 4
Motor Vehicles - New 5 3
Other 12 4
Totals 540 482
Container 2010-11 2011-12
Hay, Chaff, Fodder Peas (Stock Feed) - Cargo 266 246
Waste Paper 217 229
Malt 176 174
Titanium Dioxide 192 173
Mineral Sands 207 147
Chemicals and Related Products 85 125
Wheat 136 118
Non Ferrous Metals 99 117
Fresh Fruit and Vegetables 87 106
Oats 86 103
Other 1,314 1,224
Totals 2,865 2,763

FREMANTLE PORTS ANNUAL REPORT 2012
38
Performance Trade and Business Growth
Container Trade When compared with 2010-11:
• Total container trade increased by 9.8 per cent. Exports increased by 8.4 per cent and imports increased 11.0 per cent.
• Full container exports decreased by 4.8 per cent or 8,111 TEU and full imports increased by 12.5 per cent or 36,789 TEU.
• Empty container exports increased by 27.0 per cent and empty imports decreased by 14.8 per cent.
• Coastal container throughput increased by 9.0 per cent or 6,112 TEU. Coastal full container throughput totalled 62,276 TEU, a decrease of 0.8 per cent.
Imports 258,738 299,075 287,962
247,081 281,270 277,529
505,819 580,345 565,491
288,463
268,980
557,443
310,180
288,354
598,534
344,453
312,459
656,912
Exports
Total
TE
Us
TEUs - Twenty foot equivalent unitsGrowth p.a. 2006/07 to 2011/12 - 5.4%
050000
100000
150000
200000
250000
300000
350000
400000
450000
500000
550000
600000
650000
700000
2011/20122010/112009/102008/092007/082006/07
Container Trade Comparison 2006/2007
to 2011/2012
Imports 234,894 255,713 255,765 263,815 293,210 329,999
164,228 198,842 190,791 178,892 168,869 160,758
399,122 454,555 446,556 442,707 462,079 490,757
Exports
Total
TE
Us
TEUs - Twenty foot equivalent unitsGrowth p.a. 2006/07 to 2011/12 - 4.2%
0
100000
200000
300000
400000
500000
600000
2011/122010/112009/102008/092007/082006/07
Full Container Trade Comparison 2006/2007
to 2011/2012

FREMANTLE PORTS ANNUAL REPORT 2012
39
Performance Trade and Business Growth
Top Ten Container Commodities Imported and Exported
Major Container Commodities Imported - TEUCommodities 2010/2011 2011/2012 Variance %
Furniture 27,811 30,768 10.63%
Manufactures of Metal 16,975 25,352 49.35%
Iron and Steel Products 20,402 25,180 23.42%
Machinery - Agricultural, Industrial (i) 30,660 21,923 -28.50%
Chemicals and Related Products 20,273 19,995 -1.37%
Plastic Wares and Other Manufactures 17,027 18,319 7.59%
Paper, Paperboard and Articles of Paper Pulp 20,171 17,324 -14.11%
Rubber Manufactures 12,985 16,341 25.85%
Household Appliances (i) - 12,832 -
Unclassified Goods 13,593 10,679 -21.44%
Fabricated Construction Materials 9,277 10,262 10.62%
Total 189,174 208,975 10.47%
Percentage of Total Full TEU Imports 64.5% 63.3%
(i) Machinery - Agricultural, Industrial - excludes Household Appliances as from 01/07/2011
Major Container Commodities Exported - TEUCommodities 2010/2011 2011/2012 Variance %
Waste Paper 19,349 19,969 3.20%
Hay, Chaff, Fodder Peas (Stock Feed) - Cargo 20,993 19,165 -8.71%
Malt 11,995 12,567 4.77%
Titanium Dioxide 9,391 8,423 -10.31%
Chemicals and Related Products 6,052 7,574 25.15%
Fresh Fruit and Vegetables 6,108 6,887 12.75%
Oats 5,522 6,417 16.21%
Mineral Sands 8,664 5,947 -31.36%
Unclassified Goods 4,131 5,761 39.46%
Non Ferrous Metals 4,695 5,482 16.76%
Metal Scrap 5,308 5,319 0.21%
Wheat 5,681 5,066 -10.83%
Total 107,889 108,577 0.64%
Percentage of Total Full TEU Exports 63.9% 67.5%
The strong Australian dollar was a significant factor in the growth in containerised imports.

FREMANTLE PORTS ANNUAL REPORT 2012
40
Performance Trade and Business Growth
Fremantle’s Trading PartnersFremantle Ports’ top 10 overseas trading partners collectively account for 64.1per cent of total non trans-shipment full container trade (refer table below). Australian coastal container trade accounts for a further 12.7 per cent.
Live sheep
1,785,320 head of live sheep were exported through the Port of Fremantle in 2011/12, a decrease of 484,421 head or 21.3 per cent compared with 2010/11.
Top Ten Container Trading Partners
Percentage of Total Full Container Trade
Country 2010/2011 2011/2012
China 119,338 133,452
Japan 34,711 28,847
Malaysia 22,494 25,491
South Korea 19,617 24,662
Indonesia 22,690 21,801
Thailand 20,729 21,339
United States of America 17,496 21,300
Singapore (i) 22,367 18,579
Vietnam 9,917 10,165
India 8,521 9,045
Top 10 Countries Percentage of Total Country Trade 62.9% 64.1%
Excludes all trans-shipment and empty containers Note: (i) Hub port: May include cargo trans-shipped through Singapore to and from other destinations and origins.
LivestockLivestock Exports 2011/2012
Destination Sheep CattleOther
Livestock Total% of
Total
Africa 2,093 2,093 0.11%
Asia - East 1,071 1,071 0.06%
Asia - South-East 12,539 12,539 0.67%
Asia - Southern 1,635 1,635 0.09%
Indian Ocean - Mauritius 1,366 4,887 6,253 0.33%
Russia 2,531 2,531 0.13%
Middle East 1,649,616 55,432 1,705,048 90.59%
Mediterranean - Turkey 134,338 16,716 151,054 8.03%
Totals 1,785,320 96,904 0 1,882,224 100%

FREMANTLE PORTS ANNUAL REPORT 2012
41
Performance Trade and Business Growth
0.0
0.5
1.0
1.5
2.0
2.5
3.0
3.5
2011/122010/112009/102008/092007/08
2.98 3.10 2.23 2.27 1.79
Live Sheep Exports2077 / 2008 to 2011/2012
Hae
d o
f Liv
e S
heep
(M
illio
ns)
Live Sheep Exports 2007/2008 to 2011/2012
Fremantle Ports’ share of total Australian live sheep exports was 70 per cent in 2011/12, compared with 77 per cent in 2010/11. The value of live sheep exports through Fremantle Ports in 2011/12 was $239 million. Exports from Australia during 2011/12 were 2.56 million head, 12.2 per cent lower than the previous year. The Middle East was the destination of almost all of Australian live sheep exports in 2011/12.
Kuwait was the largest export market for Australian live sheep in 2011/12 with 0.9 million head exported, followed by Qatar, Bahrain, Jordan, Turkey, Israel and United Arab Emirates.
Source of total Australian live sheep export statistics and value of trade: Australian Bureau of Statistics.
Live Cattle
Live cattle exports from Fremantle reached 96,904 head in 2011/12, a decrease of 113,613 head or 54.0 per cent on 2010/11.
Fremantle Ports’ share of total Australian live cattle exports was 14.3 per cent in 2011/12. The value of live cattle exports through Fremantle Ports in 2011/12 was $A86 million.
In 2011/12, the largest export markets served from Fremantle were Israel, Indonesia and Turkey which account for 84.2 per cent of total live cattle exports.
Source of information on live cattle trade: Australian Bureau of Statistics; Meat and Livestock Australia.
OutlookTreasury ProjectionsThe Western Australian economy continues to outperform the rest of Australia, reflecting strong global demand for the State’s resource exports. Business investment and exports are dominant influences on the State’s

FREMANTLE PORTS ANNUAL REPORT 2012
42
Performance Trade and Business Growth
economic growth, resulting in strong labour demand and wage growth, and above-average population growth.
The demand for Western Australia’s resource commodities has led to a number of major LNG and iron ore projects currently under construction, as firms seek to develop and expand capacity.
Household spending in Western Australia has increased at a faster pace than the rest of Australia, supported by low unemployment, higher incomes due to strengthening real wages, and a high Australian dollar. By contrast, housing demand has been soft over the past year, reflecting the large balance of household debt, heightened levels of household caution, and tight lending conditions. However, a strong recovery in dwelling investment is forecast for 2012-13 as underlying demand improves, supported by strong population growth.
Consequently, Gross State Product (GSP) is forecast to increase by a robust 4.75% in 2012-13. Increases in business investment over this period are likely to be offset to some extent by higher imports of capital machinery and equipment imports. Export volumes are expected to pick up in the out years, as major iron ore and LNG projects commence production.
Data: Government of WA 2012-2013 Budget, Economic and Fiscal Outlook, Budget Paper No. 3.
Trade in 2012-13 International trade growth in Western Australia’s major export markets is expected to remain robust, and stronger than the rest of the world. Nonetheless, the weak demand from advanced economies is likely to weigh on growth in emerging economies, with growth in China expected to soften slightly this year.
The growth in exports in 2011-12, reflected strong demand for Western Australia’s iron ore export and other exports, including a significant pick-up in agricultural exports resulting from improved weather conditions over 2011. Western Australia now accounts for around 45 per cent of Australia’s exports.
Imports grew strongly in 2011-12. The growth in imports also reflects stronger household consumption and the historically high Australian dollar, which is forecast to stay close to parity with the US dollar in both years.
Following a slight decrease in 2010-11, Fremantle Ports’ new motor vehicle imports increased by 13.0 per cent in 2011-12 compared to 2010 -11. Further growth is expected in new motor vehicle imports in 2012 -13. Non-containerised imports of other transport equipment increased by 135.6 per cent. Imports in industrial and agricultural vehicles and prefabricated buildings also increased significantly, predominately due to the growth in Nor West development. The increase in imports of non-containerised cargo is forecast to continue in 2012-13.

FREMANTLE PORTS ANNUAL REPORT 2012
43
Performance Trade and Business Growth
Fremantle Ports’ Kwinana Bulk Jetty and Kwinana Bulk Terminal bulk cargo tonnages represent around 25.4 per cent of total port bulk cargo volumes. Kwinana Bulk Jetty trade increased by 0.3 million tonnes or 16.0 per cent to 2.0 million tonnes in 2011-12. The increase was mainly due to rises in imports of urea, ammonium nitrate and fertilisers. Trade throughput at Kwinana Bulk Jetty is forecast to be around 2.3 million tonnes in 2012 -13 an increase of 8.5 per cent over 2011-12.
Kwinana Bulk Terminal trade increased by 0.8 million tonnes or 30.2 per cent to 3.3 million tonnes in 2011-12, mainly due to the commencement of iron ore exports from November 2011. Trade throughput at this facility in 2012 -13 is forecast to be at around 4.8 million tonnes.
Co-operative Bulk Handling’s Kwinana grain terminal exported 3.8 million tonnes in the 2011-12 financial year compared to 2.7 million tonnes in 2010 -11. The increase of 1.1 million tonnes is due to Western Australia’s record harvest crop of 15 million tonnes in 2011 -12. The increase in exports in 2011/12 will continue into 2012-13 as CBH expects exports at the Kwinana Grain Terminal to reach around 5.5 million tonnes in 2012 - 2013.
Petroleum product, Fremantle Port’s major bulk commodity, is forecast to be around 8.2 million tonnes in 2012-13, and dry bulk alumina exports are expected to remain at levels similar to 2010 -11 or 2.9 million tonnes.
Heavy lift ships at Victoria Quay are servicing Chevron’s Gorgon natural gas project.

FREMANTLE PORTS ANNUAL REPORT 2012
44
Performance Support Services
OBJECTIVE: Ensuring appropriate and cost effective resources, processes and systems to support service delivery
KEY OUTCOMES SOUGHT:• Support services are focused on improvements in service delivery
and organisational culture
Strategic Asset ManagementAsset ownership is a significant cost to Fremantle Ports and developing a best-practice strategic asset management system continues to be a corporate priority. Over the past 12 months Fremantle Ports has developed and implemented a number of strategic asset management improvements as follows:
• A series of asset investigation workshops was held to develop a baseline risk and condition assessment across all of Fremantle Ports’ assets. These workshops brought together engineering, maintenance, commercial and operational staff to share and document their knowledge of the organisation’s assets;
• Using the data from the asset investigation workshops, Fremantle Ports’ first annual state of the assets report was prepared and presented to the Fremantle Ports Board, Executive Team, and all finance, engineering, operations and commercial staff. This report provided stakeholders with a high level snapshot of asset performance across the organisation with respect to asset condition, risk and expenditure.
• Asset roles and responsibilities were defined and documented for all assets, such that there is now a defined asset owner and an asset manager for each of Fremantle Ports’ assets.
• An industry asset investment benchmarking exercise was conducted, in which Fremantle Ports collected data from eight Australian ports to compare the ongoing costs of asset ownership across the industry.
• The first asset class planning process was completed for Fremantle Ports’ 24 wharves and jetties. This involved the documentation of the current and future levels of service needed to deliver to customers, and the development of a life cycle cost model, which enables Fremantle Ports to forecast the long term costs of asset ownership and to identify the optimal replacement age for each asset. The wharves and jetties asset class management plan is currently being finalised.
Navigational lighting maintenance is an essential element of asset management.

FREMANTLE PORTS ANNUAL REPORT 2012
45
Performance Support Services
The principal strategic asset management focus for 2012-2013 will be the development of asset class management plans for each of Fremantle Ports’ other critical asset classes, including the navigation aids, rail, electrical services and cargo handling equipment assets.
Human ResourcesStaffing
Fremantle Ports’ full time equivalent employees total at 30 June 2012 was 338.65, compared with 318.98 last year. The natural attrition rate was 1.4 per cent and resignations comprised 2.66 per cent. The total attrition rate was 4.14 per cent.
People Plan
Fremantle Ports’ People Plan 2006-2011 was developed to provide focused, strategic guidance at all levels to enable the attraction, retention and development of staff and to assist in meeting our Fremantle Ports’ mission of facilitating trade in a sustainable way.
The plan is now being reviewed and reassessed to determine what has been achieved and what is still to be achieved, and to assess the success of the initiatives already implemented. The objective will be another five-year ‘People Plan’ that has been recalibrated based on the changes the organisation has undergone in the past five years and is projecting for the next five years.
Organisational Culture and Capability
Over an extended time frame, Fremantle Ports has invested significantly in measuring, assessing and developing a positive employee culture. Fremantle Ports recognises that a focus on elements which drive and motivate employees will ultimately flow on to drive and motivate the organisation towards improved business outcomes.
This investment is clearly visible through a range of programs and activities on topics such as leadership development, developing high performance teams, high potential employee recognition, succession planning, cultural and attitude surveys, and employee recognition schemes. This indicates the focus and commitment by senior management and the Board to developing the employee base in a positive manner, recognising, fostering and encouraging the desirable behaviours and discouraging the less desirable.
While these programs have been successful in their own right, Fremantle Ports will now work to embed the cultural values they embody more clearly within the policies, processes, procedures and daily operations of our organisation.
Over the past 12 months, Human Resource advisors have been assigned to each Branch and actively participate in communication sessions, business continuity and sustainability meetings, and crisis management development.
Operating the water truck.

FREMANTLE PORTS ANNUAL REPORT 2012
46
Performance Support Services
Members of the HR Team have now also joined the Occupational Health and Safety Committees to further enhance the HR Branch’s ability to integrate more closely in supporting all business activities.
Employee Relations
A new enterprise agreement for the Marine Services, the Fremantle Ports Marine Services Enterprise Agreement was approved by Fair Work Australia to operate from 2 March 2012.
Negotiations are continuing for new enterprise agreements with two employee groups: Fremantle Ports’ Bulk and General Stevedoring Employees; and Fremantle Ports’ Operations and Services Employees.
Health and Wellness
Fremantle Ports has continued to focus on the wellbeing of all employees this year through an extensive range of initiatives, recognising that good physical and mental health builds satisfaction and happiness for employees and contributes to our business success.
Specific activities around health include skin cancer checks, weight loss programs, first aid training, understanding anxiety, depression and suicide, ergonomics, stress management, fatigue and sleep management, nutrition and healthy eating choices, hydration and working in high temperatures, glaucoma and eye diseases and healthy heart checks.
Fremantle Ports offers an offsite confidential Employee Assistance Program for employees and immediate family members.
Additionally, an extensive program is in place to build constructive and resilient thinking and behaviours at the individual and group level.
Succession Planning
Succession planning and knowledge transfer remain crucial areas given our ageing workforce. Considerable work has been undertaken to identify critical positions in the organisation and develop succession planning initiatives for those positions in the context of the retirement plans of the incumbents. This has involved identifying potential internal candidates and fostering their development under the Performance Review and Development System.
Organisational capability is an ongoing focus, with numerous activities directed towards supporting, maintaining, and enhancing the ability of the organisation and the total workforce to meet business needs.
Occupational Safety, Health and Injury Management
This topic is covered in the Disclosures section of the Report on page 121-122.

FREMANTLE PORTS ANNUAL REPORT 2012
47
Performance Business Sustainability
OBJECTIVE: Ensuring business sustainability through our excellent performance in all areas, innovation, business improvement and community and stakeholder engagement
KEY OUTCOMES SOUGHT:• Financial targets are met
• Improved stakeholder and community support
• Improved safety and environmental performance
Annual Safety, Environmental and Quality (SEQ) Certification Audits
Fremantle Ports successfully retained triple-certification to the international standards for our Safety, Environmental and Quality (SEQ) systems following annual surveillance audits by SAI Global in May.
The Auditors noted that overall, employees showed a good level of understanding of the procedures associated with their work operations, and noted significant improvements since the previous audits in 2011. These included better evidence of close-out of actions from the previous audit across the three systems, evidence of a strong and enthusiastic team-based improvement culture across all areas visited during the audit and good evidence of corporate audits planned and conducted on key risk areas.
The assessors’ report will be used in improvement planning for the coming 12 months.
Risk Management Improvements
Fremantle Ports’ risk management strategy includes a project to improve use of the Operational Risk Register by managers and supervisors. This has extended our focus from risks rated “substantial” and above, to risks rated below “substantial”.
Risk owners have been reviewing and assessing their lower level risks, commencing with a review of 138 operational risks rated “moderate”. There has been good progress to date and in October 2012 it is planned to consider extending this initiative to review “small” and “very low” risks.
Business Excellence
Fremantle Ports works within the Australian Business Excellence Framework (ABEF) and the past year has seen significant progress made in the annual business improvement planning cycle.
EnvironmentISO 14001
Health &SafetyAS 4801
Quality ISO 9001

FREMANTLE PORTS ANNUAL REPORT 2012
48
Performance Business Sustainability
A total of 215 improvements was identified across the organisation in 2011 in the fields of improved or simplified processes, improved customer or stakeholder services and funds earned or saved. This annual summary recognises and highlights the importance of continuous improvement across the organisation and captures improvements over time.
As part of our continuous improvement measurement, an external assessment was conducted in March against the two ABEF Categories in which Fremantle Ports scored lowest in the 2007 ABE Awards Assessment (Information and Knowledge; and Process Management Improvement and Innovation). The assessment report noted our current strengths and validation of improvements made since 2007. It also identified short-term improvement opportunities to allow “quick wins” and longer-term improvement opportunities for potential input into Fremantle Ports’ next two-year business improvement planning cycle.
Fremantle Ports continues to review its processes to ensure they remain relevant and current. A rigorous initiative to review and improve our corporate performance indicators, including what is measured; improved engagement by managers with Key Performance Indicators; and how the indicators are linked to the organisation’s Strategic Plan, resulted in the development of new Key Indicators aligned with the Strategic Plan. These indicators are now in place and have been allocated owners and targets. A reporting process also is in place to monitor progress.
A further review involved the systematic re-evaluation and improvement of five critical business processes in Operational Divisions. These were: environmental (spillage/dust/lack of containment in the bulk business); management of environmental issues associated with Common User berth agreements; statutory inspections compliance and assurance; ship scheduling; and the identification and inspection of critical assets.
Business Continuity planning for times of crisis has included a series of facilitated workshops with owners of Fremantle Ports’ critical business activities, focusing on response options for those critical activities as well as on continuity in the four key areas of accommodation, IT systems, telecommunications and data/ records in times of crisis.
Reporting on a desktop crisis scenario test for members of the Crisis Management and Business Continuity Teams, the consultant’s feedback noted that: “Fremantle Ports has well developed and tested response and recovery plans and procedures, and managers and support staff are trained and rehearsed in the application of the plans. This achievement accords with best-in-class practices”.

FREMANTLE PORTS ANNUAL REPORT 2012
49
Performance Business Sustainability
Environmental ManagementEnergy Saving Initiatives
Fremantle Ports is committed to the responsible management of energy use and greenhouse gas emissions in the provision and delivery of its services.
It is taking a proactive approach to addressing climate change and as part of this, adopted a Greenhouse Gas and Energy Management policy this year. The policy formalises Fremantle Ports’ commitment, strategy and responsibilities for management of greenhouse gas emissions and energy use.
Supporting the policy is a Greenhouse Gas and Energy Management Plan developed this year to enable implementation of measures to manage energy use and carbon emissions. The five key strategies of the plan are:
• measuring energy use and calculating emissions;
• reducing energy use;
• switching to sustainable energy sources;
• offsetting residual emissions; and
• communicating with stakeholders.
An Energy Management Team has been established to encourage leadership and to identify and drive energy efficiency initiatives. The team is responsible for planning an integrated, organisation-wide response to energy conservation.
Further work was undertaken this year to improve energy efficiency and conservation including the installation of efficient LED lighting throughout most of the western end of Victoria Quay. Motion sensors have been installed in low usage areas.
Also well established is the current offset of emissions from Fremantle Ports’ vehicle fleet through the Carbon Neutral Scheme. Through this scheme our fleet emissions have been 100 per cent offset since 2004 by planting native trees at various sites in Western Australia.
Addressing Clinker Dust
Planning and design work for upgrading the shed used to store clinker imports at the Kwinana Bulk Terminal has been completed. The aim of this project is to improve the management of dust emissions.
Clinker is a particularly dusty product and management of the dust when the product is being loaded by front end loaders has been an issue of concern as tonnages handled have grown. Extensions to the load-out bays will ensure the trucks are enclosed during clinker loading and dust extraction equipment will be installed in the loading bays.
The project is scheduled for completion in the first half of the 2012-13 financial year.

FREMANTLE PORTS ANNUAL REPORT 2012
50
Performance Business Sustainability
Voyager Dangerous Cargo System
This system is used to process electronic dangerous cargo manifests (cargo lists). It is a means of more effectively monitoring and managing the handling of dangerous cargo moving through Fremantle Ports.
Enhancements undertaken during 2011-12 have resulted in significantly increased uptake by customers. The electronic dangerous goods manifest submissions now account for 74 per cent of the containerised dangerous cargo trade through Fremantle Ports, up from around 12 per cent in March 2011. More recently, enhancements were made to the system to significantly improve the usability of the system for Fremantle Ports’ Safety team.
Oil Spill Response
A Fremantle Ports oil spill response team worked with BP and Department of Transport personnel to recover fuel which leaked into the Inner Harbour in May. The source of the spillage was a small leak in a BP pipeline at North Quay.
Booms were deployed as soon as the alert was raised and the clean-up operation was successfully completed.
Fremantle Ports was represented in a WA team sent to New Zealand to provide expert assistance when the container ship Rena ran aground in October 2011 and spilled oil into the pristine Bay of Plenty area. Fremantle Ports’ Harbour Master, Captain Allan Gray had an on-scene commander role.
Valuing our CommunityFremantle Ports has continued to engage with the community through its two community liaison groups and via involvement with a wide range of organisations. Information and views are shared to help with mutual understanding of priorities, with this information taken into account in strategic planning.
Community Contribution Fremantle Ports provides monetary and in-kind sponsorship for a wide range of community organisations in the Inner and Outer Harbour areas. The support reflects Fremantle Ports’ priorities and values.
An enduring partnership has been our involvement over the past seven years as anchor sponsor of the Fremantle Football Club’s Starlight Purple Haze Game. This year’s fundraising tally to help brighten the lives of children in hospital was a record $80,101, bringing the total raised during our Purple Haze partnership to $358,896.
A pictorial anthology called Fremantle Port by Fremantle author John Dowson was sponsored by Fremantle Ports and released in December 2011. The book won the gold award in the Australia/New Zealand Best Regional Non-Fiction book category at the 2012 Independent Publisher Book Awards
Support was provided to help fund a beach wheelchair for people with disabilities.
Fremantle Port by John Dowson.

FREMANTLE PORTS ANNUAL REPORT 2012
51
Performance Business Sustainability
celebrated in New York in June 2012. Fremantle Ports also helped with research, including sourcing of images.
Significant support continued for a research project to ensure the long-term conservation of bottlenose dolphins in Perth metropolitan waters. The Coastal and Estuarine Dolphin Project (CEDP) is a collaborative project between Murdoch and Curtin universities.
Fremantle Ports is committed to working with organisations and schools in the Fremantle, Cockburn, Kwinana and Rockingham areas to support education and to increase understanding of the role of the maritime industry and the port. For the first time, Fremantle Ports coordinated the Kwinana Industries Youth Art Awards, an event that has been held for a number of years for students of secondary schools in the Kwinana, Cockburn and Rockingham areas. The artwork of almost 100 finalists from 10 schools was selected from about 1500 entries. About 380 people attended the awards presentation evening in March 2012.
Sponsorship continued for Surf Life Saving WA’s Life Skills for Life (first aid) education program being delivered to 20 Year 7 classes a year in schools in the Fremantle and Rockingham - Kwinana areas and the Paraplegic Benefit Fund’s PBFPREVENTION-aqua program in schools. This program aims to reduce serious injury in the aquatic environment through presentations to Years 6 and 7 students by a person who has sustained a permanent spinal cord injury due to an aquatic incident.
Scholarships have continued to be provided for students in maritime and marine studies programs at Rockingham and South Fremantle senior high schools. As well, support has continued for a Murdoch University Discover Your Potential Scholarship through the Rockingham Education Development Group and North Fremantle Community Arts Development. Fremantle Ports has also continued to sponsor achievements awards for graduates of the Bridging Course at Curtin University’s Centre for Aboriginal Studies.
Education visits
Principals and Vocational Education and Training coordinators from 16 secondary schools in the Cockburn, Kwinana and Rockingham areas attended a networking forum at Fremantle Ports’ administration building in March 2012 to learn more about the port and career opportunities for their students. The forum hosted by Fremantle Ports was one of a series of Kwinana Industries Council Education Partnership networking events. The Kwinana Industries Council (KIC) Workforce Education Committee also held an information forum on the vocational education and training (VET) framework and structure in schools at Fremantle Ports’ Administration Building in June 2012. About 20 school principals, VET coordinators and KIC industry representatives attended.
A group of 20 Year 10 female students from seven schools visited Fremantle Ports in May 2012 to discover the port and maritime careers. The visit was
Dolphin and calf in Cockburn Sound.
My Dog, by Joshua Webb, was the winner of the 2012 Kwinana Youth Industries Art Awards.
FREMANTLE PORTS ANNUAL REPORT 2012
52
Performance Business Sustainability
part of the iWomen Pilot Project, a Kwinana Industries Council partnership program to provide the girls with an understanding of the breadth of industry in the Kwinana Industrial Area, the importance of its impact on the social and economic framework of the community, and the broad range of career options available.
Maritime Day Expo
Fremantle’s third Celebrate Maritime Day expo on Victoria Quay in August 2011 was a great success with thousands of visitors attracted to the 41 industry booths and numerous displays and activities. The Royal Australian Navy frigate HMAS Newcastle was one of the main drawcards.
Community events
In-kind support and sponsorship was provided for the Perth 2011 ISAF Sailing World Championships in Fremantle in December 2011, with the Women’s Match Racing Competition held in Fremantle Inner Harbour. The event partnership also involved a Build a Boat in a Day Competition.
Support has also been given to a number of community festivals and projects.
Complaints Management Fremantle Ports received 83 complaints in 2011-12 compared with 103 complaints the previous year. Of these, 37 were environmental complaints (e.g. noise, odour and water pollution) and 14 related to traffic issues.
Of the 10 noise complaints, two were from North Fremantle residents complaining about noise from a vessel at the eastern end (Berth 12) of North Quay in September. Subsequent noise monitoring on a similar ship showed the noise level was well below the limit that is used by Fremantle Ports when classifying vessels as “noisy”. Removal of the covered storage building at Berth 12 in July 2011 may have resulted in residents in nearby residential streets hearing more ship engine noise.
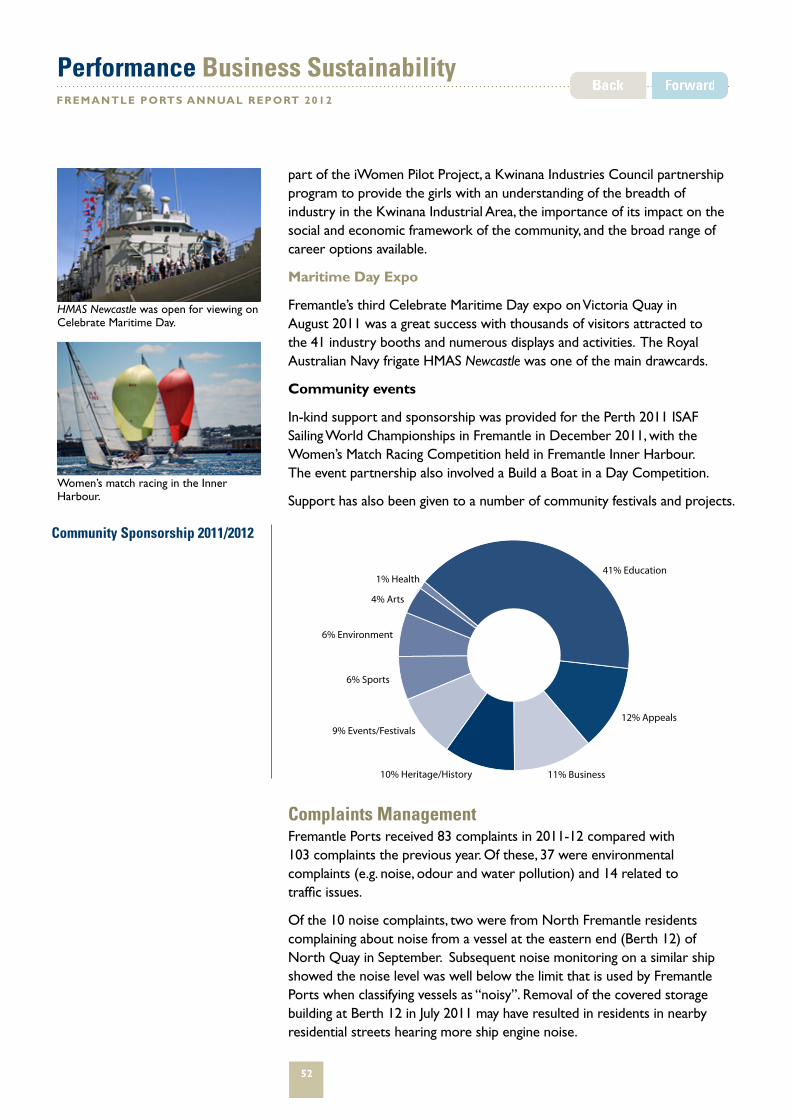
Community Sponsorship 2011/2012
10% Heritage/History
1% Health
6% Sports
9% Events/Festivals
6% Environment
11% Business
4% Arts
12% Appeals
41% Education
Community Sponsorship 20011/2012
HMAS Newcastle was open for viewing on Celebrate Maritime Day.
Women’s match racing in the Inner Harbour.

FREMANTLE PORTS ANNUAL REPORT 2012
53
Performance Business Sustainability
A number of the water pollution complaints were about a brownish plume in the river in January. Tugs performing manoeuvres near the eastern end of the port created a plume that travelled up river and under the Fremantle Traffic and Stirling bridges. A discharge from a livestock vessel in February also resulted in some complaints. This matter was dealt with promptly.
More than half of the traffic complaints were from residents on the corner of East and Beach streets in East Fremantle who are concerned about car-carrier trucks using East Street from Gate 3 on Victoria Quay. Traffic modifications at this gate channel trucks to the link road to Canning Highway but some drivers ignore the special kerbing and use East Street. Further modifications to Gate 3 to prevent this non-compliance have been planned for 2012-13.
The issue of freight rail noise impacting on Fremantle inner city residents, particularly those living near the Roundhouse, is being effectively dealt with and there have been very few complaints in recent months. A working group representing Fremantle Ports, the Public Transport Authority (PTA) and rail operators has met regularly, with further study undertaken to analyse the noise sources and potential solutions. Close contact has been maintained with representatives of the local resident group.
While the report of the most recent of the studies has yet to be completed, a water spray system has been re-introduced by the PTA as an interim measure to reduce wheel squeal and is proving to be highly effective, with very positive feedback from the community.
Envir
onmen
t - D
ust
Envir
onmen
t - N
oise
Inner
Harb
our D
eepe
ning
Othe
r
Envir
onmen
t - O
ther
Passe
nger
Term
inal
Envir
onmen
t - W
ater
Visits -
Even
ts
Secu
rity
Acces
s
Vehic
le tra
ffic
Inter
nal Is
sue
Envir
onmen
t - O
dour
Safet
y
Custo
mer Is
sues
0
5
10
15
20
25
30
35
40
2011/12 2010/11
Num
ber
of C
om
plai
nts
Type of Complaint
Fremantle Ports - Complaints Register 2011/2012
Compared to previous year