balanced scorecard performance in procurement department
TRANSCRIPT

www.ijird.com July, 2018 Vol 7 Issue 7
INTERNATIONAL JOURNAL OF INNOVATIVE RESEARCH & DEVELOPMENT DOI No. : 10.24940/ijird/2018/v7/i7/129434-311572-1-SM Page 42
Balanced Scorecard Performance in Procurement
Department in Insurance Industry
1. Introduction
In every business activity, it is realized that Procurement has important strategic implications. Therefore, the preparation of appropriate Procurement strategy is an important part of management activities. The right strategy formulation model is also important to formulate a Procurement strategy that is in line with the company's long-term strategy. However, many organizations consider Department Procurement to be an operational and administrative division only, so performance measurement is performed only based on operational efficiency. Today the organization is beginning to realize the importance of Procurement as a Department with important strategic implications. Therefore Procurement performance measurement should be a combination of operational efficiency approach and Procurement actions related to strategic role (Kaplan and Norton 2000: 6-17; Van Weele, 2014: 13).
The Department of Procurement Life Insurance has conducted three performance measurements by conducting surveys to related business units, in 2013, 2015 and 2016. Performance measurements have been undertaken to evaluate Procurement performance and identify Procurement processes and functions that need to be prioritized for repaired. However, performance measurement is still focused on operational roles, not yet on measures of strategic performance. Performance surveys have been measured only at the point where the business unit interacts with Procurement. Performance measurements based on the touchpoint include Procurement Application Usage, Turnaround Time, Procurement Procedure, Procurement Process, Vendor Management, Procurement Staff Performance, Outsourcing Management, and Contract Management. Performance measurement has not been reviewed based on Balanced Scorecard principle on strategic view in four perspectives, namely: Finance, Customers, Internal Business Process, and Learning & Growth. Based on Department of Procurement performance measurement in 2013, 2015, and 2016 (Figure 1), it is found that the overall assessment of Procurement performance is still below the standard / norm of 68%. In 2013, business unit satisfaction rate on Procurement performance is 48%, in 2015 by 62.5%, and in 2016 at 65.3%. The level of survey satisfaction has been compared with the Normal Global Insurance Company introduced by Tower Watsons on Operational Efficiency and Conditions with standard / norm of 68% (Report Year 2016).
ISSN 2278 – 0211 (Online)
Umbas Krisnanto Researcher, Perbanas Postgraduate School, Perbanas Institute, Jakarta, Indonesia
Dika Migi Priyono Researcher, Master of Management, Perbanas Institute, Jakarta, Indonesia
Abstract: The Balanced Scorecard method as the standard measurement of performance at Procurement Department in Life Insurance. The method of research is qualitative method, since this research is not meant to be true. The discussion has shown that the Balanced Scorecard method which interprets the vision, mission and strategy into performance assessment that has four indicators: the financial perspective which indicates the fluctuate figures, the customer perspective show continuous improvement from 2013 to 2016, the internal business process perspective shows that the Procurement Department has made continuous improvement during 2013 to 2016, the growth and learning perspective show that Procurement Department perform continuous improvement, although need improvement on operational team capabilities and e-procurement system must be established to simplify the process. It can be concluded from the above discussion that the use of Balanced Scorecard method can be used as the standard for measurement of performance of Procurement Department. In order to have a continuous performance improvement, some recommendations are recommended as per recommended on strategy maps and strategy recommendation. Keywords: Balanced scorecard, procurement, performance assessment

www.ijird.com July, 2018 Vol 7 Issue 7
INTERNATIONAL JOURNAL OF INNOVATIVE RESEARCH & DEVELOPMENT DOI No. : 10.24940/ijird/2018/v7/i7/129434-311572-1-SM Page 43
Figure 1: Procurement Department Performance Measurement Results Year 2013 - 2016
Source: 2016 Report
The balance scorecard has undergone several adjustments since it was first created. Adjustments to social organizations such as health organizations adapt to organizations to be assessed (Zelman, et.al, 2003). This study refers to previous research that has been used as a tool in measuring the performance and formulation of Procurement strategies in the private and public sectors (Vaidya, et.al., 2004; Abdolali Pour, et.al.: 2011; Juzokaite et.al.: 2009; Waskito and Agustina: 2015). 2. Research Purposes
Want to evaluate Procurement performance from financial aspect in 2013 - 2016. Want to evaluate Procurement performance from business unit satisfaction aspect in 2013 - 2016. Want to evaluate Procurement performance from internal business process aspect from 2013 - 2016. Want to evaluate Procurement performance from growth and learning aspect in 2013 - 2016. Evaluate the weighted and interconnection of each Balanced Scorecard perspective on the formulation of
Procurement performance. 3. Theoretical Basis 3.1. Management Strategy
Strategy management by Wheelen & Hunger (2012: 5) is a series of steps, decisions and actions of a company that determine the long-term performance of the company. Good strategy management will bring the organization to implement its strategy through program planning, budgeting process, performance management system, organizational structure change, and program and project management. Wheelen & Hunger (2012: 5 - 6) also explains that over time, strategy management has evolved in several stages: Phase 1: Basic financial planning, Phase 2: Forecast-based planning, Stage 3: Externally Oriented (Strategic) planning, Stage 4: Strategic Management.
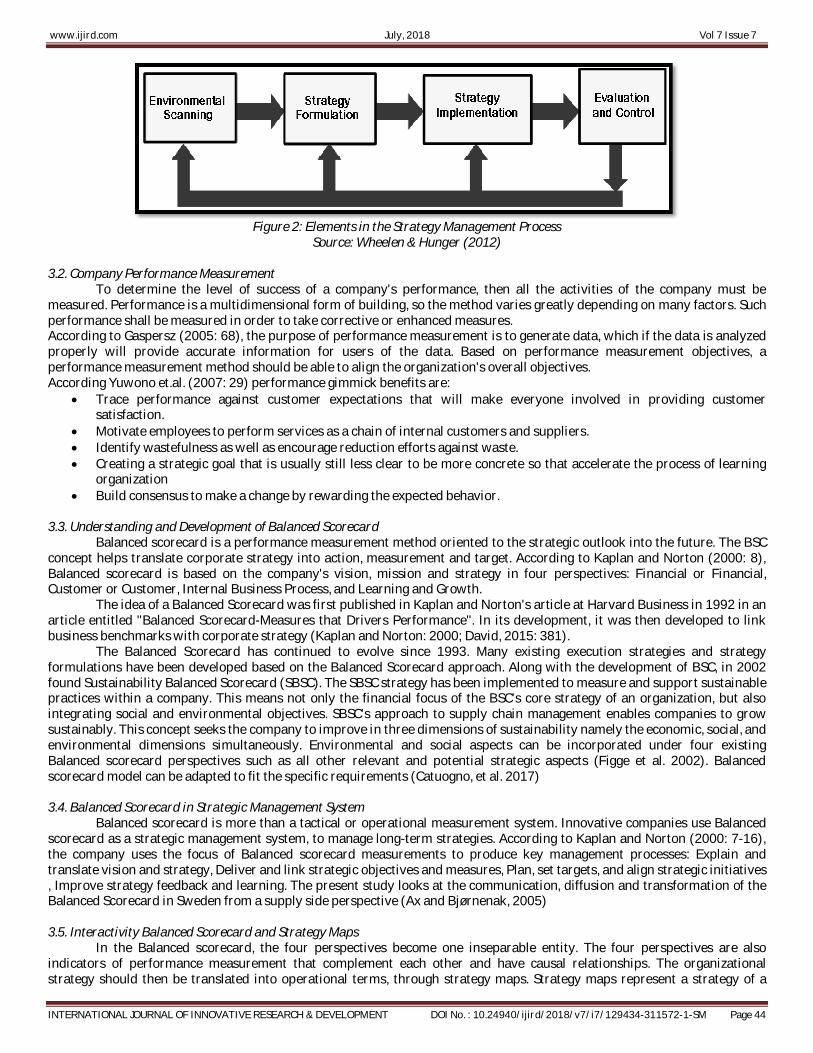
Principally, each strategy management model must involve the goal of the strategy (in terms of vision, mission, objectives, and targets), strategy formulation, strategy implementation, and performance control. A good management, must have the ability to formulate a good strategy, as well as to implement it. Several models were developed to help companies to formulate and implement their strategies. Summarizing the various models of strategy management, Wheelen & Hunger (2012) explains that in principle the strategy management process includes the following elements:
www.ijird.com July, 2018 Vol 7 Issue 7
INTERNATIONAL JOURNAL OF INNOVATIVE RESEARCH & DEVELOPMENT DOI No. : 10.24940/ijird/2018/v7/i7/129434-311572-1-SM Page 44
Figure 2: Elements in the Strategy Management Process
Source: Wheelen & Hunger (2012) 3.2. Company Performance Measurement
To determine the level of success of a company's performance, then all the activities of the company must be measured. Performance is a multidimensional form of building, so the method varies greatly depending on many factors. Such performance shall be measured in order to take corrective or enhanced measures. According to Gaspersz (2005: 68), the purpose of performance measurement is to generate data, which if the data is analyzed properly will provide accurate information for users of the data. Based on performance measurement objectives, a performance measurement method should be able to align the organization's overall objectives. According Yuwono et.al. (2007: 29) performance gimmick benefits are:
Trace performance against customer expectations that will make everyone involved in providing customer satisfaction.
Motivate employees to perform services as a chain of internal customers and suppliers. Identify wastefulness as well as encourage reduction efforts against waste. Creating a strategic goal that is usually still less clear to be more concrete so that accelerate the process of learning
organization Build consensus to make a change by rewarding the expected behavior.
3.3. Understanding and Development of Balanced Scorecard
Balanced scorecard is a performance measurement method oriented to the strategic outlook into the future. The BSC concept helps translate corporate strategy into action, measurement and target. According to Kaplan and Norton (2000: 8), Balanced scorecard is based on the company's vision, mission and strategy in four perspectives: Financial or Financial, Customer or Customer, Internal Business Process, and Learning and Growth.
The idea of a Balanced Scorecard was first published in Kaplan and Norton's article at Harvard Business in 1992 in an article entitled "Balanced Scorecard-Measures that Drivers Performance". In its development, it was then developed to link business benchmarks with corporate strategy (Kaplan and Norton: 2000; David, 2015: 381).
The Balanced Scorecard has continued to evolve since 1993. Many existing execution strategies and strategy formulations have been developed based on the Balanced Scorecard approach. Along with the development of BSC, in 2002 found Sustainability Balanced Scorecard (SBSC). The SBSC strategy has been implemented to measure and support sustainable practices within a company. This means not only the financial focus of the BSC's core strategy of an organization, but also integrating social and environmental objectives. SBSC's approach to supply chain management enables companies to grow sustainably. This concept seeks the company to improve in three dimensions of sustainability namely the economic, social, and environmental dimensions simultaneously. Environmental and social aspects can be incorporated under four existing Balanced scorecard perspectives such as all other relevant and potential strategic aspects (Figge et al. 2002). Balanced scorecard model can be adapted to fit the specific requirements (Catuogno, et al. 2017) 3.4. Balanced Scorecard in Strategic Management System
Balanced scorecard is more than a tactical or operational measurement system. Innovative companies use Balanced scorecard as a strategic management system, to manage long-term strategies. According to Kaplan and Norton (2000: 7-16), the company uses the focus of Balanced scorecard measurements to produce key management processes: Explain and translate vision and strategy, Deliver and link strategic objectives and measures, Plan, set targets, and align strategic initiatives , Improve strategy feedback and learning. The present study looks at the communication, diffusion and transformation of the Balanced Scorecard in Sweden from a supply side perspective (Ax and Bjørnenak, 2005) 3.5. Interactivity Balanced Scorecard and Strategy Maps
In the Balanced scorecard, the four perspectives become one inseparable entity. The four perspectives are also indicators of performance measurement that complement each other and have causal relationships. The organizational strategy should then be translated into operational terms, through strategy maps. Strategy maps represent a strategy of a

www.ijird.com July, 2018 Vol 7 Issue 7
INTERNATIONAL JOURNAL OF INNOVATIVE RESEARCH & DEVELOPMENT DOI No. : 10.24940/ijird/2018/v7/i7/129434-311572-1-SM Page 45
company that consists of strategic objectives for each perspective, then described causal relationships among those goals (Jafari, et.al. (2015) 3.6. Procurement
In every business activity, it is realized that Procurement has important strategic implications. Procurement is defined as follows according to Van Weele (2014: 13), Procurement is all the necessary activities in order to obtain the product from the supplier for the final purpose, while the purchasing includes all activities of the company that receives invoices from outside parties. Procurement Department has a supply chain starting with internal customers and ending with suppliers, within the relationship there are three main actors, namely internal customer, Procurement Department and supplier. The importance of Procurement in business activities, because generally 50 - 70% of the value of sales come from raw materials and services purchased by Procurement. So that the raw materials and services purchased, great influence on business profits of a company. Procurement performance is therefore a combination of operational efficiency approach and Procurement actions related to strategic role. (Kumar, 2005) 4. Research Methods
In this study using qualitative research methodology. The approach used is descriptive evaluative. The reason for the use of descriptive evaluative analysis is that not all data is obtained quantitatively. Descriptive evaluative analysis also provides a general description of the performance of Department Procurement. The result of data analysis is presented in the form of description, drawing or chart based on Balanced scorecard concept. (Huegens, 2008) This research was conducted at Life Insurance Head Office, Department Procurement, Time needed in conducting this research for 6 months (June 2017 - December 2017). The type of data in this study consists of primary data and secondary data. Primary data sources were collected directly from respondents through interviews with selected sources. While secondary data sources are collected from Life Insurance in the form of corporate financial statements from 2014 to 2016, Procurement performance survey data for 2013, 2015 and 2016, presentation data of Procurement Committee 2013, 2014, 2015 and 2016. 5. Research Result and Discussion
Result of Financial Statement Analysis for Procurement Performance evaluation from Financial Aspect Based on Life Insurance's financial statements data for 2013, 2014, 2015 and 2016, the following data are obtained:
No Financial Aspects Ratio/Remark 2014 2015 2016
1 Auditor SW&R SW&R SW&R 2 Audit opinion Unqualified Unqualified Unqualified 4 Profit margin
= Net income / Total Revenue 14% 26% 19% 5 Return on Assets
= Net Income / Total Assets 9% 10% 9% 6 Return on Equity
=Net income/Total Shareholders’ Equity
(SHE) 66% 62% 60%
7 Solvency Level
= Total Debt / Total Assets 87% 84% 85% 8 Return on Investment
= Net income / Total Investment 10% 12% 11% 9 Revenue growth 62% -38% 45%
10 Profit growth 72% 12% 6%
11 Asset growth 31% -1% 15%
12 Liabilities growth 33% -4% 16%
13 SHE growth 18% 21% 8% Table 1: Financial Ratios of PT in 2014 -2016
Net income or PT Net Income increased from 2013 to 2016. Net income in 2013 amounted to 2.82 trillion Rupiah,
increasing to 4.86 Trillion Rupiah in 2014, then increased to 5.44 trillion Rupiah in 2015, and PT net income again increased to 5.78 trillion Rupiah in 2016. Shareholder Equity also increased from 2013 to 2016. Shareholder Equity in 2013 is 6.19 trillion Rupiah, increasing to 7.31 trillion Rupiah in 2014, then increased to 8.83 trillion Rupiah in 2015, and Shareholder Equity PT reaches 9.57 Trillion Rupiah in 2016.

www.ijird.com July, 2018 Vol 7 Issue 7
INTERNATIONAL JOURNAL OF INNOVATIVE RESEARCH & DEVELOPMENT DOI No. : 10.24940/ijird/2018/v7/i7/129434-311572-1-SM Page 46
Return on Equity tends to decrease from 2013 to 2016 although not significant, that 66% in 2016, 62% in 2015, and 60% in 2016. Return on Assets tend to be stable from 2014 to 2016, that 9% in year 2016, 10% in 2015 and 9% in 2016. Return on Investment tends to be stable from 2014 to 2016, that 10% in 2016, 12% in 2015 and 11% in 2016. Shareholder Equity growth tends to fluctuate from 2014 to 2016, although shareholder equity continues to increase annually, but growth rates vary, in 2014 growth rate of Shareholder Equity reaches 18%, in 2016 growth rate of Shareholder Equity has increased to 21%, but in 2016 level Shareholder Equity growth tends to decline at 8%.
Description 2013 2014 2015 2016
Total saving No records have been made yet
86 Milyar Rupiah 88 Milyar Rupiah
Saving to procurement 8.8 % 11 %
Table 2: Saving Contribution of Department Procurement Source: Reports of 2013 - 2016
In terms of contribution to savings on the cost of procurement table 2 above is the data obtained based on
Procurement documentation search. Based on the data, Department Procurement has not recorded the contribution of savings during the year until 2014, so it is not known how much contribution of savings made in the procurement process. New savings registers are made starting in 2015 under the direction of the Head of the Procurement Department, which took office in early 2015. The purpose of the listing is to monitor Procurement's contribution and be monitored by management.
The savings recorded by Procurement are derived from two things: firstly the contribution of savings on budget business units approved by Finance, where the final price of the vendor will be compared with the initial cost (saving), the second is the contribution of savings to the vendor's initial offer, where the final price of the vendor will be compared with the initial cost (cost avoidance). At the end of 2015, total Procurement saving contributions amounted to 86 billion Rupiah (8.8% of total procurement costs in 2015). At the end of 2016, the total contribution of Procurement saving amounted to 88 billion rupiah (11% of total procurement cost in 2016).Results of Survey Data Analysis for Evaluation of Procurement Performance Assessed from Business Unit Satisfaction Aspects
Figure 3: Graph of Business Unit's Satisfaction Level in 2013 ≈ 2014, 2015, 2016
Source: Reports 2013 - 2016
Based on survey data. The average level of business unit satisfaction continues to increase from 2013≈2014, 2015, and 2016. From 2013≈2014 with 54% satisfaction rate increased by 10% to 64% in 2015. Furthermore there was an increase in the level of business unit satisfaction by 3% from 2015 to 67% in 2016. The average level of business satisfaction in 2016 is still below the standard of 68%.
Survey Data Analysis Results for Performance Evaluation Procurement is assessed from the Aspects of Internal Business Processes

www.ijird.com July, 2018 Vol 7 Issue 7
INTERNATIONAL JOURNAL OF INNOVATIVE RESEARCH & DEVELOPMENT DOI No. : 10.24940/ijird/2018/v7/i7/129434-311572-1-SM Page 47
Figure 4: Graph of Satisfaction Level Related to Internal Business Processes for the
Period of 2013 ≈ 2014, 2015 and 2016 Source: Reports 2013 - 2016
Taking into account the survey data, Procurement performance of internal business process aspects continued to
increase from 2013≈2014, 2015 and 2016. From 2013≈2014 with 59% satisfaction rate increased 7% to 66% in 2015. Furthermore, business unit satisfaction by 6% from 2015 to 72% in 2016. The average level of business satisfaction in 2016 was above the 68% standard.
Recommended Results Business Satisfaction Survey of Business Units and Internal Business Processes 2013, 2015, and 2016.
Based on the survey results of 2013≈2014, Procurement's performance satisfaction rate only reached 48%, well below the standard score of 68%. The survey recommendation noted that Procurement is an immediate area for performance improvement, considering that 40% of respondents fill a neutral scale in the survey. In addition, the survey results also indicate that the time points of the process / turnaround time need to be given more attention because the survey results show the dissatisfaction of business units.
Based on the results of the survey in 2015, there was a significant increase in the overall level of business satisfaction with Department Procurement performance, the satisfaction rate was 62.5% compared to 48% in 2013≈2014. However, procurement performance should be improved as almost all levels of interaction are still below the 68% standard. Based on the results of the 2015 survey there are three priorities that should be improved by Procurement Management, namely speed, communication skills, and procurement applications.
Based on the results of the survey in 2016, there was an increase for the overall level of business satisfaction with Department Procurement performance of 2.9%, satisfaction level reached 65.4% compared to 62.5% in 2015 satisfaction level.
Based on the results of the 2016 survey, speed and communication skills are still a priority that should be improved by Department Procurement. Survey participants also expect feature enhancements from the Sharepoint Purchasing application in terms of submitting procurement requests. Simplifying Purchasing Application may also increase the level of business unit satisfaction. Although almost all interaction points are relatively stable or only slightly improved compared to the performance of 2015, the level of satisfaction of vendor management experienced a significant surge compared with other attributes. 5.1. Procurement Performance Evaluation Results Are Assessed in Terms of Growth and Learning
In order to monitor the growth and learning process of Department Procurement, the top management establishes a Procurement Committee that routinely conducts meetings 4 times a year to discuss strategies / discourses / proposals related to Procurement operations. The Committee consists of 5 members of Senior Leader Team (Finance, Legal, Agency Operations, Compliance & Risk, IT) and Head of Procurement as secretary of the committee. In each meeting the committee will present presentations on Procurement process and structure development, procurement performance, initiative proposal, system improvement, and various other topics related to operational and Procurement strategy to continuously develop and improve the process. Presentation Documents Procurement Committee serves as a source of data to evaluate the progress and growth of the Procurement Department from 2013 to 2016. Various initiatives have been undertaken during 2013 - 2016 to improve the performance of Department Procurement. The growth and learning process of Department Procurement can be seen in table 3 below.

www.ijird.com July, 2018 Vol 7 Issue 7
INTERNATIONAL JOURNAL OF INNOVATIVE RESEARCH & DEVELOPMENT DOI No. : 10.24940/ijird/2018/v7/i7/129434-311572-1-SM Page 48
2013 2014 2015 2016 Initiatives Procurement
migration process to Sharepoint
system (sustainability)
Procurement Target
Operating Model
(PTOM) Project
Assessment
PTOM implementation Preparation of
performance matrices that match business
expectations Corporate Credit Card
approach & PRF to decrease PO
Replacement of tender box with secure email inbox
(sustainability)
New Procurement Policytailored to business needs:
- Competitive Bidding - Competitive evaluation
- Sole Souce - Direct Appointment
- Repeat Order Weekly meeting with
user
Organization structure
Part ofDepartmentt Business & Procurement Services (BPS) No role sharing strategic/
operational. Staff rotation between categories
annually (not specialist)
Stand of Department Procurement Management
Procurement restructuring become Strategic dan
Operasional Operational Team more
than Strategic Team Semi Category Specialist
Strategic Team more than Operational Team
80% Strategic / 20% operational (ad-hoc)
Category Specialist
Pening-katan
Sistem
Procurement Sharepoint
System
Approval process by
mobile
Automation order with RPR system
E-catalogue (RPN) system
Technology Roadmap forming
Table 3: Growth and Learning Process Department Procurement Source: Reports 2013 - 2016
5.2. Interview Result
Interviews have been conducted with three sources: AVP - Head of Procurement Management, AVP - Head of Digital Delivery (IT), and VP - Finance Operations, Sharia, Treasury and Corporate Tax. The IT department was chosen to be a business unit representative in the interview process because IT is the business unit that has the largest procurement total over the past few years.
Based on interviews with AVP - Head of Procurement Management, his evaluation for Procurement performance from a financial perspective of Procurement is increasingly mature in looking at savings opportunities for the company. Evaluation for Procurement performance from the perspective of business unit satisfaction is according to him good relationships with business units increased than in previous years. Regular meeting starting in 2016 with an IT business unit is considered successful. Evaluation for Procurement performance from the internal business process perspective Internal Procurement business process continues to improve during 2013 - 2016. Among other things has done a review of the approximation matrix, review the process of delegation, the process of repeating the process. Evaluation for Procurement performance from the perspective of growth and learning that according to him there is gap / gap growth between the strategic team with the operational team that is considered big enough. It needs training, knowledge sharing, knowledge transfer, not just in certain commodities, but for example cross commodity between strategic and operational team.
Based on the interview with AVP - Head of Digital Delivery (IT) as a representative of the Business Unit, his evaluation for Procurement performance from a financial perspective: Procurement has been actively involved since the beginning of the procurement process, from proposal process, vendor / principal, negotiating directly with the principal, so the savings obtained by business units are more optimal. Evaluation for Procurement performance from the perspective of business unit satisfaction is a regular meeting conducted routinely since 2016 is considered quite helpful business unit. Evaluation for Procurement performance from the perspective of internal business process is the division of Procurement team into Strategy and Operational is considered good for business unit. Evaluation for Procurement performance from the perspective of growth and learning that is from the aspect of initiative and understanding of a category, Procurement continues to increase understanding, as evidenced by the creation of various initiatives.
Based on interviews with VP-Finance Operations, Sharia, Treasury and Corporate Tax, his evaluation for Procurement performance from a financial perspective, Procurement has made monitoring to savings from the budget or from vendor offerings, in terms of savings already look better. Evaluation for Procurement performance from the perspective of business unit satisfaction is the improvement of Procurement that has been done now is getting better from year to year. He also argues that regular meetings with business units are considered very helpful both in terms of business units and from the procurement side. Evaluation for Procurement performance from the perspective of internal business process that Procurement progress which has been to now is getting better, considered to have transformed from Procurement Traditionally to Procurement that want to fulfill business requirement. Evaluation for procurement performance from the

www.ijird.com July, 2018 Vol 7 Issue 7
INTERNATIONAL JOURNAL OF INNOVATIVE RESEARCH & DEVELOPMENT DOI No. : 10.24940/ijird/2018/v7/i7/129434-311572-1-SM Page 49
perspective of growth and learning process that new team members joining Procurement is considered good in providing new perspectives and perspectives for procurement process improvement. In addition, process automation conducted by e-catalog is considered good. 5.3. Weighted Perspective Balanced Scorecard
After evaluating the results from four perspectives, namely finance, business unit satisfaction, internal business processes, and the growth and learning of Department Procurement Management, it is necessary to analyze the weighted and interconnection of each Balanced Scorecard perspective on the formulation of Procurement performance. Based on the weighting in the annual evaluation process in 2016, internal business process perspective became the first priority with a weighting of 45%. The second priority is a 30% weighted financial perspective. The third priority is the perspective of business unit satisfaction with a weighting of 15%. The fourth priority is growth and learning by weighting 10%.
In the interview process, the weighting of four perspectives in the Annual Performance Review (APR) staff was also re-asked to the resource person. According to (AVP - Head of Procurement Management, from a financial perspective will remain at 30%, then business satisfaction 15%, internal business processes may be slightly lowered to 35% to 40%, and learning growth in the 10% to 15% weight range.
AVP - Head of Digital Delivery (IT), weighted financial perspective will remain at 30%, weighted business unit satisfaction adjusted to 20% to 25%, internal business process weighting adjusted to 35% to 40%, and weighting learning perspective in 10%.
According to VP - Finance Operations, Sharia, Treasury and Corporate Tax, the weighting of the financial perspective needs to be adjusted to 45%, weighted business unit satisfaction by 15%, internal business process weighting adjusted to 30%, and weighted 10% fixed learning perspective.
Perspective Weighted APR Procurement 2016
AVP-Head of Procurement Management
AVP-Head of Digital Delivery
VP-Finance Operations, Sharia, Treasury and
Corporate Tax Finance 30 % 30 % 30 % 45 %
Satisfaction business unit 15 % 15 % 20 % - 25 % 15 % Internal business process 45% 35 % - 40 % 35% - 40 % 30 %
Growth and learning 10 % 10 % - 15 % 10 % 10 % Table 4: Interview Results on the Weighting of 4 (Four) Perspectives Balanced Scorecard
Source: Report 2016 6. Discussion
Based on the results of the analysis that has been submitted, it can be seen that the performance of Department Procurement continued to improve performance since 2013 until 2016. Significant performance improvement occurred when comparing the performance of 2013 to 2015 but tend to be stable between 2015 and 2016.
Life Insurance financial performance continues to increase, one of which can be seen from the continued increase in net income and Shareholder Equity Net income or Net Revenue reached Rp. 5.78 Trillion in 2016. While Shareholder Equity reached Rp. 9.57 trillion in 2016. Other financial aspects such as Return on Equity, Return on Assets, Return on Investment tend to be stable from 2014 to 2016. While Shareholder Equity growth tends to fluctuate from 2014 to 2016, although basically Shareholder Equity continues to experience increase annually. In terms of procurement contributions to procurement costs, Procurement has recorded savings in 2015 and 2016. Where there is an increase in the savings from 8.8% in 2015 to 11% in 2016. Contribution savings in 2015 and 2016 above the target set at 6 % of total procurement costs.
Satisfaction of business units also increased. However, the outline is still below the standard limit of 68%. Points that have increased to exceed standard values include Purchase Request (PR) approval process (69%), Purchase Order (PO) Processing (71%), Time required for regular purchasing process (73%), (77%), procurement teams are clear and transparent in communication and focus on the end result of a business (73%), procurement teams deftly respond to simple and simple requests (71%), procurement teams are effective in providing alternative comparisons of goods / services required user (70%). The improvements in some points are influenced by the initiatives that occur in the growth and learning process which then impact on internal business processes and performance changes during 2013 - 2016. Initiatives such as the simplification of the approval matrix so that PR and PO can be processed more quickly and staffing becomes semi-specialist is considered to have a positive impact on some points.
The results of internal business process assessments also increased. Significant improvements occur due to a shift in the procurement process from previously manual to switch to purchasing applications. Points that have increased beyond standard values include Purchasing application sharepoint application helps to simplify the purchase process (89%), business unit satisfaction with vendor selection provided by Department Procurement (87%), Vendors selected can understand business needs (92) %), Vendor evaluation process performed by Department Procurement efficiently (92%), Business Unit never faces delays that cannot be tolerated due to relationship with unsupervised vendors (87%), Contract management team
www.ijird.com July, 2018 Vol 7 Issue 7
INTERNATIONAL JOURNAL OF INNOVATIVE RESEARCH & DEVELOPMENT DOI No. : 10.24940/ijird/2018/v7/i7/129434-311572-1-SM Page 50
has good knowledge in managing contracts in order to purchase goods / services (73%), contract management team is quick and responsive in follow up review contract (71%), contract management team works in accordance with agreed TAT (70%), Dept. Team Procurement assures that party services the third understands about business needs (80%), Third-party services consistently complete the work (76%), and Department Procurement provides support in resolving escalation and solving all problems with third party services (77%).
The procurement and learning process of Department Procurement also continues to change from 2013 to 2016. Various initiatives have been implemented during 2013 - 2016 to improve the performance of Department Procurement. In 2013, Department Procurement migrates processes from previously manual and requires a lot of printed documents to the use of application technology. This transition speeds up the buying process and also considers the element of sustainability where paper usage can be lowered.
To continue to improve the performance of Department Procurement, Corporate Governance Vendor in 2014 held a workshop with Department Procurement. The objective is to formulate the Procurement Target Operating Model (PTOM) by identifying the current Department Procurement condition and the objectives to be achieved. Activities in the preparation of PTOM include collaboration sessions, reviewing the procurement process undertaken to determine steps to improve activities, standardize processes, control budget monitoring with finance, and change the mindset of business units by conducting socialization.
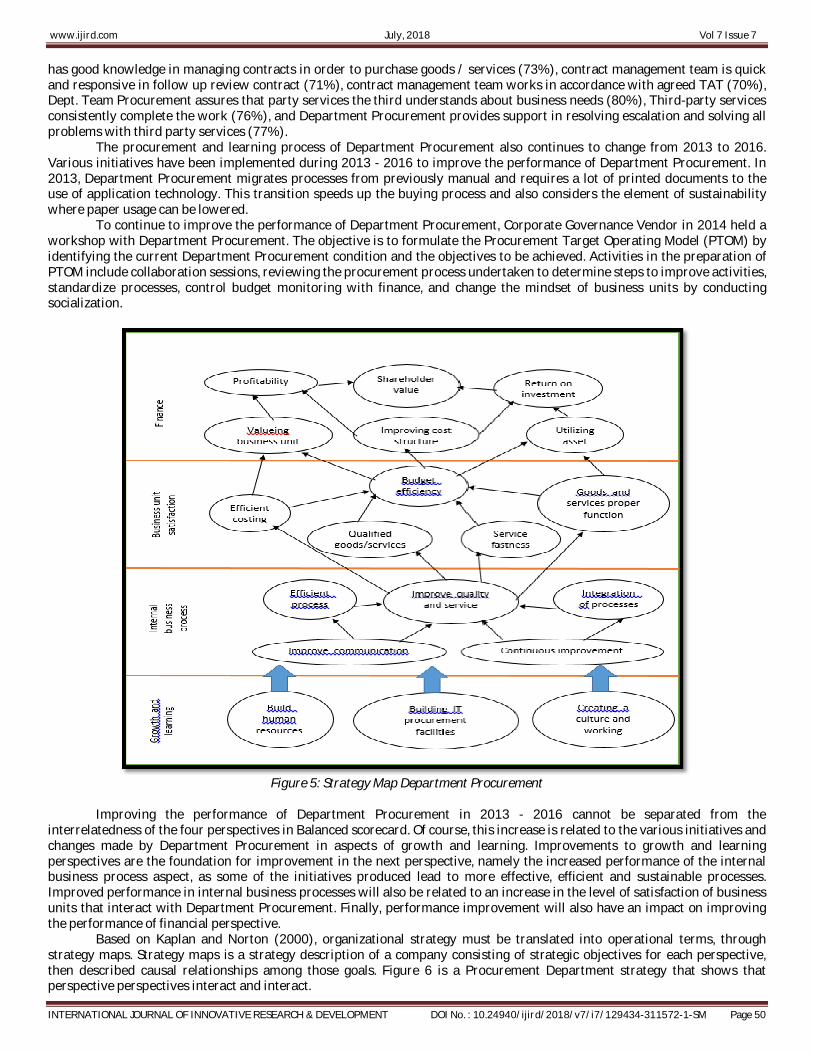
Figure 5: Strategy Map Department Procurement
Improving the performance of Department Procurement in 2013 - 2016 cannot be separated from the
interrelatedness of the four perspectives in Balanced scorecard. Of course, this increase is related to the various initiatives and changes made by Department Procurement in aspects of growth and learning. Improvements to growth and learning perspectives are the foundation for improvement in the next perspective, namely the increased performance of the internal business process aspect, as some of the initiatives produced lead to more effective, efficient and sustainable processes. Improved performance in internal business processes will also be related to an increase in the level of satisfaction of business units that interact with Department Procurement. Finally, performance improvement will also have an impact on improving the performance of financial perspective.
Based on Kaplan and Norton (2000), organizational strategy must be translated into operational terms, through strategy maps. Strategy maps is a strategy description of a company consisting of strategic objectives for each perspective, then described causal relationships among those goals. Figure 6 is a Procurement Department strategy that shows that perspective perspectives interact and interact.

www.ijird.com July, 2018 Vol 7 Issue 7
INTERNATIONAL JOURNAL OF INNOVATIVE RESEARCH & DEVELOPMENT DOI No. : 10.24940/ijird/2018/v7/i7/129434-311572-1-SM Page 51
Based on strategy maps in figure 6 above can be seen that 4 (four) perspectives are interrelated with each other. In the perspective of growth and learning is characterized by a thick arrow as it becomes the basis for performance improvement in the other three perspectives. Increasing the competence of human resources in the Department of Procurement, the development of IT technology (e-catalog, e-procurement), as well as the dynamic, fast and responsive improvement of culture and working atmosphere can affect performance improvement from internal business process perspective. Internal business processes in question are more efficient processes, better communication, better integration with related departments, and continuous improvement in the quality of procurement services.
Improved internal business processes will also have an impact on increasing the perspective of business unit satisfaction. The business unit's satisfaction perspectives include more efficient procurement costs, improved quality of goods and services of good quality, improved procurement process speed, and goods and services received in the proper manner and in accordance with the requirements of the business unit. The increase in these 3 perspectives has an impact on improving performance in the financial perspective. The financial perspective is the improvement of the business unit value, the improvement of business unit cost structure related to the procurement of goods / services, the increase of asset utilization, the increase of return of investment, the increase of profitability, and the increase of shareholder value. This is in accordance with research Khatoon and Farooq (2014).
In addition to efforts to improve end-to-end integrated systems, Department Procurement has made Procurement Management (PM) Technology Roadmap. This has been in line with Hong's research (2012). Where in the development there are 3 (three) phases and will be completed in 2019. Phase 1 in 2016 is the development of e-catalog system, phase 2 in 2017 is the development of Vendor Management database and e-budgeting, phase 3 in 2018 is development e-tender, e-vendor registration, and e-budget monitoring.
Figure 6: Procurement Technology Roadmap 2016 - 2019
Source: Report 2016 7. Conclusions and Recommendations 7.1. Conclusion
Based on Procurement performance evaluation during 2013 - 2016 with Balanced Scorecard approach on Life Insurance, the conclusion of this research:
The performance of Department Procurement thoroughly continues to increase from 2013 to 2016 in the four perspectives of Balanced Scorecard.
Performance The financial perspective is continuously improving with the increasing contribution of Department Procurement. The contribution of procurement savings increased from 8.8% to total company procurement in 2015 to 11% of total company procurement in 2016.

www.ijird.com July, 2018 Vol 7 Issue 7
INTERNATIONAL JOURNAL OF INNOVATIVE RESEARCH & DEVELOPMENT DOI No. : 10.24940/ijird/2018/v7/i7/129434-311572-1-SM Page 52
Performance The business unit's satisfaction perspective is assessed to continue to improve with average business unit satisfaction rates continuing to increase from 2013≈2014, 2015 and 2016. From 2013≈2014 by 54%, to 64% in 2015, and to 67 % by 2016.
Performance Internal business process perspectives are assessed to continue to improve with Procurement performance from internal business process aspects continuously increasing from 2013≈2014, 2015 and 2016. From 2013≈2014 with 59% satisfaction rate, to 66% in 2015, and to 72% in 2016.
Performance growth and learning perspective is assessed steadily improving with various initiatives that have been carried out during 2013 - 2016.
Improved Procurement Department performance in 2013 - 2016 is the result of improved performance in Balanced Scorecard perspective, where various growth and learning initiatives that have been carried out during 2013 - 2016 can improve performance from internal business process perspective, business unity satisfaction, and finance.
7.2. Recommendation
Based on Procurement performance evaluation during 2013 - 2016 with Balanced Scorecard approach on Life Insurance, the recommendation of this research:
To improve the performance of the financial perspective Department Procurement and the Department of Finance should collaborate to find a direct cost savings monitoring mechanism to the budget, the current record is still manual because there is no system that integrates the savings and budget system.
To improve the performance of business unit satisfaction, it is necessary to increase the understanding of Procurement staff to procurement commodities so that Procurement staff is expected to add value to the business unit needs. In addition, the procurement process should be faster, and administrative process more effective and efficient.
To improve the internal business process perspective performance requires a more efficient and effective process review, reduction of bureaucratic stages, and must be fast and responsive to assist business processes. The need to adapt the implementation of the Procurement Management Framework (PMF) Policy from regional to business needs.
Synergy, integration, and process alignment with Department procurement are required To improve the performance of growth and learning perspective, it is necessary to improve the capability of the
Department Procurement team to better understand the purchasing commodities and make the procurement process faster, as well as the need for the development of knowledge transfer process between the strategic and operational team. Required e-procurement technology that includes all end-to-end Procurement processes, where end-to-end Procurement processes must be done through the system, since manual processes are deemed ineffective. New vendor registration process should also be easier (e-vendor registration). In addition, it is necessary to coordinate with other Department such as legal and finance to contribute to system and technology integration related to procurement process.
We need to review the weighting of each Balanced Scorecard perspective in the annual evaluation of Procurement Department's performance.
8. References
i. Abdolali Pour, A., Morteza Shafiee, and Zabihollah Rezaiee. (2011). Designing a Balance Scorecard model for Procurement Performance Assessment in IOTC Using TOPSIS. 3rd International Conference on Information and Financial Engineering.http://www.ipedr.com/vol12/33-C039.pdf
ii. Ax, Christian and Trond Bjørnenak, 2005, Bundling and Diffusion of Management Accounting Innovations - The Case of the Balanced Scorecard in Sweden, Management Accounting Research 16 (1-20) https://gupea.ub.gu.se/bitstream/2077/19279/4/gupea_2077_19279_4.pdf
iii. Catuogno, Simona; Claudia Arena, Sara Saggese and Fabrizia Sarto (2017)Balanced performance measurement in research hospitals: the participative case study of a hematology department, BMC Health Services Research 17(522) https://bmchealthservres.biomedcentral.com/track/pdf/10.1186/s12913-017-2479-6?site=bmchealthservres.biomedcentral.com
iv. David, F. R. (2015) Strategic Management Concept and cases – 15th.ed. Pearson Education Limited. v. Figge F, Hahn T, Schaltegger S, and Wagner M. 2002. The Sustainability Balanced scorecard – linking sustainability
management to business strategy. Wiley 30 InterScience Business Strategy and the Environment. Bus. Strat. Env. (11):269–284. https://doi.org/10.1002/bse.339
vi. Gaspersz, Vincent. (2005). Production planning and inventory control, Gramedia Pustaka Utama, Jakarta vii. Hong, Paul C and He-Boong Kwon (2012) Strategic Procurement: A Review and Prospect. International Journal of
Procurement Management5 (4):452-469. https://www.researchgate.net/publication/264118835_Strategic_Procurement_A_Review_and_Prospect
viii. Huegens, Torben and Stephan Zelewski, (2008) Combining Qualitative Reasoning and Balanced Scorecard to model future behavior of a company http://www.qrg.northwestern.edu/papers/Files/qr-workshops/QR06/huegens-zelewski-qr06.pdf
www.ijird.com July, 2018 Vol 7 Issue 7
INTERNATIONAL JOURNAL OF INNOVATIVE RESEARCH & DEVELOPMENT DOI No. : 10.24940/ijird/2018/v7/i7/129434-311572-1-SM Page 53
ix. Jafari, Mostafa, Kamran Shahanaghi, and Majid Tootooni (2015) Developing a Robust Strategy Map in Balanced Scorecard Model Using Scenario Planning Mathematical Problems in Engineering. Volume 2015, Article ID 102606, 9 pages. http://dx.doi.org/10.1155/2015/102606
x. Juzokaite, Egle and Trainavičiūte, Lina. (2009). Procurement Optimisation based on Balanced scorecard. Aalborg University. Thessis.https://projekter.aau.dk/projekter/files/18185348/master_thesis_Trainaviciute___Juzokaite.pdf
xi. Kaplan, R.S. and Norton, D.P. (2000) The Strategy-Focused Organization. Boston:Harvard Business School Publishing Corporations.https://www.hbs.edu/faculty/Pages/item.aspx?num=5595
xii. Khatoon, Saira and Ayesha Farooq (2014) Balanced Scorecard to Measure Organizational Performance: A Case Based Study. The International Journal of Business & Management 2(9).
xiii. Kumar, Arun, LinetOzdamar, Chai Peng Ng (2005) Procurement performance measurement system in the health care industry. International Journal of Health Care Quality Assurance, 18(2/3) https://www.researchgate.net/publication/7768222_Procurement_performance_measurement_system_in_the_health_care_industry
xiv. Vaidya, K., Callender, G., Sajeev, A.S.M, dan Gao Junbin. (2004). Towards a Model for Measuring the Performance of e-Procurement Initiatives in the Australian Public Sector: A Balanced scorecard Approach. Australian Electronic Governance Conference. Centre for Public Policy, University of Melbourne, Melbourne Victoria, 14th and 15th April, 2004.http://citeseerx.ist.psu.edu/viewdoc/summary?doi=10.1.1.196.1202
xv. Van Weele, A.J. and Erik M. V. R. (2014) The Future of Purchasing and Supply Management Research: About Relevance and Rigor, Journal of Supply Chain Management. 50(1) https://www.arjanvanweele.com/42/records/63/Van%20Weele%20and%20van%20Raaij.The%20Future%20of%20Purchasing%20Research.JSCM.February.2014.pdf
xvi. Waskito dan Agustina. (2015). Penerapan Balance Scorecard Sebagai Tolok Ukur Kinerja Pada Rsud Kota Semarang. Accounting Analysis Journal 4 (1).https://journal.unnes.ac.id/artikel_sju/aaj/7799
xvii. Wheelen, Thomas L. & Hunger, J. David. (2012). Strategic Management and Business Policy : Toward Global Sustainability - 13th Edition. New Jersey. Pearson Education Inc.
xviii. Yuwono. (2007). Petunjuk Praktis PenyusunanBalanced scorecard Menuju Organisasi yang Berfokus pada Strategi,Jakarta , PT Gramedia Pustaka Utama
xix. Zelman, W.N; George H.P.; Catherine B.M. (2003) Use of the balanced scorecard in health care. Journal of Health Care Finance; 29(4) https://uncch.pure.elsevier.com/en/publications/use-of-the-balanced-scorecard-in-health-care