performance-based ship management contracts … performance-based ship management contracts using...
TRANSCRIPT
ARTICLE
Performance-based ship management contracts usingthe Shipping KPI standard
Agathe Rialland & Dag Atle Nesheim &
Jan Arthur Norbeck & Ørnulf Jan Rødseth
Received: 13 March 2013 /Accepted: 28 January 2014 /Published online: 11 February 2014# World Maritime University 2014
Abstract An important benefit of performance-based contracts is a better risk andprofit-sharing mechanism and by that a means to overcome the “split incentive”problem in current shipping contracts. “Split incentive” means that the risk or cost ofimplementing beneficial measures does not fall on the same party that gets the benefits.However, performance-based contracts do not come without challenges. These arerelated to defining commonly agreed performance measurements and an incentivescheme that can counteract problems like allocative efficiency and information asym-metry. This paper gives an example of how these challenges can be addressed by usingthe Shipping KPI standard. The purpose of the paper is to show how a standard set ofkey performance indicator definitions and corresponding benchmark values can greatlysimplify the design of a performance-based contracts scheme by providing well-definedreferences for both owner and manager. This is done by creating a bonus and penaltyscheme where the payment is related to a single variable (budget performance), while anumber of quality indicators control whether a bonus will be paid at all. The paper willdiscuss this principle in relationship to problems identified in literature on performance-based contracting and ship management and provide an overview of possible strengthsand weaknesses.
Keywords Performance-based contract . Shipmanagement . ShippingKPI . KPI .
Management contract
1 Introduction
Shipping operations are facing a number of challenges. These are related to, e.g.,increasing costs, such as higher fuel and crew expenses, societal issues, such as everstricter emission regimes and a stronger focus on energy efficiency, and all these in a
WMU J Marit Affairs (2014) 13:191–206DOI 10.1007/s13437-014-0058-9
A. Rialland :D. A. Nesheim : J. A. Norbeck : Ø. J. Rødseth (*)Norsk Marinteknisk Forskningsinstitutt AS (MARINTEK), POB 4125 Valentinlyst,NO-7450 Trondheim, Norwaye-mail: [email protected]

market characterized by highly irregular market cycles and intense internationalcompetition.
Over many years, shipping has dealt with similar challenges by developing anefficient framework of regulatory and contractual relationships between the parties.However, as the challenges continue to grow and new technologies such as automaticidentification systems and proliferating satellite communication provide a strong tech-nology push, there is a definitive need and potential to look for new types and moremodern contractual relationships between the parties. The performance-based contract(PbC) and its applicability by introducing a standard set of key performance indicators(KPIs) will be examined in this paper.
There are several issues that complicate the use of PbC, and at the heart of these isarguably the availability of reliable information. The Shipping KPI standard (ShippingKPI 2012) provides a standard key performance indicator system and benchmarkingfacilities for participating ship management companies as well as facilitates communi-cation of own performance to other parties by providing industry benchmarks. Althoughthe Shipping KPI standard also faces some challenges such as data reliability (seeSection 5.1), it is an interesting proposal as a neutral information source for use in PbC.
In the EU-supported Flagship project (2011), a number of scenarios for futureshipping operations were developed, and a clear trend also here was the need for moreefficient cooperation between the different parties. The roles of KPIs and PbC wereamong the issues discussed and which were expected to make an impact in the future.This lead to the idea of testing out a simple concept of PbC in ship management basedon the performance measurements developed by Shipping KPI (Norbeck et al. 2011).This paper revisits the PbC approach used in that study and puts it into a more extensiveframework where benefits and problems related to the described approach are identifiedand discussed.
2 Method
The research question posed by this paper is the following: The Shipping KPI standardintroduces a standard way to measure ship operation performance and a database thatmakes it possible to provide benchmark values for the KPIs. How can this be used todevelop a simple and robust PbC scheme between ship owners and managers?
To answer this question, this paper reviews a proposed method from Norbeck et al.(2011). It demonstrates how clauses in the SHIPMAN ship management contract(BIMCO 2009) can be mapped to performance indicators in the Shipping KPI systemand then used to propose a PbC extension to SHIPMAN. By using real life KPI valuesfrom the Shipping KPI database populated from 200 ships over a full year, it also showshow performance criteria in the PbC contract can be determined empirically. Finally,the resulting contract proposal is tested against some sample cases in the Shipping KPIdatabase to see how these cases would perform in a real-world setting.
The paper is based on the same data sample and results as was used in the originalstudy. The contribution of this paper is to provide a better understanding of themethodology, including strengths and weaknesses based on a qualitative assessmentand more extensive literature studies. The assessment and literature studies include anoverview of the Shipping KPI standard in terms of suitability for PbC as well as more
192 A. Rialland et al.

general problems related to PbC in shipping, in particular, what incentive schemes areused and problems that may occur.
Section 3 reviews ship management and ship management contracts and identifieswhat issues are important in the relationship between ship owners and managers.Section 4 reviews performance-based contracting and some important problems thathave been identified related to its use. Section 5 gives an overview of the Shipping KPIstandard. Section 6 explains the PbC method developed in the Flagship project anddiscusses how that may perform in light of the issues identified in the literature study. Adiscussion, summary, and conclusion can be found in Sections 7 and 8.
3 Owner-manager relationships and contracts
When a ship owner has contracted a ship manager to operate the ship, differentfunctions are outsourced. This may include crewing, technical operations, and otherservices. A commonly used contract format is the BIMCO’s SHIPMAN contract(BIMCO 2009). This contract is a typical “costs plus fixed price” type (CPFF inFig. 2). This means that the contract has no incentive component: The manager getspaid for the specific services that are needed and gets all external costs refunded.
According to Mitroussi (2004), ship owners are in general somewhat reluctant tohire in third party ship managers. This is contrary to a number of market mechanismsthat should encourage this type of outsourcing, including the increasing complexity inshipping and corresponding need for specialized expertise and tools as well as eco-nomics of scale. The reasons for the owners’ skepticism varies, but the main issues arereported to be sufficient in internal expertise, the need to be in contact with the marketoneself, and the desire to be in control of the ship operations oneself. Another factor,reported by 49 % of the respondents, is a general lack of confidence in ship managers.Fifty-one owners responded in this investigation.
On the other hand, the top four reasons for using ship management is reported to beexpertise (73 %), access to crew (60 %), flexibility (60 %), and economies of scale(53.3 %). With a total of 15 respondents on this part, the statistical significance may besomewhat limited, but it can be argued that the ship owners seem to look for efficientand competent management companies that offer a reasonable price, but that about50 % of the owners do not trust the managers to deliver this. Price alone is not adecisive factor but is important as soon as the quality attributes are ascertained. Asimilar picture emerges in the study by Panayides and Cullinane (2002). The studyreceived answers from 36 ship owners and found that when owners select managementcompanies, they foremost emphasize quality of services (technical ability, qualifica-tions, experience, and specialization), then reputation (reputation and recommenda-tions) and in third place, price.
From these studies, there seem to be a certain lack of trust between ship owners andmanagement companies. This may make the use of less prescriptive contracts thanSHIPMAN difficult, unless reliable and transparent performance measures can beestablished. Shipping KPI can play a role here, but the lack of trust can also be aproblem in the Shipping KPI standard itself. This issue will be returned to in Section 5.
The relatively lower emphasis on management cost by the owners may be explainedby the management fee being a relatively small part of the total operational cost. One
Performance-based ship management contracts 193
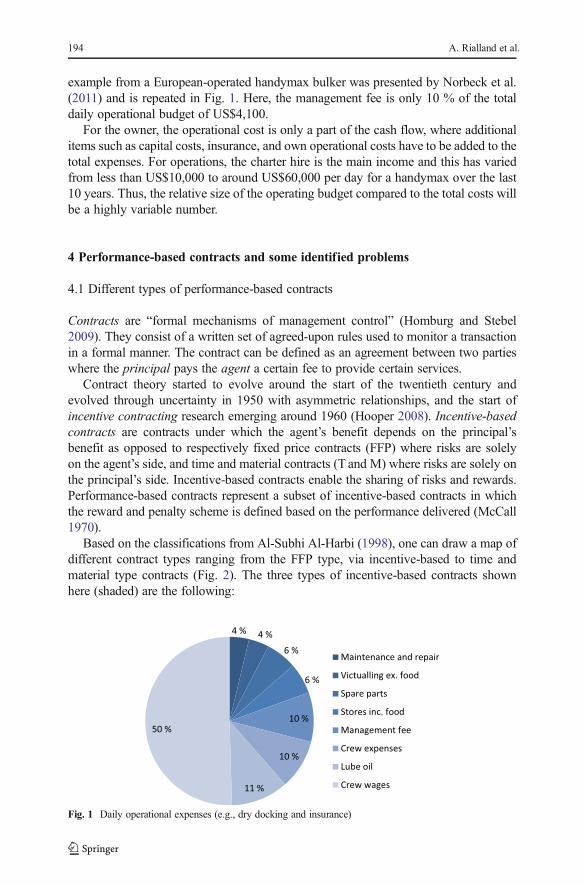
example from a European-operated handymax bulker was presented by Norbeck et al.(2011) and is repeated in Fig. 1. Here, the management fee is only 10 % of the totaldaily operational budget of US$4,100.
For the owner, the operational cost is only a part of the cash flow, where additionalitems such as capital costs, insurance, and own operational costs have to be added to thetotal expenses. For operations, the charter hire is the main income and this has variedfrom less than US$10,000 to around US$60,000 per day for a handymax over the last10 years. Thus, the relative size of the operating budget compared to the total costs willbe a highly variable number.
4 Performance-based contracts and some identified problems
4.1 Different types of performance-based contracts
Contracts are “formal mechanisms of management control” (Homburg and Stebel2009). They consist of a written set of agreed-upon rules used to monitor a transactionin a formal manner. The contract can be defined as an agreement between two partieswhere the principal pays the agent a certain fee to provide certain services.
Contract theory started to evolve around the start of the twentieth century andevolved through uncertainty in 1950 with asymmetric relationships, and the start ofincentive contracting research emerging around 1960 (Hooper 2008). Incentive-basedcontracts are contracts under which the agent’s benefit depends on the principal’sbenefit as opposed to respectively fixed price contracts (FFP) where risks are solelyon the agent’s side, and time and material contracts (T and M) where risks are solely onthe principal’s side. Incentive-based contracts enable the sharing of risks and rewards.Performance-based contracts represent a subset of incentive-based contracts in whichthe reward and penalty scheme is defined based on the performance delivered (McCall1970).
Based on the classifications from Al-Subhi Al-Harbi (1998), one can draw a map ofdifferent contract types ranging from the FFP type, via incentive-based to time andmaterial type contracts (Fig. 2). The three types of incentive-based contracts shownhere (shaded) are the following:
Fig. 1 Daily operational expenses (e.g., dry docking and insurance)
194 A. Rialland et al.

& Fixed price incentive (FPI), a contract under which the target profit depends on boththe targeted costs and an agreed-upon sharing proportion. The savings realized areshared based on an agreed ratio (McCall 1970; Al-Subhi Al-Harbi 1998).
& Cost-plus-award-fee (CPAF), where the agent is paid all reasonable costs, plus a(subjective) award based on the agent’s work performance, determined, e.g., by anaward committee. This type of contract is more subjective than CPIF, and thereforemore flexible, but is relatively more costly in administration.
& Cost-plus-incentive-fee (CPIF), a contract under which a specific rate of profit for agiven level of performance is agreed, together with an incentive payment for higherlevels of performance.
Commonly used ship management contracts such as the BIMCO’s standard SHIP-MAN contract can be placed in the figure as a CPFF type contract.
All principal-agent relationships and contract types are subject to a number ofproblems that have been discussed extensively in the literature. In the followingsubsections, we discuss three general problems that are of particular interest inperformance-based contracts.
4.2 Allocative efficiency
Allocative efficiency (Michael 1957) means that in a multitask contract, the agent willtend to put more effort into more observable or better paid tasks. Effort substitution,effort distortion, and manipulation of measures are typical cases of this “multiple tasksmoral hazard” problem (Hooper 2008; Zhao 2008; Fearnley et al. 2004, Holmstromand Milgrom, 1991). They are explained by the agent’s tendency to allocate efforts inorder to maximize own margins or in a way that “makes them look good” (Woods2012), but not necessarily in line with the principal’s objectives. These problems arewell known and widely covered in the literature on performance-based contracts.Unfortunately, no suggestions exists for a “standard” incentive schemes to overcomethis problem. This is to be expected given the complexity and large number of factorsand trade-offs influencing the design of payment models (Hooper 2008).
One suggestion is to establish several bonuses based on distinct measures in order torebalance the incentives (Gibbs et al. 2004). However, this may also increase theinformation asymmetry problem and making the bonus and penalty calculation morecomplex. A similar suggestion is to use nonfinancial measures to complement thefinancially based level of compensation. This can better reflect overall performance, as
Fig. 2 Contract type and associated risk (adapted from Al-Subhi Al-Harbi 1998)
Performance-based ship management contracts 195

suggested by Feltham and Xie (1994). This is close to the principle employed in thisstudy. The idea of budget fulfillment for calculation of bonus together with qualitycheck for appropriation of bonus has also been discussed in more detail in an empiricalstudy on ship management contracts (Hollebrands 2011).
4.3 Information asymmetry
Information asymmetry means that the principal and agent have access to differentinformation and can use this to skew the relationship between the two. Informationasymmetry is a fundamental problem in principal-agent relationships and can createproblem of adverse selection or moral hazard. Adverse selection happens when aprincipal enters into a contract with an agent on false premises, and moral hazard isthe tendency of an agent to take shortcuts when the principal does not have easilyavailable means to detect it. When choosing an incentive scheme, principals face thechallenge of defining performance criteria and targets that can neutralize the negativeconsequences of information asymmetry.
A correct set of precise performance measures is the key, if one wants to elude the“folly of rewarding A, while hoping for B” (Kerr 1975). In line with this, Zhao (2008)recommends using direct results indicators, which will help to ensure observability oftasks and results. Also, a unique compensation is recommended by several studies,either calculated on quantity results (Zhao 2008; Rajan and Reichelstein 2009) or onquality results (Olmos and Martinez 2010). Unique and direct quantity results are usedin this study.
4.4 Contract complexity
The anticipation of time and resource necessary to implement and monitorperformance-based contracts—define incentive scheme, design contract format, selectparameters, set target values, follow-up and adapt to exceptions, and handle after-delivery negotiation—can be quite dissuasive. More specifically, intense communica-tion during performance analysis and the interpretation of the contract terms anddefinitions are two main sources of high monitoring costs which have been reportedby Hollebrands (2011). This will at least in part be addressed by the use of the ShippingKPI standard which is a generally agreed-upon set of performance measures defined bythe managers themselves.
5 The Shipping KPI standard
5.1 Overview of Shipping KPI
The Shipping KPI standard was launched for general use in 2010 by InterManager andlater revised in 2012. It is now a de facto standard set of key performance indicators forship operations and ship management. The Shipping KPI database contains data frommore than 2,000 ships as of July 2013 and is growing steadily. Shipping KPI is aninteresting set of measurement points for a ship management PbC as they are stan-dardized and well understood. A growing number of users also make it possible to
196 A. Rialland et al.

provide statistically significant benchmark values to be used as reference points in thecontracts.
The Shipping KPI standard consists of eight high-level shipping performanceindexes (SPI), each representing a central performance area for ship operations. TheSPIs and their general description are listed in Table 1. Each SPI is aggregated from anumber of KPIs which again are calculated from low-level performance indicators (PI).The number of PIs and KPIs used in each SPI is listed in the table. Most PIs are onlyused to construct one specific KPI (sum of 78 occurrences versus 64 individual PIs).Similarly, most KPIs are used in one specific SPI (sum of 35 occurrences versus 33individual KPIs). Table 2 lists the individual KPIs.
5.2 Comments to the Shipping KPI standard
A general complaint that is regularly heard from prospective users of thestandard is that they do not trust the data entered by some ship managementcompanies and that benchmarks will be skewed by too positive reports fromthese managers. This does probably correspond to the mistrust between ownersand ship managers referred to in Section 3. This is a valid point as there is nocertification or review mechanism in place today that can guarantee validity.However, one can argue that the large number of ships in the database would atleast reduce the potential problem and may also make it possible to detectsuspicious data from certain ships managers.
A related problem has been observed during implementation of the reporting regimein a company (Nesheim 2013). Poor data quality may result from lack of understandingof the standard or to organizational factors such as fear that reported values can cause
Table 1 Overview of shipping performance indexes
SPI General description KPIs PIs
SPI001 environmental performance Ability to avoid spills and other formsof pollution that impact the environment,caused by the vessel operations.
4 6
SPI002 health and safety performance Ability to effectively manage the healthand safety of the personnel on board.
5 14
SPI003 HR management performance Ability to employ, retain, and developpersonnel with the required competences.
7 20
SPI004 navigational safety performance Safe navigation and absence ofnavigational deficiencies.
2 5
SPI005 operational performance Operational efficiency of the vesselincluding passenger care, safe and efficientcargo handling, vessel availability, andbudget management.
8 17
SPI006 security performance Ability to manage vessel security. 2 4
SPI007 technical performance Maintenance and reliability of technical systems. 2 2
SPI008 other Miscellaneous, related to port state control,fire and explosion, and emissions to air.
5 10
Performance-based ship management contracts 197

consequences for departments or individuals. The quality of the data reported is verydependent on a good implementation process in the organization.
Another criticism against the Shipping KPI standard is that some of the KPIs in anSPI group have limited relevance and that the weighting of KPIs into the high-levelSPIs is not always logical. The latter issue was investigated by Duru et al. (2013) wherea quantitative approach to mapping KPIs to stakeholders’ interests was used. The studyshowed a high variability in some SPI categories with regard to the perceived impor-tance of the KPIs in the group. However, for PbC, this does not matter as one willnormally use KPIs rather than SPIs in performance judgements as there is too highgranularity on the SPI level.
Interestingly enough, the study by Duru et al. shows a much higher weighton “cheap service” (0.27) and “business network and cost efficiency” (0.26)than, e.g., “ensuring the good condition of hull” (0.18). Although only 12operators participated in the study, the result is quite different from the con-clusions from other studies referred to in Section 3. The investigation alsoshowed that the two most important KPIs, from the users’ perspective, werethe “flawless port state control performance” and the “budget performance.”The budget performance is obviously relevant for operational costs and a portstate detention of the ship can be very costly in terms of off hire.
Finally, there have been some discussions on the relevance and/or definitions ofsome KPIs. As will be discussed in the next subsection, the emission efficiencyindicators were not used in the PbC scheme as the values are dependent on the cargovolume transported, over which the manager normally has no control. This could alsobe construed as an argument that the indexes maybe should be defined differently sothat the manager’s contribution to performance was made clearer. Another similarcomment is that there may be correlations between some KPIs that reduce their valueas stand-alone indicators. This will be discussed in Section 6.1.
Further research is needed to investigate these problems and provide more informa-tion about actual data reliability.
Table 2 General mapping from SHIPMAN to Shipping KPI
SHIPMAN Shipping KPI
4. Technical management Ballast water management; failure of critical equipment and systems;fire and explosions; flawless PSC performance; PSC deficiency ratio;PSC detention; vessel availability; navigational incidents; cargo-relatedincidents; releases of substances as defined by MARPOL Annex 1–6;contained spills; environmental deficiencies; navigational deficiencies;operational deficiencies; security deficiencies; passenger injury ratio;vetting deficiencies; CO2 efficiency; NOx efficiency; SOx efficiency;conditions of class; dry-docking planning performance
5. Crew management andcrew insurances
Lost time injury frequency; lost time sickness frequency; crew planning;officer experience rate; officer retention rate; health and safetydeficiencies; HR deficiencies; training days per officer; cadetsper ship; crew disciplinary frequency
6. Commercial management Budget performance
7. Insurance n/a
198 A. Rialland et al.

5.3 Mapping Shipping KPI to SHIPMAN clauses
By comparing SHIPMAN clauses in “Section 2 Services” with the ShippingKPI standard, indicators were sorted into groups that can be used to measureperformance in three of the four areas listed in Table 2. This includes all 33Shipping KPIs.
The mapping does not include performance indicators for all subclauses ofSHIPMAN but provides a fairly good coverage of the most important areas.Some of the indicators were not used in the study as they did not satisfy allrequirements listed in Section 6.1. The omitted KPIs are typeset in italics in thetable.
6 Designing a PbC for ship management based on shipping KPI
6.1 Using KPIs in an incentive scheme
A PbC could be designed by mapping each KPI used in the performancemeasurement to some monetary value and then aggregate the net bonus orpenalty. However, this principle requires a general translation of performanceinto monetary value, which is difficult for most KPIs. Looking at the ShippingKPIs listed in Table 2, the only KPI that easily maps to monetary value is thebudget performance.
Section 3 indicates that ship owners are less concerned by management coststhan other factors. However, this does not mean that the operational costs andthe budget are of similarly low interest. The management fee is typically onlyon the order of 10 % of the overall operational costs for a ship (Fig. 1), andwith today’s low charter rates, the operational cost and the budget performanceare substantial parts of the operational economics for the owner. Also, themanager should normally have a good possibility to influence the budgetperformance as most cost factors are under the manager’s control. The budgetperformance is an easily calculated number that is known to both parties.Connecting the budget performance directly to bonus payments represents abudget-linear compensation (Fisher et al. 2003).
However, budget-linear compensation does not mean that risks becomelinearly distributed. An obvious case here is that the manager delays necessaryrepairs to keep the total costs below budget. This may cause a breakdowncausing a costly off hire for the owner, but which does not impact theoperating costs and budget performance, until the repair is performed. Thismay indicate that certain budgetary costs, typically repairs, should be kept outof the budget performance measurement.
There is another potential problem of using budget performance as main factor forbonus payment in that it will encourage the manager to try to increase the budget asmuch as possible during contract negotiations.
To avoid that the focus on budget performance negatively impacts other perfor-mance categories, a number of KPIs were selected to provide quality control. Thiscategory consists of 21 KPIs selected from the 32 remaining KPIs. The selection was
Performance-based ship management contracts 199

done by excluding from the list the KPIs falling into one or more of the followingcategories:
– Irrelevant for ship type (e.g., passenger-related KPIs for a cargo ship).– The ship manager only has limited possibility to control the KPI (e.g., emission
efficiency, as Shipping KPI measures these relative to transported tonnage, overwhich the manager has little control).
– Statistically rare (e.g., fire and explosion).– KPI with insufficient statistical data in the Shipping KPI database at the time of the
exercise (e.g., flawless port state control performance).
In the original study, some KPIs related to officer training and retention wereomitted. The rationale for this was that these KPIs were mainly fleet related and thatfor a ship-based contract, it may not be useful to include quality indicators that cannotbe linked directly to the manager’s performance for that particular ship. However, asofficer quality is closely linked to quality of operations, this may be decided otherwisein a real case.
It may also be argued that some of the quality KPIs used in the first studywere correlated. This may apply, e.g., to the port state inspection indicators aswell as to some crew management indicators. In the original study, there wasnot enough data available to see if such correlations existed, but this canprobably be checked when more data is reported into the database. Correlationwill lead to increased sensitivity in attributing bonus or penalty based on thosegroups of indicators.
Another obvious problem is that linking incentive schemes to indicators thatare reported by the managers may lead to underreporting of “near misses.” Thishas been documented for certain safety indicators for mine workers in Australia(Shaw et al. 2007). This is to some degree compensated for by independentassessments, e.g., from class and port state control, but the owner should stillconsider if some of these indicators are too important for good internalreporting to be used in an incentive scheme. This could, e.g., apply to healthand safety deficiencies or HR deficiencies.
6.2 The specific incentive scheme
The study suggests calculating monetary reward from the budget performance and using aselection of the rest of the KPIs to define conditions for reward attribution. The principle isillustrated in Fig. 3. A positive deviation from budget (actual < budgeted costs) leads to apotential bonus for the ship manager, whereas a negative deviation (actual > budgetedcosts) will result in a penalty. Before attributing the bonus, a quality control is effectuated,in order to ensure that the focus on operational costs does not affect negatively the qualityof the other ship management operations. This is done by monitoring a set of quality-related KPIs and defining a minimum target level as a condition to attribute the bonus. Inthis case, each quality KPI is assigned aminimum target level, and the decision to grant thebonus is based on the percentage of quality KPIs meeting or exceeding their target values.In this scheme, the potential penalty (if the budget is not met) will be inflicted regardless ofwhether the KPI target values are met.
200 A. Rialland et al.

A simple way to calculate bonus or penalty is to add or subtract a share of the shipmanagement fee corresponding to the percentage of the budget deviation: An actualoperational cost 5 % higher than budget will then lead to 5 % of the agreed manage-ment fee being subtracted from the actual payment. To avoid abuses and to safeguardthe agent, a maximum share of the management fee at risk can be set to, e.g., 25 %.This ensures that the ship owner and ship manager have the same but limited monetarystake at risk.
As the size of the budget typically is 10 times the management fee, it may also makesense to have a higher multiplication factor between budget savings and increase in feeto provide a stronger incentive for ship managers through a more equal share of actualgains. This is to some degree backed up by Section 3, where studies show that ownersare in general less concerned by management costs than by quality. This may, however,make most sense when the budget savings are relatively small. In the example inTable 4, the budget savings are on the order of US$100,000 which also gives themanager a substantial bonus. Budget savings on the order of US$10,000 are stillsignificant for the owner, but less than 1 % of the management fee may not be thatimportant for the manager. One may require a stronger incentive to realize the gains insuch cases. However, more researches are required to give an answer to this question.
In the scheme discussed here, one may also want to include a lower risk for penaltiesthan for a bonus, e.g., by setting a lower multiplication factor for penalty than forbonus. An argument for this is that the risks inherent in this simple scheme may bemuch higher for the manager than the owner: The management fee is the full paymentto the manager, including all overheads and profits, while operational cost for the shipis only part of the total cash flow for the owner which typically also includes charterfees as well as capital costs and own operations. However, the ratio between the
Fig. 3 Incentive scheme based on one KPI for calculating bonus/penalty and a set of other KPIs for qualitycontrol
Performance-based ship management contracts 201

owner’s and manager’s cash flow will vary greatly over time and type of ship, so thisneed to be looked at case by case.
An empirical example shows that penalties may be a cause of time-consumingdiscussions, distracting the parties and diminishing the positive effects of PbC(Hollebrands 2011). This also indicates that one may consider removing the penaltyaltogether.
6.3 Target values for quality indicators
In the example used in the study, the first step was to adjust the budgetexpectation to a level where a certain percentage of ships reached the budgetarygoal. This level was set to 110 % (10 % budget overrun) to reach a level of67 % budgetary success. In general, a 10 % increase in operating budget isprobably excessive as this corresponds to an additional full management fee.However, during negotiation between owner and manager one could, e.g., agreeto increase the budget with 5 %. As most ships in the study already run overbudget, this may not really be an additional cost for the owner, and with theproposed incentive scheme, the manager would be very motivated to reducecosts further for common benefit to owner and manager.
Then the target values for quality indicators was first set by using “commonsense” and then tried against data in the Shipping KPI database to see howmany ships passed the quality KPI test. For these comparisons, reported datafrom 200 different ships were used. The levels as well as the percentage ofKPIs on or above the target were iterated upon to ensure that the managerwould reach the target in a majority of the recorded cases. The percentage ofKPIs to reach the target was finally set at 90 % (maximum of two out of 21KPIs below target) to enable a bonus payment. This gives the manager a bonuspayment in 64 % of the cases and a penalty in 33 % of cases as shown inTable 3.
Table 4 shows some examples of the resulting cost figures from the exercise. Fourships have been picked out to show how this would work in four different cases. Theamounts are in US$/year and are based on interviews with managers. They arerepresentative for a handymax (54,000 DWT) bulk carrier.
The four ships illustrate four distinct outcomes:
(1.) Ship one has a slight overrun on costs and a penalty is subtracted from fee,independent of quality indicators.
Table 3 Some results from demonstration case iterations
Budget performance (at 110 %) Better Better Worse Worse
Quality (see below rows) Better Worse Better Worse
Result for manager Bonus Even Penalty Penalty
Quality percentile 90 % KPI 19/21 64 % 3 % 28 % 5 %
Quality percentile 95 % KPI 20/21 58 % 9 % 22 % 11 %
Quality percentile 100 % KPI 21/21 40 % 27 % 12 % 21 %
202 A. Rialland et al.

(2.) Ship two is lower on costs than budget, but as less than 90 % of quality KPI targetvalues are met, no bonus is paid.
(3.) Ship three has a better budgetary performance and more than 90 % of quality KPItarget values achieved and a bonus is paid.
(4.) Ship four has a significant overrun on costs and a correspondingly higher penaltyis subtracted from fee, independent of quality indicators.
The valuation assumes that the ship owner reimburses the actual runningcosts to the ship manager regardless of whether these are above, equal to, orbelow budget. The limit of 25 % bonus or penalty does not apply in any of theexamples shown here.
7 Discussion
The paper presents solutions to the main challenges related to PbC. The problem ofallocative efficiency has been addressed by using both a direct financial indicator forcalculation of bonus and penalty as well as a set of quality controlling indicators todetermine when bonus is paid. As was discussed in Section 3, the operating budget is asignificant cost factor for the owner, and it is an excellent trade-off if the actualoperating costs are reduced, even though the management fee goes up somewhat.The quality indicators are already established by the management companies throughthe Shipping KPI standard. Determining threshold values and percentages throughanalysis of actual data in the Shipping KPI database ensures that both principal andagent have a good understanding of the implications of the agreed levels. The widerange of functional areas covered by the indicators should further help to reduce theallocative efficiency problem.
While allocative efficiency usually is discussed in the context of multiple tasks, itshould be pointed out that there is also a temporal/spatial perspective to this. If one shipgets a number of deficiencies early in the year so that quality attributes cannot besatisfied, the manager may elect to ignore this ship for the rest of the year and put moreattention on the ships that are still in the clear. This may, e.g., be catered for by creating
Table 4 Demonstration cases and outcomes (US$/year)
Ship 1 Ship 2 Ship 3 Ship 4
For the ship owner Running costs budget 1,365,830 1,365,830 1,365,830 1,365,830
Budget performance 1.02 0.98 0.93 1.16
Actual running costs 1,393,147 1,338,513 1,270,222 1,584,363
Additional costs/savings −27,317 27,317 95,608 −218,533For the ship manager Management fee 143,445 143,445 143,445 143,445
Calculated bonus/penalty −2,869 2,869 10,041 −22,951Percentage of quality KPIs 95 76 100 86
Amount payable to manager 140,576 143,445 153,486 120,494
Actual bonus/penalty −2,869 0 10,041 −22,951
Performance-based ship management contracts 203
contracts for the whole fleet and look at the aggregated results rather than the individ-ual. However, this issue has not been investigated.
As mentioned in Section 6.1, there are parts of the operating budget, e.g., repairs,which may incite the manager to delay activities to the degree that it results in off hirefor the owner. The budget performance indicator could take this into account byremoving such parts of the budget from the performance calculations.
Information asymmetry has been addressed by using the Shipping KPI standardwhich is generally recognized as a consistent set of performance measurement indica-tors. With reports from more than 2,000 ships today, the statistical significance shouldbe satisfactory, and by using the outlined procedure for establishing performancethresholds, the resulting levels and percentages should be fully transparent for bothagent and principal. The set of indicators are well defined and relatively easy to verifyby the ship owner or by third parties, if this should be needed.
The complexity of setting up a PbC is greatly simplified by providing a standard setof indicators as well as a readily available database for calculation of benchmarkvalues. The principles discussed in this paper are easy to apply and easy to verify byboth parties. Using the database to determine levels for payment of bonus or penaltiesduring contract negotiation is also a method that is completely transparent and easilyverifiable by the parties.
8 Conclusion
This paper has gone through one example of how a performance-based contract (PbC)between ship owners and ship managers can be designed on the basis of the ShippingKPI standard and database. The example represents a relatively simple exercise, but thesimplicity avoids unforeseen side effects; it helps to ensure transparency and informa-tion symmetry, and it reduces administrative overhead by minimizing hidden pitfallsboth for agent and principal.
The example is aimed at assessing the adequacy of the Shipping KPI standard as abasis for an incentive scheme applied to a case of multitask principal/agent relationship.The example has demonstrated how the PbC would work and what the results wouldbe, using historical data from the Shipping KPI database. Although details of the designmay be adjusted, the authors believe that the demonstrated principles address many ofthe concerns that have been voiced about PbC.
The authors believe that the Shipping KPI standard could be a good basis forestablishing performance-based contracts between ship managers and owners. Thisrequires that owners and managers that are willing to invest some effort into investi-gating the practical effects of such a contract over sufficiently long period. Some issuesthat need to be investigated further are the following:
& It would be useful to revisit the definitions of the Shipping KPI indicators and seehow they match up to the requirements of PbC. Some specific issues were reportedin Section 5.3.
& There is a need to assess the data reliability in the Shipping KPI repository.& One may want to look into contract forms covering more than one ship to avoid the
“temporal/spatial allocative efficiency” problem.
204 A. Rialland et al.

& It is necessary to look how to handle parts of the operating budget that mayrepresent high risks for the owner, e.g., unscheduled repairs.
& Likewise, more research may be needed in reaching a good balance between riskfor owner and manager. The most simplistic scheme may transfer too much risk tomanager.
& It would be interesting to extend PbC to the tri-dimensional agency, reflectingrelationships between ship owner, ship manager, and charterer.
Although more work is needed, it is hoped that this paper can contribute to a betterand more effective cooperation between owners and managers.
Acknowledgments The authors extend thanks to the reviewers which provided many suggestions that havevery much improved the paper from the first version. Thanks are also extended to a number of ship managercompanies that provided own business data for the study and to InterManager for the use of the Shipping KPIdatabase.
References
Al-Subhi Al-Harbi KM (1998) Sharing fractions in cost-plus-incentive-fee contracts. Int J Proj Manag 16(2):73–80
BIMCO (2009) Baltic and International Maritime Council, SHIPMAN 2009, Standard Ship managementcontract (Sample). Available from BIMCO (www.bimco.org)
Duru O et al (2013) Shipping performance assessment and the role of key performance indicators (KPIs):quality function deployment for transforming shipowner’s expectation. Available at SSRN 2195984
Fearnley N, Bekken JT, Norheim B (2004) Optimal performance-base subsidies in Norwegian intercity railtransport. Int J Transp Manag 2(2004):29–38
FelthamGA, Xie J (1994) Performance measure congruity and diversity in multi-task principal/agent relations.Account Rev 69(3):429–453
Fisher JG, Peffer SA, Sprinkle GB (2003) Budget-based contracts, budget levels, and group performance.J Manag Account Res 15:51–74
Gibbs M, Merchant KA, Van der Stede WA, Vargus ME (2004) Performance measure properties andincentives, IZA Discussion Paper No. 1356, October 2004
Hollebrands J (2011) Performance-based contracting: a new tool in ship management?, Dissertation,Middlesex University
Holmstrom B, Milgrom P (1991) Multitask principal-agent analyses: incentive contracts, asset ownership, andjob design. J Law Econ Org 7:24–52
Homburg C, Stebel P (2009) Determinants of contract terms for professional services. Manag Account Res 20:129–145
Hooper L (2008) Paying for performance: uncertainty, asymmetric information and the payment model. ResTransp Econ 22:157–163
Kerr S (1975) On the folly of rewarding a, while hoping for b. Acad Manag J 18(4):769–783McCall JJ (1970) The simple economics of incentive contracting. Am Econ Rev 60(5):837–846Michael F (1957) The measurement of productive efficiency. J R Stat Soc Ser A (Gen) 120(3):253–281Mitroussi K (2004) The ship owners’ stance on third party ship management: an empirical study. Marit Policy
Manag: Flagship J Int Shipp Port Res 31(1):31–45Nesheim DA (2013) MOPS WP1 Implementation of Shipping KPI reporting regime, MARINTEK
Unrestricted Report, PNO 28016610, 2013-07-13, Version 1.3Norbeck JA, Nesheim DA, Rialland A, Rødseth ØJ (2011) Flagship deliverable D-A1.5: Demonstration of
KPIs used in performance based contracts, 2011-05-31Olmos MF, Martinez JR (2010) The quality-quantity trade-off in the principal-agent framework. Agric Econ
Rev 11(1):57–68Panayides PM, Cullinane KPB (2002) The vertical disintegration of ship management: choice criteria for third
party selection and evaluation. Marit Policy Manag: Flagship J Int Shipp Port Res 29:1
Performance-based ship management contracts 205

Rajan MV, Reichelstein SJ (2009) Objective versus subjective indicators of managerial performance. AccountRev 84(1):209–237
Shaw A et al (2007) Digging deeper, Independent Consultant Report by Shaw Idea, Commissioned by NSWMine Safety Advisory Council, November 2007, ISBN: 978 0 7347 1883 9
Shipping KPI (2012) Official web site on https://www.shipping-kpi.org/Woods A (2012) Subjective adjustments to objective performance measures: the influence of prior perfor-
mance. Orig Res Artic Account Organ Soc 37(6):403–425Zhao RR (2008) All-or-nothing monitoring. Am Econ Rev 98(4):1619–1628
206 A. Rialland et al.