performance and efficiency analysis of an ht-pemfc system
TRANSCRIPT

energies
Article
Performance and Efficiency Analysis of anHT-PEMFC System with an Absorption Chiller forTri-Generation Applications
Geonhui Gwak, Minwoo Kim, Dohwan Kim, Muhammad Faizan, Kyeongmin Oh, Jaeseung Lee,Jaeyoo Choi, Nammin Lee, Kisung Lim and Hyunchul Ju *
WCSL (World Class Smart Lab) of the Green Battery Lab, Department of Mechanical Engineering,Inha University, 100 Inha-ro Michuhol-gu, Incheon 22212, Korea; [email protected] (G.G.);[email protected] (M.K.); [email protected] (D.K.); [email protected] (M.F.); [email protected] (K.O.);[email protected] (J.L.); [email protected] (J.C.); [email protected] (N.L.); [email protected] (K.L.)* Correspondence: [email protected]; Tel.: +82-010-4701-7472
Received: 28 December 2018; Accepted: 2 March 2019; Published: 8 March 2019
Abstract: An absorption chiller model for tri-generation (combined cooling, heating, and power)is developed and incorporated with the high temperature- (HT-) proton exchange membrane fuelcell (PEMFC) system model that was developed in our previous study. We employ a commerciallyavailable flow simulator, Aspen HYSYS, for solving the energy and mass balances of various systemcomponents, including an HT-PEMFC stack that is based on a phosphoric acid-doped PBI membrane,natural gas-fueled reformer, LiBr-H2O absorption chiller, balance of plant (BOP) components, andheat exchangers. Since the system’s operating strategy for tri-generation must be changed, dependingon cooling or heating loads, a major focus of this study is to analyze system performance andefficiency under different requirements of electricity generation, cooling, and heating conditions. Thesystem simulation results revealed that high-current fuel-cell operation is essential in raising thecooling capacity, but the overall system efficiency is slightly reduced as a result. Using a lower fuel-airratio for the burner in the reforming module is one alternative that can minimize the reduction in theoverall system efficiency under high-current fuel-cell operation and large cooling-capacity modes.
Keywords: tri-generation; phosphoric acid-doped PBI membrane; steam reforming; absorptionchiller; fuel cell system modeling
1. Introduction
Due to fossil-resource depletion and environmental pollution, lately the importance of renewableenergy has received much attention. Moreover, technologies that can efficiently use clean-energyresources are considered to be a solution for these environmental concerns. Among the variousclean-energy technologies that can potentially replace fossil fuels, fuel cells are considered to be one ofthe most environmentally friendly technologies. Fuel cells produce electricity by using hydrogen andoxygen, and water and waste heat are the only byproducts. Over the last several decades, considerableprogress has been made regarding of fuel cell performance and durability. Developing new materialsand optimizing its design and operation conditions have achieved the rapid growth of fuel celltechnologies. The numerical modeling and experimental diagnostics become valuable tools for thedesign and operation of fuel cells [1–4]. In particular, fuel cells that operate at high temperaturesare appropriate for combined heat, cooling, and power generation (CHCP), or tri-generation. Eventhough fuel-cell systems for tri-generation have relatively high initial capital costs, these systems offersignificant benefits in terms of system-energy efficiency [5,6].
Energies 2019, 12, 905; doi:10.3390/en12050905 www.mdpi.com/journal/energies

Energies 2019, 12, 905 2 of 21
In a typical fuel cell-based CHCP system, an absorption chiller is used to generate cooling powerfrom the heat of water that is released from a fuel-cell stack. Many efforts have been led to modeland analyze the diverse types of absorption chillers [7–13]. Gordon et al. [7] formulated a simplethermodynamic model for an LiBr-H2O absorption chiller and then analyzed the relation amongcoefficients of performance (COP). Xu et al. [8] has proposed a dynamic model, which is a single-effectabsorption chiller using gPROMS and analyzed the dynamic responses of the chiller under variousconditions, such as thermal mass, control strategy, and operating temperatures. Martínez et al. [9]modeled a Yazaki WFC-SC 5 absorption chiller with 17.6-kW of cooling capacity and calculated itthrough the use of the EES software. The simulation data were compared with the manufacturer’scatalogue data and experimental data. Ochoa et al. [10] derived mass- and heat-balance equationsfor a single-effect LiBr-H2O absorption chiller based on the first law of thermodynamics, which werediscretized by using the finite differences method and solved by the MATLAB program. These authorsinvestigated the dynamic responses of the chiller in the step changes of temperature, concentration, andpressure. Rubio-Maya et al. [11] presented an optimization model on the single-effect absorption chiller.Based on the exergy concept, these authors formulated an objective function for the annual operatingcost, while considering the temperatures of individual components and the efficiency of solution heatexchanger as design variables. The optimum operating conditions to minimize the annual operatingcost were reported for various working fluids. Yin et al. [12] simulated a double-effect absorptionchiller under different load conditions that can be required for micro building and district powerplants. Xu and Wang [13] experimentally tested a 50-kW LiBr-H2O absorption chiller over a widegeneration-temperature range.
Efforts have been expended to combine an absorption chiller with fuel-cell systems fortri-generation and analyzing the electrical power, cooling, and heating performances [14–22]. Amongthe various fuel cell types, solid oxide fuel cells (SOFCs) were the most studied for fuel cell-basedtri-generation applications [14–18]. Takezawa et al. [14] applied a combined SOFC and gas turbine (GT)system to single and double-effect absorption chillers. Their comparison results showed similar coolingcapacities between the two system designs, indicating that the use of a single-effect absorption chilleris beneficial in terms of economics. Malico et al. [15] applied a hospital load profile, which comprisesheating, cooling, electricity, and hot water, to a SOFC-based tri-generation system and analyzed itseconomic feasibility. Yu et al. [16] presented a tri-generation system model that was based on anSOFC stack and double-effect absorption chiller and investigated the effects of air inlet temperature,fuel-utilization ratio, and fuel-flow ratio. Burer et al. [17] created a residential tri-generation systemthat used an SOFC stack, GT, and absorption chiller, and then optimized its operation to minimizeCO2 emission. Tse et al. [18] analyzed different tri-generation configurations that are based on ahybrid SOFC and GT system for marine applications, wherein various absorption chillers wereconsidered and compared. Besides SOFCs, other types of fuel cells have been applied to tri-generationsystems [14–17]. Margalef et al. [19] considered a commercially available molten carbonate fuel-cellstack (300 kWe) and double-effect absorption chiller (40 refrigeration tons) and analyzed the effectsof system-integration strategies and chiller inlet temperatures on tri-generation performance. Theapplicability of low-temperature (LT) proton exchange membrane fuel cells (PEMFCs) for tri-generationapplications has been investigated [20,21]. Higher system efficiency was attained in the winteroperating mode rather than the summer mode, because of the better waste-heat utilization [21].Alexandros Arsalis [22] focused on a 100-kWe liquid-cooled HT-PEMFC stack that was based on aphosphoric acid (PA)-doped PBI membrane. By using 107 kW of waste heat from the HT-PEMFC stack,the author simply estimated the available cooling loads for an LiBr-H2O double-effect absorptionchiller (COP = 1.2) and a H2O-NH3 single-effect chiller (COP = 0.6), i.e., approximately 128 kW and64.5 kW, respectively.
This paper aims to analyze a tri-generation system under different operating modes as seasonschange. An HT-PEMFC stack that is based on a PA-doped PBI membrane is chosen and then combinedwith an LiBr-H2O absorption chiller. Although several efforts have been made for modeling and

Energies 2019, 12, 905 3 of 21
simulation of various fuel cell-based tri-generation systems [23–27], detailed system modeling, andanalysis of a combined fuel-cell stack, fuel reformer, and absorption chiller have not been reported inthe literature. In this study, a HT-PEMFC system model for tri-generation is presented and numericallyimplemented within a commercial flow-sheet simulator, Aspen HYSYS® (V7.2, AspenTech®, Bedford,MA, USA), i.e., used to deal with the energy and mass balances of various system components.Subsequently, the system model is applied to a 5 kWe tri-generation system and the effects of keyoperating parameters, such as stack operating current density and burner fuel-air ratio (FAR), areinvestigated and discussed. Particular emphasis is placed on analyzing the cooling capacity andtri-generation efficiencies in the summer and winter operating modes. This work addresses theflexibility and operating strategy of fuel cell-based tri-generation systems under different electric,cooling, and heating loads.
2. Analytical Model
2.1. Model Assumptions
Figure 1 shows the schematic of a typical High Temperature (HT)-PEMFC system for tri-generationconsisting of three aforementioned modules: an HT-PEMFC stack module, fuel-reforming module,and combined heating and cooling (CHC) module. The HT-PEMFC stack that is based on a PA-dopedPBI membrane is connected with a natural gas-fueled reformer, heat-storage tank, and LiBr-H2Oabsorption chiller. In addition, various balance of plant (BOP) components (blowers, compressors, andpumps) and heat exchangers are used in the operation of the tri-generation system. The HT-PEMFCsystem model is based on the previous work of Jo et al. [28], wherein the model was experimentallyvalidated against the test data measured under the 5 kWe HT-PEMFC system developed by DoosanCorporation Fuel Cell. Only the difference from our previous work is that an absorption chiller modelis newly developed and incorporated to simulate HT-PEMFC system operations for the summercooling mode. The main assumptions made during system modeling are as follows:
1. The natural gas constitutes 100% methane (CH4). All of the impurities in the natural gas areremoved before utilization during the fuel pretreatment process. Hence, the minor componentsin the fuel and their properties are ignored.
2. Peng–Robinson’s equation of state is followed by the individual gases and their mixtures tofacilitate the relatively simple and accurate analysis of the natural gas reacting system.
3. The operations of tri-generation system and its components are at the steady-state condition.4. The desulphurization component is included in the HT-PEMFC system to alleviate the sulfur
poisoning of metal catalysts, such as Ni and Rh, inside the steam reforming (SR) reactor. Hence,the catalyst deactivation effect can be neglected.
5. The effect of CO poisoning on the performance of HT-PEMFC stack is assumed to be negligible,which is reasonable for high operating temperatures (>160 C) and/or the CO content range of1~2% in the anode reformate gas [29,30].
6. The LiBr solution in the absorber and generator, and any refrigerant (water) in the condenserand evaporator are under thermodynamic equilibrium corresponding to their temperatures andpressures. The temperature, pressure, and concentration within the each component of LiBr-H2Oabsorption chiller are assumed to be uniform.
7. The water vapor that leaves the evaporator is assumed to be fully saturated, whereas the waterleaves the condenser as saturated liquid.

Energies 2019, 12, 905 4 of 21
Energies 2018, 11, x FOR PEER REVIEW 4 of 21
Figure 1. Configuration of a high temperature-proton exchange membrane fuel cells (HT-PEMFC)
system with tri-generation.
2.2. Fuel-Reforming Module
In the fuel-reforming module, we considered a SR reactor, water gas shift (WGS) reactors, and
auxiliary catalytic burner along with several Balance of Plant (BOP) components and heat exchangers.
As shown in Figures 1 and 2, the steam and process natural gas (PNG) are fed into the SR reactor,
while the anodic exhausts from the HT-PEMFC stack, air, and burner natural gas (BNG) are supplied
to the burner. Despite the number of reactions that are involved in the SR process [31], the following
three major chemical reactions are considered for simplicity:
Methane SR
𝐶𝐻4 + 𝐻2𝑂 ↔ 𝐶𝑂 + 3𝐻2 ∆ℎ1 = 206 𝑘𝐽/𝑚𝑜𝑙 (1)
WGS
𝐶𝑂 + 𝐻2𝑂 ↔ 𝐶𝑂2 + 𝐻2 ∆ℎ2 = −41 𝑘𝐽/𝑚𝑜𝑙 (2)
Direct SR
𝐶𝐻4 + 2𝐻2𝑂 ↔ 𝐶𝑂2 + 4𝐻2 ∆ℎ3 = 165 𝑘𝐽/𝑚𝑜𝑙 (3)
where, Δℎ𝑖 is the specific enthalpy change for the reaction, i (i = 1, 2, 3 denote the methane SR, WGS,
and Direct SR). The kinetic equations of Equations (1)–(3) are derived regarding the plug-flow kinetic
model, which was previously investigated by Xu and Froment [31]:
𝑟1 = 𝐴1𝑒𝑥𝑝 (−𝐸1
𝑅𝑇) (𝑝𝐶𝐻4
𝑝𝐻2𝑂 −𝑝𝐻2
3 𝑝𝐶𝑂
𝐾𝑝1
) (𝑝𝐻22.5 ∙ 𝐷𝐸𝑁2)⁄ (4)
𝑟2 = 𝐴2𝑒𝑥𝑝 (−𝐸2
𝑅𝑇) (𝑝𝐶𝑂𝑝𝐻2𝑂 −
𝑝𝐻2𝑝𝐶𝑂2
𝐾𝑝2
) (𝑝𝐻2∙ 𝐷𝐸𝑁2)⁄ (5)
𝑟3 = 𝐴3𝑒𝑥𝑝 (−𝐸3
𝑅𝑇) (𝑝𝐶𝐻4
𝑝𝐻2𝑂2 −
𝑝𝐻24 𝑝𝐶𝑂2
𝐾𝑝3
) (𝑝𝐻23.5 ∙ 𝐷𝐸𝑁2)⁄ (6)
Figure 1. Configuration of a high temperature-proton exchange membrane fuel cells (HT-PEMFC)system with tri-generation.
2.2. Fuel-Reforming Module
In the fuel-reforming module, we considered a SR reactor, water gas shift (WGS) reactors, andauxiliary catalytic burner along with several Balance of Plant (BOP) components and heat exchangers.As shown in Figures 1 and 2, the steam and process natural gas (PNG) are fed into the SR reactor, whilethe anodic exhausts from the HT-PEMFC stack, air, and burner natural gas (BNG) are supplied to theburner. Despite the number of reactions that are involved in the SR process [31], the following threemajor chemical reactions are considered for simplicity:Energies 2018, 11, x FOR PEER REVIEW 5 of 21
Figure 2. Fuel-reforming module flowsheet created by ASPEN HYSYS® V7.2.
In Equations (4)–(6), 𝐾𝑝𝑖 , 𝐴𝑖, 𝐸𝑖, and 𝑟𝑖 are the equilibrium constant, pre-exponential factor, the
activation energy, and the net kinetic reaction rate of the reaction i, respectively. In addition, 𝑝𝑗
means the partial pressure of species and j in the mentioned reactions. The term, DEN in the
denominators of Equations (4)–(6) represents the adsorption of reactants onto the active catalytic
sites. Because all three reactions occur at the same sites, DEN in Equations (4)–(6) are equivalent,
being expressed, as follows:
𝐷𝐸𝑁 = 1 + 𝐾𝐶𝑂𝑝𝐶𝑂 + 𝐾𝐻2𝑝𝐻2
+ 𝐾𝐶𝐻4𝑝𝐶𝐻4
+ 𝐾𝐻2𝑂𝑝𝐻2𝑂/𝑝𝐻2 (7)
For the given Ni/MgAl2O4 catalyst, the adsorption constant of individual species j, 𝐾𝑗 is described
using Van’t Hoff expression, as below:
𝐾𝑗 = 𝐴(𝐾𝑗)𝑒𝑥𝑝 (−∆ℎ𝑗
𝑅𝑇) (8)
where, Δℎ𝑗 and 𝐴(𝐾𝑗) are the adsorption-specific enthalpy and the pre-exponential factor of 𝐾𝑗 for
the species j, respectively.
Based on Equations (1)–(3), the mass balance equations for individual species in the SR reactor
are derived, as follows:
𝐶𝐻4
𝑆𝑅,𝑜𝑢𝑡 = 𝑃𝑁𝐺 − (𝑟1 + 𝑟3) ∙ 𝑀𝑊𝐶𝐻4
𝐶𝑂𝑆𝑅,𝑜𝑢𝑡 = (𝑟1 − 𝑟2) ∙ 𝑀𝑊𝐶𝑂
𝐶𝑂2
𝑆𝑅,𝑜𝑢𝑡 = (𝑟2 + 𝑟3) ∙ 𝑀𝑊𝐶𝑂2
𝐻2𝑂𝑆𝑅,𝑜𝑢𝑡 = 𝐻2𝑂
𝑆𝑅,𝑖𝑛 − (𝑟1 + 𝑟2 + 2𝑟3) ∙ 𝑀𝑊𝐻2𝑂
𝐻2
𝑆𝑅,𝑜𝑢𝑡 = (3𝑟1 + 𝑟2 + 4𝑟3) ∙ 𝑀𝑊𝐻2
(9)
where, 𝑃𝑁𝐺 is the PNG mass flow rate fed into the SR reactor.
In the WGS reactor comprising high temperature-shifts (HTS) and low temperature-shifts (LTS)
sub-reactors, only the exothermic WGS reaction, as in Equation (2), is assumed to occur. Thus, the
mass balance equations for the WGS reactor are described in Equation (10).
𝐶𝐻4
𝐿𝑇𝑆,𝑜𝑢𝑡 = 𝐶𝐻4
𝐿𝑇𝑆,𝑖𝑛 = 𝐶𝐻4
𝑆𝑅,𝑜𝑢𝑡
𝐶𝑂𝐿𝑇𝑆,𝑜𝑢𝑡 = 𝐶𝑂
𝐻𝑇𝑆,𝑖𝑛 − (𝑟2𝐻𝑇𝑆 + 𝑟2
𝐿𝑇𝑆) ∙ 𝑀𝑊𝐶𝑂
𝐶𝑂2
𝐿𝑇𝑆,𝑜𝑢𝑡 = 𝐶𝑂2
𝐻𝑇𝑆,𝑖𝑛 + (𝑟2𝐻𝑇𝑆 + 𝑟2
𝐿𝑇𝑆) ∙ 𝑀𝑊𝐶𝑂2
𝐻2𝑂𝐿𝑇𝑆,𝑜𝑢𝑡 = 𝐻2𝑂
𝐻𝑇𝑆,𝑖𝑛 + 𝐻2𝑂𝑆𝑅,𝑖𝑛 − (𝑟2
𝐻𝑇𝑆 + 𝑟2𝐿𝑇𝑆) ∙ 𝑀𝑊𝐻2𝑂
𝐻2
𝐿𝑇𝑆,𝑜𝑢𝑡 = 𝐻2
𝐻𝑇𝑆,𝑖𝑛 + (𝑟2𝐻𝑇𝑆 + 𝑟2
𝐿𝑇𝑆) ∙ 𝑀𝑊𝐻2
(10)
Figure 2. Fuel-reforming module flowsheet created by ASPEN HYSYS® V7.2.
Methane SRCH4 + H2O↔ CO + 3H2 ∆h1 = 206 kJ/mol (1)
WGSCO + H2O↔ CO2 + H2 ∆h2 = −41 kJ/mol (2)
Direct SRCH4 + 2H2O↔ CO2 + 4H2 ∆h3 = 165 kJ/mol (3)
where, ∆hi is the specific enthalpy change for the reaction, i (i = 1, 2, 3 denote the methane SR, WGS,and Direct SR). The kinetic equations of Equations (1)–(3) are derived regarding the plug-flow kineticmodel, which was previously investigated by Xu and Froment [31]:

Energies 2019, 12, 905 5 of 21
r1 = A1exp(−E1
RT
)(pCH4 pH2O −
p3H2
pCO
Kp1
)/(
p2.5H2·DEN2
)(4)
r2 = A2exp(−E2
RT
)(pCO pH2O −
pH2 pCO2
Kp2
)/(
pH2 ·DEN2)
(5)
r3 = A3exp(−E3
RT
)(pCH4 p2
H2O −p4
H2pCO2
Kp3
)/(
p3.5H2·DEN2
)(6)
In Equations (4)–(6), Kpi, Ai, Ei, and ri are the equilibrium constant, pre-exponential factor, theactivation energy, and the net kinetic reaction rate of the reaction i, respectively. In addition, pj meansthe partial pressure of species and j in the mentioned reactions. The term, DEN in the denominators ofEquations (4)–(6) represents the adsorption of reactants onto the active catalytic sites. Because all threereactions occur at the same sites, DEN in Equations (4)–(6) are equivalent, being expressed, as follows:
DEN = 1 + KCO pCO + KH2 pH2 + KCH4 pCH4 + KH2O pH2O/pH2 (7)
For the given Ni/MgAl2O4 catalyst, the adsorption constant of individual species j, Kj is describedusing Van’t Hoff expression, as below:
Kj = A(Kj)exp(−∆hj
RT
)(8)
where, ∆hj and A(Kj)
are the adsorption-specific enthalpy and the pre-exponential factor of Kj for thespecies j, respectively.
Based on Equations (1)–(3), the mass balance equations for individual species in the SR reactorare derived, as follows:
.mSR,out
CH4=
.mPNG − (r1 + r3)·MWCH4
.mSR,out
CO = (r1 − r2)·MWCO.
mSR,outCO2
= (r2 + r3)·MWCO2.
mSR,outH2O =
.mSR,in
H2O − (r1 + r2 + 2r3)·MWH2O.
mSR,outH2
= (3r1 + r2 + 4r3)·MWH2
(9)
where,.
mPNG is the PNG mass flow rate fed into the SR reactor.In the WGS reactor comprising high temperature-shifts (HTS) and low temperature-shifts (LTS)
sub-reactors, only the exothermic WGS reaction, as in Equation (2), is assumed to occur. Thus, themass balance equations for the WGS reactor are described in Equation (10).
.mLTS,out
CH4=
.mLTS,in
CH4=
.mSR,out
CH4.
mLTS,outCO =
.mHTS,in
CO −(rHTS
2 + rLTS2)·MWCO
.mLTS,out
CO2=
.mHTS,in
CO2+(rHTS
2 + rLTS2)·MWCO2
.mLTS,out
H2O =.
mHTS,inH2O +
.mSR,in
H2O −(rHTS
2 + rLTS2)·MWH2O
.mLTS,out
H2=
.mHTS,in
H2+(rHTS
2 + rLTS2)·MWH2
(10)
where, rHTS2 and rLTS
2 represent the net WGS reaction rates of Equation (2) for the HTS and LTSprocesses, respectively. Table 1 summarizes all the equilibrium constants and reaction kineticsparameters for the SR, HTS, and LTS reactors. Figure 2 shows the flowsheet of fuel reforming modulegenerated by the ASPEN HYSYS® V7.2.

Energies 2019, 12, 905 6 of 21
Table 1. Adsorption and equilibrium constants and kinetic parameters for Equations (1)–(3).
Arrhenius Expression
Reaction Catalyst TypeActivationEnergy, Ei,
kJ/molRef.
Pre-ExponentialFactor,
Ai
Ref.EquilibriumConstants,
Kpi
Ref.
1 Ni-Al2O3 217.01 [32] 2.084 × 10¹³
kmol·bar0.5·kgcat−1·h−1 [32]
1.198 × 10¹³exp(−26830/T)
bar2[33]
2
SR Ni-Al2O3 68.20 [32] 3.359 × 10⁷
kmol·bar−1·kgcat−1·h−1 [32]
1.767 × 10⁻²
exp(4400/T)[33]
HTS SHT-4 70 [34]1.78 × 1022 × (1 +
0.0097·SCR −1.1364·SCR2)T−8
[34]
LTS MDC-7 35 [34]1.74 × 1017 × (1 −
0.1540·SCR −0.0008·SCR2)T−8.5
[34]
3 Ni-Al2O3 215.84 [32] 4.644 × 10¹³kmol·bar0.5·kgcat
−1·h−1 [32]2.117 × 10¹¹
exp(−22430/T)bar2
[33]
Van’t Hoff Expression
ParameterAdsorption Specific Enthalpy,
∆hj, kJ/mol Ref.Pre-Exponential
Factor,A(Kj)
Ref.
CH4 −38.28 [31] 6.65 × 10⁻⁴·bar−1 [31]
CO −70.65 [31] 8.23 × 10⁻⁵·bar−1 [31]
H2 −82.90 [31] 6.12 × 10⁻⁹·bar−1 [31]
H2O 88.68 [31] 1.77 × 10⁵·bar0 [31]
2.3. HT-PEMFC Stack Module
The HT-PEMFC stack model is simplified from the three-dimensional (3-D) high temperature(HT)-PEMFC models [29,35–38]. The cell voltage can be determined after the activation loss ηact, ohmicloss ηohm, and concentration loss ηcon are estimated and then subtracted from the thermodynamicequilibrium potential, Enernst, as follows,
Vcell = Enernst − ηact − ηohm − ηcon (11)
The expression of Enernst is given by Chippar and Ju [31], as follows:
Enernst = 1.1669− 0.24× 10⁻³(Tcell − 373.15) (12)
In Equation (11), the activation overvoltage, ηact, represents the total activation loss, i.e., the sumof the activation loss in the anode side due to the hydrogen oxidation reaction (HOR) and the activationloss in the cathode side due to the oxygen reduction reaction (ORR). The anode and cathode activationlosses can be estimated from the Butler–Volmer (B-V) equations for the HOR and ORR, as follows [35]:
HOR in the anode
ηact,a =i
ire f0,a
RuT(αa + αc)F
(CH2,re f
CH2
)1/2
(13a)
ORR in the cathode ∣∣ηact,c∣∣ = RuT
αcFln
(CO2,re f
CO2
)3/4 i
ire f0,c
(13b)
ηact = ηact,a +∣∣ηact,c
∣∣ (14)

Energies 2019, 12, 905 7 of 21
In Equation (13), Cj is the molar concentration. α is the transfer coefficient. The exchange current
densities for the HOR and ORR, denoted by ire f0,a and ire f
0,c , respectively, are dependent of temperature,as follows [35]:
ire f0,a (T) = ire f
0,a (353.15K)·exp[−1400·
(1T− 1
353.15
)](15)
ire f0,c (T) = ire f
0,c (353.15K)·exp[−7900·
(1T− 1
353.15
)](16)
The ohmic loss, ηohm is a combined result of proton and electron transport through variouscomponents of HT-PEMFC stack.
ηohm = i(RH+ + Relec) (17)
In Equation (17), RH+ and Relec represent the area specific resistances due to proton and electrontransport, respectively. RH+ can be determined by the given membrane and catalyst layer (CL)properties and dimensions, as follows.
RH+ =δmem
κ+
0.5·δaCL
ν1.5aCLκ
+0.5·δcCL
ν1.5cCLκ
(18)
where νaCL and νcCL are the ionomer volume fraction in the anode and cathode CLs, respectively. Itshould be noted that, for proton transport through the anode and cathode CLs, half the thickness ofCL (i.e., 0.5·δaCL and 0.5·δaCL) is considered as the average proton transport path.
The expression of concentration polarization, ηcon is given by:
ηcon =RT4F
ln(
ilimilim − i
)(19)
In Equation (19), ilim is the limiting current density, i.e., a function of the oxygen concentration atthe interface of the cathode gas diffusion layer (GDL) and gas channel, CO2,int, as well as the porosity(vGDL), tortuosity, and thickness (δGDL) of the cathode GDL. The expression is given by:
ilim = ν1.5GDLDO2
CO2,int
δGDL(20)
Based on a typical HT-PEMFC stack configuration where the single cells are connected in series, thestack voltage Vstack and stack power Pstack can be estimated if the number of cells in the stack, ncell andthe area of membrane electrode assembly (MEA), AMEA, are given.
Vstack = ncellVcell (21)
Pstack = ncellVcell ·i·AMEA (22)
When considering the stack power that was obtained by Equation (22) and the sum of powerconsumption of an individual BOP component i (denoted by bhpi), the electric efficiency εe for theHT-PEMFC system can be evaluated, as follows,
εe =Pstack −∑ bhpi.
m f uel × LHVf uel× 100% (23)
where LHVf uel is the lower heating value of fuel..
m f uel is the total fuel mass flow rate supplied tothe fuel reforming module. As shown in Figure 2,
.m f uel is the sum of PNG mass flow rate for the SR
reactor and BNG mass flow rate for the burner.
.m f uel =
.mBNG +
.mPNG (24)

Energies 2019, 12, 905 8 of 21
The waste heat generated during the HT-PEMFC stack operation is described by Equation (25):
.Qstack =
(U0 − T
dU0
dT−Vcell
)× i× AMEA × ncell (25)
Inside the HT-PEMFC stack,.
Qstack in Equation (25) is mainly removed by a coolant flowing throughthe cooling channels [35]. Triethylene glycol is usually employed as a coolant for HT-PEMFC stacks,owing to its high boiling point around 285 C. The coolant temperature gradient from the inlet tooutlet, ∆Tcool can be estimated through a simple heat balance of the total waste heat generation ratefrom the stack and heat removal rate by the coolant.
∆Tcool =
.Qstack
.mcoolcp,cool
=
(U0 − T dU0
dT −Vcell
)× i× AMEA × ncell
.mcoolcp,cool
(26)
In Equation (26),.
mcool represents the flow rate of coolant that is supplied to the HT-PEMFC stack.The present stack model described in Figure 3a is implemented while using the flow simulator ASPENHYSYS® V7.2 and relevant flowsheet, as seen in Figure 3b.
Energies 2018, 11, x FOR PEER REVIEW 8 of 21
𝑓𝑢𝑒𝑙 = 𝐵𝑁𝐺 + 𝑃𝑁𝐺 (24)
The waste heat generated during the HT-PEMFC stack operation is described by Equation (25):
𝑠𝑡𝑎𝑐𝑘 = (𝑈0 − 𝑇𝑑𝑈0
𝑑𝑇− 𝑉𝑐𝑒𝑙𝑙) × 𝑖 × 𝐴𝑀𝐸𝐴 × 𝑛𝑐𝑒𝑙𝑙 (25)
Inside the HT-PEMFC stack, 𝑠𝑡𝑎𝑐𝑘 in Equation (25) is mainly removed by a coolant flowing through
the cooling channels [35]. Triethylene glycol is usually employed as a coolant for HT-PEMFC stacks,
owing to its high boiling point around 285 °C. The coolant temperature gradient from the inlet to
outlet, ∆𝑇𝑐𝑜𝑜𝑙 can be estimated through a simple heat balance of the total waste heat generation rate
from the stack and heat removal rate by the coolant.
∆𝑇𝑐𝑜𝑜𝑙 =𝑠𝑡𝑎𝑐𝑘
𝑐𝑜𝑜𝑙𝑐𝑝,𝑐𝑜𝑜𝑙=
(𝑈0 − 𝑇𝑑𝑈0𝑑𝑇
− 𝑉𝑐𝑒𝑙𝑙) × 𝑖 × 𝐴𝑀𝐸𝐴 × 𝑛𝑐𝑒𝑙𝑙
𝑐𝑜𝑜𝑙𝑐𝑝,𝑐𝑜𝑜𝑙 (26)
In Equation (26), 𝑐𝑜𝑜𝑙 represents the flow rate of coolant that is supplied to the HT-PEMFC
stack. The present stack model described in Figure 3a is implemented while using the flow simulator
ASPEN HYSYS® V7.2 and relevant flowsheet, as seen in Figure 3b.
(a)
(b)
Figure 3. (a) Configuration of a gas/coolant channels and membrane electrode assembly (MEA) in a
HT-PEMFC stack and (b) related flowsheet created by Aspen HYSYS® .
Figure 3. (a) Configuration of a gas/coolant channels and membrane electrode assembly (MEA) in aHT-PEMFC stack and (b) related flowsheet created by Aspen HYSYS®.

Energies 2019, 12, 905 9 of 21
2.4. Single-Effect Absorption Chiller
To simulate the HT-PEMFC based tri-generation system, an absorption chiller model is newlydeveloped and incorporated into the aforementioned HT-PEMFC system model. As schematicallyshown in Figure 4, this absorption chiller system operates with the LiBr-H2O solution, in which LiBrand H2O are employed as the absorbent and refrigerant, respectively. Its main components are thegenerator, absorber, condenser, evaporator, solution heat exchanger, expansion valve, and solutionpumps. The water vapor that originates from the evaporator is absorbed in an aqueous LiBr-H2Osolution in the absorber, wherein the cooling water removes the exothermic heat that is releasedduring absorption. The diluted LiBr solution in the absorber is then pressurized by the pump (P1) andpre-heated through heat exchange with the concentrated solution before being sent to the generator.In the generator, the waste heat from the HT-PEMFC is supplied to obtain steam from the dilutedsolution. After the steam is further superheated, it enters the condenser and is liquefied, releasinglatent heat. Finally, the water is depressurized through the expansion valve and vaporized in theevaporator, producing useful cooling. The vaporized water is recombined with a strongly concentratedLiBr solution from the absorber for completing the absorption refrigeration cycle. While assuming asteady-state operation, the following mass and energy balance equations are applied to individualcomponents in the absorption chiller system and implemented into Aspen HYSYS® V 7.2.
∑in
.mj = ∑
out
.mj (27)
∑in
.mjhj = ∑
out
.mjhj (28)
where j represents either water or LiBr solution. To solve the energy-balance equations for the absorberand generator, the following expression for the specific enthalpy of the LiBr solution, i.e., as a functionof temperature, T, and LiBr concentration, X, is used in the model [6]:
hLiBr(T, X) = (a0 + a1X)T + 0.5(b0 + b1X)T2 +(
c0 + c1X + c2X2 + c3X3)
(29)
Energies 2018, 11, x FOR PEER REVIEW 10 of 21
(b)
(a)
Figure 4. Cont.

Energies 2019, 12, 905 10 of 21
Energies 2018, 11, x FOR PEER REVIEW 10 of 21
(b)
(a)
Figure 4. (a) Configuration of the absorption chiller using LiBr –H2O solution and (b) related flowsheetcreated by ASPEN HYSYS®.
In Equation (29), the values of the individual coefficients are listed in Table 2. The COP andcooling efficiency (defined based on the rate of the total fuel supply) can be readily determined by thefollowing expressions:
COP =
.mH2O·(1− x)·hvap( .
m59.96%LiBr·h59.96%LiBr +.
mH2O(v)·hH2O(v)
)− .
m53.07%LiBr·h53.07%LiBr
× 100% (30)
εcooling =
.mH2O·(1− x)·hvap
.m f uel ·LHVf uel
× 100% (31)
where.
mH2O represents the mass flow rate of water through the condenser and the evaporator. x andhvap are the mass fraction of water vapor at the end of the expansion valve and the specific latent heatof vaporization of water, respectively.
Table 2. Specific-enthalpy coefficients of the LiBr solution.
Specific Enthalpy of the LiBr Solution
a0 3.462023 c0 162.81
a1 −2.679895 × 10⁻² c1 −6.0418
b0 1.3499 × 10⁻³ c2 4.5348 × 10⁻³
b1 −6.55 × 10⁻⁶ c3 1.2053 × 10⁻³
2.5. Heat-Recovery Module
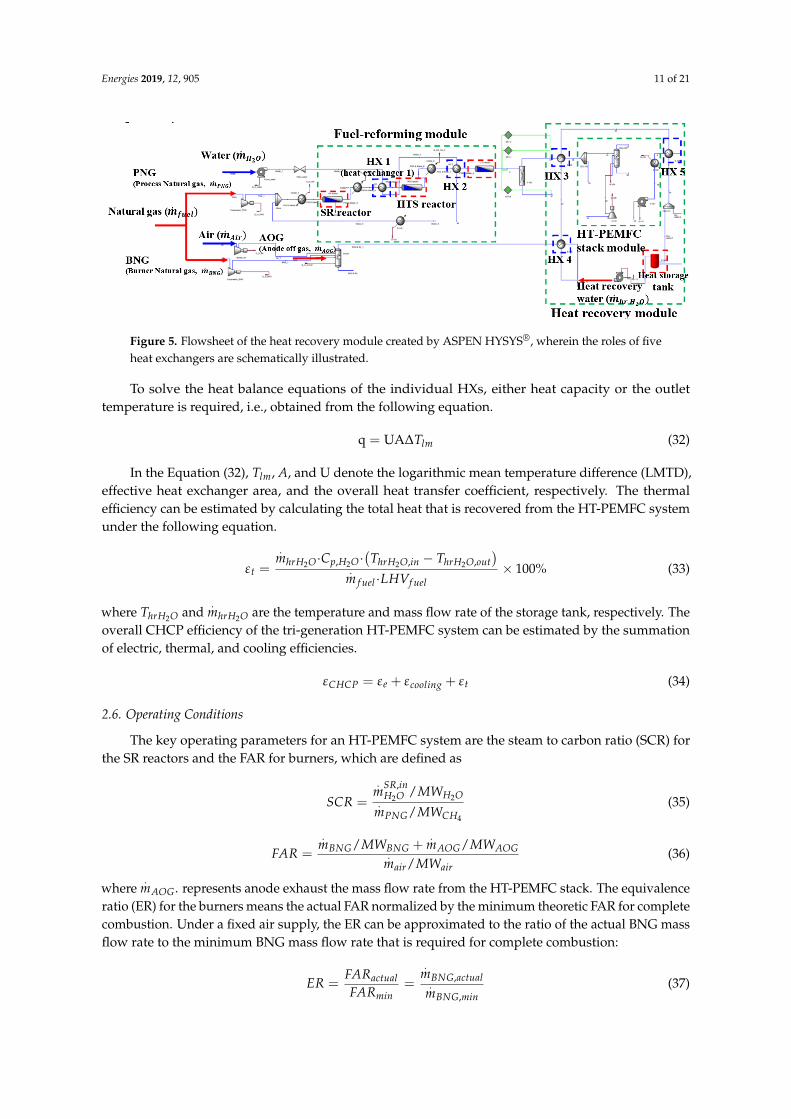
Heat-recovery modules are used to collect excess heat from various system components and tostore it in the storage tank. Figure 5 displays the flowsheet of the heat recovery module, in which fiveheat exchangers (HXs) are employed to recover the available heat. HXs 1 and 2 are placed near theends of the SR and HTS reactors, respectively, in order to maintain optimal operating temperaturesof HTS and LTS processes, as well as to preheat the stream that is supplied to the SR reactor. HXs3, 4, and 5 are mainly to cool the burner exhaust gas, LTS downstream, and coolant flow from theHT-PEMFC stack, respectively.
Energies 2019, 12, 905 11 of 21
Energies 2018, 11, x FOR PEER REVIEW 11 of 21
Figure 5. Flowsheet of the heat recovery module created by ASPEN HYSYS® , wherein the roles of five
heat exchangers are schematically illustrated.
To solve the heat balance equations of the individual HXs, either heat capacity or the outlet
temperature is required, i.e. obtained from the following equation.
q = UA∆𝑇𝑙𝑚 (32)
In the Equation (32), 𝑇𝑙𝑚, A, and U denote the logarithmic mean temperature difference (LMTD),
effective heat exchanger area, and the overall heat transfer coefficient, respectively. The thermal
efficiency can be estimated by calculating the total heat that is recovered from the HT-PEMFC system
under the following equation.
휀𝑡 =ℎ𝑟 𝐻2𝑂 ∙ 𝐶𝑝,𝐻2𝑂 ∙ (𝑇ℎ𝑟 𝐻2𝑂,𝑖𝑛 − 𝑇ℎ𝑟 𝐻2𝑂,𝑜𝑢𝑡)
𝑓𝑢𝑒𝑙 ∙ 𝐿𝐻𝑉𝑓𝑢𝑒𝑙× 100% (33)
where 𝑇ℎ𝑟 𝐻2𝑂 and ℎ𝑟 𝐻2𝑂 are the temperature and mass flow rate of the storage tank, respectively.
The overall CHCP efficiency of the tri-generation HT-PEMFC system can be estimated by the
summation of electric, thermal, and cooling efficiencies.
휀𝐶𝐻𝐶𝑃 = 휀𝑒 + 휀𝑐𝑜𝑜𝑙𝑖𝑛𝑔 + 휀𝑡 (34)
2.6. Operating Conditions
The key operating parameters for an HT-PEMFC system are the steam to carbon ratio (SCR) for
the SR reactors and the FAR for burners, which are defined as
𝑆𝐶𝑅 =
𝐻2𝑂𝑆𝑅,𝑖𝑛
𝑀𝑊𝐻2𝑂⁄
𝑃𝑁𝐺𝑀𝑊𝐶𝐻4
⁄ (35)
𝐹𝐴𝑅 =𝐵𝑁𝐺 𝑀𝑊𝐵𝑁𝐺 + 𝐴𝑂𝐺 𝑀𝑊𝐴𝑂𝐺⁄⁄
𝑎𝑖𝑟 𝑀𝑊𝑎𝑖𝑟⁄ (36)
where 𝐴𝑂𝐺 represents anode exhaust the mass flow rate from the HT-PEMFC stack. The
equivalence ratio (ER) for the burners means the actual FAR normalized by the minimum theoretic
FAR for complete combustion. Under a fixed air supply, the ER can be approximated to the ratio of
the actual BNG mass flow rate to the minimum BNG mass flow rate that is required for complete
combustion:
𝐸𝑅 =𝐹𝐴𝑅𝑎𝑐𝑡𝑢𝑎𝑙
𝐹𝐴𝑅𝑚𝑖𝑛=
𝐵𝑁𝐺,𝑎𝑐𝑡𝑢𝑎𝑙
𝐵𝑁𝐺,𝑚𝑖𝑛 (37)
According to our previous study [23], the SCR has a negligible influence on the hydrogen yield and
system efficiencies when this factor varies from 3.0 to 3.6. Only the CO content in the reformate gas
Figure 5. Flowsheet of the heat recovery module created by ASPEN HYSYS®, wherein the roles of fiveheat exchangers are schematically illustrated.
To solve the heat balance equations of the individual HXs, either heat capacity or the outlettemperature is required, i.e., obtained from the following equation.
q = UA∆Tlm (32)
In the Equation (32), Tlm, A, and U denote the logarithmic mean temperature difference (LMTD),effective heat exchanger area, and the overall heat transfer coefficient, respectively. The thermalefficiency can be estimated by calculating the total heat that is recovered from the HT-PEMFC systemunder the following equation.
εt =
.mhrH2O·Cp,H2O·
(ThrH2O,in − ThrH2O,out
).
m f uel ·LHVf uel× 100% (33)
where ThrH2O and.
mhrH2O are the temperature and mass flow rate of the storage tank, respectively. Theoverall CHCP efficiency of the tri-generation HT-PEMFC system can be estimated by the summationof electric, thermal, and cooling efficiencies.
εCHCP = εe + εcooling + εt (34)
2.6. Operating Conditions
The key operating parameters for an HT-PEMFC system are the steam to carbon ratio (SCR) forthe SR reactors and the FAR for burners, which are defined as
SCR =
.mSR,in
H2O /MWH2O.
mPNG/MWCH4
(35)
FAR =
.mBNG/MWBNG +
.mAOG/MWAOG
.mair/MWair
(36)
where.
mAOG. represents anode exhaust the mass flow rate from the HT-PEMFC stack. The equivalenceratio (ER) for the burners means the actual FAR normalized by the minimum theoretic FAR for completecombustion. Under a fixed air supply, the ER can be approximated to the ratio of the actual BNG massflow rate to the minimum BNG mass flow rate that is required for complete combustion:
ER =FARactualFARmin
=
.mBNG,actual
.mBNG,min
(37)

Energies 2019, 12, 905 12 of 21
According to our previous study [23], the SCR has a negligible influence on the hydrogen yield andsystem efficiencies when this factor varies from 3.0 to 3.6. Only the CO content in the reformate gasis slightly reduced with increasing SCR, so the SCR value is fixed at 3.0 in this study. Contrarily, theburner FAR directly controls the amount of heat that is supplied for the endothermic reactions in the SRreactor and thus highly influences the system efficiencies as well as the total hydrogen yield. Therefore,we numerically assess the effect of the burner FAR on the electrical, cooling, and heating efficiencies ofHT-PEMFC systems. In addition, the summer cooling and winter heating modes demand differentcooling, heating, and power loads for the HT-PEMFC systems. One approach to meet these variousload requirements is to adjust the operating current density of the HT-PEMFC stack. In this study, low(0.2 A/cm2), intermediate (0.4 A/cm2), and high (0.65 A/cm2) current-density HT-PEMFC operationsare simulated and then compared in terms of electric-power generation and cooling capacity.
3. Results and Discussion
Figure 6 display the cell voltage, stack power, and waste heat under different operating currentdensities, wherein the calculated polarization curve agrees well with the experimental curve that wasmeasured by Qingfeng [39]. In addition, the stack power and waste heat were estimated based on thestack configuration in Table 3 (AMEA = 300 cm2, Ncell = 160). While the cell voltage decreased with thecurrent density, the stack power and waste heat dramatically increased with current density. Therefore,when greater cooling and electrical loads are required during summer, operating a HT-PEMFC stackat lower voltage (higher current) is needed to obtain higher stack power for more electricity useand supplying more heat to the absorption chiller. Figure 7 schematically shows the HT-PEMFCsystem simulation results for the lower current-density operation of the HT-PEMFC stack at 0.2 A/cm2.With a PNG flow rate of 0.8587 kg/h, 0.4283 kg/h of hydrogen was produced through the SR, HTS,and LTS processes and then fed into the HT-PEMFC stack, wherein 5.978 kW of electric power wasgenerated with around 6.097 kW of waste heat. The heat was transferred to the LiBr-H2O solution inthe absorption chiller and 4.011 kg/h of water was vaporized from the strong solution and used asrefrigerant. The cooling capacity of 2.568 kW was finally delivered through 135.11 kg/h of chiller waterloop (TChiller H2O, in = 25.35 C, TChiller H2O, out = 9.045 C). The electric-power generation from theHT-PEMFC stack, which ranged from 5 to 6 kW, was sufficient in coping with the power consumptionof five households, but the cooling capacity, which was around 2.566 kW, was less than that of onehousehold in the summer, which implies that the HT-PEMFC stack’s operating mode must be switchedto a higher power and lower efficiency mode during summer.
Energies 2018, 11, x FOR PEER REVIEW 12 of 21
is slightly reduced with increasing SCR, so the SCR value is fixed at 3.0 in this study. Contrarily, the
burner FAR directly controls the amount of heat that is supplied for the endothermic reactions in the
SR reactor and thus highly influences the system efficiencies as well as the total hydrogen yield.
Therefore, we numerically assess the effect of the burner FAR on the electrical, cooling, and heating
efficiencies of HT-PEMFC systems. In addition, the summer cooling and winter heating modes
demand different cooling, heating, and power loads for the HT-PEMFC systems. One approach to
meet these various load requirements is to adjust the operating current density of the HT-PEMFC
stack. In this study, low (0.2 A/cm2), intermediate (0.4 A/cm2), and high (0.65 A/cm2) current-density
HT-PEMFC operations are simulated and then compared in terms of electric-power generation and
cooling capacity.
3. Results and Discussion
Figure 6 display the cell voltage, stack power, and waste heat under different operating current
densities, wherein the calculated polarization curve agrees well with the experimental curve that was
measured by Qingfeng [39]. In addition, the stack power and waste heat were estimated based on the
stack configuration in Table 3 (𝐴𝑀𝐸𝐴 = 300 cm2, 𝑁𝑐𝑒𝑙𝑙 = 160). While the cell voltage decreased with the
current density, the stack power and waste heat dramatically increased with current density.
Therefore, when greater cooling and electrical loads are required during summer, operating a HT-
PEMFC stack at lower voltage (higher current) is needed to obtain higher stack power for more
electricity use and supplying more heat to the absorption chiller. Figure 7 schematically shows the
HT-PEMFC system simulation results for the lower current-density operation of the HT-PEMFC
stack at 0.2 A/cm2. With a PNG flow rate of 0.8587 kg/h, 0.4283 kg/h of hydrogen was produced
through the SR, HTS, and LTS processes and then fed into the HT-PEMFC stack, wherein 5.978 kW
of electric power was generated with around 6.097 kW of waste heat. The heat was transferred to the
LiBr-H2O solution in the absorption chiller and 4.011 kg/h of water was vaporized from the strong
solution and used as refrigerant. The cooling capacity of 2.568 kW was finally delivered through
135.11 kg/h of chiller water loop (TChiller H2O, in= 25.35 °C, TChiller H2O, out= 9.045 °C). The electric-power
generation from the HT-PEMFC stack, which ranged from 5 to 6 kW, was sufficient in coping with
the power consumption of five households, but the cooling capacity, which was around 2.566 kW,
was less than that of one household in the summer, which implies that the HT-PEMFC stack’s
operating mode must be switched to a higher power and lower efficiency mode during summer.
Figure 6. Simulation and experiment comparison of polarization curves for a HT-PEMFC, stack power
curve, and waste heat curve as a function of current density. Figure 6. Simulation and experiment comparison of polarization curves for a HT-PEMFC, stack powercurve, and waste heat curve as a function of current density.

Energies 2019, 12, 905 13 of 21
Table 3. Geometric/operating conditions and input parameters for simulations of the HT-PEMFC stack.
Description Value Ref.
MEA area, AMEA 300 cm2 -
Operating temperature, Tcell 165 C -
Anode/cathode stoichiometry, ξ 1.2/2.0 -
Number of cells in a stack, ncell 160 -
Thickness of anode/cathode CLs, GDLs, δCL, δGDL 0.015, 0.35 mm -
Thickness of anode/cathode membrane, δMEM 0.07 mm -
Anode/Cathode inlet pressure 1.0 atm -
Reference hydrogen/oxygen molar concentration, CH2,re f /CO2,re f 40.88 mol/m3 [40]
Electronic conductivity in BP, GDL, CL 14000, 1250, 300 S/m [40]
Phosphoric acid doping level 18.7 [40]
Anode/cathode transfer coefficient 0.5, 0.65 [40]
Reference exchange current density in anode/cathode, ire f0,a , ire f
0,c 1.0 × 10⁹, 1.0 × 10⁴ A/m2 [35]
Volume fraction of ionomers in CLs 0.3 [40]
Porosity of GDL, CL 0.6, 0.4 [40]
Proton conductivity of the membrane, κ 36.22 S/m [39]
Energies 2018, 11, x FOR PEER REVIEW 13 of 21
Table 3. Geometric/operating conditions and input parameters for simulations of the HT-PEMFC
stack.
Description Value Ref.
MEA area, 𝐴𝑀𝐸𝐴 300 cm2 -
Operating temperature, 𝑇𝑐𝑒𝑙𝑙 165 °C -
Anode/cathode stoichiometry, 𝜉 1.2/2.0 -
Number of cells in a stack, 𝑛𝑐𝑒𝑙𝑙 160 -
Thickness of anode/cathode CLs, GDLs, 𝛿𝐶𝐿, 𝛿𝐺𝐷𝐿 0.015, 0.35 mm -
Thickness of anode/cathode membrane, 𝛿𝑀𝐸𝑀 0.07 mm -
Anode/Cathode inlet pressure 1.0 atm -
Reference hydrogen/oxygen molar concentration, 𝐶𝐻2,𝑟𝑒𝑓 𝐶𝑂2,𝑟𝑒𝑓⁄
40.88 mol/m3 [40]
Electronic conductivity in BP, GDL, CL 14000, 1250, 300 S/m [40]
Phosphoric acid doping level 18.7 [40]
Anode/cathode transfer coefficient 0.5, 0.65 [40]
Reference exchange current density in
anode/cathode, 𝑖0,𝑎𝑟𝑒𝑓, 𝑖0,𝑐
𝑟𝑒𝑓 1.0 × 10⁹, 1.0 × 10⁴ A/m2 [35]
Volume fraction of ionomers in CLs 0.3 [40]
Porosity of GDL, CL 0.6, 0.4 [40]
Proton conductivity of the membrane, 36.22 S/m [39]
Figure 7. Configuration of mass and heat-flow diagram for trigeneration system at 0.2 A/cm2.
Therefore, higher current-density operations of an HT-PEMFC stack at 0.4 and 0.65 A/cm2 were
simulated. As the stack’s operating current density increase, the BNG and PNG flow rates should
accordingly increase to obtain greater hydrogen yield at the higher current density. Figure 8a shows
the required BNG and PNG flow rates and the amount of heat that is transferred from the burner to
SR reactor, wherein the BNG and PNG flow rates were controlled to provide a sufficient amount of
heat to the SR reactor and generate hydrogen flow that corresponds to the same anode stoichiometry
of 1.2 according to current density. Thus, the BNG and PNG flow rates and the amount of heat that
was provided to the SR reactor almost linearly increased with the current density. In Figure 8b, the
stack’s electric power, waste heat, and cooling capacity are plotted with respect to the operating
Figure 7. Configuration of mass and heat-flow diagram for trigeneration system at 0.2 A/cm2.
Therefore, higher current-density operations of an HT-PEMFC stack at 0.4 and 0.65 A/cm2 weresimulated. As the stack’s operating current density increase, the BNG and PNG flow rates shouldaccordingly increase to obtain greater hydrogen yield at the higher current density. Figure 8a showsthe required BNG and PNG flow rates and the amount of heat that is transferred from the burner toSR reactor, wherein the BNG and PNG flow rates were controlled to provide a sufficient amount ofheat to the SR reactor and generate hydrogen flow that corresponds to the same anode stoichiometryof 1.2 according to current density. Thus, the BNG and PNG flow rates and the amount of heat thatwas provided to the SR reactor almost linearly increased with the current density. In Figure 8b, thestack’s electric power, waste heat, and cooling capacity are plotted with respect to the operating currentdensity. As the operating current density increased, the waste heat and resultant cooling capacityof the absorption chiller relatively steeply increased with the current density when compared to thestack’s electric power. The cooling capacity increased from 2.566 kW at 0.2 A/cm2 to 17.292 kW

Energies 2019, 12, 905 14 of 21
at 0.65 A/cm2, while the electric-power generation increased relatively slowly from 5.978 kW at0.2 A/cm2 to 13.812 kW at 0.65 A/cm2.
Energies 2018, 11, x FOR PEER REVIEW 14 of 21
current density. As the operating current density increased, the waste heat and resultant cooling
capacity of the absorption chiller relatively steeply increased with the current density when
compared to the stack’s electric power. The cooling capacity increased from 2.566 kW at 0.2 A/cm2 to
17.292 kW at 0.65 A/cm2, while the electric-power generation increased relatively slowly from 5.978
kW at 0.2 A/cm2 to 13.812 kW at 0.65 A/cm2.
(a)
(b)
Figure 8. (a) Required burner natural gas (BNG) and process natural gas (PNG) flow rates and amount
of heat supplied to the SR reactor with the variation of operating current density, (b) electric power,
waste heat, and cooling capacity of HT-PEMFC stack as a function of operating current density. As
the operating current density varied, the BNG and PNG flow rates were adjusted to maintain the
same anode stoichiometry of 1.2.
Figure 9 shows the electrical, cooling, thermal, and overall efficiencies (expressed in Equations
(23), (31), (33), and (34), respectively) at three different current densities. Absorption chillers typically
perform more efficiently at higher temperature and larger heat input, so the cooling efficiency
increases relatively sharply with increasing current density, which offsets the decreases in the
electrical and thermal efficiencies. Thus, the overall efficiency remained almost unchanged (around
70%) as the operating current density varied. This result indicates that an HT-PEMFC system with
an absorption chiller can be adapted to various electrical, cooling, and heating-load requirements as
the seasons change.
Figure 8. (a) Required burner natural gas (BNG) and process natural gas (PNG) flow rates and amountof heat supplied to the SR reactor with the variation of operating current density, (b) electric power,waste heat, and cooling capacity of HT-PEMFC stack as a function of operating current density. As theoperating current density varied, the BNG and PNG flow rates were adjusted to maintain the sameanode stoichiometry of 1.2.
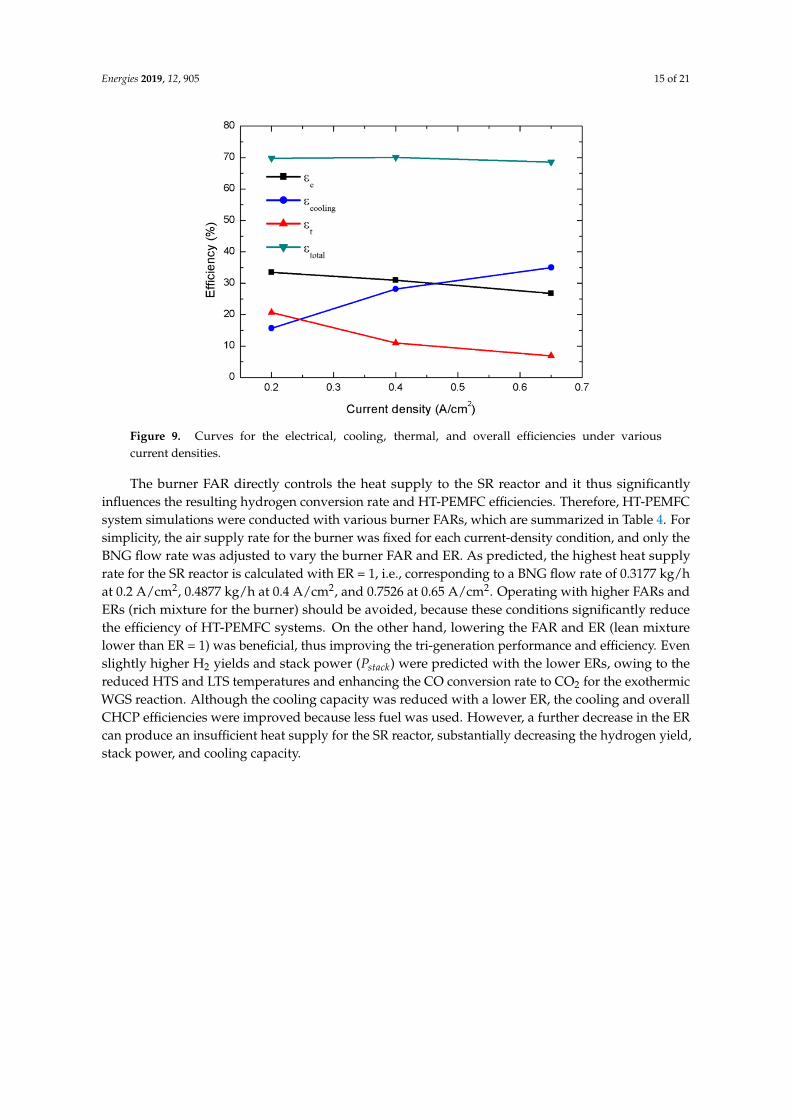
Figure 9 shows the electrical, cooling, thermal, and overall efficiencies (expressed inEquations (23), (31), (33) and (34), respectively) at three different current densities. Absorptionchillers typically perform more efficiently at higher temperature and larger heat input, so the coolingefficiency increases relatively sharply with increasing current density, which offsets the decreases inthe electrical and thermal efficiencies. Thus, the overall efficiency remained almost unchanged (around70%) as the operating current density varied. This result indicates that an HT-PEMFC system with anabsorption chiller can be adapted to various electrical, cooling, and heating-load requirements as theseasons change.
Energies 2019, 12, 905 15 of 21Energies 2018, 11, x FOR PEER REVIEW 15 of 21
Figure 9. Curves for the electrical, cooling, thermal, and overall efficiencies under various current
densities.
The burner FAR directly controls the heat supply to the SR reactor and it thus significantly
influences the resulting hydrogen conversion rate and HT-PEMFC efficiencies. Therefore, HT-
PEMFC system simulations were conducted with various burner FARs, which are summarized in
Table 4. For simplicity, the air supply rate for the burner was fixed for each current-density condition,
and only the BNG flow rate was adjusted to vary the burner FAR and ER. As predicted, the highest
heat supply rate for the SR reactor is calculated with ER = 1, i.e., corresponding to a BNG flow rate of
0.3177 kg/h at 0.2 A/cm2, 0.4877 kg/h at 0.4 A/cm2, and 0.7526 at 0.65 A/cm2. Operating with higher
FARs and ERs (rich mixture for the burner) should be avoided, because these conditions significantly
reduce the efficiency of HT-PEMFC systems. On the other hand, lowering the FAR and ER (lean
mixture lower than ER = 1) was beneficial, thus improving the tri-generation performance and
efficiency. Even slightly higher H2 yields and stack power (𝑃𝑠𝑡𝑎𝑐𝑘) were predicted with the lower ERs,
owing to the reduced HTS and LTS temperatures and enhancing the CO conversion rate to CO2 for
the exothermic WGS reaction. Although the cooling capacity was reduced with a lower ER, the
cooling and overall CHCP efficiencies were improved because less fuel was used. However, a further
decrease in the ER can produce an insufficient heat supply for the SR reactor, substantially decreasing
the hydrogen yield, stack power, and cooling capacity.
Figure 9. Curves for the electrical, cooling, thermal, and overall efficiencies under variouscurrent densities.
The burner FAR directly controls the heat supply to the SR reactor and it thus significantlyinfluences the resulting hydrogen conversion rate and HT-PEMFC efficiencies. Therefore, HT-PEMFCsystem simulations were conducted with various burner FARs, which are summarized in Table 4. Forsimplicity, the air supply rate for the burner was fixed for each current-density condition, and only theBNG flow rate was adjusted to vary the burner FAR and ER. As predicted, the highest heat supplyrate for the SR reactor is calculated with ER = 1, i.e., corresponding to a BNG flow rate of 0.3177 kg/hat 0.2 A/cm2, 0.4877 kg/h at 0.4 A/cm2, and 0.7526 at 0.65 A/cm2. Operating with higher FARs andERs (rich mixture for the burner) should be avoided, because these conditions significantly reducethe efficiency of HT-PEMFC systems. On the other hand, lowering the FAR and ER (lean mixturelower than ER = 1) was beneficial, thus improving the tri-generation performance and efficiency. Evenslightly higher H2 yields and stack power (Pstack) were predicted with the lower ERs, owing to thereduced HTS and LTS temperatures and enhancing the CO conversion rate to CO2 for the exothermicWGS reaction. Although the cooling capacity was reduced with a lower ER, the cooling and overallCHCP efficiencies were improved because less fuel was used. However, a further decrease in the ERcan produce an insufficient heat supply for the SR reactor, substantially decreasing the hydrogen yield,stack power, and cooling capacity.

Energies 2019, 12, 905 16 of 21
Table 4. Effects of fuel-air ratio (FAR) for the burner on the performance of the tri-generation system.
Operating ConditionER
(.
mBNG)[kg/h]
FARCO
Fraction[%]
H2Fraction
[%]
WBurn,sup[kW]
H2yield[kg/h]
THTS[C]
TLTS[C]
Pstack[kW]
Wcooling[kW] COP εe
[%]εcooling
[%]εt
[%]εCHCP
[%]
I = 0.2 A/cm2.
mair = 8.536 kg/h.
mPNG = 0.8587 kg/h.
mBNG = 0.3177 kg/h.
mSR,w = 3.865 kg/h
1.33(0.4236) 5.052 0.5287 79.88 5.177 0.4284 358.3 248.6 5.980 2.558 0.494 30.679 14.351 18.950 63.981
1(0.3177) 4.610 0.5553 79.87 5.205 0.4283 362.7 251.6 5.978 2.566 0.493 33.429 15.692 20.656 69.777
0.76(0.2421) 4.200 0.1197 79.95 4.428 0.4303 226.0 165.6 6.007 2.494 0.563 35.916 16.300 22.075 74.291
0.4 A/cm2.
mair = 13.27 kg/h.
mPNG = 1.725 kg/h.
mBNG = 0.4877 kg/h.
mSR,w = 7.755 kg/h
1.33(0.6503) 4.867 0.5631 79.89 8.085 0.8608 304.3 250.8 10.228 8.729 1.080 28.870 26.439 10.230 65.538
1(0.4877) 4.507 0.6060 79.88 8.145 0.8604 310.4 255.9 10.223 8.657 1.062 30.974 28.147 10.982 70.103
0.80(0.3902) 4.194 0.1581 79.97 7.135 0.8656 202.0 166.0 10.285 8.338 1.169 32.614 28.360 11.488 72.462
0.65 A/cm2.
mair = 20.91 kg/h.
mPNG = 2.801 kg/h.
mBNG = 0.7526 kg/h.
mSR,w = 12.60 kg/h
1.33(1.0035) 4.780 0.6349 79.87 12.773 1.3967 302.7 265.2 13.819 17.270 1.352 25.009 32.658 6.387 64.054
1(0.7526) 4.439 0.6752 79.86 12.840 1.3960 307.1 269.2 13.812 17.292 1.347 26.761 35.008 6.838 68.606
0.80(0.6021) 4.142 0.2389 79.97 11.280 1.4051 196.4 171.6 13.902 16.737 1.484 28.135 35.383 7.140 70.658

Energies 2019, 12, 905 17 of 21
4. Conclusions
In this paper, we developed the HT-PEMFC system model for tri-generation, wherein an LiBr-H2Oabsorption chiller model was developed and then coupled with an HT-PEMFC stack model that isbased on a PA-doped PBI membrane and fuel-reforming model that comprises an SR reactor, HTSand LST reactors, and burner, which were connected with various BOPs and heat exchangers. Usingthe commercially available flowsheet simulator Aspen HYSYS®, the system model for tri-generationwas simulated under various operating conditions. The simulation results highlighted that highercurrent operation in the HT-PEMFC stack was needed to achieve sufficient cooling capacity. As thestack current density was raised from 0.2 A/cm2 to 0.65 A/cm2, the electric efficiency of HT-PEMFCstack dropped from 33.4% to 26.8%, but the cooling efficiency of single-effect LiBr-H2O absorptionchiller was improved from 15.7% to 35.0%, leading to a substantial increase in the cooling capacityfrom 2.566 to 17.292 kW. In addition, a burner ER of around 0.75–0.8 levels was suitable in achievinghigher overall CHCP efficiencies ranging from 70% at 0.65 A/cm2 to 75% at 0.2 A/cm2 without anyloss of cooling capacity. This numerical study clearly illustrated that an HT-PEMFC system with anabsorption chiller can adequately respond to various electrical, cooling, and heating-load requirementsas seasons change.
Author Contributions: Conceptualization, G.G. and M.K.; Methodology, G.G. and M.K.; Software, G.G.;Validation, H.J.; Formal Analysis, G.G.; Investigation, G.G. and M.K.; Resources, H.J.; Data Curation, K.O.;Writing-Original Draft Preparation, D.K. and M.F.; Writing-Review & Editing, H.J. and M.F.; Visualization, J.L.,J.C., N.L. and K.L.; Supervision, H.J.; Project Administration, H.J.
Acknowledgments: This research was supported by the Technology Innovation Program of the Korea EvaluationInstitute of Industrial Technology (KEIT) (No.10052823) and the authors also would like to thank the supportof the Korea Institute of Energy Technology Evaluation and Planning (KETEP) (No. 20173010032150) under theministry of Trade, Industry & Energy (MOTIE) of Republic of Korea.
Conflicts of Interest: The authors declare no conflict of interest.
Nomenclature
A area, m2
Ai pre-exponential factor of reaction i
A(
Kj
)pre-exponential factor of the adsorption constant for species j
bhpi power consumption of an individual BOP component i, WC concentration, mol·m−3
D mass diffusivity of a species, m2·s−1
Ei activation energy of reaction i, kJ·mol−1
F Faraday constant, C·mol−1
hj specific enthalpy of species j, kJ·mol−1
∆hi specific enthalpy change of reaction i, kJ·mol−1
∆hj adsorption specific enthalpy of species j, kJ·mol−1
i current density, A/cm2
ki rate of reaction iKj adsorption constant for species jKPi equilibrium constant of reaction iLHV lower heating value, kJ·kg−1
M volume flow rate, m3·s−1
MW molar weight, kg·kmol−1.
m mass flow rate, kg·h−1
n number of the cellp pressure, PaP stack power, W.
Qstack total heat generation from a stack, Wri reaction rate i, kmol·(kg cat·h)−1

Energies 2019, 12, 905 18 of 21
R universal gas constant, 8.314 J·(mol·K)−1
Relec equivalent contact resistance to electron conduction, ΩRH+ area-specific resistance from proton transport, ΩT temperature, KU entire heat transfer coefficient, W·m−2·K−1
U0 thermodynamic equilibrium potential, VV voltage, Vz number of electrons in the electrochemical reactionGreek lettersα transfer coefficientε efficiencyν porosityρ density, kg·m−3
η overpotential, Vκ proton conductivity, S·m−1
ξ stoichiometry flow ratioSubscripts & abbreviationsa anodeact activationAOG anode off gasb backwardburn burnerBNG burner natural gasBOP balance of plantB−V Butler-Volmerc cathodechiller chillercon concentrationcool coolantcooling coolingCOP Coefficient of PerformanceCHCP combined heat, cooling and powerCHC Combined Heating and CoolingCL catalyst layere electricER Equivalence Ratiof forwardFAR Fuel Air RatioGDL gas diffusion layerGT gas turbinehr heat recoveryH2O waterHX Heat ExchangerHOR Hydrogen Oxidation ReactionHT High temperatureHTS High temperature-shiftsi reaction numberin inj speciesk BOP componentlim limiting current densitylm logarithmic mean temperature differenceLTS Low temperature-shiftsLiBr Lithium bromideLT Low temperatureLMTD logarithmic mean temperature

Energies 2019, 12, 905 19 of 21
mem membraneMEA membrane electrode assembly0 standard conditionohm ohmicopt optimumout outO2 oxygenORR Oxygen Reduction ReactionPNG process natural gasPBI PolybenzimidazolePA Phosphoric AcidPEMFC Polymer electrolyte membrane fuel cellre f reference valuesup supplySCR Steam to carbon ratioSR Steam reformingSOFCs Solid Oxide Fuel Cellst thermaltotal totaltri-gen tri-generation systemWGS Water Gas Shift
References
1. Hinaje, M.; Raël, S.; Noiying, P.; Nguyen, D.A.; Davat, B. An Equivalent Electrical Circuit Model of ProtonExchange Membrane Fuel Cells Based on Mathematical Modelling. Energies 2012, 5, 2724–2744. [CrossRef]
2. Araya, S.S.; Andreasen, S.J.; Kær, S.K. Experimental Characterization of the Poisoning Effects ofMethanol-Based Reformate Impurities on a PBI-Based High Temperature PEM Fuel Cell. Energies 2012, 5,4251–4267. [CrossRef]
3. Wang, F.C.; Lin, K.M. Impacts of Load Profiles on the Optimization of Power Management of a GreenBuilding Employing Fuel Cells. Energies 2019, 12, 57. [CrossRef]
4. Martin, I.S.; Ursua, A.; Sanchis, P. Modelling of PEM Fuel Cell Performance: Steady-State and DynamicExperimental Validation. Energies 2014, 7, 670–700. [CrossRef]
5. Wu, D.W.; Wang, R.Z. Combined cooling, heating and power: A review. Prog. Energy Combust. 2006, 32,459–495. [CrossRef]
6. Cozzolino, R. Thermodynamic Performance Assessment of a Novel Micro-CCHP System Based on aLow Temperature PEMFC Power Unit and a Half-Effect Li/Br Absorption Chiller. Energies 2018, 11, 315.[CrossRef]
7. Gordon, J.M.; Ng, K.C. A general thermodynamic model for absorption chillers: Theory and experiment.Appl. Therm. Eng. 1995, 15, 73–83. [CrossRef]
8. Xu, Y.; Zhang, S.; Xiao, Y. Modeling the dynamic simulation and control of a single effect LiBr-H2OAbsorption chiller. Appl. Therm. Eng. 2016, 107, 1183–1191. [CrossRef]
9. Martínez, J.C.; Martinez, P.J.; Bujedo, L.A. Development and experimental validation of a simulation modelto reproduce the performance of a 17.6 kW LiBr-water absorption chiller. Renew. Energy 2016, 86, 473–482.[CrossRef]
10. Ochoa, A.A.V.; Dutra, J.C.C.; Henríquez, J.R.G.; Dos Santos, C.A.C. Dynamic study of a single effectabsorption chiller using the pair LiBr/H2O. Energy Convers. Manag. 2016, 108, 30–42. [CrossRef]
11. Rubio-Maya, C.; Pacheco-Ibarra, J.J.; Belman-Flores, J.M.; Galván-González, S.R.; Mendoza-Covarrubias, C.NLP model of a LiBr-H2O absorption refrigeration system for the minimization of the annual operating cost.Appl. Therm. Eng. 2012, 37, 10–18. [CrossRef]
12. Yin, H.; Qu, M.; Archer, D.H. Model based experimental performance analysis of a microscale LiBr-H2Osteam-driven double-effect absorption Chiller. Appl. Therm. Eng. 2010, 30, 1741–1750. [CrossRef]
13. Xu, Z.Y.; Wang, R.Z. Experimental verification of the variable effect absorption refrigeration cycle. Energy2014, 77, 703–709. [CrossRef]

Energies 2019, 12, 905 20 of 21
14. Takezawa, S.; Wakahara, K.; Araki, T.; Onda, K.; Nagata, S. Cycle analysis using exhaust heat of SOFC andturbine combined cycle by absorption chiller. Electr. Eng. Jpn. 2009, 167, 49–55. [CrossRef]
15. Malico, I.; Carvalhinho, A.P.; Tenreiro, J. Design of a trigeneration system using a high-temperature fuel cell.Int. J. Energy Res. 2009, 33, 144–151. [CrossRef]
16. Yu, Z.; Han, J.; Cao, X. Investigation on performance of an integrated solid oxide fuel cell and absorptionchiller tri-generation system. Int. J. Hydrog. Energy 2011, 36, 12561–12573. [CrossRef]
17. Burer, M.; Tanaka, K.; Favrat, D.; Yamada, K. Multi-criteria optimization of a district cogeneration plantintegrating a solid oxide fuel cell–gas turbine combined cycle, heat pumps and chillers. Energy 2003, 28,497–518. [CrossRef]
18. Tse, L.K.C.; Wilkins, S.; McGlashan, N.; Urban, B.; Martinez-Botas, R. Solid oxide fuel cell/gas turbinetrigeneration system for marine applications. J. Power Sources 2011, 196, 3149–3162. [CrossRef]
19. Margalef, P.; Samuelsen, S. Integration of a molten carbonate fuel cell with a direct exhaust absorption chiller.J. Power Sources 2010, 195, 5674–5685. [CrossRef]
20. Intini, M.; De Antonellis, S.; Joppolo, C.M.; Casalegno, A. A trigeneration system based on polymer electrolytefuel cell and desiccant wheel—Part B: Overall system design and energy performance analysis. EnergyConvers. Manag. 2015, 106, 1460–1470. [CrossRef]
21. Chen, X.; Gong, G.; Wan, Z.; Luo, L.; Wan, J. Performance analysis of 5 kW PEMFC-based residentialmicro-CCHP with absorption chiller. Int. J. Hydrog. Energy 2015, 40, 10647–10657. [CrossRef]
22. Arsalis, A. Modeling and simulation of a 100 kWe HT-PEMFC subsystem integrated with an absorptionchiller subsystem. Int. J. Hydrog. Energy 2012, 37, 13484–13490. [CrossRef]
23. Ge, Y.; Tassou, S.; Chaer, L.; Suguartha, N. Performance evaluation of a tri-generation system with simulationand experiment. Appl. Energy 2009, 86, 2317–2326. [CrossRef]
24. Najafi, B.; Antonellis, S.; Lntini, M.; Zago, M.; Rinaldi, F.; Casalegno, A. Atri-generation system based onplymer electrolyte fuel cell and desiccant whell—Part A: Fuel cell system modelling and parial load analysis.Energy Convers. Manag. 2015, 106, 1450–1459. [CrossRef]
25. Al-Sulaiman, F.; Dincer, L.; Hamdullapur, F. Energy analysis of a trigeneration plant based on solid oxidefuel cell and organic Ranine cycle. Int. J. Hydrog. Energy 2010, 35, 5104–5113. [CrossRef]
26. Tippawan, P.; Arpornwichanop, A.; Dincer, L. Energy and Exergy analyses of an ethanol-fueled solid oxidefuel cell for a trigeneration system. Energy 2015, 87, 228–339. [CrossRef]
27. Authayanun, S.; Hacker, V. Energy and exergy analyses of a stand-alone HT-PEMFC based trigenerationsystem for residential applications. Energy Convers. Manag. 2018, 160, 230–242. [CrossRef]
28. Jo, A.; Oh, K.; Lee, J.; Han, D.; Kim, D.; Kim, J.; Kim, B.; Kim, J.; Park, D.; Kim, M.; et al. Modeling andanalysis of a 5 kWe HT-PEMFC system for residential heat and power generation. Int. J. Hydrog. Energy 2017,42, 1698–1714. [CrossRef]
29. Oh, K.; Ju, H. Temperature dependence of CO poisoning in high-temperature proton exchange membranefuel cells with phosphoric acid-doped polybenzimidazole membranes. Int. J. Hydrog. Energy 2015, 40,7743–7753. [CrossRef]
30. Das, S.K.; Reis, A.; Berry, K.J. Experimental evaluation of CO poisoning on the performance of a hightemperature proton exchange membrane fuel cell. J. Power Sources 2009, 193, 691–698. [CrossRef]
31. Xu, J.; Froment, G.F. Methane steam reforming methanation and water-gas shift: I. Intrinsic kinetics. AIChE J.1989, 35, 88–96.
32. Oliveira, E.L.G.; Grande, C.A. Steam methane reforming in a Ni/Al2O3 catalyst: Kinetics and diffusionallimitations in extrudates. Can. J. Chem. Eng. 2009, 87, 945–956. [CrossRef]
33. Hou, K.; Hughes, R. The kinetics of methane steam reforming over a Ni/α-catalyst. Chem. Eng. J. 2001, 82,311–328. [CrossRef]
34. Chen, W.H.; Lin, M.R.; Jiang, T.L.; Chen, M.H. Modeling and simulation of hydrogen generation fromhigh-temperature and low-temperature water gas shift reactions. Int. J. Hydrog. Energy 2008, 33, 6644–6656.[CrossRef]
35. Chippar, P.; Oh, K.; Kim, W.G.; Ju, H. Numerical analysis of effects of gas crossover through membranepinholes in high-temperature proton exchange membrane fuel cells. Int. J. Hydrog. Energy 2014, 39, 2863–2871.[CrossRef]

Energies 2019, 12, 905 21 of 21
36. Oh, K.; Jeong, G.; Cho, E.A.; Kim, W.; Ju, H. A CO poisoning model for high-temperature proton exchangemembrane fuel cells comprising phosphoric acid-doped polybenzimidazole membranes. Int. J. Hydrog.Energy 2014, 39, 21915–21926. [CrossRef]
37. Oh, K.; Chippar, P.; Ju, H. Numerical study of thermal stresses in high-temperature proton exchangemembrane fuel cell (HT-PEMFC). Int. J. Hydrog. Energy 2014, 39, 2785–2794. [CrossRef]
38. Won, S.; Oh, K.; Ju, H. Numerical degradation studies of high-temperature proton exchange membrane fuelcells with phosphoric acid-doped PBI membranes. Int. J. Hydrog. Energy 2016, 41, 8296–8306. [CrossRef]
39. Qingfeng, L.; Hjuler, H.A.; Bjerrum, N.J. Phosphoric acid doped polybenzimidazole membranes:Physiochemical characterization and fuel cell applications. J. Appl. Electrochem. 2001, 31, 773–779. [CrossRef]
40. Jiao, K.; Li, X. A three-dimensional non-isothermal model of high temperature proton exchange membranefuel cells with phosphoric acid doped polybenizmidazole membranes. Fuel Cells 2010, 10, 351–362. [CrossRef]
© 2019 by the authors. Licensee MDPI, Basel, Switzerland. This article is an open accessarticle distributed under the terms and conditions of the Creative Commons Attribution(CC BY) license (http://creativecommons.org/licenses/by/4.0/).