performance analysis of peer-to-peer communication on 3g
TRANSCRIPT

Blekinge Institute of Technology
School of Engineering
Department of Electrical Engineering
Supervisor: Muhammad Imran Iqbal
Examiner: Prof. Hans-Jürgen Zepernick
Munigala Ranjeet
Katikar Praveen
Performance Analysis of Peer-to-Peer
Communication on 3G Cellular Networks
This thesis is presented as part of Degree of Master of Science in Electrical
Engineering
Blekinge Institute of Technology
November 2011

Performance Analysis of Peer-to-Peer communications on 3G Cellular Networks
i
Contact Information:
Author(s):
Ranjeet Munigala
E-mail: [email protected]
Praveen Katikar
E-mail: [email protected]
University advisor: Muhammad Imran Iqbal,
School of Computing,
Blekinge Institute of Technology,
371 79, Karlskrona, Sweden
Mobil: 0455-385586
Email: [email protected]
University Examiner: Hans-Jürgen Zepernick,
School of Computing,
Blekinge Institute of Technology,
371 79, Karlskrona, Sweden
Mobil: 455-385718
Email: [email protected]
School of Engineering
Blekinge Institute of Technology
SE – 371 79 Karlskrona
Sweden
Internet : www.bth.se/ing
Phone : +46 455 38 50 00
Fax : +46 455 38 50 57
This thesis is submitted to the School of Engineering at Blekinge Institute of Technology in
partial fulfillment of the requirements for the degree of Master of Science in Electrical
Engineering. The thesis is equivalent to 20 weeks of full time studies.

Performance Analysis of Peer-to-Peer communications on 3G Cellular Networks
Abstract ii
ABSTRACT
Many technologies are emerging in the field of
telecommunications enabling higher data rate
services through mobile and portable modems on
3G networks. To support rich data services,
operators are looking beyond their 2G/2.5G
networks for long-term and cost-effective proven
solutions. Peer-to-Peer (P2P) communication
services play major role in third and upcoming
generations of cellular systems. P2P is gaining
significance because of growing popularity of
mobile web environment.
In this thesis, the authors investigate the
performance of Transmission Control Protocol
(TCP) and User Datagram Protocol (UDP) for P2P
communication services on 3G UMTS network.
This thesis examines how different parameters
such as network load, chunk size, data size, and
signal strength influence performance metrics on a
real time network. The performance metrics chosen
for this purpose are Normalized Average Delay
(NAD), throughput and data loss. From the
experimental results, it was observed that as chunk
size increases throughput increases and NAD
decreases. It was also noticed that better results for
non-peak hours and strong signal strengths when
compared to peak hours and weak signal strengths.
Finally, data loss was observed only for UDP.
Keywords: P2P, TCP, UDP, 3G, UMTS Network,
NAD, throughput, and data loss.

Performance Analysis of Peer-to-Peer communications on 3G Cellular Networks
Acknowledgement iii
ACKNOWLEDGEMENT
I would like to take this opportunity to thank our thesis supervisor Muhammad
Imran Iqbal for consistently providing us with the required guidance which helped
us in the timely and successful completion of our thesis. In spite of his extremely
busy schedules in the department, he was always available to share with us his deep
insights, wide knowledge and extensive experience.
I would like to express my gratitude from heart to my mother Sayamma Katikar,
father Narsimha Katikar and my elder brother Raju Katikar. They rendered me
enormous support during the whole tenure of my stay in Sweden.
Finally, I would like to thank all those who have directly and indirectly contributed
to the success of my thesis.
Praveen Katikar
Karlskrona, November 2011
I would like to express my sincere gratitude to our thesis supervisor Muhammad
Imran Iqbal, who supported us with his valuable ideas, guidance, constant
encouragement and friendliness throughout this work which made this experience
productive and exciting. I would also like to thank our thesis examiner prof. Hans-
Jürgen Zepernick.
I would like to express my heartfelt gratitude to my parents (Ram Kumar Munigala
and Kalpana Munigala) and family for their love, patience, support and prayers that
helped me to overcome the difficulties during this journey in Sweden.
Finally, special thanks to my friends who motivated, encouraged and supported me
financially during hard times.
Ranjeet Munigala
Karlskrona, November 2011

Performance Analysis of Peer-to-Peer communications on 3G Cellular Networks
Table of contents iv
TABLE OF CONTENTS
Contents
PERFORMANCE ANALYSIS OF PEER-TO-PEER COMMUNICATION ON
3G CELLULAR NETWORKS .................................................................................. I
ABSTRACT ............................................................................................................... II
ACKNOWLEDGEMENT ...................................................................................... III
TABLE OF CONTENTS ......................................................................................... IV
LIST OF FIGURES ................................................................................................. VI
LIST OF TABLES ................................................................................................. VII
LIST OF ABBREVIATIONS ............................................................................... VIII
1. INTRODUCTION .............................................................................................. 1
1.1 RELATED WORK AND MOTIVATION ...................................................................... 1
1.2 THESIS OBJECTIVE ............................................................................................... 2
1.3 RESEARCH METHODOLOGY ................................................................................. 3
2. PEER-TO-PEER COMMUNICATIONS ......................................................... 4
2.1 SIGNIFICANCE AND EMERGENCE .......................................................................... 4
2.2 OVERLAY NETWORKS .......................................................................................... 5
2.3 P2P NETWORKS ................................................................................................... 5
2.4 KEY CHARACTERISTICS OF P2P NETWORKS ......................................................... 7
2.4.1 Resource sharing .......................................................................................... 7
2.4.2 Symmetry ..................................................................................................... 7
2.4.3 Autonomy .................................................................................................... 7
2.4.4 Self-Organization ......................................................................................... 7
2.4.5 Scalability .................................................................................................... 7
2.4.6 Stability ........................................................................................................ 7
2.4.7 Decentralization ........................................................................................... 8
2.5 CLASSIFICATION OF P2P NETWORKS ................................................................... 8
2.5.1 Classification based on appeared time and purpose .................................... 8
2.5.2 Classification based on degree of centralization ........................................ 11
2.5.3 Classification based on network topology ................................................. 13
2.6 MOBILE P2P ...................................................................................................... 18
3. OVERVIEW OF CELLULAR NETWORKS ............................................... 20
3.1 INTRODUCTION .................................................................................................. 20
3.2 FIRST GENERATION RADIO SYSTEMS .................................................................. 21
3.3 SECOND GENERATION RADIO SYSTEMS .............................................................. 21
3.3.1 Code division multiple access (CDMA) .................................................... 21
3.3.2 Global system for mobile communications (GSM) ................................... 22
3.3.3 General Packet Radio Service (GPRS) ...................................................... 22
3.3.4 Enhanced Data Rate for GSM Evolution (EDGE) .................................... 23
3.4 THIRD GENERATION RADIO SYSTEMS ................................................................. 23
3.4.1 CDMA 2000 .............................................................................................. 24
Performance Analysis of Peer-to-Peer communications on 3G Cellular Networks
Table of contents v
3.4.2 Universal Mobile Telecommunications System (UMTS) ......................... 25
4. EXPERIMENTAL SETUP .............................................................................. 28
4.1 THE BASIC APPROACH ....................................................................................... 28
4.2 THE ARCHITECTURE AND DEVELOPMENT OF HYBRID P2P MODEL ...................... 30
4.2.1 Socket Communication/ programming ...................................................... 30
4.2.2 Basic architecture and development of connection-oriented sockets ........ 31
4.2.3 Basic architecture and development connectionless- sockets .................... 32
4.3 CONNECTION ESTABLISHMENT BETWEEN PEERS AND DATA TRANSMISSION ....... 33
4.4 EXPERIMENT CONFIGURATION AND ANALYSIS PROCEDURE ............................... 33
4.4.1 Experimental configuration ....................................................................... 33
4.4.2 Analysis procedure .................................................................................... 35
5. RESULTS .......................................................................................................... 37
5.1 CASE 1 ............................................................................................................. 37
5.2 CASE 2 ............................................................................................................. 38
5.3 CASE 3 ............................................................................................................. 40
5.4 CASE 4 ............................................................................................................. 41
5.5 CASE 5 ............................................................................................................. 43
5.5.1 Effect of chunk size on data loss ............................................................... 43
5.5.2 Effect of data size on data loss ................................................................... 44
5.5.3 Effect of network load on data loss ........................................................... 44
5.5.4 Effect of signal strength on data loss ......................................................... 45
5.6 VALIDITY THREATS ............................................................................................ 46
6. CONCLUSIONS ............................................................................................... 47
7. FUTURE WORK .............................................................................................. 48
BIBLIOGRAPHY .................................................................................................... 50
APPENDICES .......................................................................................................... 53
APPENDIX A ............................................................................................................ 53
STEP BY STEP PROCEDURE OF CONNECTING PEERS FOR TCP APPLICATION .............. 53
APPENDIX B ............................................................................................................ 56
FOR UDP APPLICATION: ......................................................................................... 56
APPENDIX C ............................................................................................................ 56
COMPLETE RESULTS FOR DIFFERENT SCENARIO FOR TCP ........................................ 56
APPENDIX D ............................................................................................................ 62
COMPLETE RESULTS FOR DIFFERENT SCENARIO FOR UDP ....................................... 62
Performance Analysis of Peer-to-Peer communications on 3G Cellular Networks
List of Figures vi
LIST OF FIGURES
FIGURE 1: OVERLAY NETWORK ............................................................................................................... 5 FIGURE 2: SAMPLE P2P NETWORK ......................................................................................................... 6 FIGURE 3: CENTRALIZED NETWORK........................................................................................................ 9 FIGURE 4: DECENTRALIZED NETWORK ................................................................................................. 10 FIGURE 5: PURE P2P ............................................................................................................................. 11 FIGURE 6: HYBRID P2P .......................................................................................................................... 12 FIGURE 7: MIXED P2P ........................................................................................................................... 13 FIGURE 8: CENTRALIZED TOPOLOGY .................................................................................................... 14 FIGURE 9: RING TOPOLOGY .................................................................................................................. 14 FIGURE 10: HIERARCHICAL TOPOLOGY................................................................................................. 15 FIGURE 11: DECENTRALIZED TOPOLOGY .............................................................................................. 16 FIGURE 12: CENTRALIZED AND RING TOPOLOGY ................................................................................. 17 FIGURE 13: CENTRALIZED AND CENTRALIZED TOPOLOGY ................................................................... 17 FIGURE 14: CENTRALIZED AND DECENTRALIZED TOPOLOGY ............................................................... 18 FIGURE 15: PROTOCOL ARCHITECTURE OF IS-95 (CDMA ONE) STANDARD [26]. ................................. 22 FIGURE 16: EVOLUTION OF 2G TO 3G CELLULAR NETWORKS [28]. ..................................................... 24 FIGURE 17: NETWORK ARCHITECTURE [26]. ........................................................................................ 26 FIGURE 18: AIR INTERFACE PROTOCOL STRUCTURE OF WCDMA (UMTS) [26]. ................................... 27 FIGURE 19: BASIC P2P MODEL .............................................................................................................. 28 FIGURE 20: HYBRID P2P MODEL ........................................................................................................... 29 FIGURE 21: OSI MODEL FOR SOCKET API’S ........................................................................................... 30 FIGURE 22: SCHEMATIC DIAGRAM SHOWING COMMUNICATION BETWEEN TWO PROCESSES ......... 31 FIGURE 23: BASIC ARCHITECTURE OF TCP STREAM SOCKET SESSION.................................................. 32 FIGURE 24: BASIC ARCHITECTURE OF UDP DATAGRAM SOCKET SESSION ........................................... 32 FIGURE 25: EFFECT OF CHUNK SIZE ON THROUGHPUT FOR TCP AND UDP ......................................... 37 FIGURE 26: EFFECT OF CHUNK SIZE ON NAD FOR TCP AND UDP ......................................................... 38 FIGURE 27: EFFECT OF DATA SIZE ON THROUGHPUT FOR BOTH TCP AND UDP .................................. 39 FIGURE 28: EFFECT OF DATA SIZE ON NAD FOR BOTH TCP AND UDP .................................................. 39 FIGURE 29: EFFECT OF NETWORK LOAD ON THROUGHPUT FOR BOTH TCP AND UDP ........................ 40 FIGURE 30: EFFECT OF NETWORK LOAD ON NAD FOR BOTH TCP AND UDP........................................ 41 FIGURE 31: EFFECT OF SIGNAL STRENGTH ON THROUGHPUT FOR BOTH TCP AND UDP .................... 42 FIGURE 32: EFFECT OF SIGNAL STRENGTH ON NAD FOR BOTH TCP AND UDP .................................... 42 FIGURE 33: EFFECT OF CHUNK SIZE ON DATA LOSS ............................................................................. 43 FIGURE 34: EFFECT OF DATA SIZE ON DATA LOSS ................................................................................ 44 FIGURE 35: EFFECT OF NETWORK LOAD ON DATA LOSS ...................................................................... 45 FIGURE 36: EFFECT OF SIGNAL STRENGTH ON DATA LOSS .................................................................. 46 FIGURE 37: COMMAND WINDOW OF SERVER WAITING FOR PEERS ................................................... 53 FIGURE 38: COMMAND WINDOW OF PEER A ...................................................................................... 54 FIGURE 39: COMMAND WINDOW OF SERVER AFTER CONNECTING PEER A ....................................... 54 FIGURE 40: COMMAND WINDOW OF PEER B ...................................................................................... 55 FIGURE 41: COMMAND WINDOW OF SERVER AFTER CONNECTING PEER A AND PEER B ................... 55

Performance Analysis of Peer-to-Peer communications on 3G Cellular Networks
List of tables vii
LIST OF TABLES TABLE 1: SHOWS THE LIBRARY FUNCTIONS OF SOCKET ....................................................................... 31
TABLE 2: RESULTS OBTAINED FOR CONDITIONS STRONG SIGNAL, CHUNK SIZE OF 1024 BYTES AND NONPEAK NETWORK LOAD ......................................................................................................... 56
TABLE 3: RESULTS OBTAINED FOR CONDITIONS STRONG SIGNAL, CHUNK SIZE OF 1024 BYTES AND PEAK NETWORK LOAD ................................................................................................................. 57
TABLE 4: RESULTS OBTAINED FOR CONDITIONS WEAK SIGNAL, CHUNK SIZE OF 1024 BYTES AND NONPEAK NETWORK LOAD ......................................................................................................... 57
TABLE 5: RESULTS OBTAINED FOR CONDITIONS WEAK SIGNAL, CHUNK SIZE OF 1024 BYTES AND PEAK NETWORK LOAD .......................................................................................................................... 58
TABLE 6: RESULTS OBTAINED FOR CONDITIONS STRONG SIGNAL, CHUNK SIZE OF 768 BYTES AND NONPEAK NETWORK LOAD ......................................................................................................... 58
TABLE 7: RESULTS OBTAINED FOR CONDITIONS STRONG SIGNAL, CHUNK SIZE OF 768 BYTES AND PEAK NETWORK LOAD ................................................................................................................. 59
TABLE 8: RESULTS OBTAINED FOR CONDITIONS WEAK SIGNAL, CHUNK SIZE OF 768 BYTES AND NONPEAK NETWORK LOAD ......................................................................................................... 59
TABLE 9: RESULTS OBTAINED FOR CONDITIONS WEAK SIGNAL, CHUNK SIZE OF 768 BYTES AND PEAK NETWORK LOAD .......................................................................................................................... 60
TABLE 10: RESULTS OBTAINED FOR CONDITIONS STRONG SIGNAL, CHUNK SIZE OF 512 BYTES AND NONPEAK NETWORK LOAD ......................................................................................................... 60
TABLE 11: RESULTS OBTAINED FOR CONDITIONS STRONG SIGNAL, CHUNK SIZE OF 512 BYTES AND PEAK NETWORK LOAD ................................................................................................................. 61
TABLE 12: RESULTS OBTAINED FOR CONDITIONS WEAK SIGNAL, CHUNK SIZE OF 512 BYTES AND NONPEAK NETWORK LOAD ......................................................................................................... 61
TABLE 13: RESULTS OBTAINED FOR CONDITIONS WEAK SIGNAL, CHUNK SIZE OF 512 BYTES AND PEAK NETWORK LOAD .......................................................................................................................... 62
TABLE 14: RESULTS OBTAINED FOR CONDITIONS STRONG SIGNAL, CHUNK SIZE OF 1024 BYTES AND NONPEAK NETWORK LOAD ......................................................................................................... 62
TABLE 15: RESULTS OBTAINED FOR CONDITIONS STRONG SIGNAL, CHUNK SIZE OF 1024 BYTES AND PEAK NETWORK LOAD ................................................................................................................. 63
TABLE 16: RESULTS OBTAINED FOR CONDITIONS WEAK SIGNAL, CHUNK SIZE OF 1024 BYTES AND NONPEAK NETWORK LOAD ......................................................................................................... 63
TABLE 17: RESULTS OBTAINED FOR CONDITIONS WEAK SIGNAL, CHUNK SIZE OF 1024 BYTES AND PEAK NETWORK LOAD ................................................................................................................. 64
TABLE 18: RESULTS OBTAINED FOR CONDITIONS STRONG SIGNAL, CHUNK SIZE OF 768 BYTES AND NONPEAK NETWORK LOAD ......................................................................................................... 64
TABLE 19: RESULTS OBTAINED FOR CONDITIONS STRONG SIGNAL, CHUNK SIZE OF 768 BYTES AND PEAK NETWORK LOAD ................................................................................................................. 65
TABLE 20: RESULTS OBTAINED FOR CONDITIONS WEAK SIGNAL, CHUNK SIZE OF 768 BYTES AND NONPEAK NETWORK LOAD ......................................................................................................... 65
TABLE 21: RESULTS OBTAINED FOR CONDITIONS WEAK SIGNAL, CHUNK SIZE OF 768 BYTES AND PEAK NETWORK LOAD .......................................................................................................................... 66
TABLE 22: RESULTS OBTAINED FOR CONDITIONS STRONG SIGNAL, CHUNK SIZE OF 512 BYTES AND NONPEAK NETWORK LOAD ......................................................................................................... 66
TABLE 23: RESULTS OBTAINED FOR CONDITIONS STRONG SIGNAL, CHUNK SIZE OF 512 BYTES AND PEAK NETWORK LOAD ................................................................................................................. 67
TABLE 24: RESULTS OBTAINED FOR CONDITIONS WEAK SIGNAL, CHUNK SIZE OF 512 BYTES AND NONPEAK NETWORK LOAD ......................................................................................................... 67
TABLE 25: RESULTS OBTAINED FOR CONDITIONS WEAK SIGNAL, CHUNK SIZE OF 512 BYTES AND PEAK NETWORK LOAD .......................................................................................................................... 68

Performance Analysis of Peer-to-Peer communications on 3G Cellular Networks
List of Abbreviations viii
LIST OF ABBREVIATIONS
1G/2G/3G/4G First Generation/Second Generation/Third
Generation/Fourth Generation
3GPP2 Third Generation Partnership Project 2
API Application Programming Interface
AMPS Advanced Mobile Phone System
ARIB Alliance of Radio Industries and Business
ANSI American National Standards Institute
AMTS Advanced Mobile Telephone System
CA Certification Authorities
CPU Central Processing Unit
CN Core Network
CSD Circuit Switched Data
CWTS China Wireless Telecommunication Standard group
CDMA Code Division Multiple Access
DNS Domain Name System
DHT Distributed Hash Table
ETSI European Telecommunications Standards and Institute
EDGE Enhanced Data Rate for GSM Evolution

Performance Analysis of Peer-to-Peer communications on 3G Cellular Networks
List of Abbreviations ix
EGPRS Enhanced General Packet Radio Service
ECSD Enhanced Circuit Switched Data
FDMA Frequency Division Multiple Access
FIFO First In First Out
GSM Global Systems for Mobile Communications
GPRS General Packet Radio Service
GPS Global Positioning System
HTML Hyper Text Markup Language
HSCSD High Speed Circuit Switched Data
IP Internet Protocol
ITU International Telecommunication Union
IMTS Improved Mobile Telephone Service
IMS IP Multimedia Subsystem
LTE Long Term Evolution
LAN Local Area Network
MANET Mobile Ad-hoc Network
MMS Multimedia Messaging Services
NAD Normalized Average Delay
NMT Nordic Mobile Telephone
NTT Nippon Telegraph and Telephone
P2P Peer to Peer
Performance Analysis of Peer-to-Peer communications on 3G Cellular Networks
List of Abbreviations x
PTT Push to Talk
PDA Personal Device Assistant
PDC Personal Digital Cellular
PHS Personal Handy Phone System
RSSI Received Signal Quality Indicator
SMS Short Message Service
SIP Session Initiation Protocol
TCP Transmission Control Protocol
TDMA Time Division Multiple Access
TIA Telecommunications Industry Association
TACS Total Access Communication System
TTC Telecommunication Technology Committee
TIA Telecommunications Industry Association
TTA Telecommunications Technology Association
UMTS Universal Mobile Telecommunications System
UE User Equipment
UDP User Datagram Protocol
UWB Ultra-Wideband
UTRAN Universal Terrestrial Radio Access Network
VoIP Voice Over IP
VAS Value-added Service

Performance Analysis of Peer-to-Peer communications on 3G Cellular Networks
List of Abbreviations xi
WIMAX Worldwide Interoperability for Microwave Access
WCDMA Wideband Code Division Multiple Access
WAP Wireless Application Protocol

Performance Analysis of Peer-to-Peer communications on 3G Cellular Networks
Introduction 1
1. INTRODUCTION
Peer-to-Peer (P2P) communication services play major role in third and upcoming
generations of cellular systems. In P2P networking, all peers share equivalent
responsibility for processing data. Peers that participate in P2P communication
usually have equivalent capabilities and responsibilities unlike a traditional
client/server model in which some computers are specially dedicated for serving
others [1].
With the continuous development of network technologies, the traditional network
models based on client/server are gradually decreasing. More and more networks are
using P2P communication because it is difficult to meet user‟s requirements in
traditional client/server networks. The main advantages of P2P over client-server are
greater storage, more computer cycles, and greater bandwidth.
The number of mobile broadband users is growing day by day. Further, these users
have high expectations on mobile broadband comparable to those in fixed networks.
The services that can be delivered on mobile networks depend on the data rate these
networks may offer. Therefore, the services and features differ from one generation
to others. With new technological advancements the present networks are able to
deliver data at good speeds and are capable of handling multimedia services [2].
The need for higher bandwidth is increasing to support the advanced applications
such as video streaming, multimedia, mobile television. Other bandwidth intensive
applications have accelerated the adoption of third generation cellular systems. The
2/2.5G mobile networks are not appropriate for P2P multimedia applications (audio,
image and video) because of their higher data rate and ubiquitous communication
service demands. In order to fulfil these demands, Third Generation (3G) networks
have been introduced. 3G cellular services are now partially active all around the
world.
1.1 Related work and motivation
In the following, we will discuss some of the recent studies related to the topic of this
thesis. In [31], the authors investigated the performance of an eDonkey-based mobile
P2P file-sharing system by means of time-dynamic simulation. They investigated the
factors that impact the performance of their P2P file-sharing systems by considering
some factors like temporal pattern of the mobile subscribers or the access type, the
file size of mobile specific content, the churn behavior of mobile user and special
infrastructure entities. The authors investigated the performance of P2P file-sharing
system by means of extensive simulations and based on the results they concluded
that the factors which they choose impact the performance of their P2P file-sharing
system.
In [32], the authors propose architecture for implementing P2P as a Session Initiation
Protocol (SIP)-based service in the mobile cellular networks, in particular in IP

Performance Analysis of Peer-to-Peer communications on 3G Cellular Networks
Introduction 2
Multimedia Subsystem (IMS) in 3G mobile networks. The performance of the
architecture is analyzed mathematically and then simulated by using programming.
Authors propose that there are some benefits of using SIP for mobile P2P like the
operators can have control on security and group management, and chargeability is
possible.
In [33], the authors propose a peer selection algorithm named Cell First for Load
Balancing (CFLB) for mobile P2P systems in 3G networks. This algorithm is useful
in selecting a peer with the highest available uplink bandwidth from a cell with the
lowest traffic load until the maximum number of peers is reached. And from the
simulation results, authors concluded that this algorithm can achieve excellent load
balance on the cells in 3G networks while ensuring favorable peer performance.
In [34], based on analysis and adaptation of comparable studies of the present
architecture of P2P authors proposed a new P2P file-sharing system model for 3G
networks. Extensive experimental evaluation is conducted on the P2P model. The
authors conclude that this P2P model brings new development of space and
application prospects for 3G network‟s settlement and application as well as mobile
value-added business in China.
In [35], the author investigated the impact of payload size and data rate on one-way
delay and packet loss in operational 3G mobile networks through network level
measurements on three different commercial mobile operators in Sweden. From the
experimental results the author concluded that the combination of maximum payload
size and data rate resulted in minimum one-way delay, with the big payload size the
percentage of packet loss is less as compared to the smaller payload sizes.
In most of the previous research works, the authors focused on proposing a P2P
model which was generally based on SIP for cellular networks and then they
evaluated the performance of P2P model by considering some performance metrics.
Evaluation of performance in most of the previous research works was mostly based
on simulation studies and at the same time the work did not concentrated on P2P
communications.
So, in this thesis work we are investigating the performance of P2P services using
both transport protocols (TCP and UDP) over real time 3G/UMTS networks. Based
on experimental results, we examined how parameters such as network load, signal
strength and chunk size affect the performance of P2P communication services.
This kind of work on real-time networks will help the P2P application developers to
improve the efficiency of application, to meet the ever increasing user demands for
quality applications.
1.2 Thesis Objective
In this thesis, the authors investigate the performance of TCP and UDP for P2P
services on 3G networks by examining the Normalized Average Delay (NAD),
Throughput and data loss. The evaluation is done in terms of NAD, throughput and
data loss by varying different parameters including network load, chunk size, data

Performance Analysis of Peer-to-Peer communications on 3G Cellular Networks
Introduction 3
size and signal strength under different scenarios. Finally, we analyze how each of
these parameters influences the performance of P2P communication.
1.3 Research Methodology
In this thesis the authors will follow quantitative research methodology. An
experimental step up will be created for examining the performance of P2P
communications on 3G networks. Various experiments will be conducted by varying
different parameters including signal strength, network load, data size and chunk
size. Finally, the performance of TCP and UDP will be examined for P2P services.
This evaluation will be done in terms of three performance metrics including
throughput, NAD and data loss.

Performance Analysis of Peer-to-Peer communications on 3G Cellular Networks
Peer-to-peer communications 4
2. PEER-TO-PEER COMMUNICATIONS
Peer-to-peer is a communications in which each peer has the same capabilities and either
peer can initiate a communication session. One peer have responsibility for "serving" data
and other peer “consume” data or otherwise act as client of those server.
2.1 Significance and Emergence Several important communication services have emerged in recent years that use
decentralized architecture to concurrently connect millions of users worldwide. In
order to exchange digital audio, video, emails and other types of files.
These applications can be classified as P2P because there are no central servers to
mediate between and can be called as overlay networks because they form a
virtualized network over the existing physical network. P2P is gaining significance
because of ever growing popularity of mobile web environment.
Future P2P communication services should constantly enable new important
applications to incorporate with continuously changing technology trends.
The following are some of the changes in technology trends
Continuous improvement of smart phones and other broadband-enabled
mobile devices.
Continuous improvements of the consumer quality of experience and quality
of service.
The wide deployment of broadband wireless networks Worldwide
Interoperability for Microwave Access (WiMax), Wi-Fi (802.11n), Ultra-
wideband (UWB), Long Term Evolution (LTE)
Continuous growth of real time applications using multimedia systems such
as VOIP and videoconferencing.
The increasing use of personal area networks, body area networks, and
vehicle networks, to connect both real-time sensors and embedded
computing devices [3].
Due to the continuous changes or improvements in above mentioned trends, there is
always a scope to enable new applications in the future that use P2P technology.
The growth of P2P services over traditional client-server communication can be
mainly constituted to some of the P2P properties.
The first property is decentralization, in a centralized structure the whole system
could be ruined by a single point failure which is not the case in decentralized
system. The second property is Self-organizing, because of the fact that P2P

Performance Analysis of Peer-to-Peer communications on 3G Cellular Networks
Peer-to-peer communications 5
networks can manage all their work without the help of any centralized server. The
third property is cost, to maintain and run a traditional client-server model is far too
expensive than a P2P systems and there are some other properties too but these are
the most important properties for rapid growth of P2P systems [4].
Hence due to above mentioned properties and ever increasing demand for enabling
new applications for increasing consumer demands, P2P networks are becoming an
important component of the future vision and research topics [3].
2.2 Overlay Networks An overlay network is a virtual computer network built on top of one or more
existing networks. Mostly overlay networks are built on top of existing Internet
protocol (IP) Networks.
The nodes that participate in these networks can be thought of as being connected by
virtual or logical links and each of these links corresponds to a path with many
physical links in the underlying network. P2P networks, cloud computing and client-
server networks are some the examples of overlay networks.
Overlay networks are generally distributed systems in nature without any centralized
structure or control and hierarchical organization. The participating nodes or peers
form self-organizing overlay networks on the top of existing IP networks. Peers look
for some resources or data for sharing and once the resource is found, a session is
established between the holder of the resource and the requester [5] [6].
Figure 1: Overlay Network [7]
2.3 P2P Networks P2P networks are distributed systems that divide the work between the peers that are
connected in the network and each peer in the network has equal capabilities,
responsibilities and share equal privileges. P2P systems do not have central control

Performance Analysis of Peer-to-Peer communications on 3G Cellular Networks
Peer-to-peer communications 6
or hierarchical architecture. A peer makes a portion of their resource for instance
content and processing power available on the network and shares them directly with
other peers without any need of centralized server for controlling or monitoring.
In P2P systems, peers act as both clients and servers depending upon the situation,
and it is very difficult to distinguish between a server and client in P2P systems,
because they might have server and client relationship with other peers at the same
time. For example, in a file sharing system like bit torrent, a peer acts as a client by
getting some files from other peers and on the other hand it will also act as a server
because it shares that file with the other neighbouring peer at the same time [7]. The
Figure 2 shows a sample pure P2P network.
Figure 2: Sample P2P Network [7]
The research on P2P networks mainly focuses on making the P2P systems
independent of any centralized elements and also which are scalable, efficient in
bandwidth usage and load balancing. The latest research in P2P is to study the
possibilities and to optimize the usage of P2P techniques in mobile devices as much
as possible because in recent times it has been noticed that there is lot of increase in
mobile usage. Hence there is a need to utilize this change efficiently and to introduce
different and new features in P2P applications for the mobile environments than the
traditional applications which runs on desktop and laptop environments [5].
The traditional applications have been considered too heavy for mobile usage, high
bandwidth for working effectively. There are lot of P2P applications already
available for wireless or mobile devices but still there is a need for applications
which are very light and utilizes very less bandwidth and perform effectively in the
mobile telephone networks, hence, there is lot of research going on in P2P [5].
Performance Analysis of Peer-to-Peer communications on 3G Cellular Networks
Peer-to-peer communications 7
2.4 Key characteristics of P2P networks
Following are the key characteristics of P2P networks
2.4.1 Resource sharing
Each peer provides a part of its resource available on the network and shares it
directly with other connected peers without any centralized support. Due to this P2P
systems are gaining popularity rapidly.
2.4.2 Symmetry
All peers are interconnected with each other to form a P2P network and each peer in
this network has equal capabilities, responsibilities and share equal roles for
successful operation of the network. In recent times, this characteristic is relaxed by
using some special peer which has some greater responsibilities like super peer or
relay peer.
2.4.3 Autonomy
Participation of the peers in the P2P network is determined locally, and there is no
single administrative context for the P2P network. Peers can join or leave the
network any time.
2.4.4 Self-Organization
P2P systems are self-organizing because all the nodes recognize and create relatively
stable connections with other nodes. They manage all their work without the help of
any centralized server.
2.4.5 Scalability
Scalability is another important characteristic of P2P network because these
networks typically consist of large number of heterogeneous, distributed and
dynamic nodes. These kind of large scale networks present many challenges, for
instance it is very difficult to know when exactly a peer joins or leave the network
continuously. Sophisticated mechanisms are needed to perform effective queries and
stabilizations, which uphold the integrity of these networks [3].
2.4.6 Stability
There is always chance of network failures in P2P networks because the peers joins
and leaves the network continuously therefore P2P network must be stable and
maintain its connectivity in all times.

Performance Analysis of Peer-to-Peer communications on 3G Cellular Networks
Peer-to-peer communications 8
2.4.7 Decentralization
Most of the P2P networks are decentralized in nature because they do not have any
centralized control and all the participating peers have equal capabilities,
responsibilities and share equal privileges [3].
2.5 Classification of P2P Networks
The first ever server based P2P application developed was Napster and after the
inception of Napster, the internet underwent nothing short of revolution [7]. After
many years of research and development, the P2P networks have evolved to the
current form as it exists today to meet the purposes, needs of various users and
organizations.
At present P2P networks are very large in number and each of them has different
properties that make it difficult to classify these networks using a unique criterion. In
order to understand the existing P2P networks well, we can classify them based on
some criterion, i.e. appeared time and purpose, degree of centralization and topology
[7] [9] [10].
2.5.1 Classification based on appeared time and purpose
From the time file sharing concept has been invented till today, P2P networks have
underwent many changes to meet the purposes, needs of various users and
organizations.
We can classify the existing P2P networks into three generations according to
appeared time and purpose [10].
1) First generation P2P
2) Second generation P2P
3) Third generation P2P
2.5.1.1 First Generation P2P networks
The first generation P2P networks were client-servers. There is a centralized server
which is the provider of content and services, and the clients request for content or
services from the server.
The first generation P2P systems are again divided in to two types centralized and
decentralized.

Performance Analysis of Peer-to-Peer communications on 3G Cellular Networks
Peer-to-peer communications 9
In centralized networks, servers provide the necessary content or services and clients
requests for the required content or service. A centralized server stores the index
resource of all the required data and if any clients (peers) send search request to the
server for the desired data than the server responds to the client by sending the
address location of the data. Finally clients directly connect to the peer which holds
the desired data. Generally centralized systems are too simple, but have bad
scalability and low query efficiency. Napster is the typical example for this kind of
systems [10] [7]. Figure 3 is an example of centralized network.
Figure 3: Centralized Network [7]
Decentralized networks are those that do not have any central server to control or
manage peers. All peers have equal responsibilities and capabilities. Communication
between the peers is symmetric as there is no central index server where the metadata
of data is stored. This metadata is stored locally among all peers. In contrast to a
client-server network, it is difficult to distinguish between a content requestor (client)
and a content provider (server), because a peer acts as both client and server at the
same time. Figure 4 is a typical example of decentralized network.
In this type of systems, search of desired data is done by broadcasting mechanism. A
peer sends a request to the neighboring peer for some data item and when neighbor
peer receives the request, it tries to search for that item locally. If the requested data
item is not present then the request is forwarded to another peer. The report of failure
or success of desired data is sent back to the requested peer on the same path of
incoming request. Such kinds of systems have many advantages because there is no
longer a single point of failure. These networks have better scalability, anonymity
Peer
Peer
Peer
Peer
Peer
Peer
Peer
Central serverPeer

Performance Analysis of Peer-to-Peer communications on 3G Cellular Networks
Peer-to-peer communications 10
and better fault tolerance. Gnutella 0.4 and Freenet are typical examples of such kind
of systems [10] [7] [11].
Figure 4: Decentralized Network [7]
2.5.1.2 Second generation P2P networks
The second generation P2P networks have no central index server and try to solve
the non-determinism problem of resource location. The idea is that if there is any
specific resource available on the network, then it should be found and to achieve it,
these networks should start following some tightly controlled structured node
groupings like Mesh, Ring, d-dimension Torus, K-ary tree, SkipList. Nodes are
arranged in a structured fashion, following tree or ring formations. Content or
resources are placed not at random nodes but at a specified node location. The
objective of storing content at some particular specified node location is to help a
node which is looking for a resource, at that particular time. This node must be
redirected to the node which is supposed to hold it.
These kind of networks usually have better scalability and query efficiency, and
provide load balancing and deterministic search guarantees because they utilize the
distributed hash table (DHT) technique. On the other hand, they are not so fault-
tolerant and resilient.
The main challenges of second generation networks are, Distribution of
responsibilities evenly among the existing peers to avoid bottlenecks in particular
nodes and quickly adapting to nodes joining or leaving [11] [7] [9].
Performance Analysis of Peer-to-Peer communications on 3G Cellular Networks
Peer-to-peer communications 11
2.5.1.3 Third generation P2P networks
Third generation P2P utilized hybrid network architecture to provide networks with
high resilience and search capabilities. The first generation centralized P2P networks
had many problems including bad scalability and low query efficiency. These
problems were solved by the second generation P2P systems with decentralized
architecture. As there is no central server in second generation systems which
always introduced new issues for instance traffic generated in the network due to the
lookup process which is done in a broadcast manner.
The third generation P2P networks have solved these issues in an admirable manner
by using super peers that have more functionalities than the ordinary peer same as
the server functionalities in the centralized P2P network. The super peer acts as a
gateway to the P2P network for group of peers connected to that super peer [5] [7].
2.5.2 Classification based on degree of centralization
P2P networks can be broadly classified in to the following three types based on the
degree of centralization are
Pure P2P
Hybrid P2P
Mixed P2P
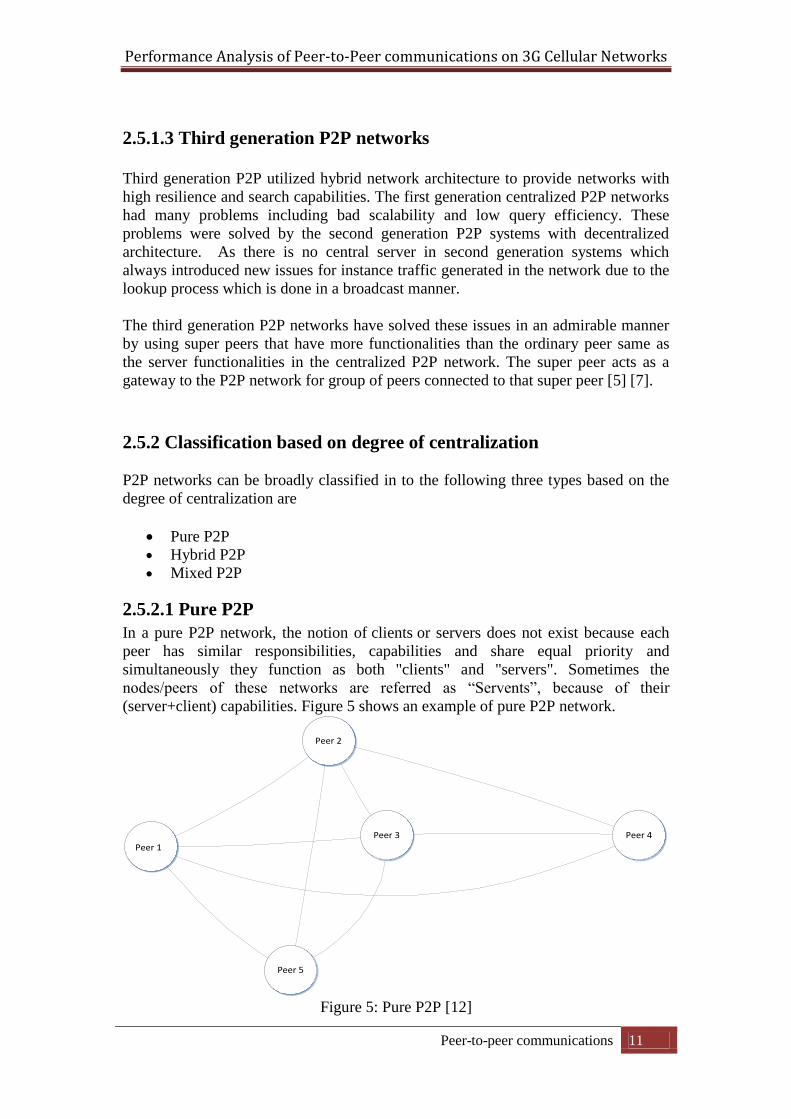
2.5.2.1 Pure P2P
In a pure P2P network, the notion of clients or servers does not exist because each
peer has similar responsibilities, capabilities and share equal priority and
simultaneously they function as both "clients" and "servers". Sometimes the
nodes/peers of these networks are referred as “Servents”, because of their
(server+client) capabilities. Figure 5 shows an example of pure P2P network.
Peer 4Peer 3
Peer 5
Peer 1
Peer 2
Figure 5: Pure P2P [12]

Performance Analysis of Peer-to-Peer communications on 3G Cellular Networks
Peer-to-peer communications 12
2.5.2.2 Hybrid P2P
These networks are also known as hybrid decentralized networks. Hybrid P2P
networks have a single central server, but not as the general purpose servers as used
in the case of client-server model. In these networks, servers keep track of the entire
information in the network. Peers make use of the servers for searching and
identifying the nodes/peers that hold some data or resource.
Servers stores the entire resource index of all the required data and if any peer send
search request of the desired data than the server responds to the client by sending
the address location of the data. Thereby, the peer establishes direct interaction with
another peer which holds the data. Figure 6 shows an example of hybrid P2P
network.
Peer 2
Peer 1
Peer 5
Peer 3
Peer 4
Central server
Figure 6: Hybrid P2P [12]
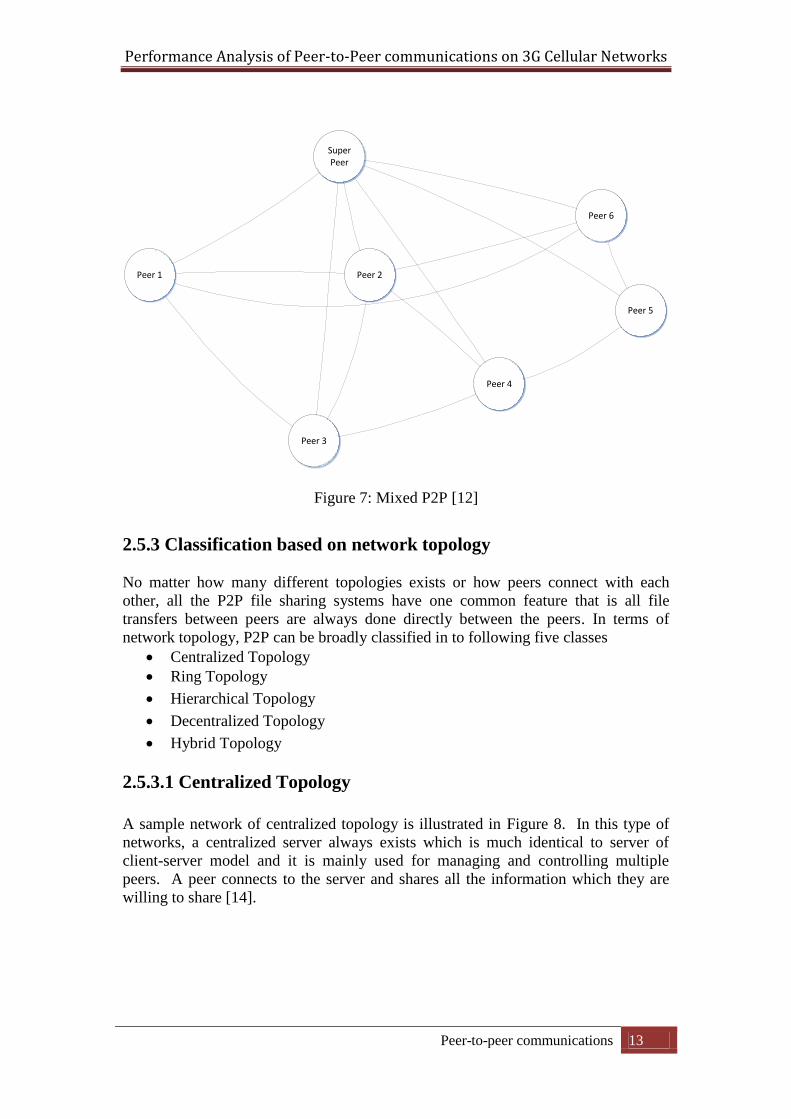
2.5.2.3 Mixed P2P
Mixed P2P network stands between pure P2P and hybrid networks which can be
clearly seen from the Figure 7. These are also known as partially centralized
networks. Some nodes or peers in this kind of networks are given super powers by
assigning some responsibilities like maintaining central index of resource files and
helping and managing peers. The peers with some super powers can be referred as
super nodes or super peers [12] [13].
Performance Analysis of Peer-to-Peer communications on 3G Cellular Networks
Peer-to-peer communications 13
Peer 1
Super Peer
Peer 6
Peer 2
Peer 3
Peer 4
Peer 5
Figure 7: Mixed P2P [12]
2.5.3 Classification based on network topology
No matter how many different topologies exists or how peers connect with each
other, all the P2P file sharing systems have one common feature that is all file
transfers between peers are always done directly between the peers. In terms of
network topology, P2P can be broadly classified in to following five classes
Centralized Topology
Ring Topology
Hierarchical Topology
Decentralized Topology
Hybrid Topology
2.5.3.1 Centralized Topology
A sample network of centralized topology is illustrated in Figure 8. In this type of
networks, a centralized server always exists which is much identical to server of
client-server model and it is mainly used for managing and controlling multiple
peers. A peer connects to the server and shares all the information which they are
willing to share [14].

Performance Analysis of Peer-to-Peer communications on 3G Cellular Networks
Peer-to-peer communications 14
Peer 1
Peer 3
Peer 2
Peer 7
Peer 5
Peer 4
Peer 6
Figure 8: Centralized topology [14]
2.5.3.2 Ring Topology
A sample network of centralized topology is illustrated in Figure 9. In this type of
networks, a centralized server always exists which is much identical to server of
client-server model and it is mainly used for managing and controlling multiple
peers. A peer connects to the server and shares all the information which they are
willing to share [14].
Peer 1
Peer 3Peer 2
Peer 5
Peer 4 Peer 6
Figure 9: Ring Topology [14]

Performance Analysis of Peer-to-Peer communications on 3G Cellular Networks
Peer-to-peer communications 15
2.5.3.3 Hierarchical Topology
Some of the best known examples for hierarchical model are Domain Name System
(DNS) and Certification Authorities (CAs). This topology is appropriate for systems
that require some governance or control and it can also be implemented in the
systems that require higher scalability. The Figure 10 illustrates an example of
hierarchical topology [14].
Peer 8
Peer 1
Peer 3 Peer 7Peer 5 Peer 6Peer 4
Peer 2
Figure 10: Hierarchical Topology [14]
2.5.3.4 Decentralized Topology
This topology follows a pure P2P architecture without any central server. All peers
share the responsibilities among each other and have equal capabilities. Peers acts as
both clients and servers at the same time. Figure 11 shows an example of
decentralized topology

Performance Analysis of Peer-to-Peer communications on 3G Cellular Networks
Peer-to-peer communications 16
Peer
Peer
Peer
Peer
Peer
Peer
Peer
Peer
Peer Peer
Peer
Figure 11: Decentralized topology [14]
2.5.3.5 Hybrid Topology
There were some problems with the centralized and decentralized network
topologies, to overcome those problems hybrid along with hierarchical topologies are
evolved and recently have been used by many popular P2P applications for better
scalability performance.
There are several topologies in which hybrid technologies can be divided but some
basic topologies of hybrid topologies are
Centralized and Ring Topology
The best example of hybrid topologies are web server applications which are heavily
loaded and to balance the load on the web servers they are arranged in the form of
ring structure and then the clients are connected to the ring of servers [14]. Figure 12
shows the example of centralized and ring topology

Performance Analysis of Peer-to-Peer communications on 3G Cellular Networks
Peer-to-peer communications 17
Peer Peer
Peer
Peer Peer
Peer
Peer
Peer
Peer Peer Peer
Figure 12: Centralized and ring topology [14]
Centralized and Centralized Topology
An example of centralized and centralized topology is shown in Figure 13, where the
server itself acts as a client for some bigger network. A simple example that can
illustrate this point is, when a web browser contacts a web server. Then that server
might contact other servers (database servers) to obtain necessary information to
process and show the results in HTML format [14].
Peer
Peer
Peer Peer
Peer Peer Peer
Figure 13: Centralized and centralized topology [14]

Performance Analysis of Peer-to-Peer communications on 3G Cellular Networks
Peer-to-peer communications 18
Centralized and Decentralized Topology
There are some peers which acts as a super node. The super node acts as a
centralized server for subset of peers which are connected to it. And the super node
itself is connected to another super node in a decentralized manner. The best
examples for such kind of topologies are Kazaa and FastTrack [14]. Figure 14 shows
a sample of centralized and decentralized Topology.
Peer
Peer
Peer
Peer Peer
Peer
Peer
Figure 14: Centralized and decentralized topology [14]
2.6 Mobile P2P
The mobile P2P networks are generally formed by mobile devices such as mobile
phones, laptop‟s and PDA‟s which are capable of ad-hoc communications. With the
integration of wireless communication technologies like Bluetooth, IEEE 802.11b
Wi-Fi into such mobile devices made the current mobile P2P networks feasible. At
present the number of mobile users. With such kind of technologies represent a small
percentage but in near future as the capabilities and network bandwidth increases the
population of users of such devices will increase [3] [15].
The four important challenges for the mobile devices which affect their interaction
with the P2P networks when compared with the conventional desktop computers are
roaming, energy limitations, node heterogeneity and multi-homed interfaces. If these
challenges are handled effectively, mobile P2P networks become more feasible and
usage of such kind of devices will rapidly increase [3]. As the demands for mobile
devices with ad-hoc communication capabilities are increasing constantly, it has
made mobile ad hoc networks (MANET‟s) a hot topic for research.

Performance Analysis of Peer-to-Peer communications on 3G Cellular Networks
Peer-to-peer communications 19
MANET‟s consist of mobile nodes communicating with each other through multi-
hop wireless radio links. P2P and MANET networks share some fundamental
features such as decentralized architectures, self-organization and dynamic
topologies. The nodes in both networks can serve multiple purposes, for instance
they can act as both routers and hosts. P2P file sharing over MANET‟s and P2P
information sharing on MANET‟s has gained momentum in the research of recent
years due to the tremendous popularity of both P2P and MANET‟s. [16]

Performance Analysis of Peer-to-Peer communications on 3G Cellular Networks
Overview of Cellular Networks 20
3. OVERVIEW OF CELLULAR NETWORKS
3.1 Introduction
Mobile networks are differentiated from each other by the word generation such as
first-generation (1G), second-generation (2G), third-generation (3G), fourth-
generation (4G) and Future-generation. This is quite suitable because there is a big
generation gap between the technologies.
The 1G mobile communication systems were analog systems, which came in the
early 80‟s. These networks are also known as the Nordic Mobile Telephone (NMT).
These systems supported only speech and related services. The main drawback of
these systems was the limited services offered and incompatibility with
contemporary systems of other countries.
Different standards were used in different countries. These standards include NMT
used in Nordic countries (Sweden, Iceland, Denmark, Norway and Finland), Total
Access Communication System (TACS) used in United Kingdom and Advanced
Mobile Phone System (AMPS) used in the United States. There was radio telephone
system even before this [21].
The increasing demands for mobile communication systems need more
compatibility, resulted in the birth of the second generation mobile systems. But
again none of the standards in the 2G were able to fulfill the globalization dream of
the standardization bodies. This would be fulfilled by the third-generation mobile
systems. It is expected that these 3G systems will be mainly oriented towards data
traffic, compared the 2G networks that were carrying mainly voice traffic.
4G is an extension of the 3G technology that provides a completely packet switched
network with all digital network elements and high available bandwidth. For the
most part, it is believed that 4G will get true multimedia capabilities such as high
quality audio/video streaming over end-to-end Internet Protocol. 4G is the future
technology that is mostly in their maturity period (Research period) [22].
International Telecommunication Union (ITU), Alliance of radio Industries and
Business (ARIB), European Telecommunications standards and institute (ETSI),
Third Generation Partnership Project (3GPP) and American National Standards
Institute (ANSI) are the standard bodies that have been playing an important role in
defining the specifications for the mobile systems.

Performance Analysis of Peer-to-Peer communications on 3G Cellular Networks
Overview of Cellular Networks 21
The different generations are discussed in the following sections
3.2 First generation radio systems 1G refers to the wireless telecommunication technology first generation, more
commonly known as cell phones. In 1980's a set of wireless standards were
developed to replace the 0G technology by 1G which in turn changed the impression
of two way mobile communication. Technologies such as Improved Mobile
Telephone Service (IMTS), Advanced Mobile Telephone System (AMTS), Mobile
Telephone System (MTS), and Push to Talk (PTT).
Unlike its successor 2G, that use digital signals, 1G uses analog radio signals in
network. Through 1G, the voice calls get modulated up to 150MHz and above as it is
transmitted between radio towers. . This is done by using so-called frequency
division multiple access (FDMA).
1G is not favorable to its successors in terms of connection quality. It has poor voice
link, no reliability in handoff, low capacity and no security. 1G have some
advantages over 2G, digital signals of 2G are very dependent on location when
compared with analog signal of 1G. When call made from 1G handset generally
quality is poor when compared to 2G handset but 1G covers longer distance than 2G.
While call made from a 2G handset would terminates in the middle or completely
drops before reaching the destination [21] [22] [23].
3.3 Second generation radio systems
Few significant changes made the shift from 1G to 2G. First, unlike 1G cellular
network which was used for analog communication, the 2G networks were used for
digital communication in both radio and between network entities. Second, 1G
standards were supported with-in national boundaries whereas 2G standards are
supported by global roaming services in large regions beyond national boundaries.
The 2G mobile communication systems were digital system that came in the early
90s. The wireless systems including Global Systems for Mobile Communications
(GSM), Time Division Multiple Access (TDMA, TDMA IS-136), Code Division
Multiple Access (CDMA, CDMA IS-95), Personal Digital Cellular (PDC) and
Personal Handy Phone System (PHS) can be considered as 2G systems [21] [24]
[22].
3.3.1 Code division multiple access (CDMA)
CDMA is a form of multiplexing not a modulation scheme. It was developed by
Qualcomm originally known as interim standard (IS-95) of the Telecommunications
Industry Association (TIA). CDMA offers several advantages such as improved
security system, improved quality, increase in capacity (around 10 times that of the
AMPS), improved coverage and anti-jamming capabilities. IS-95B was the
enhancement of IS-95. The advantage of IS-95B includes frequency diversity, which

Performance Analysis of Peer-to-Peer communications on 3G Cellular Networks
Overview of Cellular Networks 22
is the signal has less effect of frequency dependent transmission and increased
privacy [21] [25]. The Protocol architecture of IS-95 is shown in Figure 15.
Figure 15: Protocol architecture of IS-95 (CDMA One) Standard [26]
3.3.2 Global system for mobile communications (GSM)
GSM standard was first commercially launched on 2G cellular networks by
Radiolinja in 1991 (Finland). Due to features such as prepaid calling and
international roaming. GSM is widely implemented and is popular cellular system
with around two billion users by 2005. Apart from just making calls GSM also
provided the services such as short message service (SMS), call waiting, call
forwarding which enhanced the popularity of this system. This led to the
development of new handsets with more features like smaller, thinner and lighter
handsets.
The GSM systems have been an advantage to both consumers and network operators
as they provide better voice quality compared to 1G systems and low cost of text
messaging alternatives of calls. Network operators have ability to choose equipment
from different vendors. GSM cellular networks operate on different frequencies
depending on the system used by service provider. In US and Canada, 850MHz and
/or 1900MHz and in Europe 900 MHz and 1800 MHz [21].
3.3.3 General Packet Radio Service (GPRS)
GPRS is a (data) service added to the GSM networks. GPRS is a cellular service that
supports Wireless Application Protocol (WAP), SMS text messaging, Multimedia
Messaging Services (MMS), and other data communications. It is also called as

Performance Analysis of Peer-to-Peer communications on 3G Cellular Networks
Overview of Cellular Networks 23
2.5G. GPRS increases the communication speed up to 115 kbps a vast improvement
over the 2G standard speed of 9.6 kbps. GPRS was integrated into GSM standards
from 97.
Before introducing GPRS, the available radio capacity was used for both voice traffic
and data traffic within the GSM network in a rather inefficient way. For data
transmission the entire channel was reserved. In Circuit Switched Data (CSD), a data
connection establishes a circuit and occupies the full bandwidth of that circuit during
the lifetime of the connection. GPRS is quite different from the CSD connection
included in the GMS standards. GPRS data traffic uses packet switching while voice
traffic uses circuit switching. GPRS works on packet switched which means same
transmission channel can be shared by multiple users. GPRS enables the resources to
be used only when the user actually sending and receiving the data. The amount of
data transfer depends on the number of active users [21].
3.3.4 Enhanced Data Rate for GSM Evolution (EDGE)
EDGE technology is an extension of two existing services named High Speed Circuit
Switched Data (HSCSD) and GPRS. It works in TDMA and GSM networks. EDGE
is preferred for GSM networks due to its circuit and packet–switched services.
Enhanced Genera Packet Radio Service (EGPRS) is packet–oriented and Enhanced
Circuit Switched data (ECSD) is circuit–oriented. EDGE was introduced to the ESTI
for the first time in 1997 for the evolution of GSM. EDGE reaches very high raw bit
rates of up to 69kbps per physical channel by applying modified modulation and
coding schemes. The theoretical maximum raw bit rate rises to 554kbs, if a user
utilizes all 8 time slots in parallel. The maximum bearer bit rate achievable rises to
about 384kbs. The architecture of the GSM for EDGE is same only modification was
at the air interface to support higher data rates. 8-Phase-Shifit-Keying (8-PSK) is
modulation technique to support higher data rates, which in turn supports bandwidth
extensive data applications [21] [27].
3.4 Third generation radio systems 3G is the third generation mobile network technology and it was developed with the
plan of offering high speed data and multimedia connectivity to subscribers. It is
based on the International Telecommunication Union (ITU) under the initiative of
International Mobile Telecommunications (IMT). Evolution of 2G to 3G cellular
networks is shown in Figure 16.

Performance Analysis of Peer-to-Peer communications on 3G Cellular Networks
Overview of Cellular Networks 24
Figure 16: Evolution of 2G to 3G cellular networks [28]
3.4.1 CDMA 2000
CDMA 2000 is compatible with IS-95 systems and it has many variants such as 1x,
1xEV-DO, 3x and 1xEV-DV. Among these 1xEV specification was developed by
the Third Generation Partnership Project 2 (3GPP2). Alliance of Radio Industries
and Business (ARIB) and Telecommunication Technology Committee (TTC) in Japan,
china Wireless Telecommunication Standard group (CWTS) in China and
Telecommunications Technology Association (TTA) in Korea and Telecommunications
Industry Association (TIA) in North America are five telecommunications
standardization bodies in 3GPP2.
CDMA 2000 provides many advantages such as higher voice quality, improved
security, spectrum efficiency, differentiated value-added service (VAS), high
throughput and flexibility in architecture. By using selectable mode vocoders and
various antenna diversity schemes, this technology offers voice capacity that is
almost three times that of CDMA (IS-95). At 64kbps to 144kbps, CDMA2000
delivers low data rate services. For all environments 144bps would be possible while
indoors environment, 2Mbps would be possible. CDMA2000 EV-DV (CDMA2000
evolution data/voice) is able to carry data rates up to 3.1Mbps on the forwarded link
and 1.8mbps on the reverse link. DV is preferred by operators because it does not
require an overlay. CDMA2000 has less support when compared with 3GPPP
scheme but it will be an important technology where IS-95 networks are used. 3G

Performance Analysis of Peer-to-Peer communications on 3G Cellular Networks
Overview of Cellular Networks 25
network in the United States uses 2G spectrum in many cases and thus CDMA2000
is an attractive technology choice as it can coexist with IS-95 systems [30] [29] [21].
3.4.2 Universal Mobile Telecommunications System (UMTS) The UMTS is one of the 3G technologies and it uses Wideband Code Division
Multiple Access (WCDMA) as the Access scheme. Nippon Telegraph and Telephone
(NTT) DocoMo developed WCDMA as air interface for their 3G network FOMA.
Later, the specification was submitted to the ITU as a member for the international
3G standard as IMT-2000. Finally, ITU accepted WCDMA as part of IMT2000
family of 3G network. It is used as air interface for UMTS. The bandwidth of a
WCDMA system is 5MHz or more and this 5 MHz is also the nominal bandwidth of
all 3G WCDMA proposals.
WCDMA air interface can be made into two groups such as network asynchronous
and network synchronous. All base stations in synchronous network are time
synchronized to each other. More expensive hardware is required in base station of
synchronous network but it provides more efficient air interface. For example, it
could be possible to achieve synchronization with the use of Global Positioning
System (GPS) receivers but it may fail in high-block city centers or indoors.
WCDMA contains fast power control in both downlink and uplink. Further using
variable spreading, it provides the ability to vary bit rate and service parameter on a
frame-by-frame basis [29] [21].
3.4.2.1 UMTS Network Architecture
The UMTS network architecture consists of User Equipment (UE), Universal
Terrestrial Radio Access Network (UTRAN) and Core Network (CN) as depicted in
Figure17.

Performance Analysis of Peer-to-Peer communications on 3G Cellular Networks
Overview of Cellular Networks 26
Figure 17: Network Architecture [26]
UE is the name given to a mobile terminal within a UMTS network. This enables
subscriber to access UMTS services through the radio interface „Uu‟.
UTRAN connects the UE to CN and enables cell level motilities and it has many
radio network subsystems (RNS), call handover control, call handover control and
radio resource management are some of the main functions perform by RNS.
There are two modes of operation of Universal Terrestrial Radio Access (UTRA)
systems UTRA-FDD and UTRA-TDD which are compatible with UTRA system.
FDD mode of the UTRA technology makes use of WCDMA, up/down links using
separate frequencies. Approximately 250 channels are provided by FDD mode for
handling different user‟s traffic. Direct sequence spread spectrum (DSSS) coding is
used achieving a maximum data rate of 2Mbits/sec.
TDMA/CDMA is used for UTRA-TDD and both up and down links use same
frequency. Approximately 120 channels can be provided by TDD mode for handling
different user‟s traffic. DSSS coding is used and maximum data rate of 2Mbits/sec
can be achieved. UTRA-TDD uses QPSK modulation scheme.
The CN is central part of telecommunication network which manages the services
such as establishment, termination and modification of UE authentication
interconnection with external world for each UMTS subscriber [30].

Performance Analysis of Peer-to-Peer communications on 3G Cellular Networks
Overview of Cellular Networks 27
Air interface protocol structure of WCDMA (UMTS) is shown in Figure 18.
Figure 18: Air interface protocol structure of WCDMA (UMTS) [26]

Performance Analysis of Peer-to-Peer communications on 3G Cellular Networks
Experimental setup 28
4. EXPERIMENTAL SETUP
The objective of this thesis is to investigate the characteristics of data transmission
for P2P communication services on 3G networks considering performance metrics
such as normalized average delay, throughput and data loss. To achieve this, it is
necessary to develop a P2P model using which various experiments could be
conducted under different scenarios.
This chapter is divided into three sections; first section discusses the basic approach
of experimental setup. The next section discusses architecture and development of
P2P model and the final section discusses experimental configuration and analysis
procedure.
4.1 The Basic Approach
The main goal of this thesis work is to evaluate performance of P2P communications
on 3G networks and in order to achieve this, a P2P model should be developed which
supports data transmission between two peers.
Peer A Peer B
Internet
Figure 19: Basic P2P model
Figure 19 shows a basic P2P model in which two peers connect and communicate
with each other via Internet. This was the basic model which was initially thought
but our P2P model should exhibit some important prerequisites which are discussed
below

Performance Analysis of Peer-to-Peer communications on 3G Cellular Networks
Experimental setup 29
The main prerequisites for our P2P model are:
Two peers should be capable of transmitting data, for example in Figure 19, if
“peer A” sends the data then “peer B” should receive it successfully and vice
versa. In this type of communication peers act as “servents” (both server and
clients simultaneously [17].
The peers should be able to communicate and transmit data regardless of
network they use to connect to Internet. As we are analysing the performance
of data services on 3G networks, the P2P application should have the
capabilities of transferring data on 3G network.
In order to meet the above requirements, we followed hybrid P2P model for the
experiments. It consists of two peers and one linking server. The main reason for
using hybrid P2P model is to avoid private IP problems.P2P communication is not
possible through Internet if both peers have private IP‟s.
Two way communication
Central Server
Internet
Modem
Peer A Peer B
Figure 20: Hybrid P2P model
Figure 20 illustrates the hybrid P2P model used for our experiments. It consists of
two peers and one linking server. In this model, the linking server acts as a mediator
for helping peers to connect with each other without requiring the public IP addresses
for peers. Initially „peer A‟ connects to server via internet and provides necessary
information about itself and then the other „peer B‟ connects to the server via
3G/UMTS internet services provided by the mobile operator through the modem.
Once the connection is established between the peers, they can exchange any type of

Performance Analysis of Peer-to-Peer communications on 3G Cellular Networks
Experimental setup 30
data between each other. The modem used for our experimental purpose is “Telit
GT846-3G terminal”.
4.2 The architecture and development of hybrid P2P model The P2P model discussed in section 4.1 has been developed using windows sockets
programming.
4.2.1 Socket Communication/ programming
Socket programming is an application (higher level) layer programming and it is
generally implemented by using socket application programming interfaces (API‟s).
Sockets API acts like an interface between application layer and transport layer.
Alternatively, socket Apps act as a door between application layer and transport layer
which can be accessed by using only specific IP address and port number. Figure 21
shows OSI model for Socket API‟s
Application Layer
Socket API
Transport Layer
Network Layer
Data link Layer
Physical Layer
Figure 21: OSI model for Socket API‟s [20]
Socket is a kind of data structure provided by operating system, it provides access
between the processes for sending and receiving messages in the absence of
correlation between them. Sockets allow communication between two different
processes on the same or different devices as can be seen in Figure 22. Generally a
socket can be treated as an endpoint in a network communication just as a fax
machine is the endpoint for a fax communication [18] [19] [20].
In pure UNIX terms, a socket is just like a file descriptor. In UNIX, any kind of I/O
operation is done by reading or writing to a file descriptor. A file descriptor is simply
an integer associated with an open file and that file can be a network connection, a
first in first out (FIFO), a pipe or a terminal. Additionally the communication

Performance Analysis of Peer-to-Peer communications on 3G Cellular Networks
Experimental setup 31
between two different processes over the Internet it is also done by using file
descriptor [18] [19] [20]. The file descriptor for network communication can be
simply used by calling system routine “socket ()”, it returns a socket descriptor
through which communication over network is possible by using some of the
specialized functions. Some of these library functions are given in the Table 1.
There are mainly two types of Internet sockets for communication namely
connection-oriented socket and connectionless-socket [19] [20].
Process A
Ports (Sockets)
Network
Process B
Figure 22: Schematic diagram showing communication between two processes [20]
Table 1: Shows the library functions of socket
Function Name Description
Socket () Creates a socket
Bind () Binds the socket to the local address and it is optional for initiator
Listen () Alerts the TCP/IP machines with the incoming client connection
requests and specifies the maximum number of connection requests
that can be pending
Connect () connects socket to a foreign host
Accept () Establish the connection with a specific client
Send (), recv () Write and read data on sockets until all data has been exchanged Close () Closes the socket and releases kernel data structure
4.2.2 Basic architecture and development of connection-oriented
sockets
Connection-oriented sockets generally uses TCP protocol and in this type of service
a connection should be established between the two peers before the actual data
exchange starts and the connection will be released once the data transmission is
complete. Connection-oriented data transmission takes place in the following three
steps. (1) establishment of connection (2) data transmission (3) releasing the
connection [18] [19]. Figure 23 illustrates architecture of basic TCP stream socket
session.
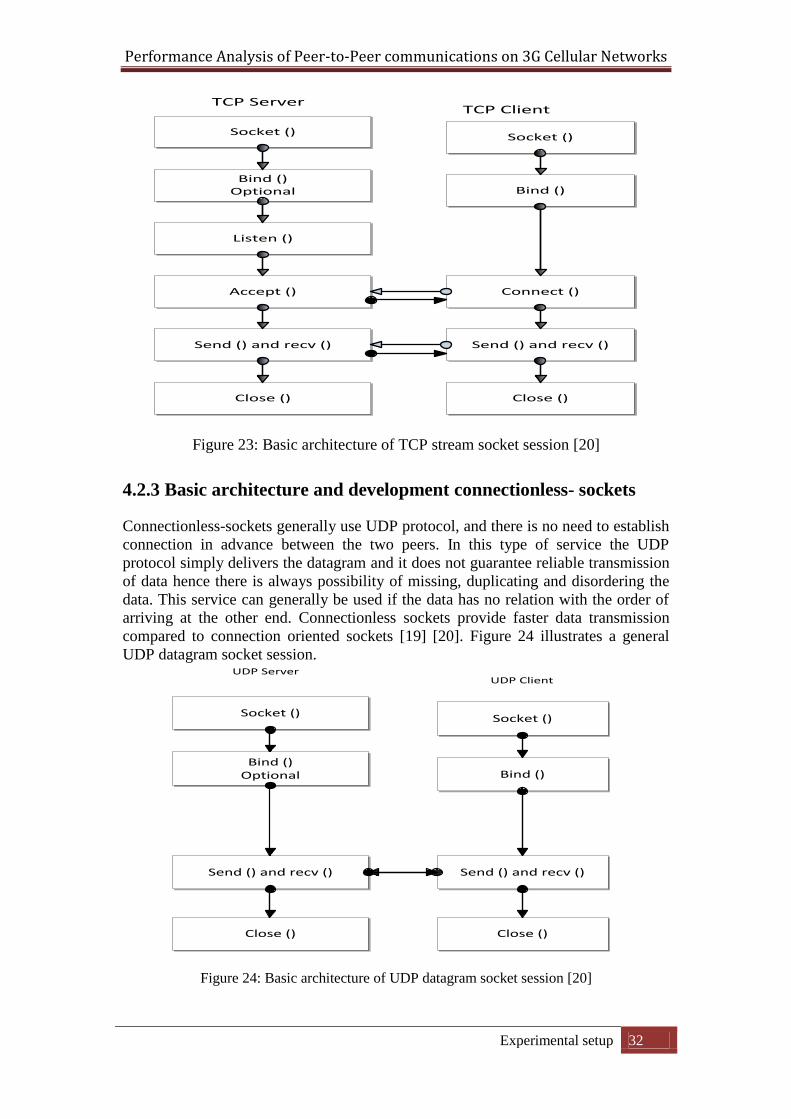
Performance Analysis of Peer-to-Peer communications on 3G Cellular Networks
Experimental setup 32
Socket ()
Bind ()Optional
Listen ()
Send () and recv ()
Accept ()
Close ()
Socket ()
Bind ()
Connect ()
Close ()
Send () and recv ()
TCP ServerTCP Client
Figure 23: Basic architecture of TCP stream socket session [20]
4.2.3 Basic architecture and development connectionless- sockets
Connectionless-sockets generally use UDP protocol, and there is no need to establish
connection in advance between the two peers. In this type of service the UDP
protocol simply delivers the datagram and it does not guarantee reliable transmission
of data hence there is always possibility of missing, duplicating and disordering the
data. This service can generally be used if the data has no relation with the order of
arriving at the other end. Connectionless sockets provide faster data transmission
compared to connection oriented sockets [19] [20]. Figure 24 illustrates a general
UDP datagram socket session.
Socket ()
Bind ()Optional
Send () and recv ()
Close ()
Socket ()
Bind ()
Close ()
Send () and recv ()
UDP ServerUDP Client
Figure 24: Basic architecture of UDP datagram socket session [20]

Performance Analysis of Peer-to-Peer communications on 3G Cellular Networks
Experimental setup 33
In connectionless service, some of the socket function calls such as accept (), listen ()
and connect () are not used because it does not require any advance connection
establishment between the peers.
The above mentioned basic architectures of connection-oriented and connectionless
services have been implemented using socket programming to develop P2P model
for both type of services for our experiments.
4.3 Connection establishment between peers and data
transmission
We developed separate applications for peers and the linking server according to our
experimental need. The establishment of connection between the peers is done as
fallows. First, run the server application on the linking server. At least one of the
peers has to know ID of another to make a connection. Run the peer (peer A)
application from one system to connect the server. When peer connects to the server
and waits for another peer to connect. Server stores the peer ID (peer name) in its
database to wait for another peer. Repeat the same for the other peer (peer B) from
different system with another peer name. When server receives the connection
request form second peer it establishes the connection between these two peers. Once
the connection is established both peers are ready to exchange the data between
them. Refer to appendix A and appendix B for further details.
4.4 Experiment configuration and analysis procedure
In the following we will discuss the experimental configurations and parameters
signal strength, network load and chunk size.
4.4.1 Experimental configuration
In the following we will discussed the experimental setup used in our work which is
also shown in Figure 20. The entire experimentation is done in Blekinge Institute of
Technology (BTH, one peer) Karlskrona campus network and as the complete
analysis is done over 3G networks(other peer), a modem (GT846-3G terminal) with
Telenor mobile operator has been used.
To analyze the performance of P2P communication over 3G networks, ten different
data sizes are transferred from „peer A‟ to „peer B‟ under different conditions. The
data sizes used for the experiment are 512 bytes, 1 kilo byte (KB), 50 KB, 100KB,
300KB, 600KB, 800KB, 1 megabyte (MB), 5MBand 10 MB. Each of this data size is
transferred for 20 times and finally, average of them is taken for analysis and the
different parameters while transferring data of one of these sizes are signal strength,
network load and chunk size.

Performance Analysis of Peer-to-Peer communications on 3G Cellular Networks
Experimental setup 34
Signal strengths:
Signal strength is one of the important parameters and we are categorized it into as
strong and weak signal for our experiments. The signal strength of modem is
represented by received signal quality indicator (RSSI) whose range is from 0 to 31.
Each RSSI value is associated with a value in dBm for example, RSSI=0 means the
modem has signal strength of -113 dBm or less which is lowest signal level. We
categorized weak signal for RSSI value between 0-6 and strong signal for RSSI≥ 23.
Network load:
To analyze the effect of network load on performance, we categorized network load
as peaks hours and non-peak hours. Peak hours mean the day time between 14:00 to
18:00 hours with high traffic load on network and non-peak hours mean that the
experimentation should be conducted during night time between 2:00 to 6:00 hours
when low traffic is expected on network.
Chunk size: Chunk size is the amount of data transferred from „peer A‟ to „peer B‟ each time
during transmission. For example, if „1mb‟ data is transferred from „peer A‟ to „peer
B‟ and the selected chunk size is 1024 bytes, this means that 1MB data will be
transferred in chunks of the size1024 bytes each time from „peer A‟ to „peer B‟. To
examine the effect of different chunk sizes, three different chunk sizes have been
used for the experiments and they are 512, 768 and 1024.
System/Hardware specifications:
The specifications of device used for experimentation are
System properties (peer1):
Brand: Dell
Processor: Intel Core duo, CPU @2.10GHz
RAM: 4 GB
System properties (linking server):
Brand: Acer
Processor: AMD Turion (tm) X2 Dual - Core
Mobile RM - 74, CPU @2.20GHz
RAM: 4 GB
System properties (peer2):
Brand: Dell
Processor: Intel Core duo CPU @2.10GHz
RAM: 4 GB
Modem:
Brand: Telit GT-864 terminal
Specifications: downlink = 7.2Mbps, uplink=384kbps, Sensitivity =
- 107dbm,
Supported features: HSDPA, UMTS, GPRS, EDGE and AT commands on
both UART and USB.

Performance Analysis of Peer-to-Peer communications on 3G Cellular Networks
Experimental setup 35
4.4.2 Analysis procedure
To analyze the performance of P2P communications on 3G networks and to
investigate how different parameters such as signal strength, network load and chunk
size effect the performance. Different scenarios have been created with different
combination of all the examined parameters. Data sizes are transferred from peer A
to peer B as shown in Figure 20 under different conditions.
Data is transferred between the peers using different data sizes. In the following, the
scenarios used for signal strength and network load for all chunk sizes are given.
using strong signal during non-peak hours
using strong signal during peak hours
using weak signal during non-peak hours
using weak signal during peak hours
In order to keep the track of transmission time, logs (timestamps) are collected for all
cases and then average of all these results are taken for analyzing the performance.
4.4.2.1 Performance metrics calculation
Whenever a data is transmitted from peer A to peer B, the time when a chunk was
sent (Ts) and received time (Tr) for each chunk is recorded and once the entire data
size is transferred logs are generated with all these time stamps. The timestamps
contain all the sent and received times for complete data. Using the timestamps, the
following performance metrics are calculated for analysis.
Throughput:
Throughput is the amount of useful data (payload) that is transmitted through a
channel in fixed amount of time. Throughput can be estimated by dividing the
transmitted data size (Dt) with the total transmission time (Tt).
Throughput𝐷𝑡×8
𝑇𝑡
Normalized Average Delay (𝒅𝑵𝑨):
NAD is the normalized average end-to-end delay.
In order to estimate NAD, first it is necessary to know the total transmitted time for
each data size. Once total transmission time is known, and then NAD can be
calculated by dividing total transmission time by the transmitted data size.
dNA =
𝑇𝑡
𝐷𝑡

Performance Analysis of Peer-to-Peer communications on 3G Cellular Networks
Experimental setup 36
Data loss (L):
Since there was no loss of data for TCP case, it is only estimated in the case of UDP.
Percentage data loss L can be computed as. Where Dr is Received Data size
L% 𝐷𝑡 −𝐷𝑟
𝐷𝑡 ×100

Performance Analysis of Peer-to-Peer communications on 3G Cellular Networks
Results 37
5. RESULTS
In this chapter, we present the detailed results obtained from the experiments
conducted to evaluate the performance of P2P communication of 3G/ UMTS
networks in terms of NAD, throughput and percentage data loss.
The performance is analysed for both TCP and UDP. To analyse the performance
metrics effectively, different parameters such as signal strength, network load and
chunk size have been selected for experiments and the results have been collected
under different conditions. There are some potential threats that might limit the
validity of study such as, clock synchronization, Wi-Fi problem, devices
specifications and mobile network operator. To evaluate how these parameters affect
the P2P performance, we considered different conditions for these parameters. Such
as for parameter signal strength we considered strong and weak signal, for parameter
network load we consider peak and non-peak load and for parameter chunk size we
consider 1024, 768 and 512 bytes of chunk. The results have been divided in to five
cases where each case presents. Refer to appendix C for further details.
5.1 CASE 1
Effect of chunk size:
To analyze the effect of chunk size on the performance for both TCP and UDP under
the following scenario
Signal strength: Strong
Network Load: Non-peak
Data Size: 1MB
Protocols: TCP and UDP
Chunk size: (512, 768, 1024 bytes)
Figure 25: Effect of chunk size on throughput for TCP and UDP

Performance Analysis of Peer-to-Peer communications on 3G Cellular Networks
Results 38
Figure 25 and 26 show the effects of chunk size on throughput and NAD
respectively.
Figure 26: Effect of chunk size on NAD for TCP and UDP
From Figures 25 and 26, it is clear that chunk size affects both the performance
metrics. The throughput increases as chunk size increases while NAD decreases. The
reason for this trend is that when we configure peers with larger chunk size, it sends
less number of packets (chunks) when compared with smaller chunk size, which
results in decrease of transmission time, hence throughputs are more for larger chunk
size. And as the data rates increases delays tend to decrease which results in
decrease of NAD‟s for larger chunk size models. And one more reason for this
behavior is that peers with smaller chunk size has large overhead compared to large
chunk size, due to which peers configured with larger chunk size perform better than
the smaller chunk size (i.e.) they have better throughputs. It can also been noticed
that UDP has better performance compared to TCP in terms of both throughput and
NAD.
5.2 CASE 2
Effect of data size:
The conditions selected to analyze the impact of data size on performance of P2P
communications are
Signal strength: Strong
Network Load: Non-peak
Chunk size: 1024 bytes
Protocols: TCP and UDP

Performance Analysis of Peer-to-Peer communications on 3G Cellular Networks
Results 39
Data size: (512bytes, 1KB, 50 KB, 100 KB, 300 KB, 600 KB, 800 KB, 1 MB, 5
MB and 10 MB)
Figure 27 is the graphical representation of effect of data size on throughput. From
the Figure, it can be noticed that for the smaller data sizes such as from 512 bytes to
100 kb throughput is less when compared to larger data sizes. It is observed that
throughput for larger data (300KB to 10MB) is almost same with very small
variations.
Figure 27: Effect of data size on throughput for both TCP and UDP
Figure 28: Effect of data size on NAD for both TCP and UDP
Figure 28 shows the graphical representation of effect of data size on NAD. From
the Figure, it can be seen that for the smaller data sizes such as from 512 bytes to 100
kb NAD is higher compared to NAD for the larger data and NAD for 512 data is
highest among all. It is also observed that for larger data sizes (300KB to 10MB)
there is small difference in NAD. In this case, also UDP has better performance
when compared to TCP.

Performance Analysis of Peer-to-Peer communications on 3G Cellular Networks
Results 40
5.3 CASE 3
Effect of network load:
Following scenario was used in order to examine the impact of network load on
performance P2P communication.
Signal strength: Strong
Data size: 300KB, 1MB and 10MB
Chunk size: 1024 bytes
Protocols: TCP and UDP
Network Load: Non-peak (low network load) and peak (high network load)
Figure 29: Effect of network load on throughput for both TCP and UDP
Figure 29 shows the effect of network load on throughput for the examined scenario.
It is clear from the Figure that network load has impact on throughput and it can also
be noticed that during non-peak hours throughput is comparatively high than the
peak hours. And upon comparing transport protocols, UDP has better throughputs
than TCP.
From Figure 30, it can be noticed that network load has more impact during peak
hours due to which NAD‟s are relatively higher in case of peak hours than the non-
peak hours. And upon comparing both protocols, UDP has better performance.

Performance Analysis of Peer-to-Peer communications on 3G Cellular Networks
Results 41
Figure 30: Effect of network load on NAD for both TCP and UDP
5.4 CASE 4
Effect of signal strength:
Following scenario was considered to see the effect of signal strength on P2P
communication.
Network load: Non-peak
Data size: 300KB, 1MB and 10MB
Chunk size: 1024 bytes
Protocols: TCP and UDP
Signal strength: Strong signal and weak signal
Figure 31 shows the graphical representation of effect of signal strength on
throughput. From the Figure, it can be seen that throughput for strong signal is very
high compared to the throughput for weak signal. Upon comparing transport
protocols, UDP has better throughput than TCP.

Performance Analysis of Peer-to-Peer communications on 3G Cellular Networks
Results 42
Figure 31: Effect of signal strength on throughput for both TCP and UDP
Figure 32 shows the graphical representation of effect of signal strength on NAD.
From the Figure, it can be noticed that NAD for weak signal is very high when
compared to the NAD for strong signal.
The reason for showing less throughputs and high NAD‟s for the weak signals is, the
time taken for transmission of data for weak signal strengths are high compared with
time taken for transmission of data for strong signals. This can be because during
weak signal strength while the data is transmitted it encounters lot of errors and
connectivity problems. For example, TCP retransmits that data again and again
unless it is reached successfully to the receiver end and hence due to which data
transmission times increases which results in increase of NAD and decrease of
throughputs for weaker signal.
Figure 32: Effect of signal strength on NAD for both TCP and UDP

Performance Analysis of Peer-to-Peer communications on 3G Cellular Networks
Results 43
5.5 CASE 5
Data loss:
In order to examine the effect of different parameters on the amount of data loss
following sub cases are considered. In all the cases no loss has been observed for
TCP. The conditions selected for each of the sub case to analyze the impact on data
loss are
5.5.1 Effect of chunk size on data loss
Signal strength: Strong
Network Load: Non-peak
Data size: 300KB
Protocol: UDP
Chunk size: (512, 768, 1024 bytes)
Figure 33 shows the graphical representation of the effect of chunk size on the data
loss. From Figure, it can be clearly observed that when chunk size increases data loss
decreases. The reason for this trend is, when we configure the peer with 512 chunk
size it takes more time to transfer a data of any size compare to chunk sizes of 768
and 1024. 512 chunk size faces more number of signal fluctuations as it consumes
more time for transmission of data. Data loss is more for 512 chunk size than 768
and 1024 due to the signal variations.
Figure 33: Effect of chunk size on data loss

Performance Analysis of Peer-to-Peer communications on 3G Cellular Networks
Results 44
5.5.2 Effect of data size on data loss
Signal strength: Strong
Network Load: Non-peak
Chunk size: 1024 bytes
Protocols: UDP
Performance metrics: Data loss
Data size: (512bytes, 1KB, 50 KB, 100 KB, 300 KB, 600 KB, 800 KB, 1 MB, 5
MB and 10 MB)
Figure 34 shows the graphical representation of the effect of data size on the data loss.
For very small data sizes (512 bytes and 1KB) there is no data loss and this trend has
been noticed for all the cases under different conditions.
For other data sizes, in general it was observed that as data size increases data loss
decreases.
Figure 34: Effect of data size on data loss
5.5.3 Effect of network load on data loss
Signal strength: Strong
Data size: 300KB, 1MB and 10MB
Chunk size: 1024 bytes
Protocols: UDP
Network Load: Non-peak and peak
Figure 35 shows the effect of network load on the data loss. We can notice from the
Figure that when network load is high (peak), percentage of data loss is more and
when load is less (non-peak) data loss is also less.

Performance Analysis of Peer-to-Peer communications on 3G Cellular Networks
Results 45
Figure 35: Effect of network load on data loss
5.5.4 Effect of signal strength on data loss
Network load: Non-peak
Data size: 300KB, 1MB and 10MB
Chunk size: 1024 bytes
Protocols: UDP
Signal strength: Strong signal and weak signal
Figure 36 shows the effect of signal strength on data loss for 300MB data. From the
graph it can be observed that for weak signal data loss is more compare to strong
signal. This is because while transferring the data form one peer to another peer there
were connection failures between two peers due to weak signal. When Connection
failure occurs during transmission of data all the data is dropped and UDP does not
retransmit the data.
0
0.01
0.02
0.03
0.04
0.05
0.06
0.07
0.08
0.09
0.1
300KB
%D
ata
loss
Data size
non peak
peak

Performance Analysis of Peer-to-Peer communications on 3G Cellular Networks
Results 46
.
Figure 36: Effect of signal strength on data loss
5.6 Validity threats
There are some potential threats that might limit the validity of this study. In the
following we will discuss the validity threats.
Clock synchronization: Standardized time synchronization techniques such as “GPS
synchronization” were not employed during this experimentation and all the devices
(peers) were synchronized manually. Even then, there are chances that devices are
not perfectly synchronized due to which some delays might be introduced affecting
the performance and in turn the validity of this study.
Wi-Fi problems: One of the peers in our experiments was connected to Internet
through Wi-Fi. Proper care was taken that peer always received signal and tried to
maintain it good signal levels throughout the experiments. However, there might be
some errors or problems of signal strengths during experiments process which might
add some additional delays or reduce throughput.
Device specifications: The results are valid for the devices such as, pc‟s and modem
we used in the experiments. The results may vary if we use for example a modem
that supports even high speed.
Mobile network operator: We used “Telenor” mobile service which is one of the
major mobile network operators in Sweden. The results may vary depending on
different network setting that might have been using.
Performance Analysis of Peer-to-Peer communications on 3G Cellular Networks
Results 47
6. CONCLUSIONS
In this thesis work, experiments were conducted to analyses the performance of P2P
communication over 3G /UMTS networks. Two transport protocols TCP and UDP
were examined under different scenarios. The following conclusions can be drawn
from the experiments conducted in the course of this study. The performance
matrices used are throughput, normalized average delay and data loss.
Network load has an obvious effect on the performance for both TCP and UDP.
Throughput is higher during non-peak hours compared to peak hours and NAD is
higher during peak hours when compared with non-peak hours. Chunk size also
impacts the performance. As the chunk size is increases NAD decreases while
throughput increases. This means that in order to keep higher throughput it is better
to send data in bigger chunks.
The transmitted data sizes show considerable effect on NAD and throughput for
both protocols. From the collected results, it was observed that, NAD and throughput
had lot of fluctuations for smaller data size when compared to the larger data sizes.
Although for larger data sizes, it was observed that throughput and NAD does not
change much.
Signal strength has also a considerable impact on the performance for both protocols.
From the results, it was clear that when signal is strong, NAD is lower and
throughput is higher when compared to when the signal is weak.
Data loss was encountered only in case of UDP. It was observed that data loss is high
when signal is weak under peak hours with chunk size 512 bytes compare to other
conditions.
Upon comparing and analyzing all the results under different scenarios some
conclusions were drawn. It was observed that for strong signal strength under non-
peak hours with 1024 chunk size data of size 800KB and 1MB provides better
performance out of all the scenarios.

Performance Analysis of Peer-to-Peer communications on 3G Cellular Networks
Future work 48
7. FUTURE WORK
For future work, we suggest that these same experiments be conducted on network
layer by considering exact packet sizes or even the same experiments can be carried
out following different set of configurations following standardized clock
synchronization techniques.
Another interesting future work of this thesis is to carry out same experiments on
future networks (4G) on both application layer and network layer.
Performance Analysis of Peer-to-Peer communications on 3G Cellular Networks
Bibliography 50
BIBLIOGRAPHY
[1] S. C. Kim, M. G. Kim, and B. H. Rhee, "Seamless Connection for Mobile P2P
and Conventional Wireless Network," in The 9th International Conference on
Advanced Communication Technology, South Korea, 2007, vol. 3, pp. 1602-1605.
[2] P. Arlos and M. Fiedler, "Influence of the Packet Size on the One-way Delay on
the Down-link in 3G Networks," in 2010 5th International Symposium on Wireless
Pervasive Computing (ISWPC), Italy, 2010, pp. 573-578.
[3] X. Shen, H. Yu, J. Buford, and M. Akon Handbook of Peer-to-Peer Networking, 1st
ed., Springer, New York, 2009. pp. 1403.
[4] J. Yang, “Project Report: Measuring the Performance and Reliability of Routing
in Peer to Peer Systems,” M.S. thesis, Dept. Comp. Science, Victoria Univ. of
Wellington, Wellington, New Zealand, 2005.
[5] S. Simo, “Simulating a Mobile Peer-to-Peer Network”, M.S. thesis, Dept. of
Communication and networking, Helsinki Univ. of Tech., Helsinki, Finland, 2009.
[6] [Online]. Available: http://en.wikipedia.org/wiki/Overlay_network [Accessed:
June 25, 2011]
[7] S. Shimul and A. K. M. M. Rahman, “A Decentralized Key Database for Overlay
Identification” M.S. thesis, Dept. of Computing. Blekinge Institute of Tech.,
Karlskrona, Sweden, 2010.
[8] S. A-Theotokis and D. Spinellis, "A Survey of Peer-to-Peer Content Distribution
Technologies", ACM Computing Surveys, Vol. 36, No. 4, pp. 335–371, Dec. 2004.
[9] C. Wang and B. Li, “Peer-to-Peer Overlay Networks: A Survey,” Dept. of Comp.
Science, The Hong Kong Univ. of Science and Technology, Hongkong, 2003.
[10] J. Eberspächer and R. Schollmeier, “First and Second Generation of Peer-to-
Peer systems,” Munich Univ. of Tech., München, 2005.
[11] [Online]. Available: http://ants.etse.urv.es/wiki/P2p [Accessed: June 25, 2011]
[12] B. Prêtre, “Attacks on Peer-to-Peer Networks,” thesis, Dept. of Comp. Science,
Swiss Federal Institute of Tech., Zurich, Switzerland, 2005.
[13] M. D. Reddy, “A Study on Anonymous P2P Networks and their
Vulnerabilities,” M. S. thesis, Dept. of Applied Physics and Elec., Umeå Univ.,
Umeå, Sweden, 2007.
[14] H. D. Choon, N. Sarana, and B. Rajkumar, “Peer-to-Peer Networks for Content
Sharing”, Grid Computing and Distributed Systems Laboratory, Department of
Performance Analysis of Peer-to-Peer communications on 3G Cellular Networks
Bibliography 51
Computer Science and Software Engineering, The University of Melbourne,
Australia.
[15] Z. Qu, Y. Ge, K. Jiang, T. Lu, and Z. Wang, “A Study on the Model of Mobile
P2P File-Sharing System in 3G Network,” in third conf. of Semantics, Knowledge
and Grid, 2007, pp. 306-309.
[16] B. Tang, Z. Zhou, A. Kashyap, and T. Chiueh, “An Integrated Approach for P2P
File Sharing on Multi-hop Wireless Networks,” in IEEE International Conf. on
Wireless and Mobile Computing, Networking and Communications, 2005, vol. 3, pp.
268- 274.
[17] M. Iguchi, M. Terada and K. Fujimura, “Managing Resource and Servent
Reputation in P2P Networks,” in Proc. of the 37th Annual Hawaii International
Conf. on System Sciences, 2004, pp. 9.
[18] M. Xue and C. Zhu, "The Socket Programming and Software Design for
Communication Based on Client/Server," in conf. of Pacific-Asia on Circuits,
Communications and Systems, 2009, pp. 775-777.
[19] B. Hall, Network Programming using Internet Sockets, 3rd
ed., Jorgensen
Publishing, 2009, pp. 1-97.
[20] W. R. Stevens, UNIX Network Programming, vol. 1, 2nd
ed., Prentice Hall, NJ,
1998, pp. 1-1009
[21] A. Mishra, “Cellular Networks,” in Advanced cellular network planning and
optimisation: 2G/2.5G/3G - evolution, West Sussex, England: Wiley, 2007, pp. 1–12.
[22] B. M. Ratana and B. A. Vardhan, “Generations of Mobile Wireless
Technology: A Survey,” International Journal of Computer Applications, Vol. 5,
Aug. 2010.
[23] J. Nubarron, Evolution Of Mobile Technology: A Brief History of 1G, 2G, 3G
and 4G Mobile Phones [Online; accessed on January 11, 2011] Available :
http://www.brighthub.com/mobile/emerging-platforms/articles/30965.aspx
[24] C. Smith and D. Collins, “Second Generation,” in 3G Wireless Networks, New
York: McGraw Hill, 2002, pp. 45–68.
[25] _, Code Division Multiple Access [Online] Available:
http://www.experiencefestival.com/a/Code_division_multiple_access/id/1942000
[26] V. J. Arokiamary, “Second Generation and Third Generation Wireless
Networks and Standards,” in Cellular & Mobile Communications, 1st ed. pune, India:
Technical Publications, 2009, pp. 46–76.
[27] P. Stuckmann, “Edge and Evolution to GERAN,” in The GSM evolution, West
Sussex, England: Wiley, 2003, pp. 97.

Performance Analysis of Peer-to-Peer communications on 3G Cellular Networks
Bibliography 52
[28] Z. Han and K. J. R. Liu, “Wireless Networks,” in Resource Allocation for
Wireless Networks, New York: Cambridge University Press, 2008, pp. 18.
[29] J. Korhonen, “History of Mobile Cellular Systems,” in Introduction to 3G
Mobile Communications, 2nd
ed. Norwood: ARTech House, Inc, 2003, pp. 1–16.
[30] J. Sanchez and M. Thioune, “Network Evolution from GSM to UMTS,” in
Umts, London, United Kingdom: ISTE, 2004, pp. 27–28.
[31] T. Hopfeld, K. Tutschku, F. -U. Andersen, H. d. Meer and J. O. Oberender,
"Simulative Performance Evaluation of a Mobile Peer-to-peer File-sharing
System," in Conf. Next Generation Internet Networks, 2005, pp. 281 - 287.
[32] L. Shuping, J. Weirong, and L. Jinpei, "Architecture and Performance
Evaluation for P2P Application in 3G Mobile Cellular Systems," in Int. Conf. of
WiCom on Wireless Communications, Networking and Mobile Computing, 2007, pp.
914-917.
[33] Y. Zhang, X. Zhou, F. Bai, and Song Junping, "Peer Selection for Load
Balancing in 3G Cellular Networks," in 2nd
Int. Conf. on Information Science and
Engineering (ICISE), 2010, pp. 2227-2230.
[34] Q. Zhiyi, G. Yuanting, J. Kaiyuan, L. Tiangang, and W. Zhong, "A Study on the
Model of Mobile P2P File-Sharing System in 3G Network," in 3rd
Int. Conf. on
Semantics, Knowledge and Grid, 2007, pp. 306-309.
[35] K. Ravichandra, “Performance of 3G Data Services Over Mobile Network in
Sweden” M.S. thesis, Dept. of Computing, Blekinge Institute of Technology,
Karlskrona, Sweden, 2010.

Performance Analysis of Peer-to-Peer communications on 3G Cellular Networks
Appendices 53
APPENDICES
Appendix A
Step by step procedure of connecting peers for TCP
application
Run the TCP server application by double clicking it. A window will appear
as shown in Figure 37.
Figure 37: command window of server waiting for peers
Run the “peer A” TCP application from one system, to do so first open the
command window and change the path to the folder in which TCP Peer „.exe‟
file exits.
Using the following command peer A can be connected to linking Server
Command Syntax: Peer Name.exe[space] IP address [space] Port Number
[space] Peer A Name
In the above command, “Peer Name.exe” is the name you have given to your
peer application, In the place of “IP address” type the IP address of the
linking server application is running, in place of “Port number” just type 5150
and in place of “peer A name” type name
If you type the above command in command windows and hit enter, a
window will appears as shown in Figure 38.
For Example: “Clienm1024.exe 192.168.1.10 5150 sai”
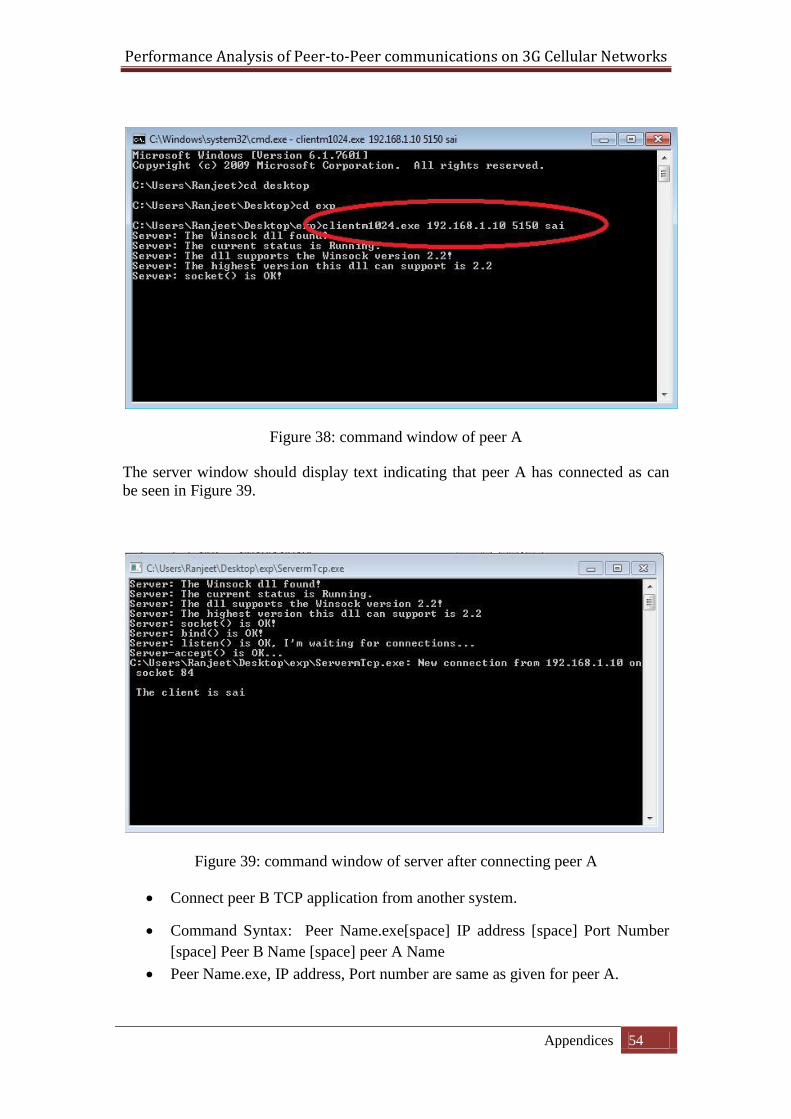
Performance Analysis of Peer-to-Peer communications on 3G Cellular Networks
Appendices 54
Figure 38: command window of peer A
The server window should display text indicating that peer A has connected as can
be seen in Figure 39.
Figure 39: command window of server after connecting peer A
Connect peer B TCP application from another system.
Command Syntax: Peer Name.exe[space] IP address [space] Port Number
[space] Peer B Name [space] peer A Name
Peer Name.exe, IP address, Port number are same as given for peer A.

Performance Analysis of Peer-to-Peer communications on 3G Cellular Networks
Appendices 55
In the place of “peer B name” type any new name other than previously used
name for connecting the peer A. In place of “Peer A name” type the name
that is given to peer A.
If you type the above command in command windows and hit enter, a
window should appear as shown in the Figure 40.
For Example: “Clientm1024.exe 192.168.1.10 5150 jeet sai”
Figure 40: command window of peer B
Server application should indicate the connection of peer B as shown in
Figure 41.
Figure 41: command window of server after connecting peer A and peer B

Performance Analysis of Peer-to-Peer communications on 3G Cellular Networks
Appendices 56
In this case both peers are interconnected via the linking server. once both
Peers are connected data can be transferred by entering following command”
“file: filename. Extension”, for ex: file: report.docx (before transferring data
just make sure that files are located in the same folder in which peer
application exits exists)
Once the data is transferred, a log file containing sent and received times can
be generated by typing “printlog” in the receiver peer window.
Appendix B
For UDP Application: Follow the same steps as in the case of TCP for connecting UDP peer to
the UDP server.
When both peers are connected to other via linking server, then for
transferring data type the following command:
“send: filename. Extension”, for ex: send: report.docx (before transferring
data just make sure that files are located in the same folder in which peer
application exists)
Once the data is transferred, a log file containing sent and received times
can be generated by typing “printlog” in the receiver peer window.
Appendix C
Complete results for different scenario for TCP
Table 2: Results obtained for conditions strong signal, chunk size of 1024 bytes and
nonpeak network load
TCP/1024/strong signal/non-peak load
Data Size
NAD ( µs) Throughput (kbps)
512 bytes 28.6132 279.590
1 kb 20.4101 391.961
50 kb 20.2050 395.940
100 kb 19.7138 405.806
300 kb 18.1321 441.205
600 kb 17.4625 458.123
800 kb 18.1403 441.005
1mb 17.4683 457.972
5mb 17.8474 448.245
10mb 17.9755 445.050
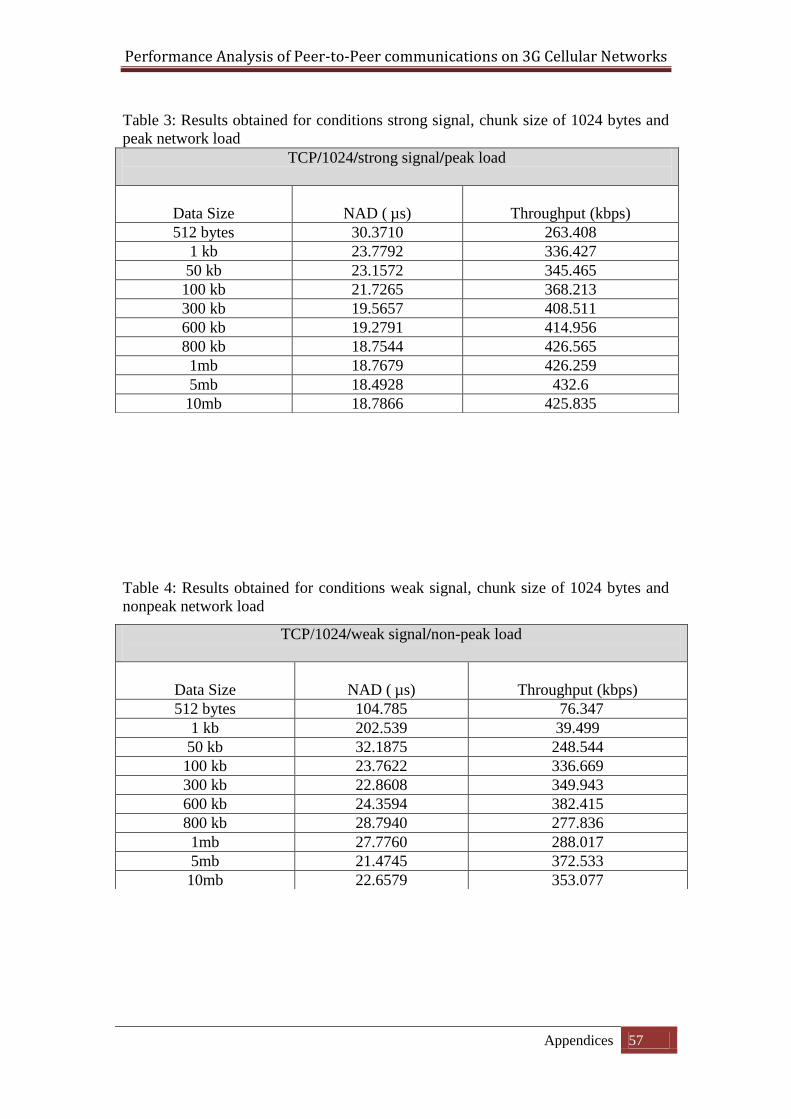
Performance Analysis of Peer-to-Peer communications on 3G Cellular Networks
Appendices 57
Table 3: Results obtained for conditions strong signal, chunk size of 1024 bytes and
peak network load
Table 4: Results obtained for conditions weak signal, chunk size of 1024 bytes and
nonpeak network load
TCP/1024/strong signal/peak load
Data Size
NAD ( µs) Throughput (kbps)
512 bytes 30.3710 263.408
1 kb 23.7792 336.427
50 kb 23.1572 345.465
100 kb 21.7265 368.213
300 kb 19.5657 408.511
600 kb 19.2791 414.956
800 kb 18.7544 426.565
1mb 18.7679 426.259
5mb 18.4928 432.6
10mb 18.7866 425.835
TCP/1024/weak signal/non-peak load
Data Size
NAD ( µs) Throughput (kbps)
512 bytes 104.785 76.347
1 kb 202.539 39.499
50 kb 32.1875 248.544
100 kb 23.7622 336.669
300 kb 22.8608 349.943
600 kb 24.3594 382.415
800 kb 28.7940 277.836
1mb 27.7760 288.017
5mb 21.4745 372.533
10mb 22.6579 353.077

Performance Analysis of Peer-to-Peer communications on 3G Cellular Networks
Appendices 58
Table 5: Results obtained for conditions weak signal, chunk size of 1024 bytes and
peak network load
Table 6: Results obtained for conditions strong signal, chunk size of 768 bytes and
nonpeak network load
TCP/1024/weak signal/peak load
Data Size
NAD ( µs) Throughput (kbps)
512 bytes 198.076 40.389
1 kb 215.869 37.059
50 kb 35.9199 222.718
100 kb 32.3266 247.474
300 kb 30.3606 263.499
600 kb 34.9013 229.217
800 kb 31.6210 252.996
1mb 32.6701 244.872
5mb 25.9544 308.232
10mb 24.7709 322.959
TCP/768/strong signal/non-peak load
Data Size
NAD ( µs) Throughput (kbps)
512 bytes 63.1835 126.615
1 kb 137.792 58.058
50 kb 21.5791 370.729
100 kb 20.9472 381.911
300 kb 19.3891 412.625
600 kb 19.3024 414.470
800 kb 18.9884 421.182
1mb 19.3645 405.129
5mb 20.4127 391.911
10mb 20.4136 391.894

Performance Analysis of Peer-to-Peer communications on 3G Cellular Networks
Appendices 59
Table 7: Results obtained for conditions strong signal, chunk size of 768 bytes and
peak network load
Table 8: Results obtained for conditions weak signal, chunk size of 768 bytes and
nonpeak network load
TCP/768/strong signal/peak load
Data Size
NAD ( µs) Throughput (kbps)
512 bytes 94.2558 85.33
1 kb 169.482 47.203
50 kb 24.6513 324.525
100 kb 23.5600 339.557
300 kb 20.6347 387.695
600 kb 20.5331 389.631
800 kb 24.8892 321.424
1mb 20.7006 386.464
5mb 23.6062 338.933
10mb 20.9913 381.109
TCP/768/weak signal/non-peak load
Data Size
NAD ( µs) Throughput (kbps)
512 bytes 162.792 49.142
1 kb 222.900 35.890
50 kb 48.5375 165.162
100 kb 28.7841 277.695
300 kb 24.1175 332.108
600 kb 24.5381 326.028
800 kb 30.3333 263.726
1mb 28.8022 277.760
5mb 25.3253 315.883
10mb 23.0612 346.902

Performance Analysis of Peer-to-Peer communications on 3G Cellular Networks
Appendices 60
Table 9: Results obtained for conditions weak signal, chunk size of 768 bytes and
peak network load
Table 10: Results obtained for conditions strong signal, chunk size of 512 bytes and
nonpeak network load
TCP/768/weak signal/peak load
Data Size
NAD ( µs) Throughput (kbps)
512 bytes 306.25 26.122
1 kb 478.417 16.722
50 kb 69.5380 115.044
100 kb 38.2529 208.980
300 kb 33.7537 237.011
600 kb 36.7355 217.776
800 kb 33.1171 241.581
1mb 40.5183 197.444
5mb 30.1051 265.735
10mb 26.2007 305.331
TCP/512/strong signal/non-peak load
Data Size
NAD ( µs) Throughput (kbps)
512 bytes 135.742 58.935
1 kb 200.781 39.844
50 kb 23.6435 338.359
100 kb 21.5825 370.670
300 kb 20.2412 395.233
600 kb 21.4757 372.513
800 kb 23.3284 342.929
1mb 23.4883 340.599
5mb 30.2971 264.058
10mb 30.4173 263.008

Performance Analysis of Peer-to-Peer communications on 3G Cellular Networks
Appendices 61
Table 11: Results obtained for conditions strong signal, chunk size of 512 bytes and
peak network load
Table 12: Results obtained for conditions weak signal, chunk size of 512 bytes and
nonpeak network load
TCP/512/ strong signal/for peak load
Data Size
NAD ( µs) Throughput (kbps)
512 bytes 153.515 52.111
1 kb 268.847 29.757
50 kb 30.1035 265.750
100 kb 25.5410 313.222
300 kb 30.2674 264.543
600 kb 30.0721 265.974
800 kb 31.1955 256.447
1mb 30.0981 265.797
5mb 31.2271 256.218
10mb 31.2249 256.205
TCP/512/weak signal/non-peak load
Data Size
NAD ( µs) Throughput (kbps)
512 bytes 517.480 15.754
1 kb 300.439 26.628
50 kb 49.5136 161.572
100 kb 40.1093 199.455
300 kb 37.9651 210.720
600 kb 37.4132 213.828
800 kb 39.7492 201.262
1mb 37.0822 215.737
5mb 33.3892 239.598
10mb 31.2979 255.608

Performance Analysis of Peer-to-Peer communications on 3G Cellular Networks
Appendices 62
Table 13: Results obtained for conditions weak signal, chunk size of 512 bytes and
peak network load
Appendix D
Complete results for different scenario for UDP
Table 14: Results obtained for conditions strong signal, chunk size of 1024 bytes and
nonpeak network load
TCP/512/weak signal/peak load
Data Size
NAD ( µs) Throughput (kbps)
512 bytes 529.589 15.106
1 kb 536.376 14.915
50 kb 76.5468 104.511
100 kb 49.8076 160.618
300 kb 46.5724 171.775
600 kb 42.4356 188.521
800 kb 54.3740 147.129
1mb 46.7029 171.296
5mb 36.4178 219.673
10mb 34.4597 232.155
UDP/1024/strong signal/non-peak load
Data Size
NAD ( µs) Throughput (kbps) Drop%
512 bytes 22.94921 348 0
1 kb 17.33398 461.521 0
50 kb 9.58496 802.92 3.80
100 kb 11.54882 672.622 2.90
300 kb 10.86979 700.412 4.90
600 kb 13.86767 556.738 3.49
800 kb 9.9114 778.043 3.60
1mb 12.74476 619.525 1.30
5mb 14.39865 547.854 1.40
10mb 15.31407 520.597 0.34
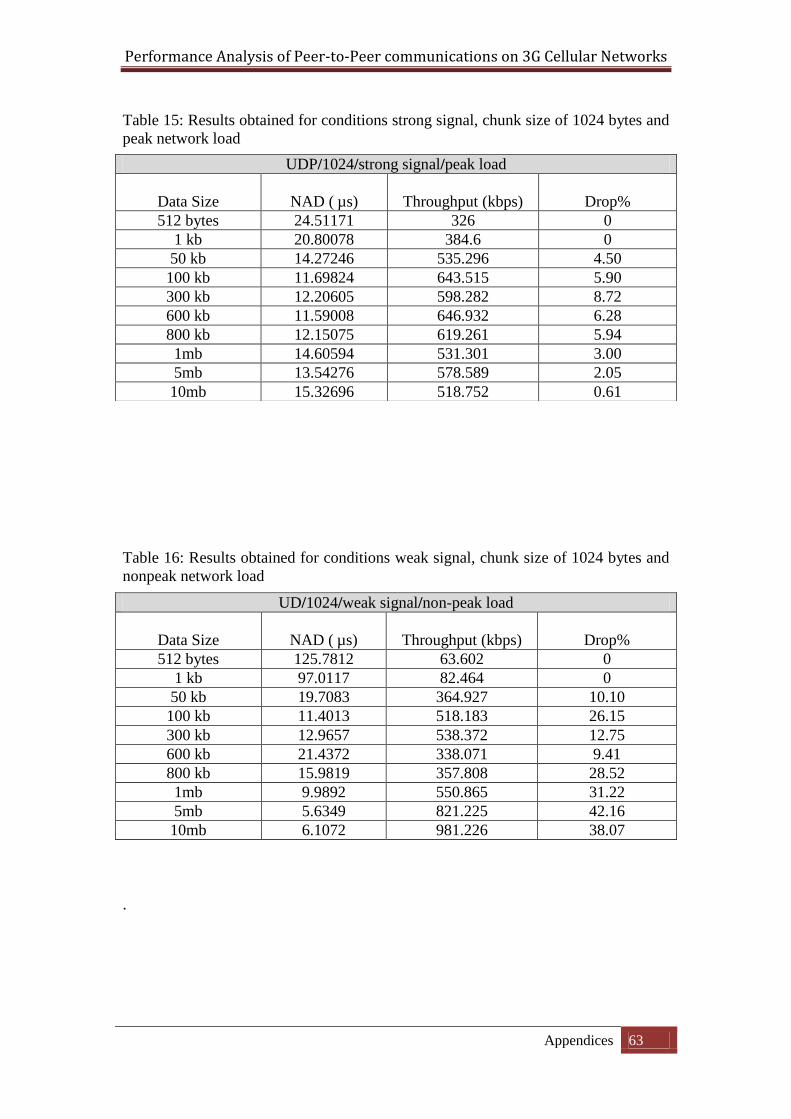
Performance Analysis of Peer-to-Peer communications on 3G Cellular Networks
Appendices 63
Table 15: Results obtained for conditions strong signal, chunk size of 1024 bytes and
peak network load
Table 16: Results obtained for conditions weak signal, chunk size of 1024 bytes and
nonpeak network load
.
UDP/1024/strong signal/peak load
Data Size
NAD ( µs) Throughput (kbps) Drop%
512 bytes 24.51171 326 0
1 kb 20.80078 384.6 0
50 kb 14.27246 535.296 4.50
100 kb 11.69824 643.515 5.90
300 kb 12.20605 598.282 8.72
600 kb 11.59008 646.932 6.28
800 kb 12.15075 619.261 5.94
1mb 14.60594 531.301 3.00
5mb 13.54276 578.589 2.05
10mb 15.32696 518.752 0.61
UD/1024/weak signal/non-peak load
Data Size
NAD ( µs) Throughput (kbps) Drop%
512 bytes 125.7812 63.602 0
1 kb 97.0117 82.464 0
50 kb 19.7083 364.927 10.10
100 kb 11.4013 518.183 26.15
300 kb 12.9657 538.372 12.75
600 kb 21.4372 338.071 9.41
800 kb 15.9819 357.808 28.52
1mb 9.9892 550.865 31.22
5mb 5.6349 821.225 42.16
10mb 6.1072 981.226 38.07

Performance Analysis of Peer-to-Peer communications on 3G Cellular Networks
Appendices 64
Table 17: Results obtained for conditions weak signal, chunk size of 1024 bytes and
peak network load
Table 18: Results obtained for conditions strong signal, chunk size of 768 bytes and
nonpeak network load
UDP/1024/weak signal/peak load
Data Size
NAD ( µs) Throughput (kbps) Drop%
512 bytes 173.12572 46.209 0
1 kb 132.17773 60.524 0
50 kb 14.86621 368.621 31.50
100 kb 20.42431 225.613 42.45
300 kb 17.88704 318.368 28.82
600 kb 7.20312 743.658 33.04
800 kb 15.9819 935.399 47.75
1mb 8.11476 570.285 42.15
5mb 5.42106 855.199 47.32
10mb 6.10724 703.518 46.29
UDP/768 /strong signal/non-peak load
Data Size
NAD ( µs) Throughput (kbps) Drop%
512 bytes 13.7695 580.992 0
1 kb 12.8906 620.606 0
50 kb 15.8242 505.554 5
100 kb 19.2548 415.479 1.70
300 kb 14.2612 560.961 2.59
600 kb 15.9161 502.633 2.30
800 kb 17.8983 446.969 1.01
1mb 15.67397 510.395 1.70
5mb 19.1767 417.173 0.60
10mb 19.6018 408.125 0.414

Performance Analysis of Peer-to-Peer communications on 3G Cellular Networks
Appendices 65
Table 19: Results obtained for conditions strong signal, chunk size of 768 bytes and
peak network load
Table 20: Results obtained for conditions weak signal, chunk size of 768 bytes and
nonpeak network load
UDP/768/strong signal/peak load
Data Size
NAD ( µs) Throughput (kbps) Drop%
512 bytes 16.6015 345.645 0
1 kb 16.2109 493.493 0
50 kb 17.3486 461.131 8.80
100 kb 18.1816 440.004 8.65
300 kb 17.6461 453.356 6.04
600 kb 19.0613 419.3697 4.62
800 kb 19.2931 414.654 3.38
1mb 19.4494 392.096 4.01
5mb 20.1459 397.103 0.91
10mb 20.2523 395.672 0.59
UDP/768/weak signal/non-peak load
Data size
NAD ( µs) Throughput (kbps) Drop%
512 bytes 43.9453 182.044 0
1 kb 16.1621 494.984 0
50 kb 19.2851 262.170 36.80
100 kb 10.9716 349.388 42.65
300 kb 5.5055 751.001 48.30
600 kb 6.3513 753.324 40.19
800 kb 18.3415 260.061 40.25
1mb 10.8263 526.382 28.76
5mb 7.7623 521.246 49.42
10mb 8.3658 592.536 38.04

Performance Analysis of Peer-to-Peer communications on 3G Cellular Networks
Appendices 66
Table 21: Results obtained for conditions weak signal, chunk size of 768 bytes and peak
network load
Table 22: Results obtained for conditions strong signal, chunk size of 512 bytes and
nonpeak network load
UDP/768/weak signal strength/peak load
Data Size
NAD ( µs) Throughput (kbps) Drop%
512 bytes 56.5429 141.485 0
1 kb 24.7070 323.794 0
50 kb 20.5419 222.373 42.90
100 kb 15.0561 227.415 57.20
300 kb 11.4347 365.203 47.80
600 kb 5.7137 690.620 57.68
800 kb 9.4734 413.682 51.01
1mb 14.7290 256.402 52.79
5mb 5.0950 630.343 59.85
10mb 4.3865 675.282 62.97
UDP/512/strong signal/non-peak load
Data Size
NAD ( µs) Throughput (kbps) Drop%
512 bytes 35.0585 228.189 0
1 kb 36.6210 219.306 0
50 kb 16.3476 487.409 0.4
100 kb 20.3007 382.251 3
300 kb 16.7985 470.597 1.1833
600 kb 16.9133 459.006 2.958
800 kb 20.7120 381.998 1.1
1mb 21.0591 372.426 1.9628
5mb 29.3477 271.227 0.5009
10mb 29.1486 271.726 0.9941

Performance Analysis of Peer-to-Peer communications on 3G Cellular Networks
Appendices 67
Table 23: Results obtained for conditions strong signal, chunk size of 512 bytes and
peak network load
Table 24: Results obtained for conditions weak signal, chunk size of 512 bytes and
nonpeak network load
UDP/512/strong signal/peak load
Data size
NAD ( µs) Throughput (kbps) Drop%
512 bytes 41.2109 194.123 0
1 kb 47.2656 169.256 0
50 kb 27.3300 242.370 17.2
100 kb 29.5854 261.074 3.45
300 kb 28.7270 271.799 2.4
600 kb 29.2355 267.824 2.125
800 kb 29.9907 261.780 1.8625
1mb 26.5285 293.787 2.578125
5mb 30.4816 260.994 0.55
10mb 30.1718 260.935 1.5888
UDP/512/ weak signal strength for/ non-peak load
Data Size
NAD ( µs) Throughput (kbps) Drop%
512 bytes 43.9453 182.044 0
1 kb 25.9277 30.854 0
50 kb 32.5818 200.848 18.2
100 kb 13.8950 366.174 36.4
300 kb 11.3780 412.722 41.3
600 kb 7.89518 593.610 41.416
800 kb 22.0145 306.661 15.6
1mb 12.31431 487.332 22.055
5mb 8.67733 543.180 41.083
10mb 5.15860 704.610 54.3

Performance Analysis of Peer-to-Peer communications on 3G Cellular Networks
Appendices 68
Table 25: Results obtained for conditions weak signal, chunk size of 512 bytes and
peak network load
UDP/512/weak signal/peak load
Data Size
NAD ( µs) Throughput (kbps) Drop%
512 bytes 56.5429 141.485 0
1 kb 29.5410 327.025 0
50 kb 20.5419 222.373 42.9
100 kb 16.7827 307.220 35.55
300 kb 11.9899 360.636 45.95
600 kb 8.35660 557.642 41.75
800 kb 20.0717 304.158 23.687
1mb 16.7021 368.309 23.105
5mb 6.81894 592.742 49.48
10mb 5.54459 649.724 54.968