performance analysis of 3g communication network
TRANSCRIPT

130
ITB J. ICT Vol. 2, No. 2, 2008, 130-157
Performance Analysis of 3G Communication Network
Toni Anwar1 & Lim Wern Li2
1The Sirindhron International Thai-German Graduate School of Engineering (TGGS) [email protected] , [email protected]
2Universiti Sains Malaysia (USM) [email protected]
Abstract. In this project, third generation (3G) technologies research had been carried out to design and optimization conditions for 3G network. The 3G wireless mobile communication networks are growing at an ever faster rate, and this is likely to continue in the foreseeable future. Some services such as e-mail, web browsing etc allow the transition of the network from circuit switched to packet switched operation, resulting in increased overall network performance. Higher reliability, better coverage and services, higher capacity, mobility management, and wireless multimedia are all parts of the network performance. Throughput and spectral efficiency are fundamental parameters in capacity planning for 3G cellular network deployments. This project investigates also the downlink (DL) and uplink (UL) throughput and spectral efficiency performance of the standard Universal Mobile Telecommunications system (UMTS) system for different scenarios of user and different technologies. Power consumption comparison for different mobile technology is also discussed. The analysis can significantly help system engineers to obtain crucial performance characteristics of 3G network. At the end of the paper, coverage area of 3G from one of the mobile network in Malaysia is presented.
Keywords: HSDPA; HSUPA; HSPA; Latency; Power Consumption; Spectral Efficiency; Throughput; UMTS.
1 Introduction The wireless communication industry has grown rapidly over the past decade, with markets doubling roughly every two years. Much of this growth has been due to the public’s increasing demand for mobile telephones, and more recently, wireless data systems. The increasing number of wireless users has spurred communication engineer to improve the quality of the service and use the available spectrum resources more efficiently [1, 2].
Third generation (3G) is a term that has received and continues to receive much attention as high-speed data for the wireless mobility market. In many parts of world 3G networks do not use the same radio frequencies as 2G, requiring mobile operators to build entirely new networks and license entirely new frequencies. The 3G mobile network is the system and services based on the International Telecommunication Union (ITU) family of standard under the
Received October 2nd, 2008, Revised October 21st, 2008.

Performance Analysis of 3G Communication Network 131
International Mobile Telecommunications-2000 (IMT-2000). IMT-2000 consists of five technologies such as Wideband CDMA (WCDMA), CDMA 2000, Time Division-Synchronous CDMA (TD-SCDMA), UWC-136 (often implemented with EDGE) and DECT [3-6].
Third generation wireless mobile communication networks are characterized by the increasing utilization of data services – e-mail, web browsing, video streaming, etc. Such services allow the transition of the network from circuit switched to packet switched operation (circuit switched operation will still be supported), resulting in increased overall network performance. These new data services require increased bandwidth and data throughput. This increasing demand for bandwidth and throughput has driven the work of third generation standardization committees, resulting in the specification of improved modulation and coding schemes [7-12].
Figure 1 The evolution of UMTS choices.
Throughput plays a major role for the performance of network and thus for user experience. Especially in mobile environments, throughput is limited, which is a challenge for applications and users. Besides, network latency is also very important as throughput. Latency is the round-trip time it takes data to traverse the network. This project investigated the throughput and latency in UMTS systems. Then, the result will compile and analyze the results. Such performance results will ultimately determine design and optimization conditions for 3G networks [13-18].
To understand the reasons for deploying the different data technologies and to predict the evolution of capability, it is useful to examine spectral efficiency for downlink and uplink, and power consumption. Thus, this analysis can significantly help system engineers to obtain crucial performance characteristics of 3G network.
132 Toni Anwar & Lim Wern Li
2 Objectives The main purpose of this project is to design and optimization conditions for third generation (3G) technologies. This project investigated the downlink (DL) and uplink (UL) throughput and spectral efficiency performance of the standard Universal Mobile Telecommunications system (UMTS) system for different scenarios of user and different technologies. Throughput and spectral efficiency are very important fundamental parameters in capacity planning for 3G cellular network deployments. Based on this analysis, it can then be used to generate information on predicted capacity, coverage and system quality, and to generate reports and performance displays that allow the user to assess the effectiveness of the 3G system. Besides, these features can also be provided that allow system designers to obtain a very large amount of information about an existing or proposed system, including the different services and different subscriber types; this will allow the system resources to be allocated with great flexibility.
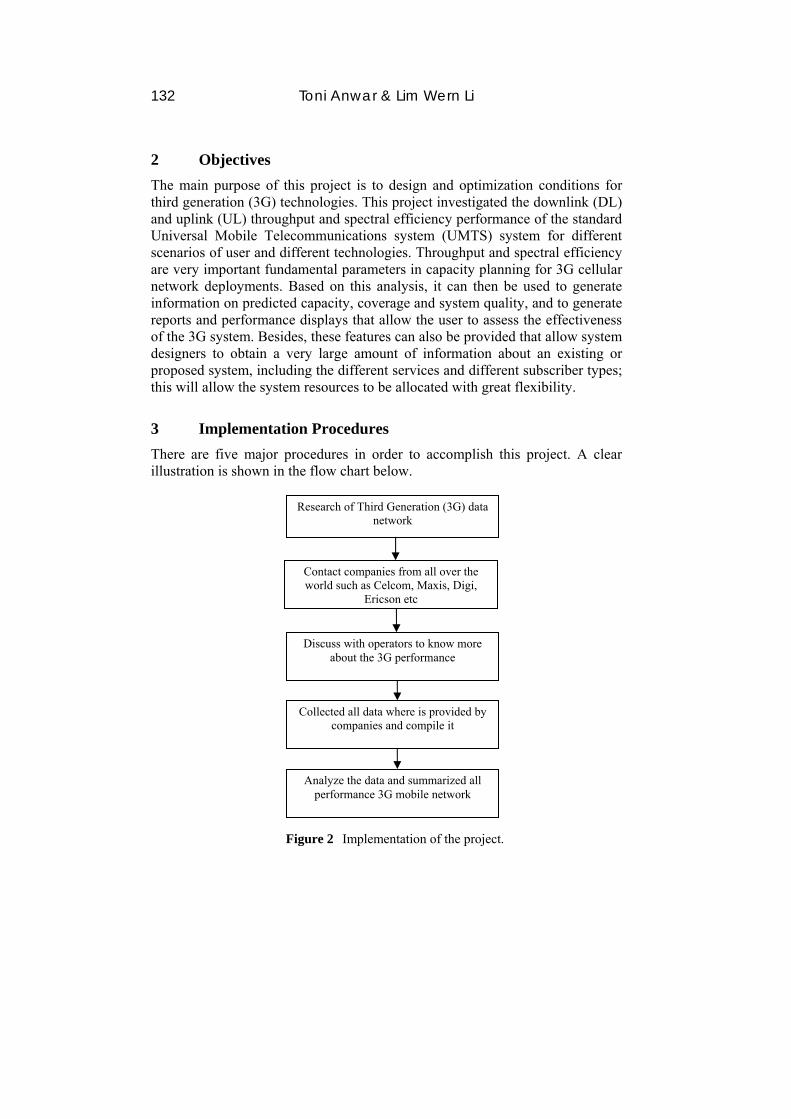
3 Implementation Procedures There are five major procedures in order to accomplish this project. A clear illustration is shown in the flow chart below.
Research of Third Generation (3G) data network
Discuss with operators to know more about the 3G performance
Collected all data where is provided by companies and compile it
Analyze the data and summarized all performance 3G mobile network
Contact companies from all over the world such as Celcom, Maxis, Digi,
Ericson etc
Figure 2 Implementation of the project.

Performance Analysis of 3G Communication Network 133
4 Analysis In this chapter, the results presented herein are the compilation of the contributions by 3G Americas member company and Informa Telecoms and Media Cellular Information Service to the standardization effort promoted by the ETSI. Additional contributions by the UMTS Forum and Peter Rysavy have been researched, compiled and analyzed.
4.1 Stimulating Consumer Uptake For 3G Mobile Multimedia
Figure 3 Global UMTS subscriber growth forecast [19].
Figure 3 shows that Global UMTS Subscriber Growth Forecast. With respect to Figure above, number of subscribers used the UMTS network in 2006 was 103 million customers. Estimations for the coming five year are quite optimistic and the number of subscribers is looking quite optimistic and will increase by a factor of eight if compared to the actual number of subscribers in 2006, with 949 million subscribers using UMTS services in 2011. Three billion UMTS customers are projected by 2009, with 514 million of these subscribers using UMTS services.
Number of the subscribers is very at the beginning because many users are still lack of confidence to use of the new technology such as UMTS although there are many applications such as multiplayer games, online e-mail, video sharing etc. Moreover, most of those factors pointed out by users are generally based on false preconceived opinions. For example, most of the users will think it is very high costs if use of the UMTS technology. This situation generated form the firsts Internet attempts into the mobile phones.

134 Toni Anwar & Lim Wern Li
However, in spite of all those benefits of UMTS such as low cost, high spectral efficiency for data and voice, simultaneous voice and data capability for users, support for high-bandwidth data applications, and high speed data services, number of the subscribers is estimated to increase rapidly for future.
4.2 Status for UMTS and HSDPA Operator Table 1 Global UMTS and HSDPA operator status.
GLOBAL UMTS and HSDPA OPERATOR
STATUSOPERATOR
COMMITMENTS 294OPERATOR
COMMITMENTS 181updated: Feb 20,2007 SERVICE 155 SERVICE 97
SERVICE 67 SERVICE 51Source: Informa Telecoms COMMITMENTS 104 COMMITMENTS 72& Media World Cellular DEPLOYMENT 55 DEPLOYMENT 82Information Service & TRIAL 5 TRIAL 2
3G AmericasPOTENTIAL & LIC.
AWARDED 79EDGE + UMTS COMMERCIAL 75
UMTS Summary HSDPA Summary
Table 1 shows that global UMTS and HSDPA operator status. These results are compiled by 3G Americans from Informa Telecom & Media, World Cellular Information Service and public company announcements, February 20, 2007.
UMTS is becoming the worldwide industry standard for the delivery of 3G voice and data services. There are 294 operators in 104 countries around the world were using UMTS networks. This includes 155 operators offering commercial service in 67 countries, 55 operators in deployment and 84 more networks planned, in trial, in License Awarded or in Potential License. Meanwhile, HSDPA is becoming a market reality, with 181 operator commitments in 72 countries. This includes 97 operators in 51 countries has commercially launched it network to market and 82 operators in deployment and 2 operators in trial.
It is expected that virtually all 294 UMTS operators will upgrade to HSDPA, resulting in a significant increase in data capacity and a give much lower cost per megabyte of data delivered. Besides, operators will be able to support customers for both voice and data using the same spectrum allocation.

Performance Analysis of 3G Communication Network 135
4.3 Comparison between Current Edge and Evolved Edge Table 2 shows the theoretical peak throughput for four slots. Nine different modulation and coding schemes, MCS-1 to MCS-9, are defined for the packet-switched mode of current EDGE and the new Evolved EDGE Modulation and Coding Scheme (MCS) 10 and MCS 11.
Table 2 Comparison of current EDGE and evolved EDGE.
The throughput at the link layer with current EDGE can vary from 35.2kbps under adverse conditions to 236.8kbps with a very good Carrier to Interference (C/I) ratio. Adding 16-QAM in Evolved EDGE and a new set of modulation and coding scheme such as MCS 10 and MCS 11 will increase maximum throughput by 38 percent.
The addition of higher order modulation schemes will enhance EDGE network capacity and increase throughput. This yields improvement in information capacity and enable very high data transfer rates.
4.4 HSDPA Terminal Categories Table 3 shows the different categories of HSDPA devices. A soft channel bit refers to how many bits the system uses for error correction. L1 peak rate refers to achievable maximum data rate.
The HSDPA feature is optional for terminals in Release 5 with a total of 12 different categories of terminal with resulting maximum data rates ranging

136 Toni Anwar & Lim Wern Li
between 0.9 and 14.7 Mbps. The ten HSDPA terminal categories need to support QPSK and/or 16QAM, but the last two, categories 11 and 12, support only QPSK modulation. Category number 10 is intended to allow the theoretical maximum data rate of 14.4 Mbps.
Table 3 HSDPA terminal categories.
Differentiators between terminal categories include, for instance, the support of modulation scheme QPSK and/or 16QAM. For example, categories 5 and 12 support 3.6 Mbit/s and 1.8 Mbit/s respectively, with five codes. Another differentiator is the number of codes supported by the UE. For instance a UE that supports ten codes can achieve up to 7.2 Mbit/s where a 15-code UE supports speeds of up to 14 Mbit/s.
4.5 HSUPA Terminal Categories Table 4 shows HSUPA peak throughput rate. HSUPA can achieve different throughput rates based on various parameters such as the spreading factor of the codes, the number of codes used, the Transmission Time Interval (TTI) value, and the transport block size in bytes.
Differentiators between terminal categories include the TTI time value. Some categories support TTI of only 10 ms, while others support both 2 ms and 10 ms. For example, category 1, 3 and 5 support 10 ms, while categories 2, 4 and 6. Another differentiator is the number of codes used and their spreading factor (SF).

Performance Analysis of 3G Communication Network 137
Table 4 HSUPA peak throughput rates.
4.6 Data Throughput Table 5 shows the technologies in terms of peak network throughput rates and peak user-achievable rates. Peak user achievable refers users are under favorable conditions of network loading and signal propagation, can achieve this rate as measured by applications such as file transfer. Achievable user rate depend on many factors and will be lower than peak network rate.
The physical layer of GPRS builds on the existing GSM structure, utilizing the same modulation technology that is GMSK (Gaussian Minimum Shift Keying), but allowing four distinct Coding Schemes (CS). These four coding schemes are named CS1 to CS4 and differ on the maximum data rate they can carry. For the GPRS, CS1-2 refers to coding schemes 1 and 2, while CS1-4 refers to coding schemes 1 to 4. Type 2 MS refers to a mobile station (MS) that can send or receive on up to eight timeslots in one radio channel and type 1 MS refers to a mobile station that can send or receive on four timeslots in one radio channel. The choice of coding scheme depends on the condition of the channel provided by the cellular network. That is mean quality of the radio link between cell phone and base station. The network will choose to use CS-1 or CS-2 if the channel is very noisy to ensure higher reliability. If the channel is providing a good condition, the network could use CS-3 or CS-4 to obtain optimum speed. The most commonly used coding scheme for GPRS network today is CS1 and CS2. It is because this scheme provides reasonably robust error correction over the air interface. Although CS-3 and CS-4 provide higher throughput but they are more susceptible errors on the air interface. Consequently, CS-3 and CS-4

138 Toni Anwar & Lim Wern Li
generate a great deal more retransmission over the air interface. With such retransmission, the net throughput may well be no better than that of CS-2.
Table 5 Throughput performance of different wireless technologies.
Peak Network speed
peak Achievable User Rate
Peak Network
speed
peak Achievable User Rate
GPRS (CS1-2, type 2 MS) 107.2 kbps 107.2 kbpsGPRS (CS1-2, type 1 MS) 53.6 kbps 40 kbps 53.6 kbps 40 kbpsGPRS (CS1-4, type 2 MS) 171.2 kbps 171.2 kbpsGPRS (CS1-4, type 1 MS) 85.6 kbps 85.6 kbps
EDGE (type 2 MS) 473.6 kbps 400 kbps 473.6 kbps 400 kbpsEDGE (type 1 MS) 236.8 kbps 200 kbps 236.8 kbps 200 kbpsEvolved EDGE (type 1 MS) 652.8 kbps 500 kbps 326.4 kbps 250 kbpsEvolved EDGE (type 2 MS) 1305.6 kbps 1.0 Mbps 652.8 kbps 500 kbps
UMTS WCDMA Rel’99 (Theoretical) 2.048 Mbps 768 kbpsUMTS WCDMA Rel’99 (Practical Terminal) 384 kbps 350 kbps 384 kbps 350 kbpsHSDPA Initial Devices 1.8 Mbps > 1 Mbps 384 kbps 350 kbps
HSDPA Current Devices 3.6 Mbps > 2 Mbps48 384 kbps 350 kbpsHSDPA Future Devices 7.2 Mbps > 3 Mbps 384 kbps 350 kbpsHSDPA Theoretical Peak 14.4 Mbps 5.76 MbpsHSPA Initial Implementation 7.2 Mbps > 4 Mbps 1.46 Mbps 1 MbpsHSPA Future Implementation 7.2 Mbps 5.76 MbpsHSPA Theoretical Peak 14.4 Mbps 5.76 Mbps
HSPA+ (2X2 MIMO, 16-QAM) 28 Mbps 11.5 Mbps3GPP LTE Targets (in 20 MHz bandwidth) 100 Mbps 50 Mbps
Downlink Uplink

Performance Analysis of 3G Communication Network 139
Peak Network speed
peak Achievable User Rate
Peak Network
speed
peak Achievable User Rate
CDMA2000 1XRTT 153 kbps 130 kbps 153 kbps 130 kbpsCDMA2000 1XRTT Theoretical Peak 307 kbps 307 kbpsCDMA2000 EV-DO Rev 0 2.4 Mbps > 1 Mbps 153 kbps 150 kbpsCDMA2000 EV-DO Rev 0 Theoretical Peak 2.4 Mbps 307 kbpsCDMA2000 EV-DO Rev A expected and theoretical 3.1 Mbps > 1 Mbps 1.8 Mbps 900 kbpsCDMA2000 EV-DO Rev B expected (3 radio channels) 9.3 Mbps 5.4 MbpsCDMA2000 EV-DO Rev B Theoretical (15 radio channels) 73.5 Mbps 27 Mbps
CDMA2000 EV-DO Rev C Goals 100 Mbps 50 Mbps
802.16e WiMAX expected phase 1 (10 MHs TDD DL/UL=3, 1x2 SIMO) 23 Mbps 4 Mbps802.16e WiMAX expected phase 2 (10 MHs TDD DL/UL=3, 2x2 MIMO) 46 Mbps 4 Mbps
Downlink Uplink
Type 1 EDGE MS refers mobile station that can provide 59.2 kbps in each eight timeslots, adding up to a peak network rate of 473.6 kbps in eight timeslots. Evolved EDGE for type 1 MS refers mobile station that can receive on up to eight timeslots using two radio channels and can transmit on up to four timeslots in one radio channel using 16 QAM modulation with turbo coding. Meanwhile, type 2-evolved EDGE MS refers mobile station that can receive on up to 16 times slots using two radio channels and can transmit on up to eight timeslots in one radio channel using 16 QAM modulation with turbo coding. Peak network speed for type 2 evolved EDGE MS is 1305.6 kbps and this translates to a user-achievable data rate of over 1 Mbps.
With respect to data performance, each data timeslot can deliver peak user-achievable data rates of about 10 kbps with GPRS for coding schemes 1 and 2, which are the most common in deployments and up to about 50 kbps with EDGE. The network can aggregate up to four of these on the downlink with current devices. If using four timeslot devices, peak user-achievable throughput rates of up to 40 kbps with GPRS and up to 200 kbps with EDGE. Users have
140 Toni Anwar & Lim Wern Li
the same effective access speed as a modem but with the convenience connecting from anywhere.
In UMTS WCDMA Release 99, the maximum theoretical downlink rate is just over 2 Mbps and uplink is 768 kbps. However, in practical terminal, peak downlink network speeds are 384 kbps and uplink peak network throughput rates are also 384 kbps. Users will obtain peak throughput rates that are lower than peak network rates that are 350 kbps in commercial networks and user-achievable peak rates in uplink are also 350 kbps It is because user-achievable throughput depends on the channel sizes the operator chooses to make available, the capabilities of devices, and the number of users active in the network. In the HSDPA, the maximum theoretical downlink rate is 14.4 Mbps but initial devices are just 1.8 Mbps. For HSDPA current devices, users will obtain peak throughput rates are over 2Mbps. High Speed Packet Access (HSPA) consists of systems supporting both High Speed Downlink Packet Access (HSDPA) and High Speed Uplink Packet Access (HSUPA).
CDMA 2000 consists of One Carrier Radio Transmission Technology (1xRTT) and Evolved, Data Optimized (1xEV-DO) version. In CDMA 2000 1xRTT, the maximum theoretical downlink rate is just 307 kbps and uplink are also 307 kbps. Current network versions are based on the EV-DO Rev 0 specification and the peak network rate downlink is 2.4 Mbps. Then, the current network versions will continue enhance to EV-DO Rev A, Rev B and Rev C. The peak network speed downlink will continue increase from 3.1 Mbps to 100 Mbps (EV-DO Rev A to Ev-DO Rev C).
4.7 Representative Scenarios for HSDPA Throughput Figure 4 until Figure 8 show test results from a network in Europe that was lightly loaded with respect to data but supporting voice traffic. The distribution represents HSDPA performance. Actual performance will vary by network, geography, network load, devices, and so forth [20]. Similar result has been confirmed by a network operator in Asia.
From the figure below, the line is the Cumulative Distribution Function (CDF), which shows the probability of throughput being at least that high and the column is the Probability Distribution Function (PDF).
Figure 4 shows distribution of HSDPA throughput under favorable radio conditions. In these conditions, Received signal code power (RSCP) was -70 dBm and the Signal Energy per chip over Noise Power Spectral Density (Ec/No) was -4.5 dB, with peak network rate is 1.8 Mbps.

Performance Analysis of 3G Communication Network 141
Figure 4 Histogram of HSDPA throughput under favorable radio conditions.
These tests are done with a single sector without interference from adjacent sectors or sites. The mobiles are located near the base station and the coverage is relatively good, i.e. the thermal noise component in the total amount of noise is minimized because the Signal Energy per chip over Noise Power Spectral Density (Ec/No) was -4.5 dB. In term of RSCP good coverage means better than -90dBm conditions. We can say that these tests are carried out in good conditions because the the received power level was -70dBm and Ec/No was -4.5dB and the results were shown in the Figure 4.
In Figure 4, the cumulative distribution function (CDF) corresponds to the case in which fair time scheduling is employed. Fair time scheduling means that the same power is allocated to all users with better channel conditions experience a higher throughput. Though measured values were higher under good radio conditions, the median bit rate measured was 1.48 Mbps. In the Figure 4 can note that the throughput was high in the good condition.
Figure 5 shows the distribution of HSDPA throughput under unfavorable radio conditions. In these conditions, Received signal code power (RSCP) was -110 dBm and the Signal Energy per chip over Noise Power Spectral Density (EC/N0) was -13 dB.
These tests are done in poor coverage conditions because the received power was -110 dBm and the Ec/No was to high (-13 dB). The mobiles are located far from the base station and the coverage is relatively poor, i.e. the thermal noise component in the total amount of noise could not be negligible.

142 Toni Anwar & Lim Wern Li
Figure 5 Histogram of HSDPA throughput under unfavorable radio conditions.
Though measured values were lower than under good radio conditions, the median rate was still quite high, at 930 kbps. From the Figure 5 can note that throughput is less when there are more users the individual.
Figure 6 Histogram of HSDPA throughput under favorable radio conditions while mobile.

Performance Analysis of 3G Communication Network 143
Figure 6 shows the distribution of throughput measured with favorable radio conditions while driving through a coverage area. In this test, Received signal code power (RSCP) was -70 dBm and the Signal Energy per chip over Noise Power Spectral Density (EC/N0) was -5.5 dB. The median throughput rate was still 1.2 Mbps.
From figure above notes that that throughput is high when at the area with favorable conditions and throughput will reduce when moving to the area with less favorable conditions. From here, we can get the range of data rates experienced by the user when user move from an area with favorable conditions to areas with less favorable conditions.
4.8 Release 99 and HSUPA Performance
Figure 7 shows the average throughputs when using a Release 99 128 kbps Bearer, or a Release 99 384 kbps Bearer, and when using HSUPA in a system limited to 1.46 Mbps maximum throughput. It plots throughputs versus cell range and shows operation at 1,900 MHz, in a suburban area with 10 simultaneous Voice users. The cell range is only one of the dimensions that can affect the average throughput. [20]
Figure 7 Average Release 99 uplink and HSUPA throughput.
Uplink cell range depends on the transmitted data rate. The throughput will reduce when the distance is increase. Let say we use HSUPA in a system limited to 1.46 Mbps, the throughput is over 1000 kbps at 0.40 km and will reduce to 100 kbps at3.80 km. Besides that, average throughput will increase if

144 Toni Anwar & Lim Wern Li
uplink rate is increase. For example, when using HSUPA in a system limited to 1.46 Mbps is will get higher average throughput if compare to the Release 99 128 kbps bearer or Release 99 384 kbps bearer.
4.9 Latency Figure 8 shows the latency of different 3GPP technologies [19, 20]. Each successive data technology from GPRS forward reduces latency, with HSDPA having latency as low as 70 msec. HSUPA brings latency down even further. Ongoing improvements in each technology mean all these values will go down as vendors and operators fine-tune their systems. Reducing overall latency will reduce the Transmission Time Interval (TTI). This will have a dramatic effect on application throughput for many applications.
With respect to Figure 8, EDGE Release 4 significantly reduced EDGE Release 99 latency from the typical 500 to 600 msec to about 300 msec. Reduction of latency for initial access and round-trip time, enabling support for conversational services such as Voice over Internet Protocol (VoIP) and Push-to-talk over Cellular ( PoC )
Figure 8 Latency of different technologies.
The values shown above reflect measurements in commercial networks. Some vendors have reported significantly lower values in networks using their equipment, such as 150 msec for EDGE and 70 msec for HSDPA.
Since WCDMA round trip time is similar to the fixed Internet round trip time that can be seen for inter-continental connections or for dial-up connections, we may expect that those applications that are designed for fixed Internet typically perform at least satisfactorily when used over the WCDMA air interface. WCDMA round trip time will reduce when product platforms are optimized and
Performance Analysis of 3G Communication Network 145
when HSDPA with shorter Transmission Time Interval (TTI=interleaving) is introduced. It is 70 msec for HSDPA.
A shorter round trip time gives a benefit in the response time, which is especially advantageous for TCP slow start and for interactive services with small packets, like gaming. For example, real time network games may require very short delays such as action games typically require 200ms or even shorter round trip time from the UE to the server and back for good quality games. The current WCDMA and HSDPA delay is short enough even real time action games with acceptable quality.
4.10 HSPA Improved Service Experience
4.10.1 Music Downloads for HSDPA
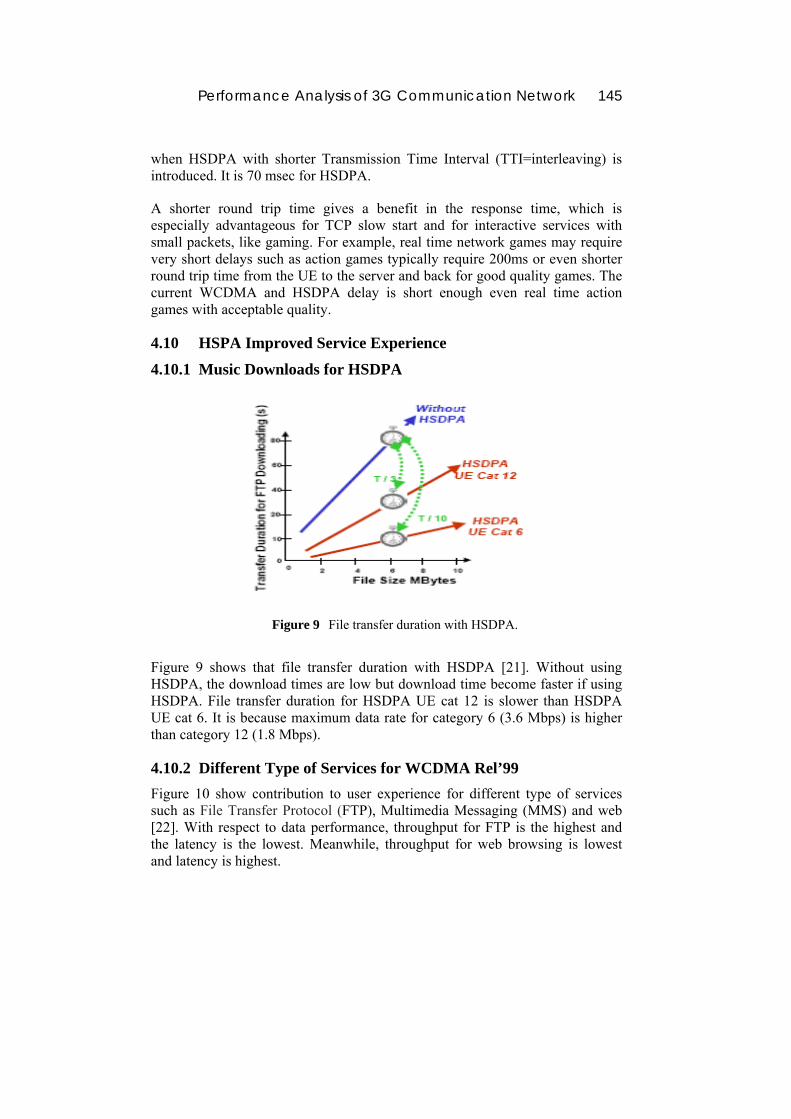
Figure 9 File transfer duration with HSDPA.
Figure 9 shows that file transfer duration with HSDPA [21]. Without using HSDPA, the download times are low but download time become faster if using HSDPA. File transfer duration for HSDPA UE cat 12 is slower than HSDPA UE cat 6. It is because maximum data rate for category 6 (3.6 Mbps) is higher than category 12 (1.8 Mbps).
4.10.2 Different Type of Services for WCDMA Rel’99 Figure 10 show contribution to user experience for different type of services such as File Transfer Protocol (FTP), Multimedia Messaging (MMS) and web [22]. With respect to data performance, throughput for FTP is the highest and the latency is the lowest. Meanwhile, throughput for web browsing is lowest and latency is highest.

146 Toni Anwar & Lim Wern Li
Figure 10 Contribution to user experience for different type of services for WCDMA Release 99.
The end user performance measures for applications that we look at are service set-up times, response time during service usage and perceived user plane quality of information presentation such throughput picture, quality etc. Besides, end-user performance depends on the type of service and the behavior of higher-layer application protocols. For instance, TCP (Transmission Control Protocol), which is commonly used for packet data services, was originally designed for wired networks and includes slow start and congestion-avoidance mechanisms that strongly influence performance.
In web browsing, the slow-start mechanism in TCP has little or no impact on the time it takes to download a large file. End-user performance depends on the data rate of the radio link. A single user downloading a large file can occupy a significant amount of the total cell capacity. Consequently, system load has a substantial impact on the perceived performance when end-users download large files. It means that it need longer time to download large files. As a result latency will increase and the throughput will reduce.
From the figure above can conclude that shorter download and upload times as a result of higher bit-rates and reduced latency. HSPA technology will reduce the production cost per bit through greater system capacity. In other words, more users can be served with higher bit-rates at a lower production cost.
4.11 Spectral Efficiency
4.11.1 Downlink Spectral Efficiency Figure 11 shows the comparison the downlink spectral efficiency of different wireless technologies, based on consensus view of 3GAmerica’s members’ contribution [7, 19, 20]. It shows the continuing evolution of the capabilities of all the technologies.

Performance Analysis of 3G Communication Network 147
Figure 11 Comparison of downlink spectral efficiency.
Relative to WCDMA Release 99, HSDPA increases capacity by almost a factor of three. Minimum Mean Square Error (MMSE) equalization will further increase capacity by a factor of approximately 20 percent, and Mobile Receive Diversity (MRxD) will boost capacity by a factor of approximately 50 percents. MMSE and MRxD can be used jointly, producing almost a doubling of HSDPA spectral efficiency. Significant additional gains are available in HSPA+ with MIMO. Beyond HSDPA, 3GPP LTE will also result in further gains in spectral efficiency, with spectral efficiency two to three times that of Release 6 HSPA. Similar gains are available for CDMA2000
In high-density mobile environments, such as in cities, the mobile terminal is often affected by multi-path interference and the received signal contains multiple noisy time-delayed copies of the desired signal. This interference can cause deep fading and even nulls at the receiver.
Multi-path effects can also cause inter-symbol interference (ISI), whereby temporal spreading and overlap of individual pulses reduce the receiver's ability to decode data correctly. Hence, the HSDPA concept potentially benefit equalizer concept to reduce the interference from multipath component. These equalizers counter the effects of ISI by independently tuning and decoding each time-delayed component. Minimum mean square error (MMSE) equalizers have been shown to yield superior throughput compared to conventional rake receivers for HSDPA systems of different cell geometries
148 Toni Anwar & Lim Wern Li
The Mobile Receive Diversity (MRxD) is used to remove multi-path interference from the received signal. MRxD refers receive diversity will be incorporated into the mobile device's RF subsystem. Receive diversity technique reduces base station power requirements because less power needs to be transmitted to maintain a high-quality link between the base station and the handset. Besides, receive diversity will improve throughput by more than twice that of non-diversity receivers. Hence, the receive diversity technology has been slow to make its way into handsets because it requires extra components, including an additional antenna and receive path to improve the performance of HSDPA.
The MIMO channel consists of a number of transmit and receive antennas. This module provides a supplement to the UMTS Air Interface tutorial and may be used to significantly increase user data rates and improve Quality of Service (QoS) across wireless link has generated the need to improve the spectral efficiency. Therefore it provides a good potential for future mobile communications systems, e.g. HSDPA. Therefore it provides a good potential for HSPA+.
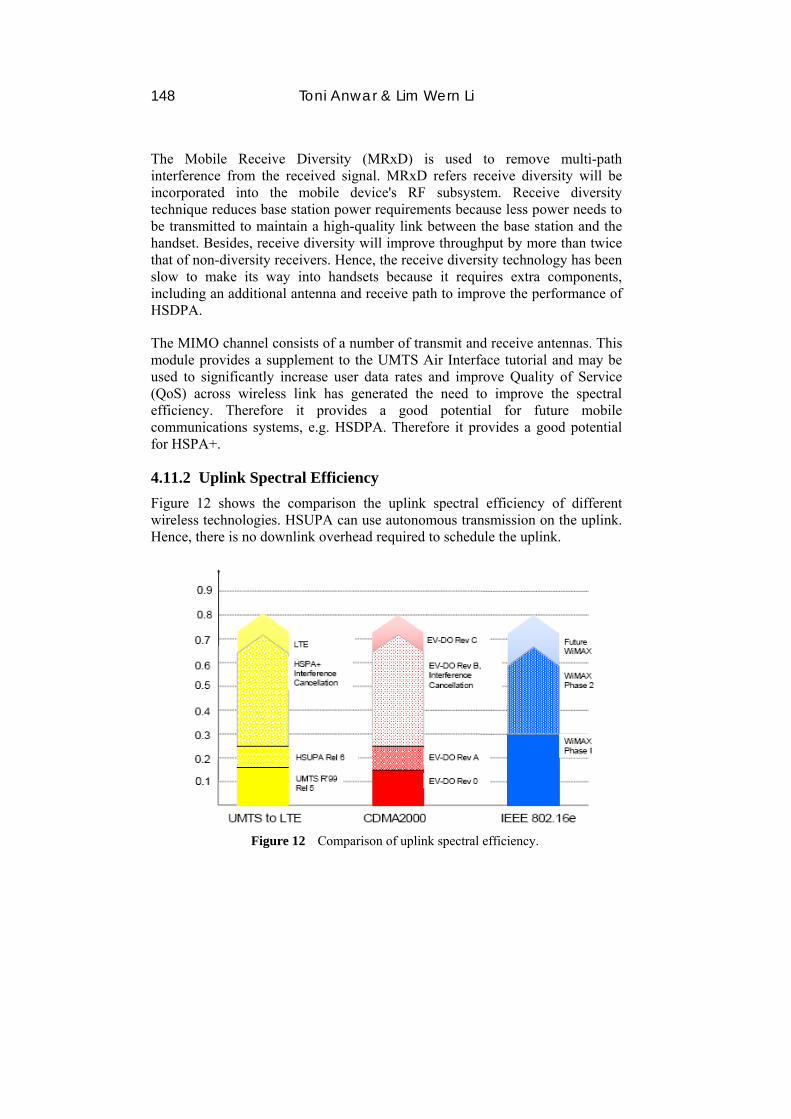
4.11.2 Uplink Spectral Efficiency Figure 12 shows the comparison the uplink spectral efficiency of different wireless technologies. HSUPA can use autonomous transmission on the uplink. Hence, there is no downlink overhead required to schedule the uplink.
Figure 12 Comparison of uplink spectral efficiency.

Performance Analysis of 3G Communication Network 149
HSUPA significantly increases uplink capacity, as does Rev A of 1xEV-DO, compared to Rev 0. OFDM-based systems can exhibit improved uplink capacity relative to CDMA technologies but this depends on factors such as the scheduling efficiency and the exact deployment scenario. 3G Americas members anticipate that CDMA can match OFDM systems via interference cancellation.
4.11.3 Voice Spectral Efficiency
Figure 13 Comparison of voice spectral efficiency.
Figure 13 compares voice spectral efficiency. For third generation wireless communication systems, such as UMTS Rel’99 with Adaptive Multi Rate (AMR) code used to support circuit voice service. HSDPA or HSUPA have been used to support the high-speed data and Internet access in cellular systems by using VoIP. By using VoIP become possible for Release 6 and then it is enhancement in Release 7 to make VoIP become higher efficient. VoIP will increase voice capacity and enable to combine voice with data functions in the packet domain. Because of these reason, operators will move voice traffic over to these high-speed data channels using Voice over IP.
For CDMA 2000, EV-DO will provide voice service by using VoIP protocols through EV-DO Rev A. EV-DO Rev A can support high-speed data same as HSUPA. Beyond EV-DO Rev A, 3GPP has introduced EV-DO Rev B which offers users high peak data rates but it does not increase overall capacity.
Improvement in VoIP will give much benefit such as it allow circuit-switched and packet-switched voice to occupy on the same radio channel, which is only possible with WCDMA/HSPA but not for EV-DO. It is because EV-DO channel is not available for circuited-switched voice.

150 Toni Anwar & Lim Wern Li
4.12 Power Consumption Comparison
Figure 14 shows a comparison of the peak mobile power dissipation while transmitting files of 2MBybes for the different technologies [19, 20]. The values include both digital processing and RF elements. Different technology has different specific power requirements impacting battery life. Improvements in battery technology will enhance all radio access technologies.
Figure 14 Comparison of power consumption of different technologies.
Since the data rates in a 3G system are much higher than 2G, the power consumption of the terminals will increase from GSM until HSDPA. The reason is, because a mobile device requires more RF power consumption and computing power for high speed data and it result battery life become shorter.
4.13 Malaysia In Malaysia, Maxis and Celcom already launched 3G network but Digi still continues to use the EDGE network. According to the information supplied by Celcom, the results displayed in the figure above show that the performance analysis use in the United States and Europe is comparable to the one that we are using now in Malaysia. The reliability of Celcom’s 3G network in Malaysia is 99.99%. More detailed data could not be provided by the company.
Speed, frequency band and service for mobile network generation in Malaysia are shown in Table 6. With respect to data performance, the 2G and 2.5 technologies operate in the frequency range from 900MHz band until 1800MHz band. Meanwhile, 3G technology operates in the frequency range from 1900 MHz until 2.1GHz. The speed for 2G is just 9.6 kbps and concerned with the provision of voice services, allowing users to transition from conventional fixed telephony to mobile telephony and SMS, which allows text messages to be sent between mobile handsets.

Performance Analysis of 3G Communication Network 151
Figure 15 Celcom 3G Peninsular coverage-Existing.

152 Toni Anwar & Lim Wern Li
Figure 16 Celcom 3G Peninsular main cities coverage-latest update.

Performance Analysis of 3G Communication Network 153
Figure 17 Celcom 3G Sarawak and Sabah main city coverage.

154 Toni Anwar & Lim Wern Li
Table 6 Network comparison [18].
2G 2.5G 3G SIGNAL GENERATOR
BTS BTS NODE B
SPEED 9.6 kbps 48kbps 384kbps FREQUENCY 900 &
1800 MHz 900 & 1800 MHz
1900 Mhz 2.1 GHz
SERVICES SMS, VOICE
MMS, VOICE
SMS,MMS,VIDEO,VOICE, DATA
The growing use of mobile data led to demand for faster speed than the 2G. A significant development of 2.5G systems can be proven by the increasing utilization in services; for example, MMS and voice. It is very common today to send pictures via MMS. Nowadays, 3G technology has been introduced in Malaysia with the speed of 384 kbps. The services are SMS, MMS, video, voice and data. In some trial cases, HSDPA, as the part of the UMTS technology could provide even the data speed as high as 2 Mbps.
The Figure 15 until Figure 17 show the coverage for Celcom 3G in Malaysia. In Peninsular Malaysia, Celcom commercially launched 3G network in ten cities. They are Kedah, Penang and Butterworth, Perlis, Perak, Melacca, Johor, Terengganu, Pahang, Negeri Sembilan, Selangor. Celcom also launched 3G network in Sabah and Sarawak. The next chapter will discuss then the overall results of the performance of 3G network.
5 Conclusion This project attempts to design and optimize conditions for third generation (3G) technologies. The project analyzed performance of the standard Universal Mobile Telecommunications system (UMTS) system and High Speed Downlink Packet Access (HSDPA) for different scenarios of user and different technologies. The data is collected and compiled from different operators in Asia, America and Europe, as the network operators did not allow the authors to analyze the performance of their network.
The UMTS/HSPA and generally the EDGE/HSPA/LTE family technology, one of the most robust portfolios of mobile-broadband technologies, provide operators and subscribers many advantages. EDGE is a global success story. The technologies’ advantages provide for broadband services that will deliver increased data revenue as well as a path to all-IP architectures. Therefore, many operators have deployed UMTS Release 99 technology to provide peak user-achievable rates of 350 kbps with current devices and to support many new high
Performance Analysis of 3G Communication Network 155
bandwidth applications. Nowadays, UMTS offers users simultaneous voice and data as well as allows operators to support voice and data across their entire available spectrum. Furthermore, UMTS network provides higher throughput and lower latency than 2G or 2.5G cellular networks.
HSDPA and its advanced evolution can compete against any other technology in the world, and it is widely expected that most UMTS operators will eventually upgrade to this technology. HSDPA offers the highest peak data rates of any widely available wide-area wireless technology, a broadband data service with peak user achievable rates of over 1 Mbps in initial deployments and over 2 Mbps in current device. Today’s HSDPA devices can support peak network rates of 3.6 Mbps, the lowest latency of any widely available wide-area wireless technology and the technology itself has a theoretical maximum network rate of 14.4 Mbps. With continued evolution to HSDPA, peak data rates keep increasing, throughput increases, spectral efficiency increases, and latency decreases. The result is support for more users at higher speeds with more applications enabled. Application scope will also increase with quality-of-service control and multimedia support. Greater efficiencies will translate to more competitive offers, greater network usage, and increased revenues.
Same as HSDPA, HSUPA improves throughput speeds and spectral efficiency for the uplink. Continual HSPA and enhancements are planned. Beginning with enhanced uplink performance, advanced receivers in the mobile and the in the base station, then other innovations, such as MIMO are being studied right now. This improvement will extend HSPA capability even further. HSPA will improve data speeds per user, service latency and network capacity. Besides, HSPA offers new services such as multi-player gaming and Voice over Internet Protocol (VoIP) and improves the experience of services like music downloads. HSPA+ even will have peak network rates of 28 Mbps or higher, and in 5 MHz will match LTE capabilities, whereas LTE will provide an extremely efficient OFDMA-based platform for future networks.
The results of the performance analysis are able to cover the basic expected operation conditions, as well as provide guidance in the design of the wireless networks using them as an optimum framework for realizing the potential of the wireless-data market.
References [1] Angelika Zobel, Claudia Simoni, Davide Piazza, Xavier Nuñez, Daniel
Rodríguez, Security of Software and Service for Mobile Systems, 2006.

156 Toni Anwar & Lim Wern Li
[2] Peter Rysavy, Mobile Broadband: EDGE, HSPA and LTE’ Citing from internet sources URL 3gamericas.org/pdfs/white_papers/2006_Rysavy _Data_Paper_FINAL_09.15.06.pdf, 2006.
[3] Clint Smith and Daniel Collins, 3G Wireless Networks, McGraw-Hill Companies, Inc., Publication, 2002.
[4] van Stojmenovic, Handbook of Wireless Networks and Mobile Computing’, John Wiley & Sons, Inc. Publication, 2002.
[5] Sami I Mäkeläinen, Service-based Requirements for Future Mobile Networks, Citing from internet sources URL http://ethesis. helsinki.fi/julkaisut/mat/tieto/pg/makelainen/serviceb.pdf, 2006.
[6] Weimin Xiao, Amitava Ghosh, Dennis Schaeffer, Lawrence Downing, Voice over IP (VoIP) over Cellular: HRPD-A and HSDPA/HSUPA, Citing from internet sources URL http://ieeexplore.ieee.org/iel5/10422/33099/01559058.pdf?arnumber=1559058M, 2005.
[7] 3G Americas: Global UMTS HSDPA Status Update, Citing from internet sources URL: http://www.3gamericas.org/pdfs/ Global_3G_Status_Update.pdf, Feb 2007.
[8] Definition of: cellular generations, Citing from internet sources URL http://www.pcmag.com/encyclopedia_term/0,2542,t=wireless+generations&i=55406,00.asp.
[9] Harri Holma and Antti Toskala, WCDMA for UMTS – Radio Access for Third Generation Mobile Communications, third edition, John Wiley & Sons, Inc., Publication, 2004.
[10] High-Speed Downlink Packet Access, Citing from internet source URL http://en.wikipedia.org/wiki/HSDPA.
[11] High-Speed Uplink Packet Access, Citing from internet sources URL http://en.wikipedia.org/wiki/High-Speed_Uplink_Packet_Access.
[12] UMTS Forum, 3G/UMTS Towards mobile broadband and personal Internet, Citing from internet sources URL http://www.umts-forum.org/servlet/dycon/ztumts/umts/Live/en/umts/MultiMedia_PDFs_Papers_Towards-Mobile-Broadband-Oct05.pdf, 2005.
[13] Dr. Jonathan P. Castro, The UMTS Network and Radio Access Technology- Air Interface Techniques for Future Mobile Systems, John Wiley & Sons, Inc., Publication, 2001.
[14] GSM to 3G and Beyond, Citing from internet sources URL http://www.3gamericas.org/English/PDFs/tech_stats.pdf, February 5, 2007.
[15] Gustavo Nader, Radio Link Performance of Third Generation (3G) Technologies for Wireless Networks, Citing from internet sources URL http://scholar.lib.vt.edu/theses/available/etd-05062002-143129/unrestricted/GNthesis.pdf, 2002.

Performance Analysis of 3G Communication Network 157
[16] Mobile Signaling Analyzer - J7326A & J5486B, Citing from internet sources URL http://www.phoenixdatacom.com/signaling-analyzer.html
[17] Mohsen Sarraf and M.R. Karim, W-CDMA and cdma2000 for 3G Mobile Networks’, McGraw-Hill Companies, Inc., Publication, 2002.
[18] Celcom: Presentation of Celcom to USM, Celcom Office, Kuala Lumpur, Malaysia, 11 October 2006.
[19] 3G Americas, Mobile Broadband: The Global Evolution of UMTS/HSPA – 3GPP Release 7 and Beyond’, Citing from internet sources URL http://www.3gamericas.org/English/pdfs/wp_UMTS_Rel7_Beyond_FINAL.pdf, 2006.
[20] Regis J. (Bud) Bates, Broadband Telecommunications Handbook, Second Edition McGraw−Hill Companies, Inc. Publication, 2002.
[21] Gerry Collins, HSPA Market Overview, Citing from internet sources URL http://www.umts-forum.org/servlet/dycon/ztumts/umts/Live/en/umts/ MultiMedia_Presentations_UMTSForum-HSxPA-Marcus-Evans-final.pdf, 2006.
[22] Ericsson, Basic Concepts of OF HSPA, Citing from internet sources URL: http://www.ericsson.com/technology/whitepapers/3087_basic_ conc_hspa_a.pdf, 2007.
[23] Markus Fiedler, Lennart Isaksson, Stefan Chevul, Johan Karlsson, Peter Lindberg, Measurements and Analysis of Application-Perceived Throughput via Mobile Links, Citing from internet sources URL www.bth.se/fou/Forskinfo.nsf/all/38dc0d67065b27adc1257077004decae/$file/I-05.pdf.