peregrine academic services - gardner-webb...
TRANSCRIPT

Comparative Analysis Report for:
Gardner-Webb University
Academic Level: BachelorsDecember 2011 - January 2012
Included Course(s): ACCT-213, BADM-480Sample Size(s): 50 Inbound Exams, 22 Outbound Exams
Gardner-Webb University Summary Analysis December 2011 - January 2012
3HUHJULQH�$FDGHPLF�6HUYLFHV��//&� 3DJH���RI�����

Prepared By:Peregrine Academic Services, LLCP.O. Box 741Gillette WY 82717-0741Phone (307) 685-1555Please direct questions to [email protected]
Gardner-Webb University Summary Analysis December 2011 - January 2012
3HUHJULQH�$FDGHPLF�6HUYLFHV��//&� 3DJH���RI�����
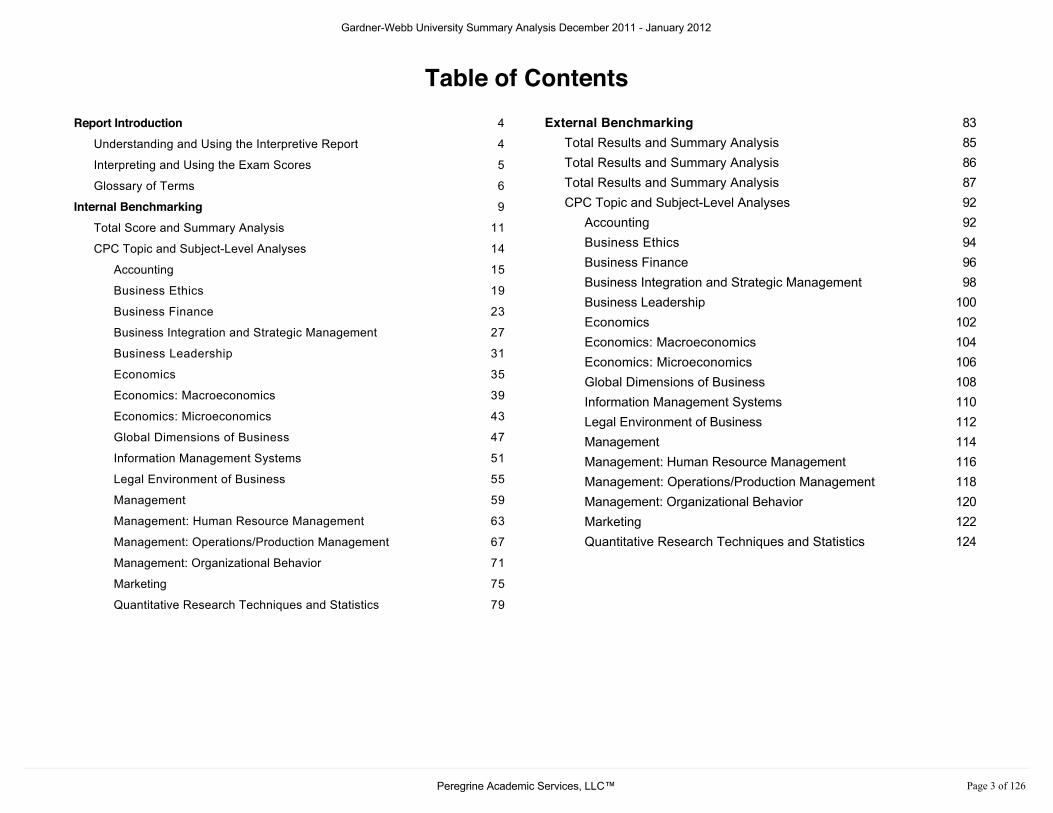
Table of ContentsExternal Benchmarking 83
Total Results and Summary Analysis 85Total Results and Summary Analysis 86Total Results and Summary Analysis 87CPC Topic and Subject-Level Analyses 92
Accounting 92Business Ethics 94Business Finance 96Business Integration and Strategic Management 98Business Leadership 100Economics 102Economics: Macroeconomics 104Economics: Microeconomics 106Global Dimensions of Business 108Information Management Systems 110Legal Environment of Business 112Management 114Management: Human Resource Management 116Management: Operations/Production Management 118Management: Organizational Behavior 120Marketing 122Quantitative Research Techniques and Statistics 124
Report Introduction 4
Understanding and Using the Interpretive Report 4
Interpreting and Using the Exam Scores 5
Glossary of Terms 6
Internal Benchmarking 9
Total Score and Summary Analysis 11
CPC Topic and Subject-Level Analyses 14
Accounting 15
Business Ethics 19
Business Finance 23
Business Integration and Strategic Management 27
Business Leadership 31
Economics 35
Economics: Macroeconomics 39
Economics: Microeconomics 43
Global Dimensions of Business 47
Information Management Systems 51
Legal Environment of Business 55
Management 59
Management: Human Resource Management 63
Management: Operations/Production Management 67
Management: Organizational Behavior 71
Marketing 75
Quantitative Research Techniques and Statistics 79
Gardner-Webb University Summary Analysis December 2011 - January 2012
3HUHJULQH�$FDGHPLF�6HUYLFHV��//&� 3DJH���RI�����
R e p o r t I n t r o d u c t i o n
Understanding and Using the Interpretive ReportU n d e r s t a n d i n g a n d U s i n g t h e I n t e r p r e t i v e R e p o r t
The purpose of the following analyses is to assist academic program managers and assessment coordinators with program-level direct assessment of the College/University business programs. These data should be used to assess the strengths andopportunities for improvement associated with the business academic programs based upon the knowledge levels of thestudents regarding the foundational learning outcomes of the business degree curriculum.
An Inbound Exam/Outbound Exam testing construct provides data for internal benchmarking. The inbound exam evaluates thestudent's knowledge level towards the beginning of the student's program of study. The outbound exam assesses the studentsknowledge level at the end of the student's program of study. The difference in results between the inbound and outboundexams is the direct measure of learning for internal benchmarking.
Outbound exam results are relative. Outbound exam relevancy is understood best in terms of the change in knowledge levelfrom the time a student enters the program compared to when they graduate from the program.
If identified, cohort level analyses provides program administrators with comparative information based upon the student cohortgroups that the school has identified. Side-by-side comparisons are shown in this report to assist program managers withprogram-level analysis.
External comparisons of outbound scores with the aggregate data pool should only be used as a relative index of how theassessed program compares with other programs. There is a high degree of variability between business schools with respectto specific curriculums and areas of emphasis or concentrations. Comparisons include other schools with relatively similarstudent populations and educational delivery means, not necessarily based on the exact curriculum of the business program(which would be nearly impossible and most likely unrealistic).
Gardner-Webb University Summary Analysis December 2011 - January 2012
3HUHJULQH�$FDGHPLF�6HUYLFHV��//&� 3DJH���RI�����

Interpreting and Using the Exam ScoresI n t e r p r e t i n g a n d U s i n g t h e E x a m S c o r e s
Inbound exam results are obtained from incoming students who have not yet completed their advance program of study.Cumulative inbound exam results are only used relative to the cumulative outbound results to directly measure academiclearning. Individual student results from inbound exams (provided in a separate file) can be used to help guide, advise, andplace a student within a program of study; however, individual results should generally not be used for academic gradingpurposes other than perhaps extra credit (or some other incentive) to complete the exam.
Outbound exam results are a direct measure of academic learning since the students taking the outbound exams havecompleted or nearly completed the degree program.
Outbound exam results, both cumulatively and individually DO NOT correspond directly to a traditional academic grading scale.The exam is relative to only to the inbound results as well as the external aggregate comparisons. Therefore, academic gradingof a student's outbound results as well as interpreting cumulative outbound exam results should be done only on a relative scaleas opposed to a traditional academic grading scale.
To encourage students to do their best with the outbound exams, an incentive is usually needed. Exam incentives include adirect grade, grading for extra credit if the result is above a certain threshold, or credit for a future assignment/activity within acourse. In general, using an extra credit or credit in lieu of a future assignment is the best approach.
The following table shows an approximate relationship between the CPC-Based COMP exam results and relative studentperformance based upon competency level.
CPC-Based COMPExam Score
Relative Interpretation ofStudent Competency
80-100% Very High70-79% High60-69% Above Average40-59% Average30-39% Below Average20-29% Low
0-19% Very Low
If specific academic credit (grade and points) are to beawarded to students based on their exam results, the tableto the left could be used to assign letter grades, extra credit,and/or course points, assuming that the exam is includedwithin a course.
Abandoned exams are not included in the data set for thisreport.
Gardner-Webb University Summary Analysis December 2011 - January 2012
3HUHJULQH�$FDGHPLF�6HUYLFHV��//&� 3DJH���RI�����
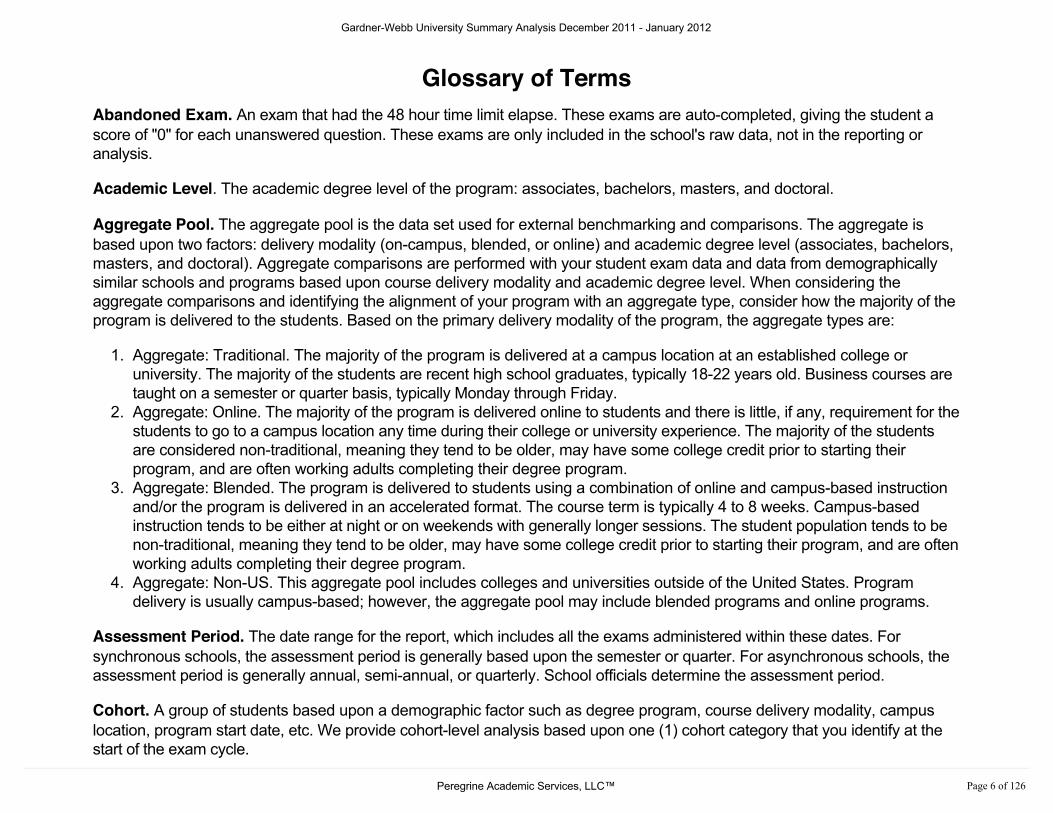
Glossary of TermsG l o s s a r y o f T e r m s
Abandoned Exam. An exam that had the 48 hour time limit elapse. These exams are auto-completed, giving the student ascore of "0" for each unanswered question. These exams are only included in the school's raw data, not in the reporting oranalysis.
Academic Level. The academic degree level of the program: associates, bachelors, masters, and doctoral.
Aggregate Pool. The aggregate pool is the data set used for external benchmarking and comparisons. The aggregate isbased upon two factors: delivery modality (on-campus, blended, or online) and academic degree level (associates, bachelors,masters, and doctoral). Aggregate comparisons are performed with your student exam data and data from demographicallysimilar schools and programs based upon course delivery modality and academic degree level. When considering theaggregate comparisons and identifying the alignment of your program with an aggregate type, consider how the majority of theprogram is delivered to the students. Based on the primary delivery modality of the program, the aggregate types are:
1. Aggregate: Traditional. The majority of the program is delivered at a campus location at an established college oruniversity. The majority of the students are recent high school graduates, typically 18-22 years old. Business courses aretaught on a semester or quarter basis, typically Monday through Friday.
2. Aggregate: Online. The majority of the program is delivered online to students and there is little, if any, requirement for thestudents to go to a campus location any time during their college or university experience. The majority of the studentsare considered non-traditional, meaning they tend to be older, may have some college credit prior to starting theirprogram, and are often working adults completing their degree program.
3. Aggregate: Blended. The program is delivered to students using a combination of online and campus-based instructionand/or the program is delivered in an accelerated format. The course term is typically 4 to 8 weeks. Campus-basedinstruction tends to be either at night or on weekends with generally longer sessions. The student population tends to benon-traditional, meaning they tend to be older, may have some college credit prior to starting their program, and are oftenworking adults completing their degree program.
4. Aggregate: Non-US. This aggregate pool includes colleges and universities outside of the United States. Programdelivery is usually campus-based; however, the aggregate pool may include blended programs and online programs.
Assessment Period. The date range for the report, which includes all the exams administered within these dates. Forsynchronous schools, the assessment period is generally based upon the semester or quarter. For asynchronous schools, theassessment period is generally annual, semi-annual, or quarterly. School officials determine the assessment period.
Cohort. A group of students based upon a demographic factor such as degree program, course delivery modality, campuslocation, program start date, etc. We provide cohort-level analysis based upon one (1) cohort category that you identify at thestart of the exam cycle.
Gardner-Webb University Summary Analysis December 2011 - January 2012
3HUHJULQH�$FDGHPLF�6HUYLFHV��//&� 3DJH���RI�����
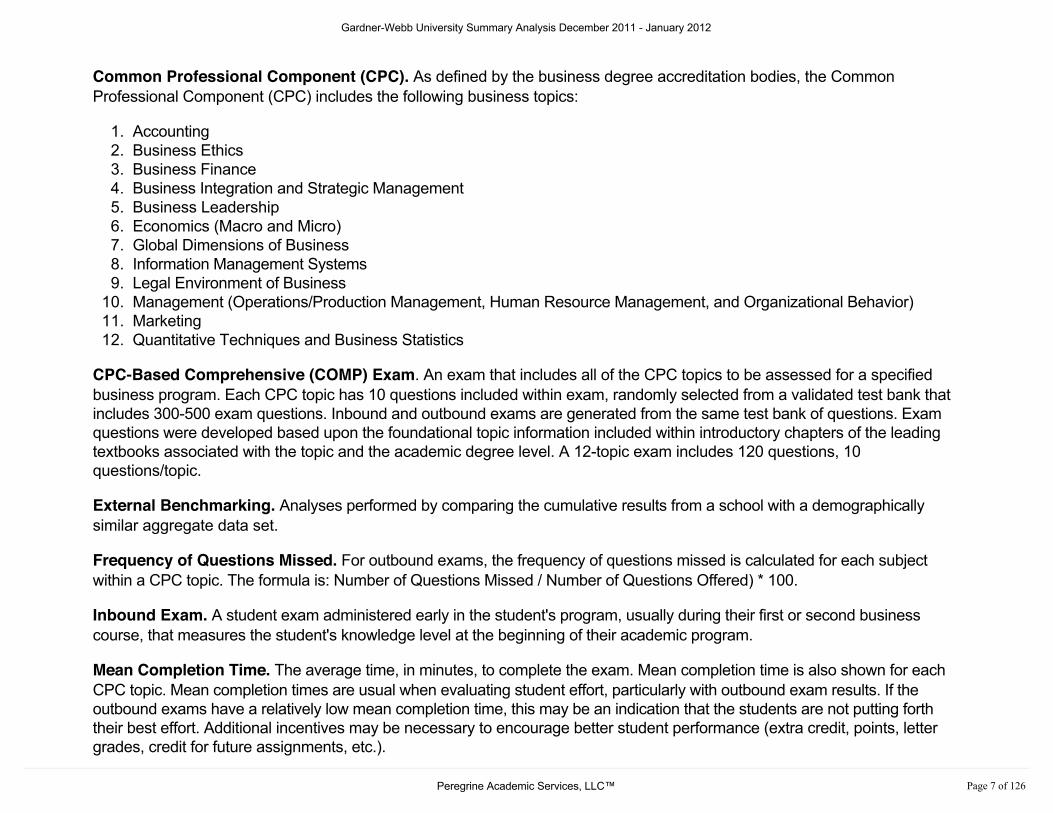
Common Professional Component (CPC). As defined by the business degree accreditation bodies, the CommonProfessional Component (CPC) includes the following business topics:
1. Accounting2. Business Ethics3. Business Finance4. Business Integration and Strategic Management5. Business Leadership6. Economics (Macro and Micro)7. Global Dimensions of Business8. Information Management Systems9. Legal Environment of Business
10. Management (Operations/Production Management, Human Resource Management, and Organizational Behavior)11. Marketing12. Quantitative Techniques and Business Statistics
CPC-Based Comprehensive (COMP) Exam. An exam that includes all of the CPC topics to be assessed for a specifiedbusiness program. Each CPC topic has 10 questions included within exam, randomly selected from a validated test bank thatincludes 300-500 exam questions. Inbound and outbound exams are generated from the same test bank of questions. Examquestions were developed based upon the foundational topic information included within introductory chapters of the leadingtextbooks associated with the topic and the academic degree level. A 12-topic exam includes 120 questions, 10questions/topic.
External Benchmarking. Analyses performed by comparing the cumulative results from a school with a demographicallysimilar aggregate data set.
Frequency of Questions Missed. For outbound exams, the frequency of questions missed is calculated for each subjectwithin a CPC topic. The formula is: Number of Questions Missed / Number of Questions Offered) * 100.
Inbound Exam. A student exam administered early in the student's program, usually during their first or second businesscourse, that measures the student's knowledge level at the beginning of their academic program.
Mean Completion Time. The average time, in minutes, to complete the exam. Mean completion time is also shown for eachCPC topic. Mean completion times are usual when evaluating student effort, particularly with outbound exam results. If theoutbound exams have a relatively low mean completion time, this may be an indication that the students are not putting forththeir best effort. Additional incentives may be necessary to encourage better student performance (extra credit, points, lettergrades, credit for future assignments, etc.).
Gardner-Webb University Summary Analysis December 2011 - January 2012
3HUHJULQH�$FDGHPLF�6HUYLFHV��//&� 3DJH���RI�����
Internal Benchmarking. Analyses performed by comparing the inbound and outbound exam scores and/or by the analyses ofthe frequency of questions missed for each subject within a CPC topic.
Outbound Exam. A student exam administered at the end of the student's academic program, usually within their last course,that measures the student's knowledge level at the end of their academic program.
Percentage Change. The percentage change between two scores. For inbound/outbound testing, the percentage change iscalculated using the following formula: (Outbound Score / Inbound Score) - 1.
Percentage Difference. The percentage difference between a school's outbound student results and the aggregate,calculated using the following formula: $JJUHJDWH�6FRUH�±�6FKRRO�6FRUH.
Percent Change Comparison. The percent difference between the school's percent change between inbound and outboundexam results and the aggregate pool's percent change between inbound and outbound exam results. The percent changecomparison represents a relative learning difference between the specific school and demographically similar schools.
Scatter Plot. A visual representation of the exam results for all students. The purpose of the scatter plot is to provide you with avisual reference for the ranges in results.
Subjects. For each CPC topic, questions are grouped using 4-8 subject areas. CPC subjects generally correspond to theschool's learning outcomes associated with each CPC topic.
Subtopic. For the CPCs of Economics and Management, there are identified subtopics. For the CPC topic of Economics, thesubtopics are Macroeconomics and Microeconomics. For the CPC topic of Management, the subtopics areOperations/Production Management, Human Resource Management, and Organizational Behavior.
Summary Statistics. Includes the mean completion time, sample size, average score, standard deviation, and themin/max/median/mode scores.
Gardner-Webb University Summary Analysis December 2011 - January 2012
3HUHJULQH�$FDGHPLF�6HUYLFHV��//&� 3DJH���RI�����

I n t e r n a l B e n c h m a r k i n g
Internal BenchmarkingGardner-Webb University
Academic Level: BachelorsDecember 2011 - January 2012
Included Course(s): ACCT-213, BADM-480Sample Size(s): 50 Inbound Exams, 22 Outbound Exams
Gardner-Webb University Summary Analysis December 2011 - January 2012
3HUHJULQH�$FDGHPLF�6HUYLFHV��//&� 3DJH���RI�����

Internal Benchmarking
Internal benchmarking is conducted using a variety of statistical tools based upon outbound exam results with or withoutinbound exam results.
With inbound exam results, internal benchmarking includes a direct comparison (percentage change) between the student'sinbound exam results with the student's outbound exam results. These results include cumulative result (the cumulativesummary of all CPC topic assessed on the exam) as well as individual results on each of the CPC topics assessed with theexam.
Internal benchmarking also includes scatter plots of exam results so that program managers can readily see how studentsperformed on the exam.
The following table shows an approximate relationship between the CPC-Based COMP exam results and relative studentperformance based upon competency level.
CPC-Based COMPExam Score
Relative Interpretation ofStudent Competency
80-100% Very High70-79% High60-69% Above Average40-59% Average30-39% Below Average20-29% Low
0-19% Very Low
If specific academic credit (grade and points) are to beawarded to students based on their exam results, the tableto the left could be used to assign letter grades, extracredit, and/or course points, assuming that the exam isincluded within a course.
Gardner-Webb University Summary Analysis December 2011 - January 2012
3HUHJULQH�$FDGHPLF�6HUYLFHV��//&� 3DJH����RI�����
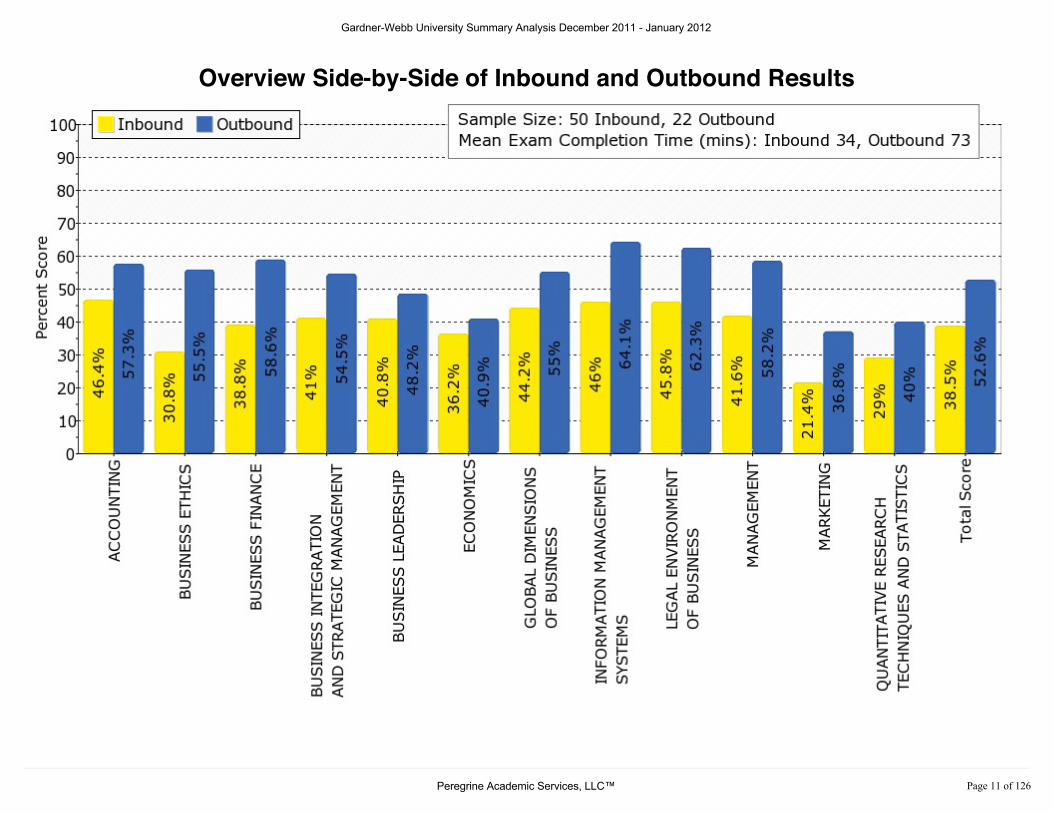
Overview Side-by-Side of Inbound and Outbound ResultsT o t a l S c o r e a n d S u m m a r y A n a l y s i s
Gardner-Webb University Summary Analysis December 2011 - January 2012
3HUHJULQH�$FDGHPLF�6HUYLFHV��//&� 3DJH����RI�����

Scatter Plot: Inbound Total Results
Gardner-Webb University Summary Analysis December 2011 - January 2012
3HUHJULQH�$FDGHPLF�6HUYLFHV��//&� 3DJH����RI�����
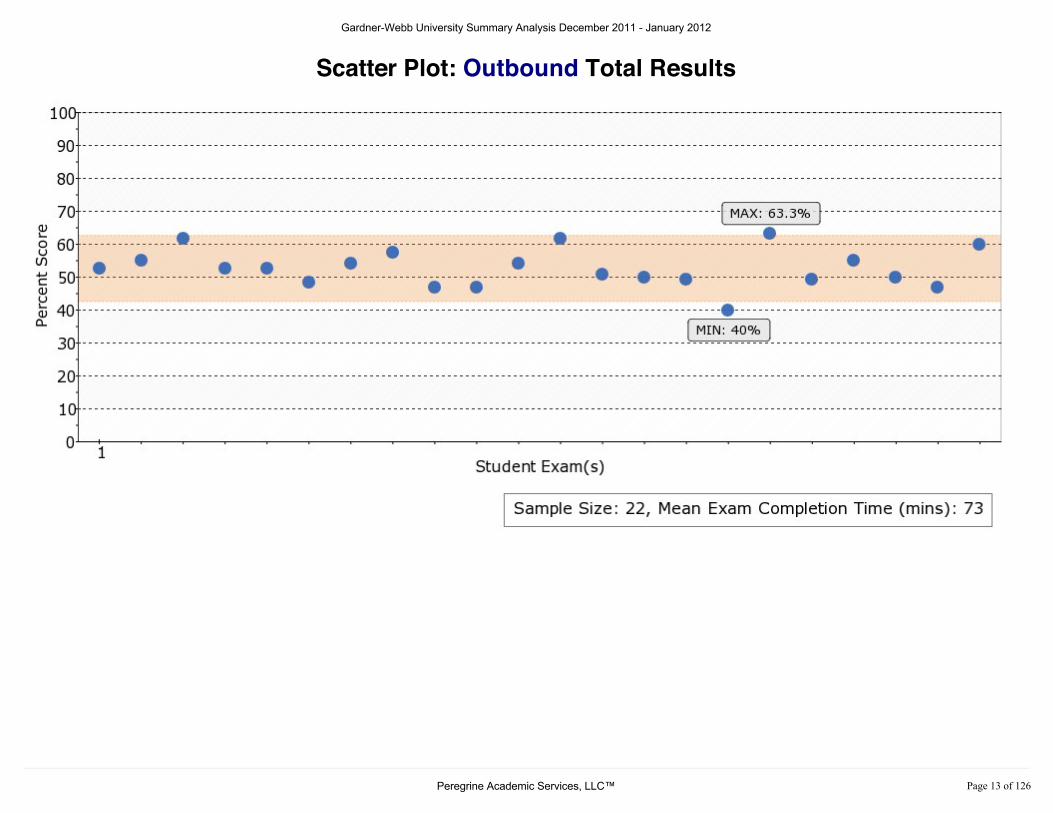
Scatter Plot: Outbound Total Results
Gardner-Webb University Summary Analysis December 2011 - January 2012
3HUHJULQH�$FDGHPLF�6HUYLFHV��//&� 3DJH����RI�����

Inbound/Outbound Total Score Comparison
C P C T o p i c a n d S u b j e c t - L e v e l A n a l y s e s
Gardner-Webb University Summary Analysis December 2011 - January 2012
3HUHJULQH�$FDGHPLF�6HUYLFHV��//&� 3DJH����RI�����
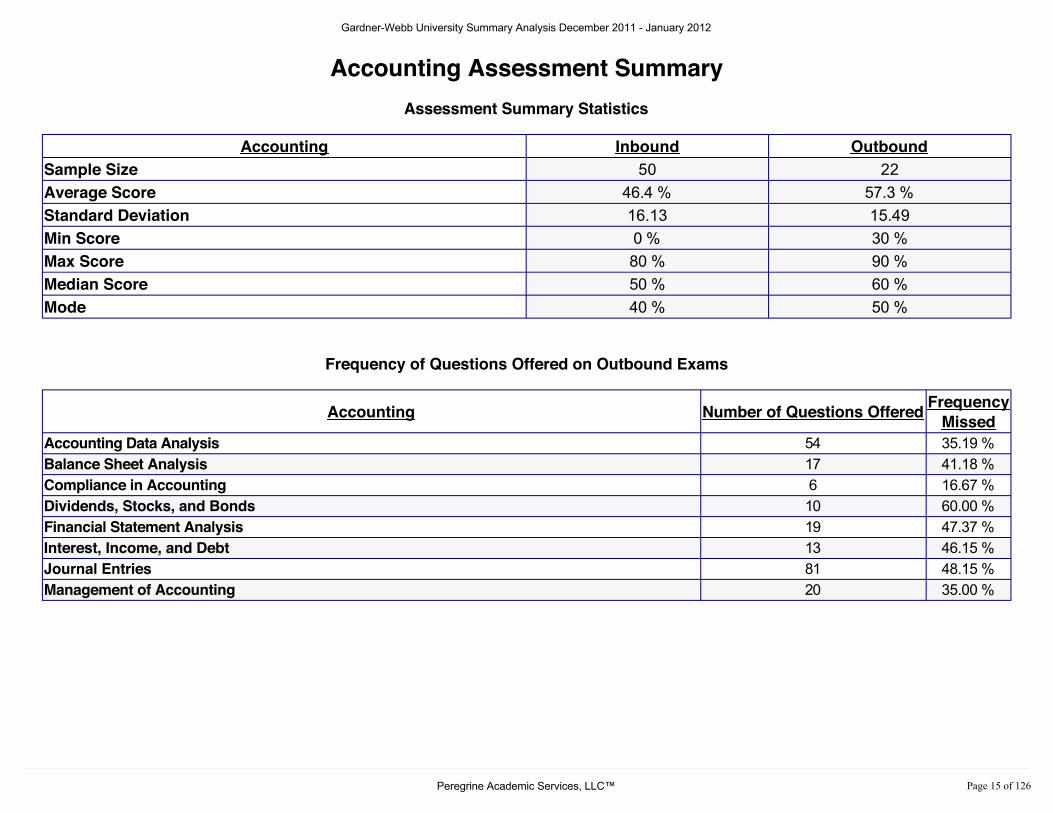
Accounting Assessment SummaryAssessment Summary Statistics
Accounting Inbound OutboundSample Size 50 22Average Score 46.4 % 57.3 %Standard Deviation 16.13 15.49Min Score 0 % 30 %Max Score 80 % 90 %Median Score 50 % 60 %Mode 40 % 50 %
Frequency of Questions Offered on Outbound Exams
Accounting Number of Questions Offered FrequencyMissed
Accounting Data Analysis 54 35.19 %Balance Sheet Analysis 17 41.18 %Compliance in Accounting 6 16.67 %Dividends, Stocks, and Bonds 10 60.00 %Financial Statement Analysis 19 47.37 %Interest, Income, and Debt 13 46.15 %Journal Entries 81 48.15 %Management of Accounting 20 35.00 %
A c c o u n t i n g
Gardner-Webb University Summary Analysis December 2011 - January 2012
3HUHJULQH�$FDGHPLF�6HUYLFHV��//&� 3DJH����RI�����
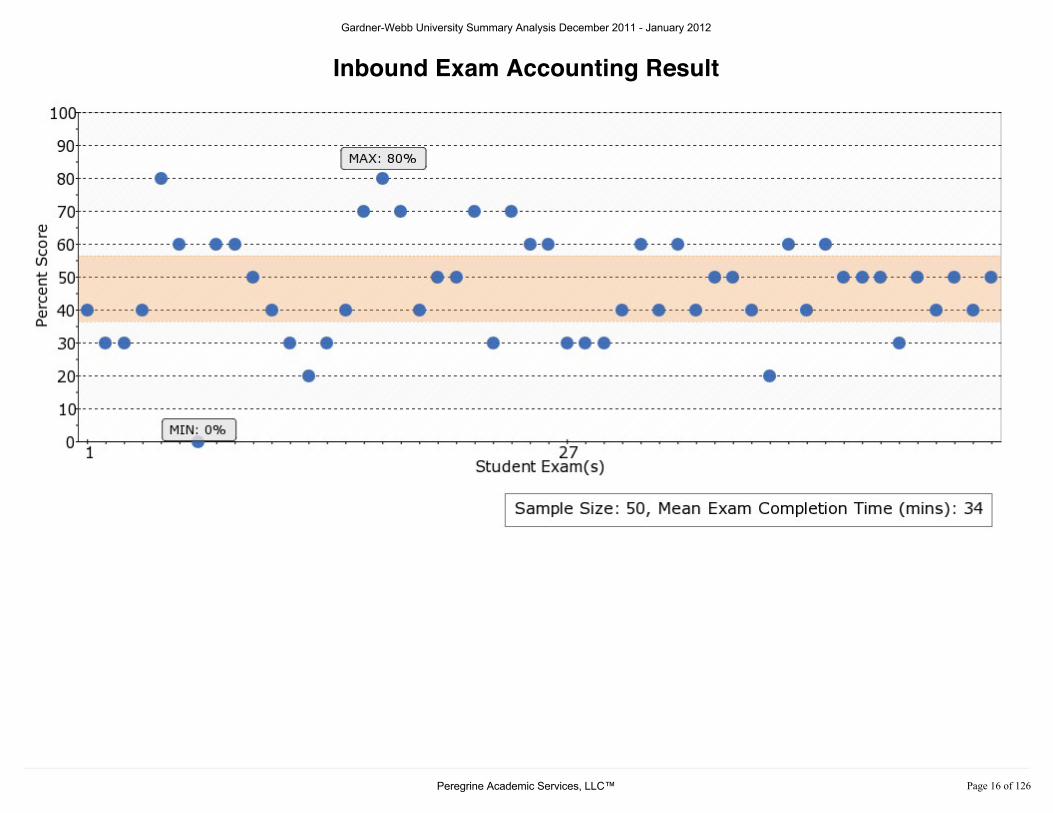
Inbound Exam Accounting Result
Gardner-Webb University Summary Analysis December 2011 - January 2012
3HUHJULQH�$FDGHPLF�6HUYLFHV��//&� 3DJH����RI�����

Outbound Exam Accounting Result
Gardner-Webb University Summary Analysis December 2011 - January 2012
3HUHJULQH�$FDGHPLF�6HUYLFHV��//&� 3DJH����RI�����

Inbound/Outbound Accounting Comparison
Gardner-Webb University Summary Analysis December 2011 - January 2012
3HUHJULQH�$FDGHPLF�6HUYLFHV��//&� 3DJH����RI�����

Business Ethics Assessment SummaryAssessment Summary Statistics
Business Ethics Inbound OutboundSample Size 50 22Average Score 30.8 % 55.5 %Standard Deviation 18.83 14.71Min Score 0 % 20 %Max Score 70 % 90 %Median Score 30 % 55 %Mode 40 % 50 %
Frequency of Questions Offered on Outbound Exams
Business Ethics Number of Questions Offered FrequencyMissed
Conflict of Interest 7 42.86 %Corporate Ethics and Climate 30 40.00 %Discrimination 29 68.97 %Ethical Climate 42 28.57 %Ethical Decision-Making 20 35.00 %Ethical Issues 42 33.33 %Ethical Standards 50 60.00 %
B u s i n e s s E t h i c s
Gardner-Webb University Summary Analysis December 2011 - January 2012
3HUHJULQH�$FDGHPLF�6HUYLFHV��//&� 3DJH����RI�����

Inbound Exam Business Ethics Result
Gardner-Webb University Summary Analysis December 2011 - January 2012
3HUHJULQH�$FDGHPLF�6HUYLFHV��//&� 3DJH����RI�����
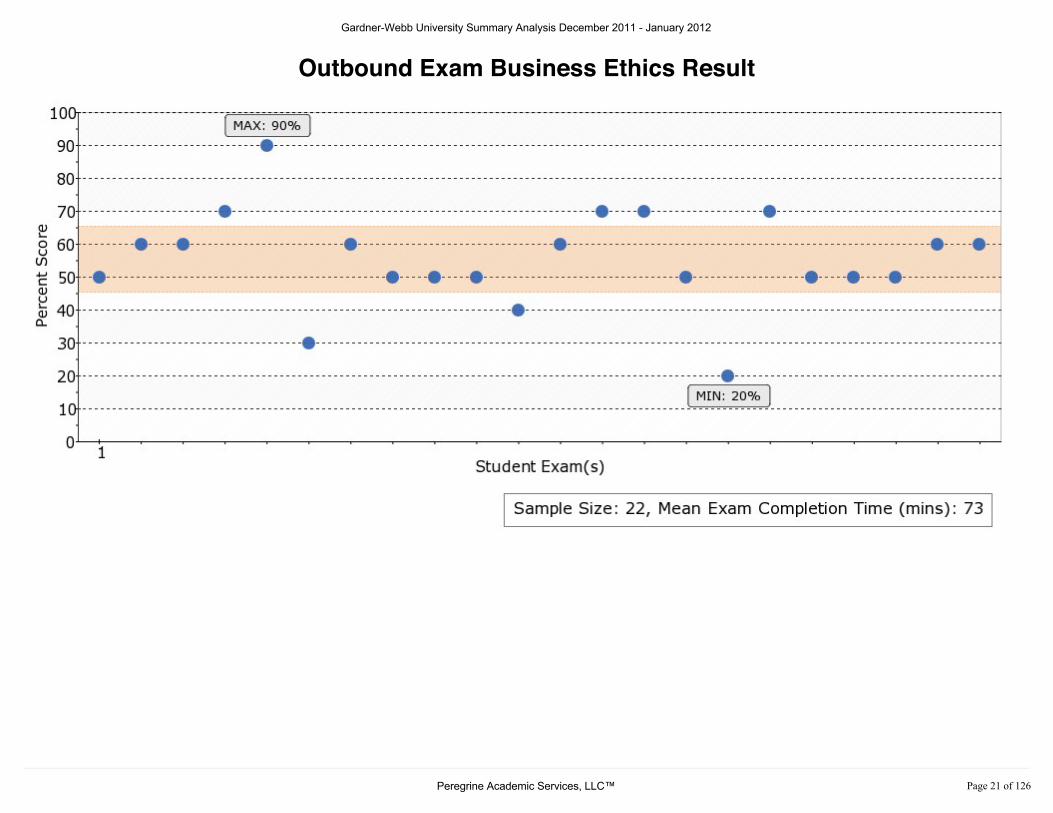
Outbound Exam Business Ethics Result
Gardner-Webb University Summary Analysis December 2011 - January 2012
3HUHJULQH�$FDGHPLF�6HUYLFHV��//&� 3DJH����RI�����
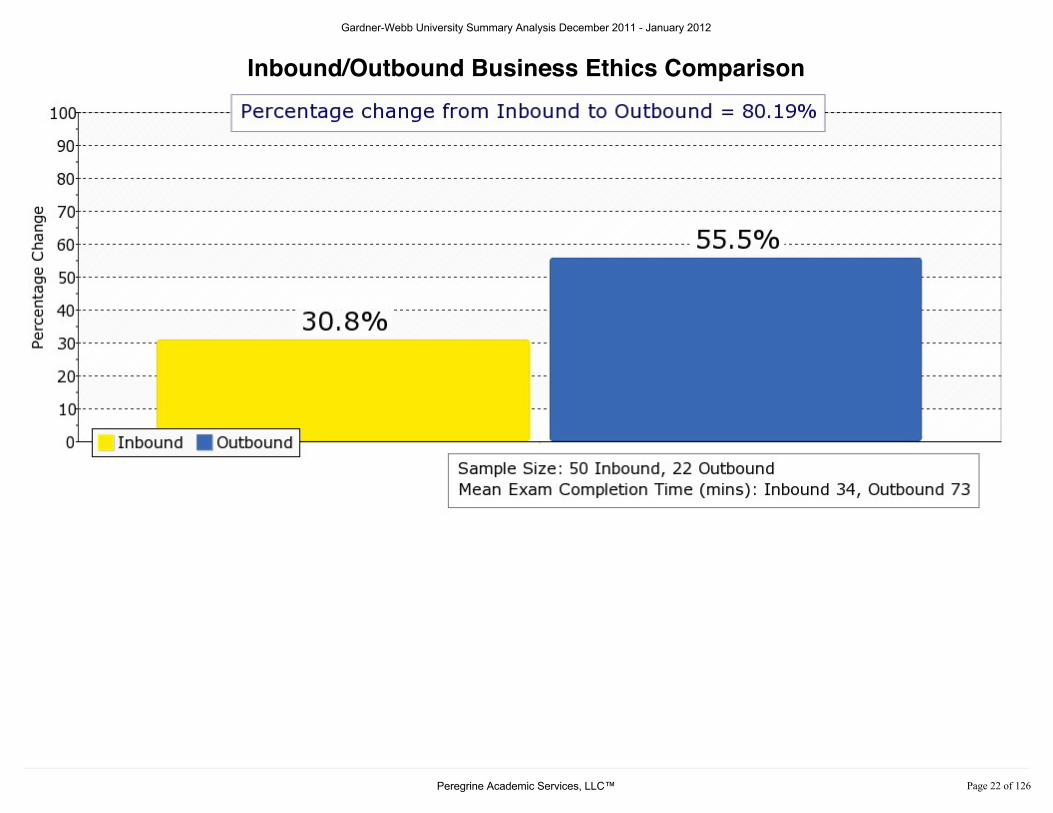
Inbound/Outbound Business Ethics Comparison
Gardner-Webb University Summary Analysis December 2011 - January 2012
3HUHJULQH�$FDGHPLF�6HUYLFHV��//&� 3DJH����RI�����
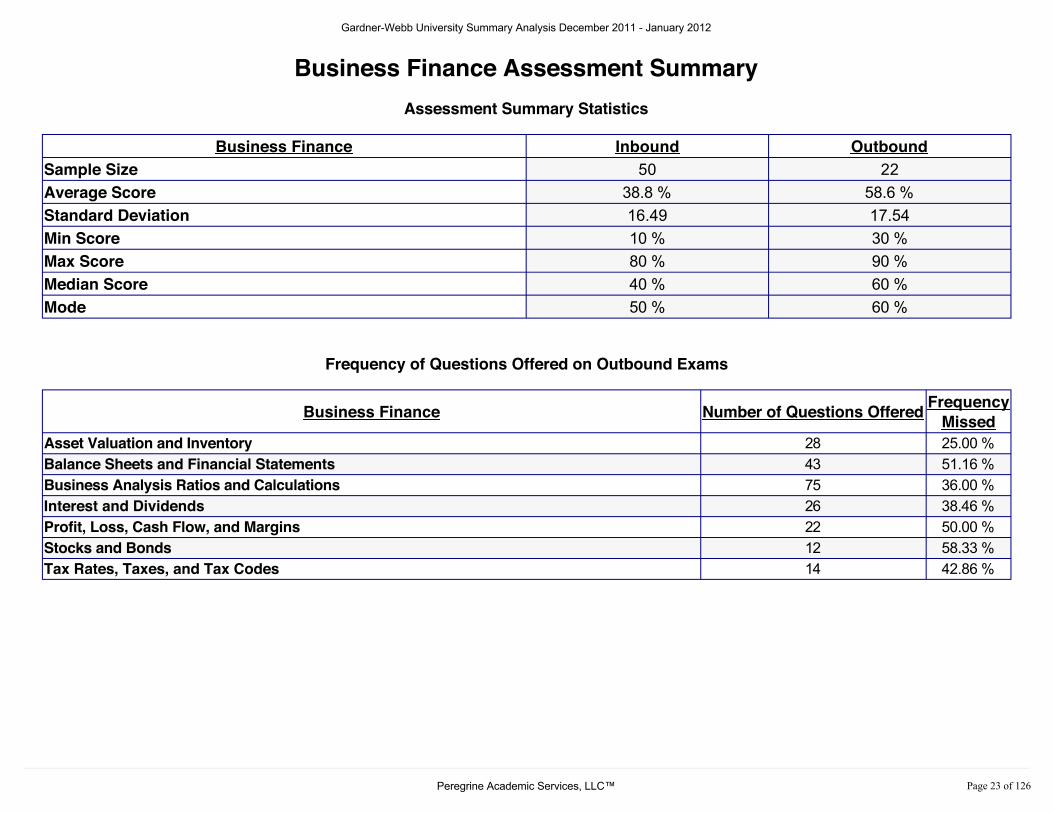
Business Finance Assessment SummaryAssessment Summary Statistics
Business Finance Inbound OutboundSample Size 50 22Average Score 38.8 % 58.6 %Standard Deviation 16.49 17.54Min Score 10 % 30 %Max Score 80 % 90 %Median Score 40 % 60 %Mode 50 % 60 %
Frequency of Questions Offered on Outbound Exams
Business Finance Number of Questions Offered FrequencyMissed
Asset Valuation and Inventory 28 25.00 %Balance Sheets and Financial Statements 43 51.16 %Business Analysis Ratios and Calculations 75 36.00 %Interest and Dividends 26 38.46 %Profit, Loss, Cash Flow, and Margins 22 50.00 %Stocks and Bonds 12 58.33 %Tax Rates, Taxes, and Tax Codes 14 42.86 %
B u s i n e s s F i n a n c e
Gardner-Webb University Summary Analysis December 2011 - January 2012
3HUHJULQH�$FDGHPLF�6HUYLFHV��//&� 3DJH����RI�����

Inbound Exam Business Finance Result
Gardner-Webb University Summary Analysis December 2011 - January 2012
3HUHJULQH�$FDGHPLF�6HUYLFHV��//&� 3DJH����RI�����
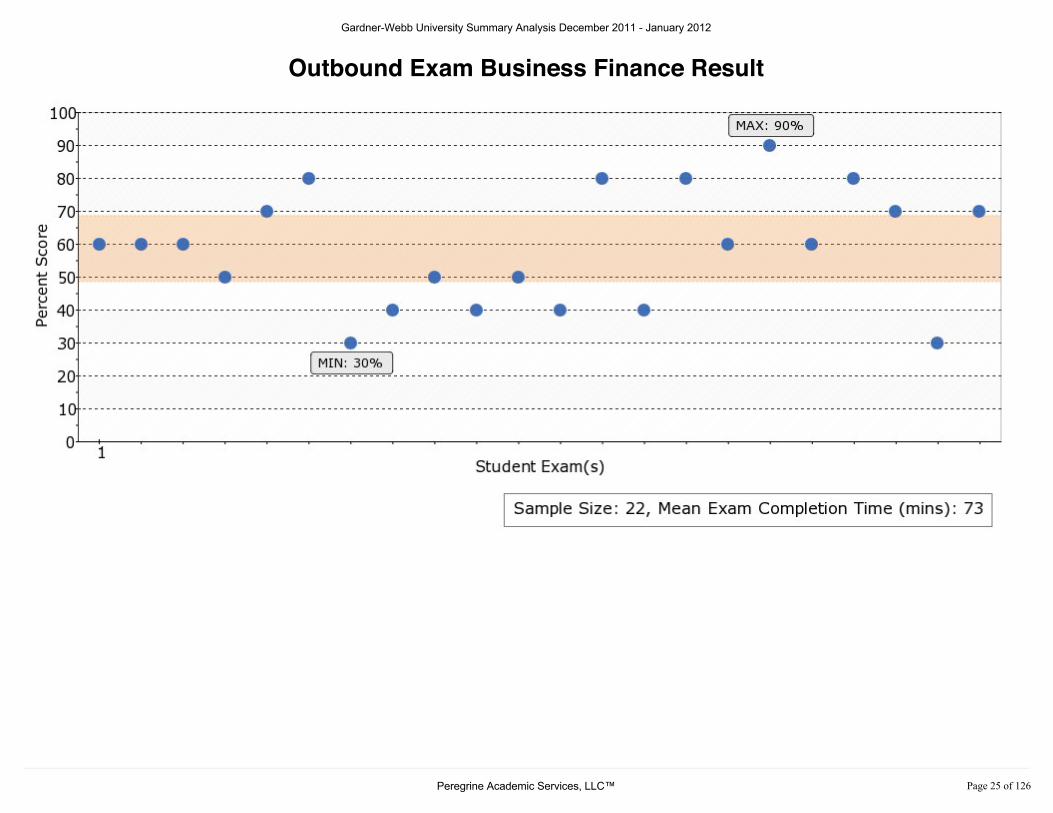
Outbound Exam Business Finance Result
Gardner-Webb University Summary Analysis December 2011 - January 2012
3HUHJULQH�$FDGHPLF�6HUYLFHV��//&� 3DJH����RI�����
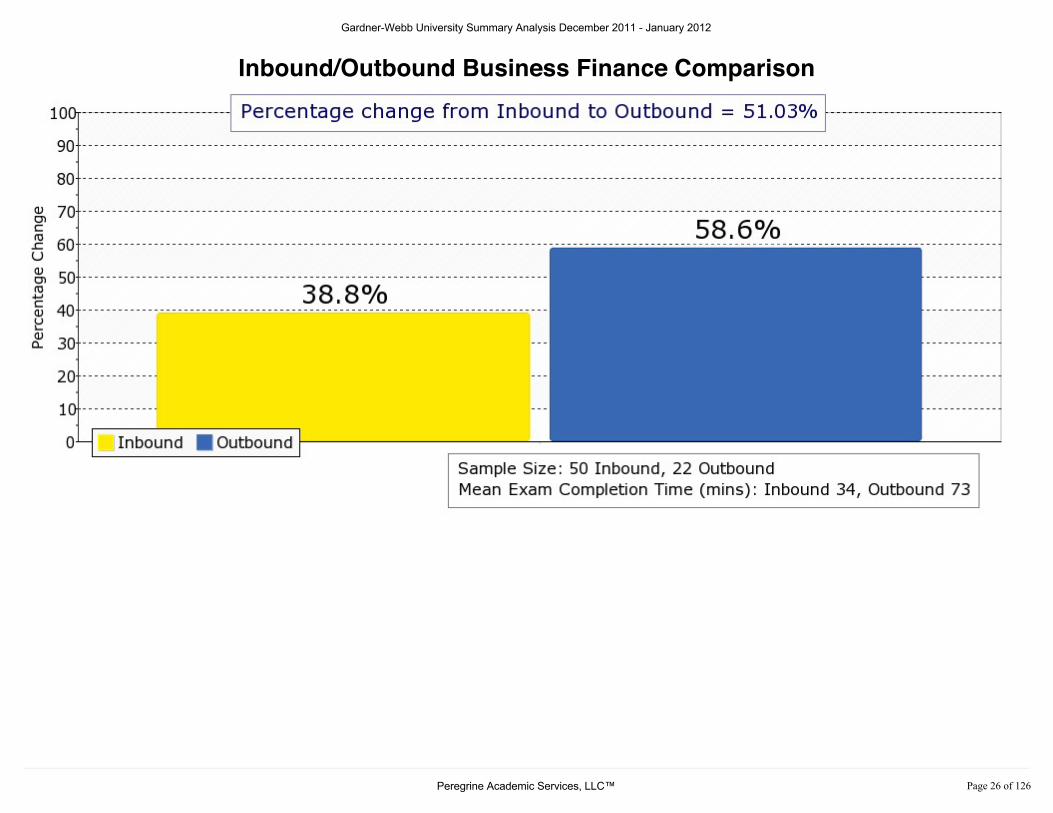
Inbound/Outbound Business Finance Comparison
Gardner-Webb University Summary Analysis December 2011 - January 2012
3HUHJULQH�$FDGHPLF�6HUYLFHV��//&� 3DJH����RI�����
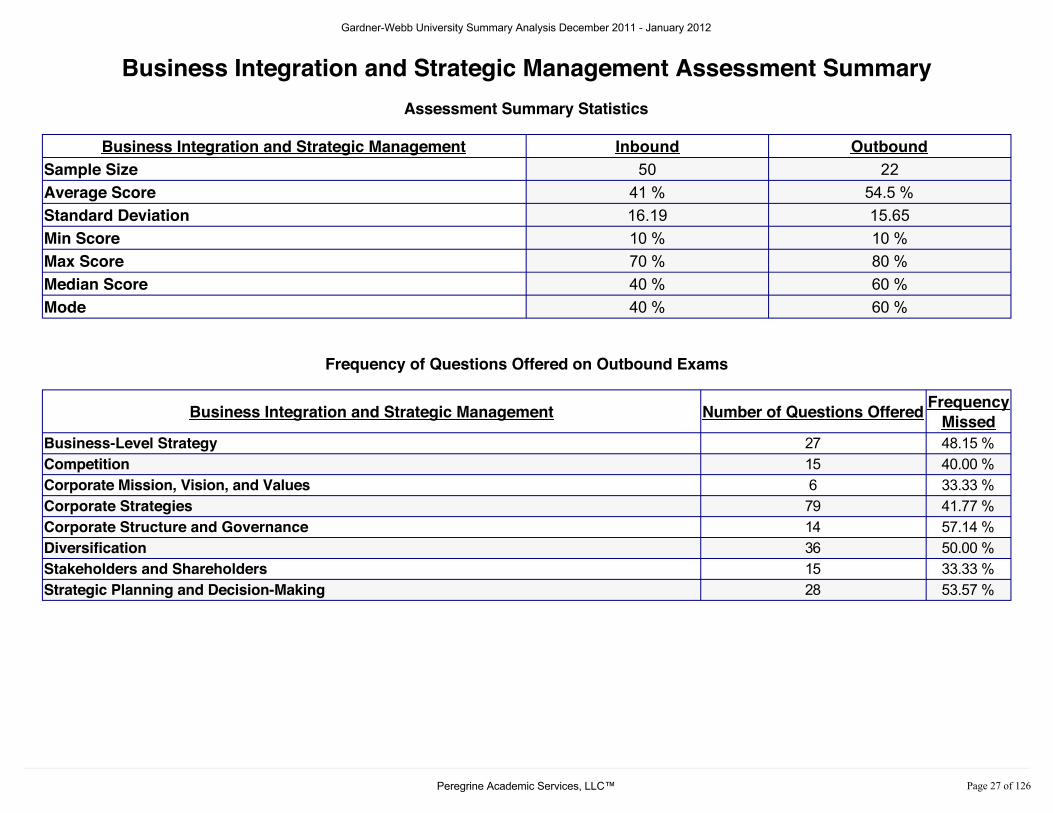
Business Integration and Strategic Management Assessment SummaryAssessment Summary Statistics
Business Integration and Strategic Management Inbound OutboundSample Size 50 22Average Score 41 % 54.5 %Standard Deviation 16.19 15.65Min Score 10 % 10 %Max Score 70 % 80 %Median Score 40 % 60 %Mode 40 % 60 %
Frequency of Questions Offered on Outbound Exams
Business Integration and Strategic Management Number of Questions Offered FrequencyMissed
Business-Level Strategy 27 48.15 %Competition 15 40.00 %Corporate Mission, Vision, and Values 6 33.33 %Corporate Strategies 79 41.77 %Corporate Structure and Governance 14 57.14 %Diversification 36 50.00 %Stakeholders and Shareholders 15 33.33 %Strategic Planning and Decision-Making 28 53.57 %
B u s i n e s s I n t e g r a t i o n a n d S t r a t e g i c M a n a g e m e n t
Gardner-Webb University Summary Analysis December 2011 - January 2012
3HUHJULQH�$FDGHPLF�6HUYLFHV��//&� 3DJH����RI�����
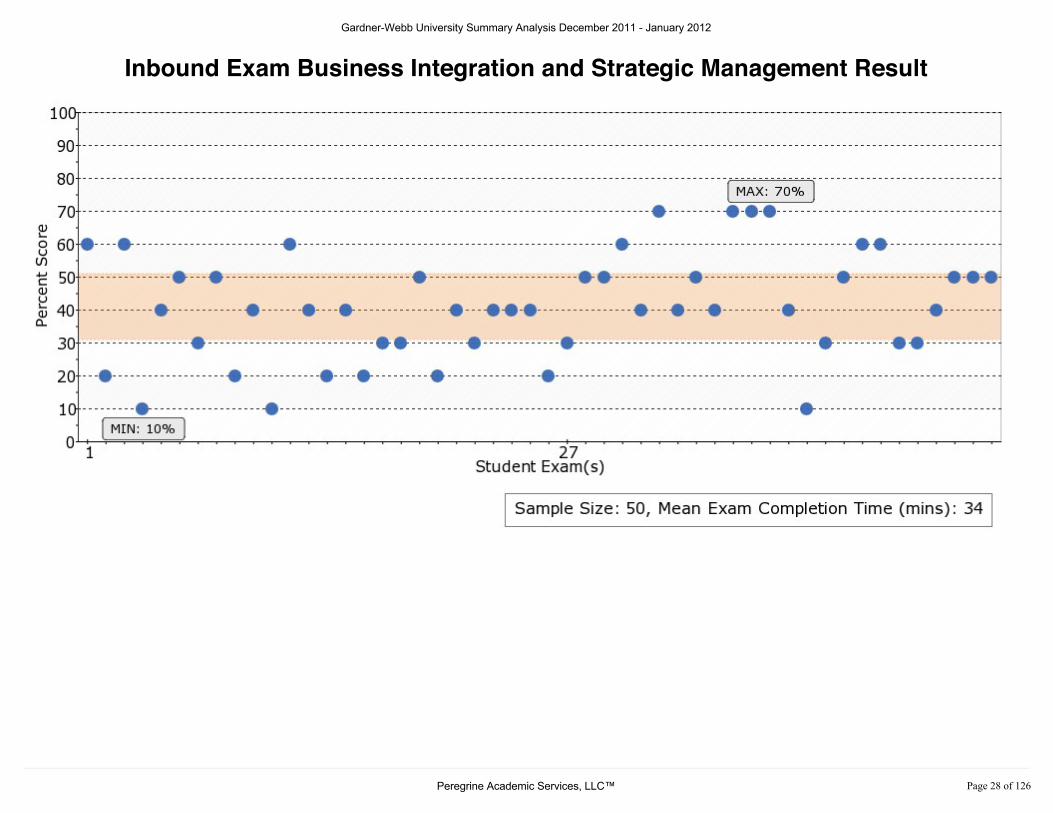
Inbound Exam Business Integration and Strategic Management Result
Gardner-Webb University Summary Analysis December 2011 - January 2012
3HUHJULQH�$FDGHPLF�6HUYLFHV��//&� 3DJH����RI�����

Outbound Exam Business Integration and Strategic Management Result
Gardner-Webb University Summary Analysis December 2011 - January 2012
3HUHJULQH�$FDGHPLF�6HUYLFHV��//&� 3DJH����RI�����
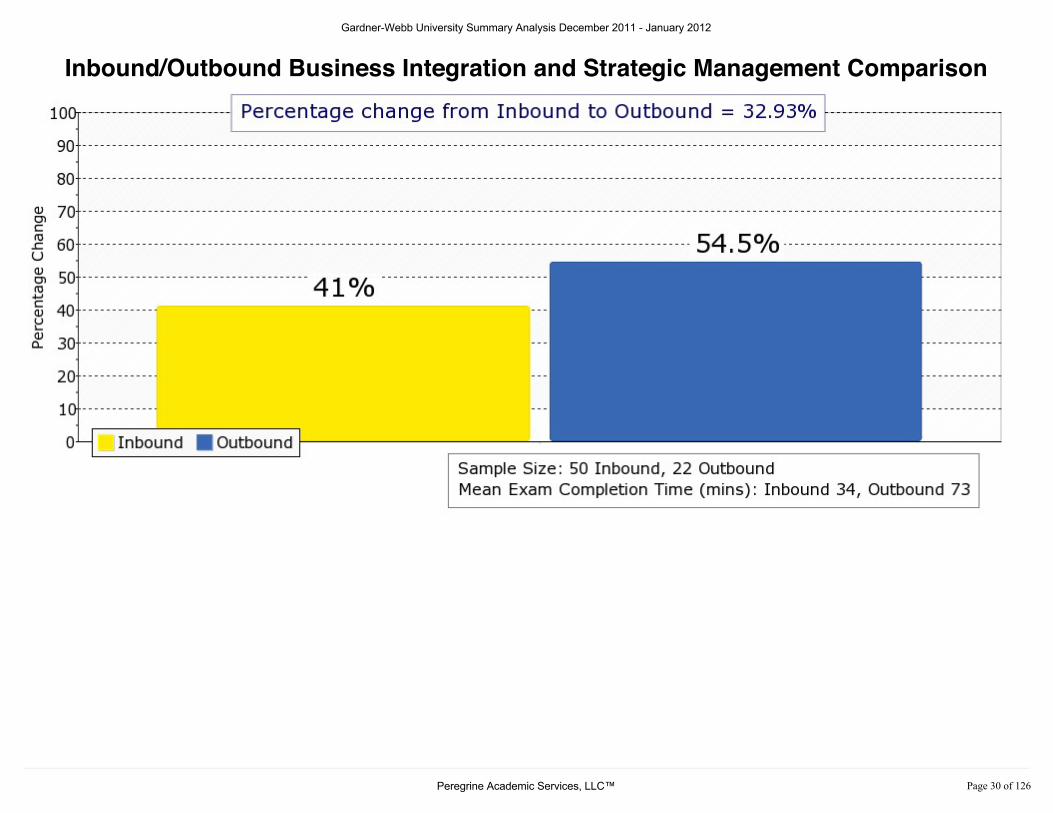
Inbound/Outbound Business Integration and Strategic Management Comparison
Gardner-Webb University Summary Analysis December 2011 - January 2012
3HUHJULQH�$FDGHPLF�6HUYLFHV��//&� 3DJH����RI�����
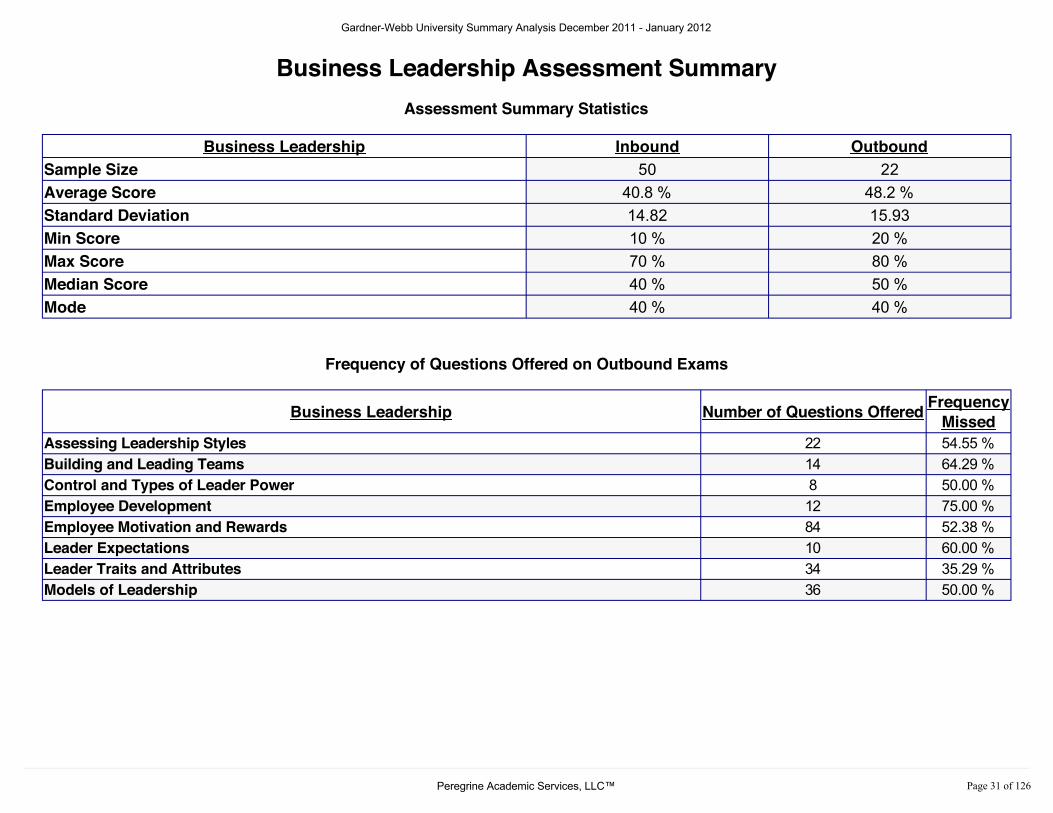
Business Leadership Assessment SummaryAssessment Summary Statistics
Business Leadership Inbound OutboundSample Size 50 22Average Score 40.8 % 48.2 %Standard Deviation 14.82 15.93Min Score 10 % 20 %Max Score 70 % 80 %Median Score 40 % 50 %Mode 40 % 40 %
Frequency of Questions Offered on Outbound Exams
Business Leadership Number of Questions Offered FrequencyMissed
Assessing Leadership Styles 22 54.55 %Building and Leading Teams 14 64.29 %Control and Types of Leader Power 8 50.00 %Employee Development 12 75.00 %Employee Motivation and Rewards 84 52.38 %Leader Expectations 10 60.00 %Leader Traits and Attributes 34 35.29 %Models of Leadership 36 50.00 %
B u s i n e s s L e a d e r s h i p
Gardner-Webb University Summary Analysis December 2011 - January 2012
3HUHJULQH�$FDGHPLF�6HUYLFHV��//&� 3DJH����RI�����

Inbound Exam Business Leadership Result
Gardner-Webb University Summary Analysis December 2011 - January 2012
3HUHJULQH�$FDGHPLF�6HUYLFHV��//&� 3DJH����RI�����
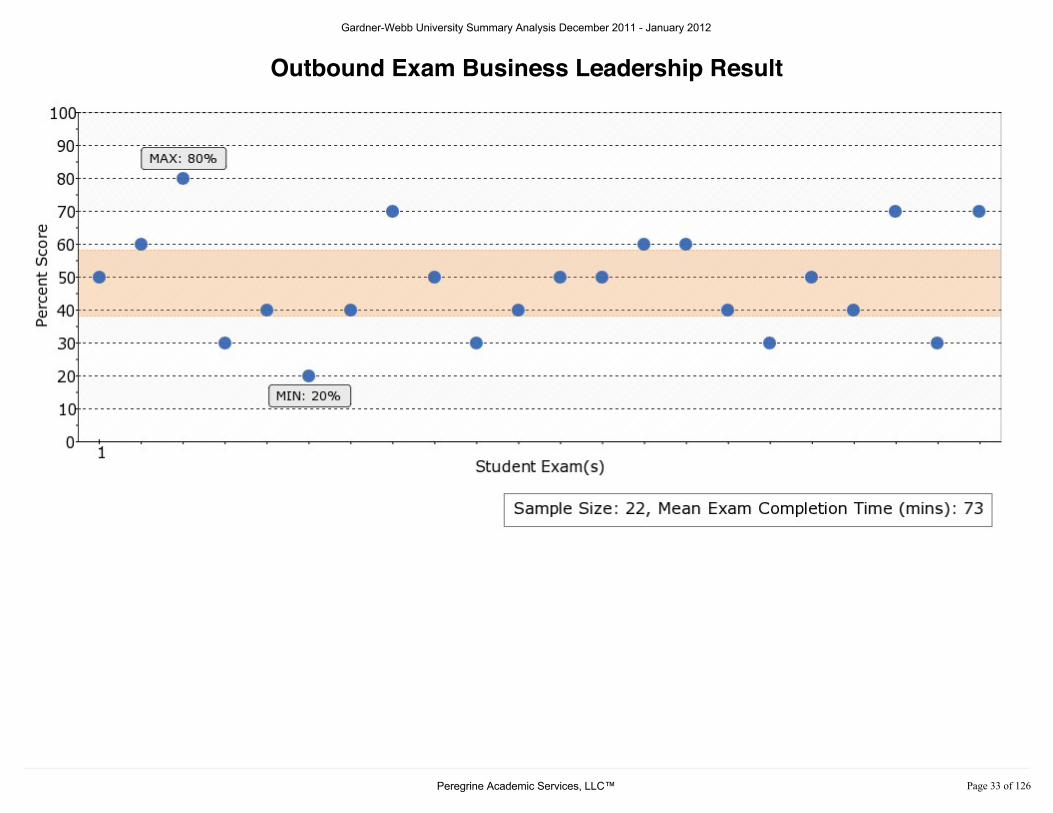
Outbound Exam Business Leadership Result
Gardner-Webb University Summary Analysis December 2011 - January 2012
3HUHJULQH�$FDGHPLF�6HUYLFHV��//&� 3DJH����RI�����
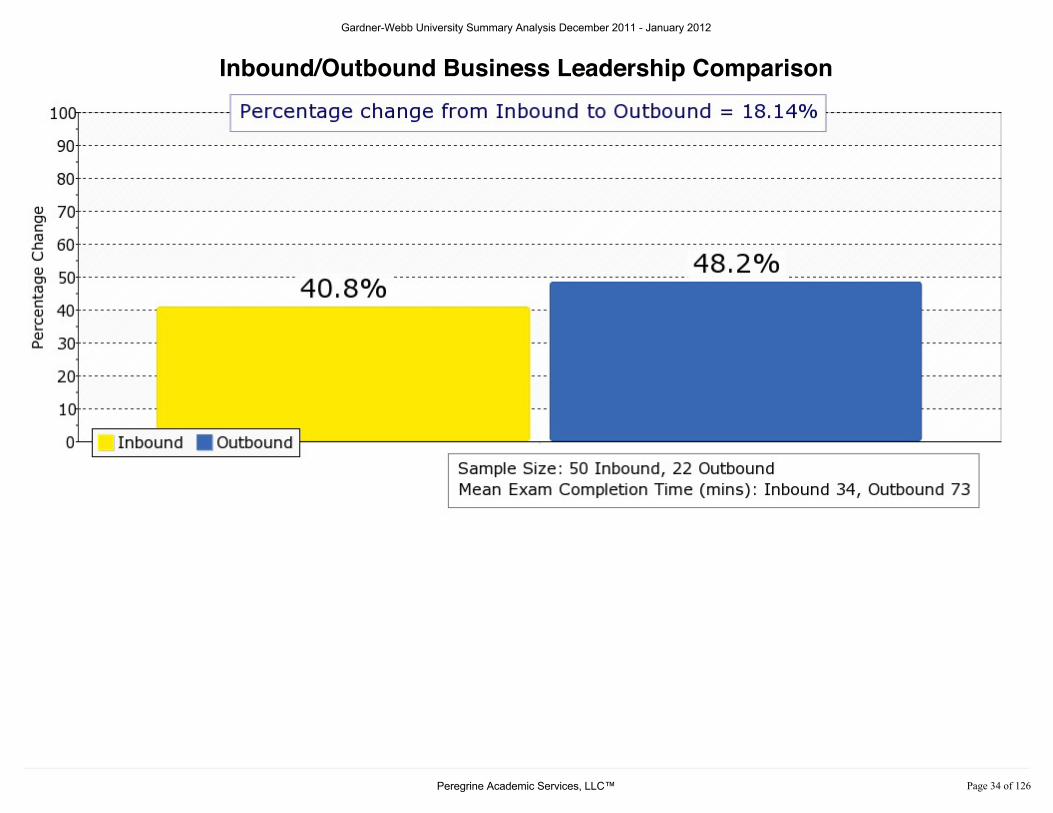
Inbound/Outbound Business Leadership Comparison
Gardner-Webb University Summary Analysis December 2011 - January 2012
3HUHJULQH�$FDGHPLF�6HUYLFHV��//&� 3DJH����RI�����
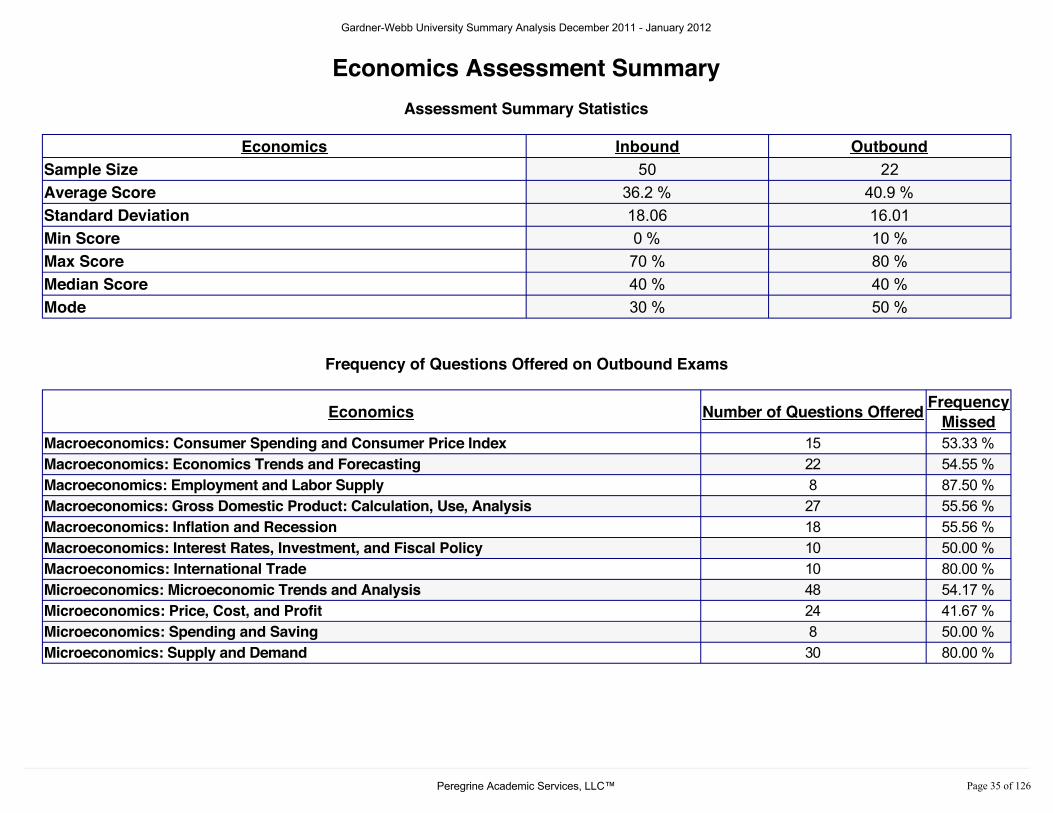
Economics Assessment SummaryAssessment Summary Statistics
Economics Inbound OutboundSample Size 50 22Average Score 36.2 % 40.9 %Standard Deviation 18.06 16.01Min Score 0 % 10 %Max Score 70 % 80 %Median Score 40 % 40 %Mode 30 % 50 %
Frequency of Questions Offered on Outbound Exams
Economics Number of Questions Offered FrequencyMissed
Macroeconomics: Consumer Spending and Consumer Price Index 15 53.33 %Macroeconomics: Economics Trends and Forecasting 22 54.55 %Macroeconomics: Employment and Labor Supply 8 87.50 %Macroeconomics: Gross Domestic Product: Calculation, Use, Analysis 27 55.56 %Macroeconomics: Inflation and Recession 18 55.56 %Macroeconomics: Interest Rates, Investment, and Fiscal Policy 10 50.00 %Macroeconomics: International Trade 10 80.00 %Microeconomics: Microeconomic Trends and Analysis 48 54.17 %Microeconomics: Price, Cost, and Profit 24 41.67 %Microeconomics: Spending and Saving 8 50.00 %Microeconomics: Supply and Demand 30 80.00 %
E c o n o m i c s
Gardner-Webb University Summary Analysis December 2011 - January 2012
3HUHJULQH�$FDGHPLF�6HUYLFHV��//&� 3DJH����RI�����

Inbound Exam Economics Result
Gardner-Webb University Summary Analysis December 2011 - January 2012
3HUHJULQH�$FDGHPLF�6HUYLFHV��//&� 3DJH����RI�����
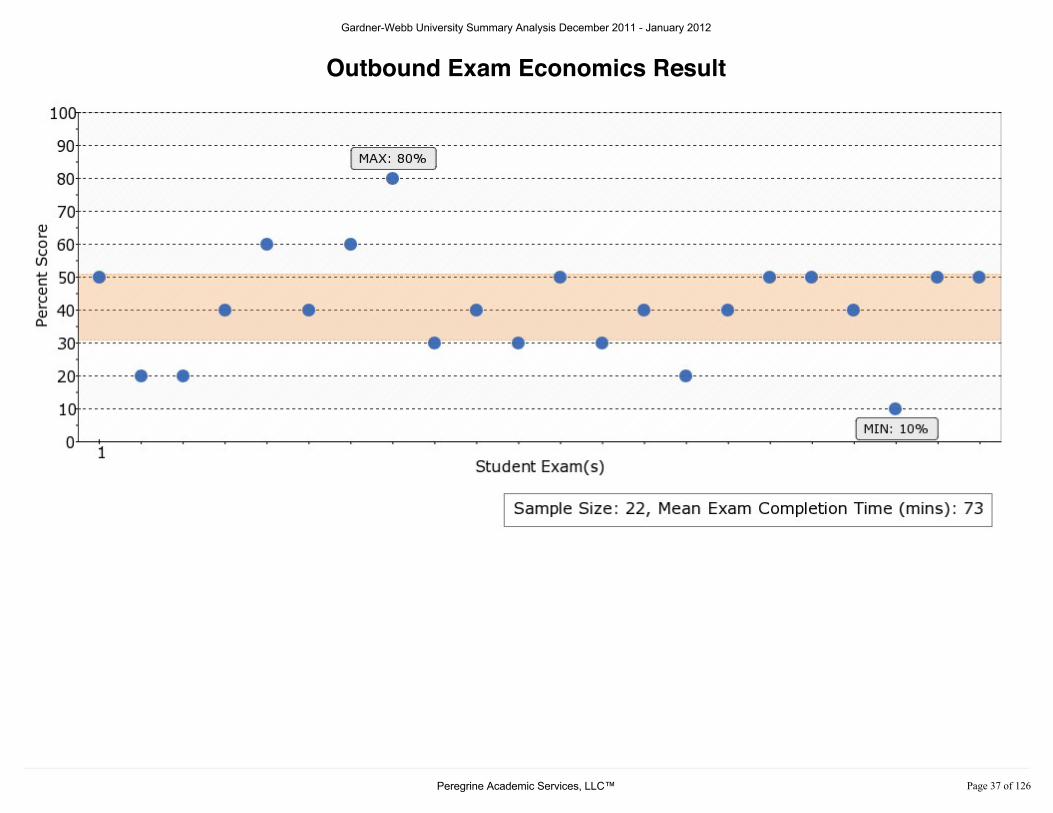
Outbound Exam Economics Result
Gardner-Webb University Summary Analysis December 2011 - January 2012
3HUHJULQH�$FDGHPLF�6HUYLFHV��//&� 3DJH����RI�����
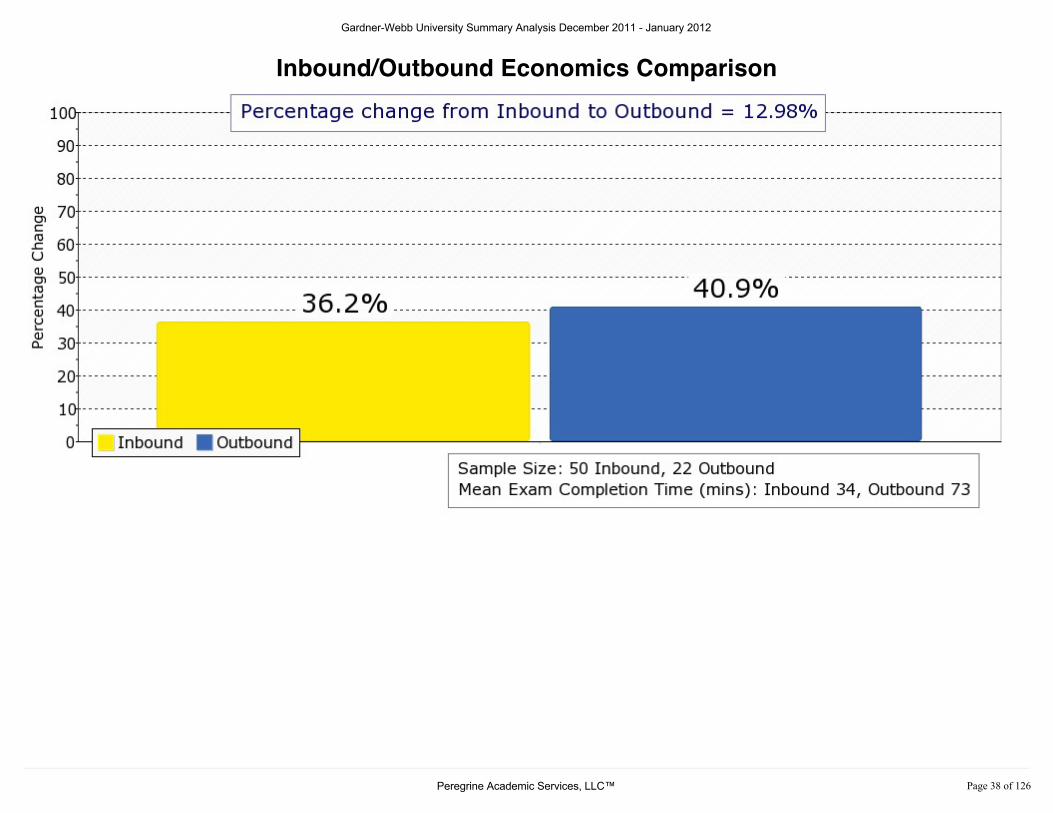
Inbound/Outbound Economics Comparison
Gardner-Webb University Summary Analysis December 2011 - January 2012
3HUHJULQH�$FDGHPLF�6HUYLFHV��//&� 3DJH����RI�����
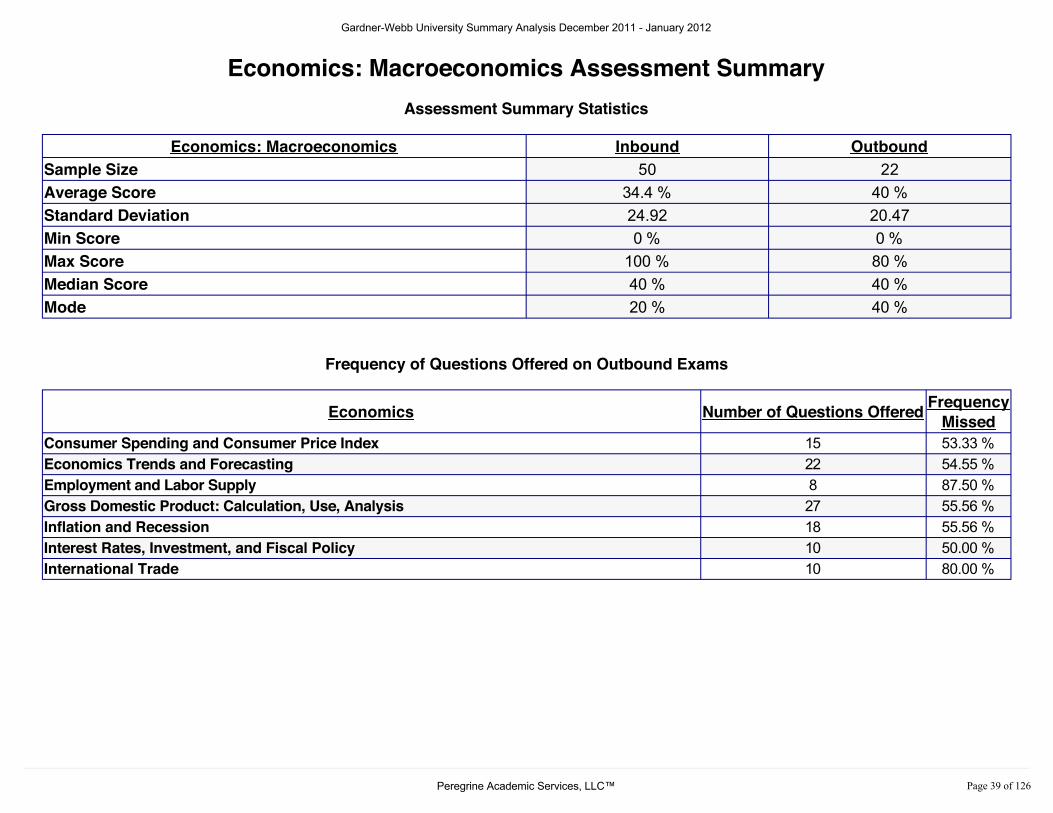
Economics: Macroeconomics Assessment SummaryAssessment Summary Statistics
Economics: Macroeconomics Inbound OutboundSample Size 50 22Average Score 34.4 % 40 %Standard Deviation 24.92 20.47Min Score 0 % 0 %Max Score 100 % 80 %Median Score 40 % 40 %Mode 20 % 40 %
Frequency of Questions Offered on Outbound Exams
Economics Number of Questions Offered FrequencyMissed
Consumer Spending and Consumer Price Index 15 53.33 %Economics Trends and Forecasting 22 54.55 %Employment and Labor Supply 8 87.50 %Gross Domestic Product: Calculation, Use, Analysis 27 55.56 %Inflation and Recession 18 55.56 %Interest Rates, Investment, and Fiscal Policy 10 50.00 %International Trade 10 80.00 %
E c o n o m i c s : M a c r o e c o n o m i c s
Gardner-Webb University Summary Analysis December 2011 - January 2012
3HUHJULQH�$FDGHPLF�6HUYLFHV��//&� 3DJH����RI�����
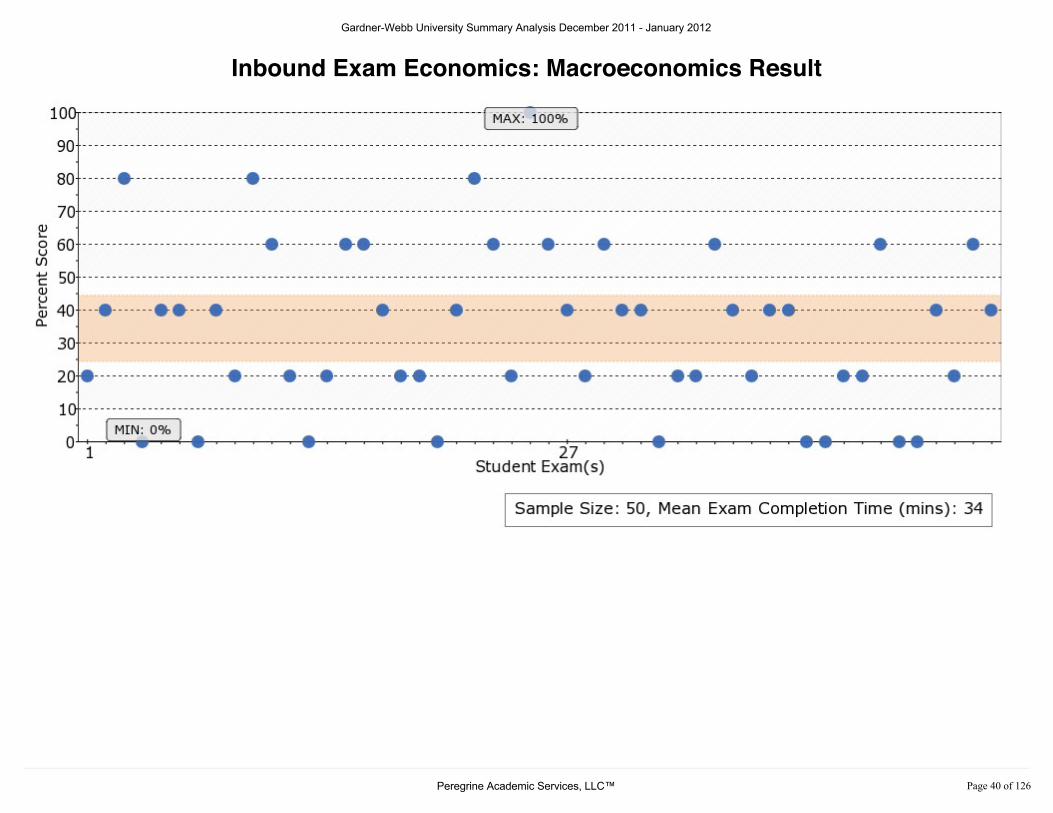
Inbound Exam Economics: Macroeconomics Result
Gardner-Webb University Summary Analysis December 2011 - January 2012
3HUHJULQH�$FDGHPLF�6HUYLFHV��//&� 3DJH����RI�����
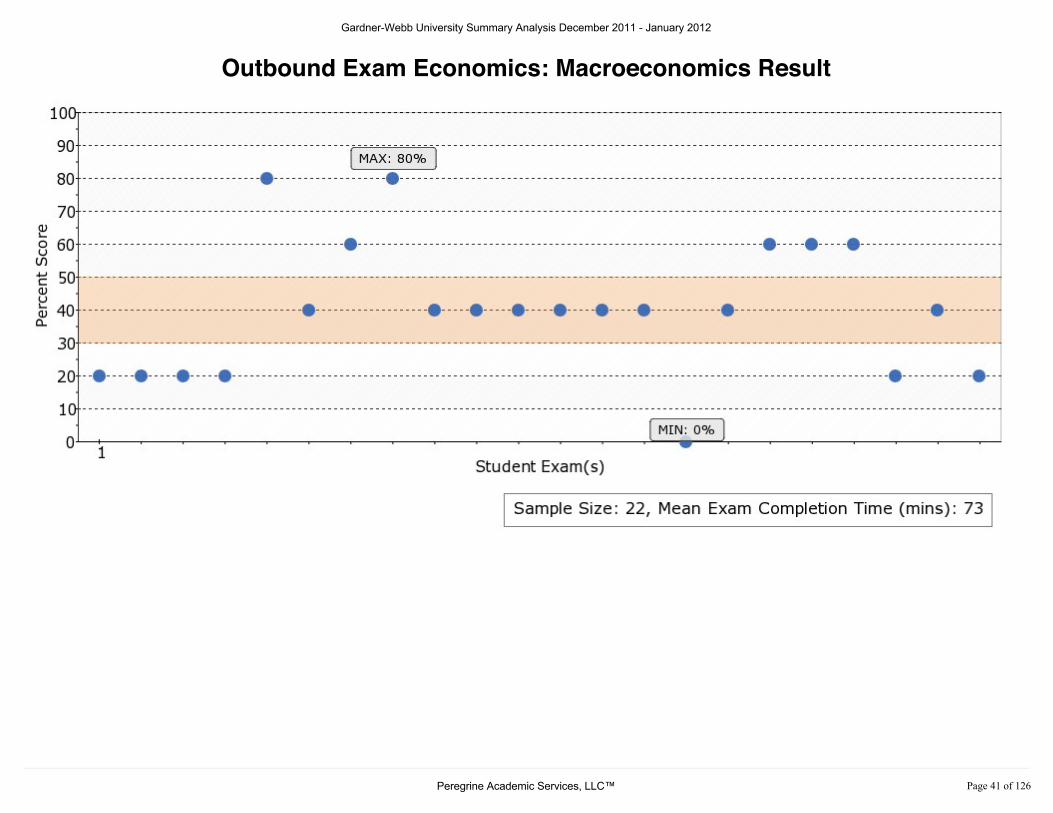
Outbound Exam Economics: Macroeconomics Result
Gardner-Webb University Summary Analysis December 2011 - January 2012
3HUHJULQH�$FDGHPLF�6HUYLFHV��//&� 3DJH����RI�����

Inbound/Outbound Economics: Macroeconomics Comparison
Gardner-Webb University Summary Analysis December 2011 - January 2012
3HUHJULQH�$FDGHPLF�6HUYLFHV��//&� 3DJH����RI�����

Economics: Microeconomics Assessment SummaryAssessment Summary Statistics
Economics: Microeconomics Inbound OutboundSample Size 50 22Average Score 38 % 41.8 %Standard Deviation 24.33 22.18Min Score 0 % 0 %Max Score 100 % 80 %Median Score 40 % 40 %Mode 40 % 40 %
Frequency of Questions Offered on Outbound Exams
Economics Number of Questions Offered FrequencyMissed
Microeconomic Trends and Analysis 48 54.17 %Price, Cost, and Profit 24 41.67 %Spending and Saving 8 50.00 %Supply and Demand 30 80.00 %
E c o n o m i c s : M i c r o e c o n o m i c s
Gardner-Webb University Summary Analysis December 2011 - January 2012
3HUHJULQH�$FDGHPLF�6HUYLFHV��//&� 3DJH����RI�����
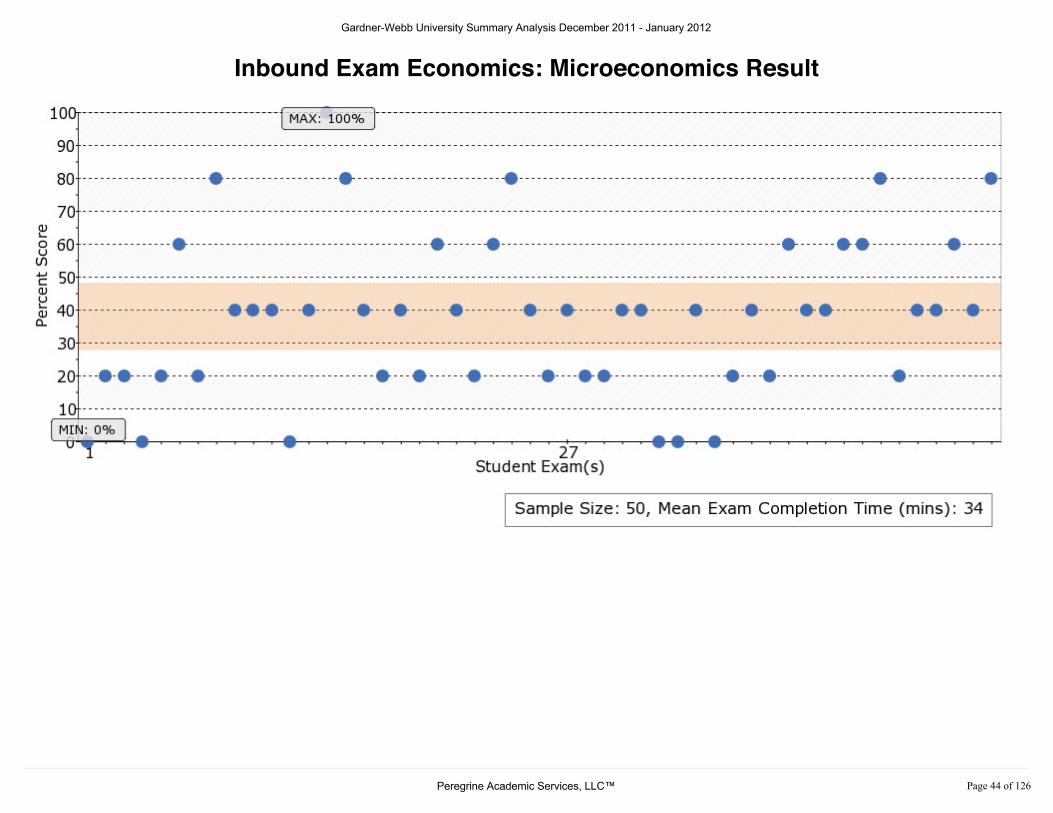
Inbound Exam Economics: Microeconomics Result
Gardner-Webb University Summary Analysis December 2011 - January 2012
3HUHJULQH�$FDGHPLF�6HUYLFHV��//&� 3DJH����RI�����
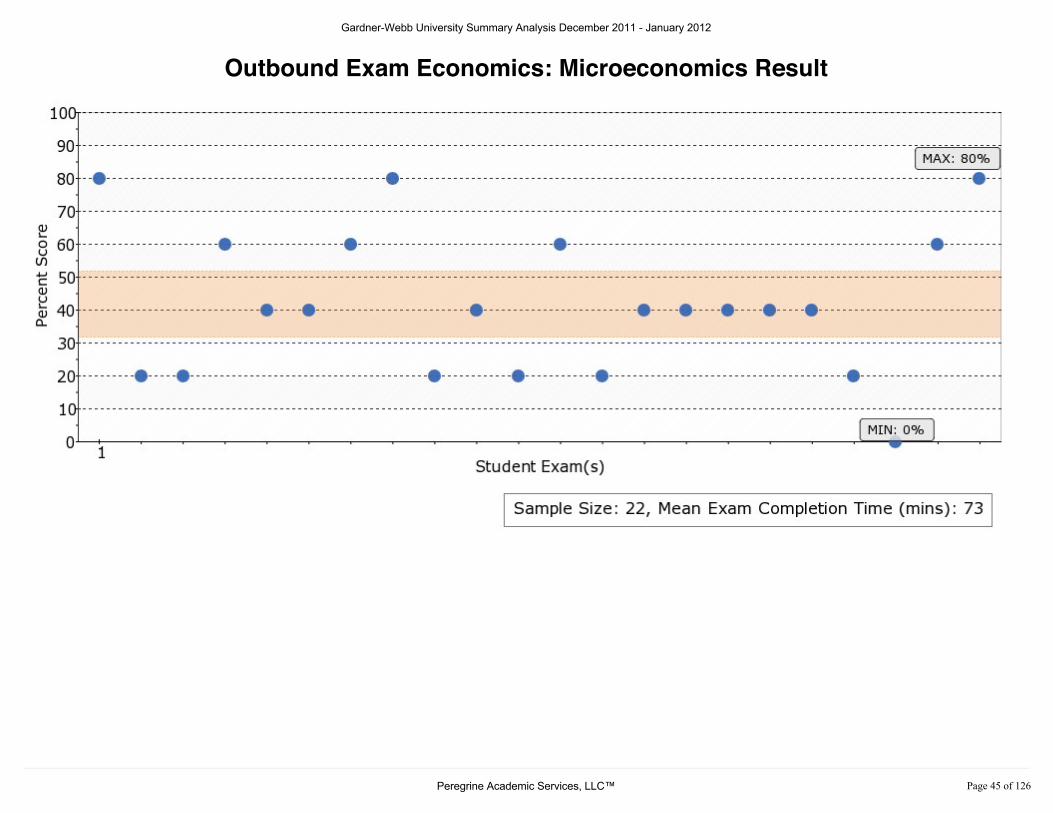
Outbound Exam Economics: Microeconomics Result
Gardner-Webb University Summary Analysis December 2011 - January 2012
3HUHJULQH�$FDGHPLF�6HUYLFHV��//&� 3DJH����RI�����

Inbound/Outbound Economics: Microeconomics Comparison
Gardner-Webb University Summary Analysis December 2011 - January 2012
3HUHJULQH�$FDGHPLF�6HUYLFHV��//&� 3DJH����RI�����

Global Dimensions of Business Assessment SummaryAssessment Summary Statistics
Global Dimensions of Business Inbound OutboundSample Size 50 22Average Score 44.2 % 55 %Standard Deviation 17.85 15.04Min Score 10 % 30 %Max Score 90 % 80 %Median Score 40 % 50 %Mode 30 % 50 %
Frequency of Questions Offered on Outbound Exams
Global Dimensions of Business Number of Questions Offered FrequencyMissed
Foreign Direct Investment and Trade 84 44.05 %International Corporate Strategies 79 45.57 %International Governance and Regulation 32 40.63 %International Patents and Protections 20 45.00 %Multinational Culture 5 60.00 %
G l o b a l D i m e n s i o n s o f B u s i n e s s
Gardner-Webb University Summary Analysis December 2011 - January 2012
3HUHJULQH�$FDGHPLF�6HUYLFHV��//&� 3DJH����RI�����
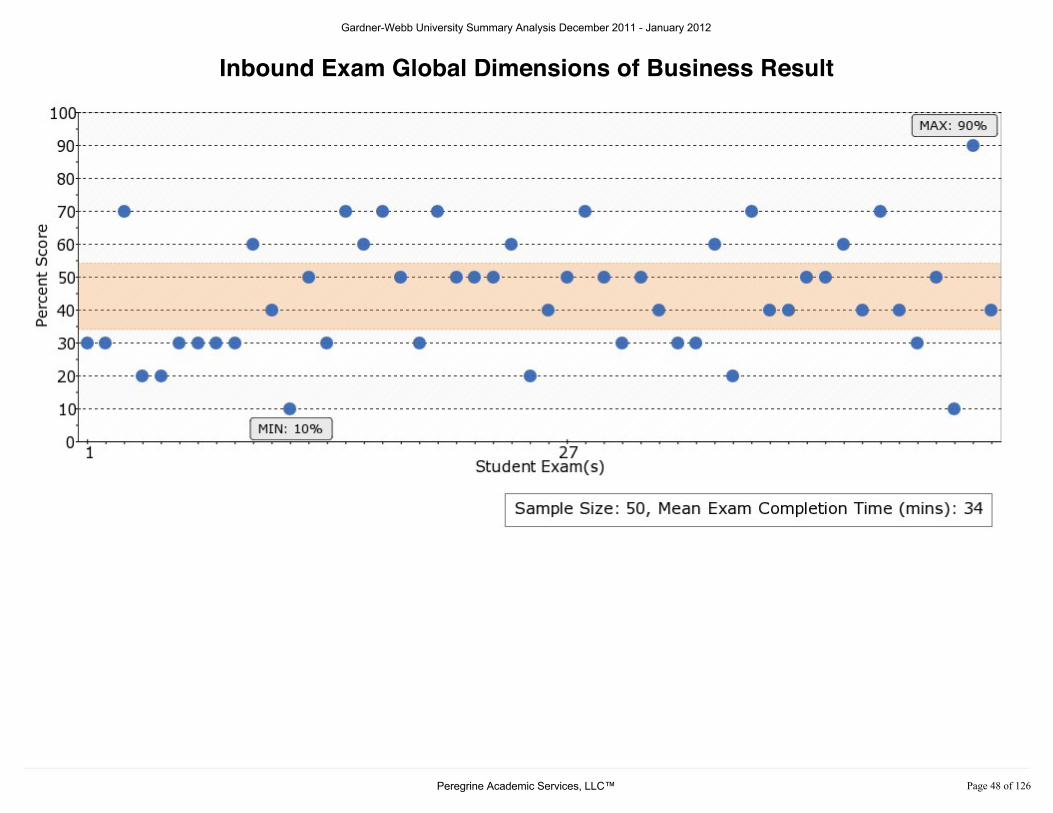
Inbound Exam Global Dimensions of Business Result
Gardner-Webb University Summary Analysis December 2011 - January 2012
3HUHJULQH�$FDGHPLF�6HUYLFHV��//&� 3DJH����RI�����

Outbound Exam Global Dimensions of Business Result
Gardner-Webb University Summary Analysis December 2011 - January 2012
3HUHJULQH�$FDGHPLF�6HUYLFHV��//&� 3DJH����RI�����

Inbound/Outbound Global Dimensions of Business Comparison
Gardner-Webb University Summary Analysis December 2011 - January 2012
3HUHJULQH�$FDGHPLF�6HUYLFHV��//&� 3DJH����RI�����
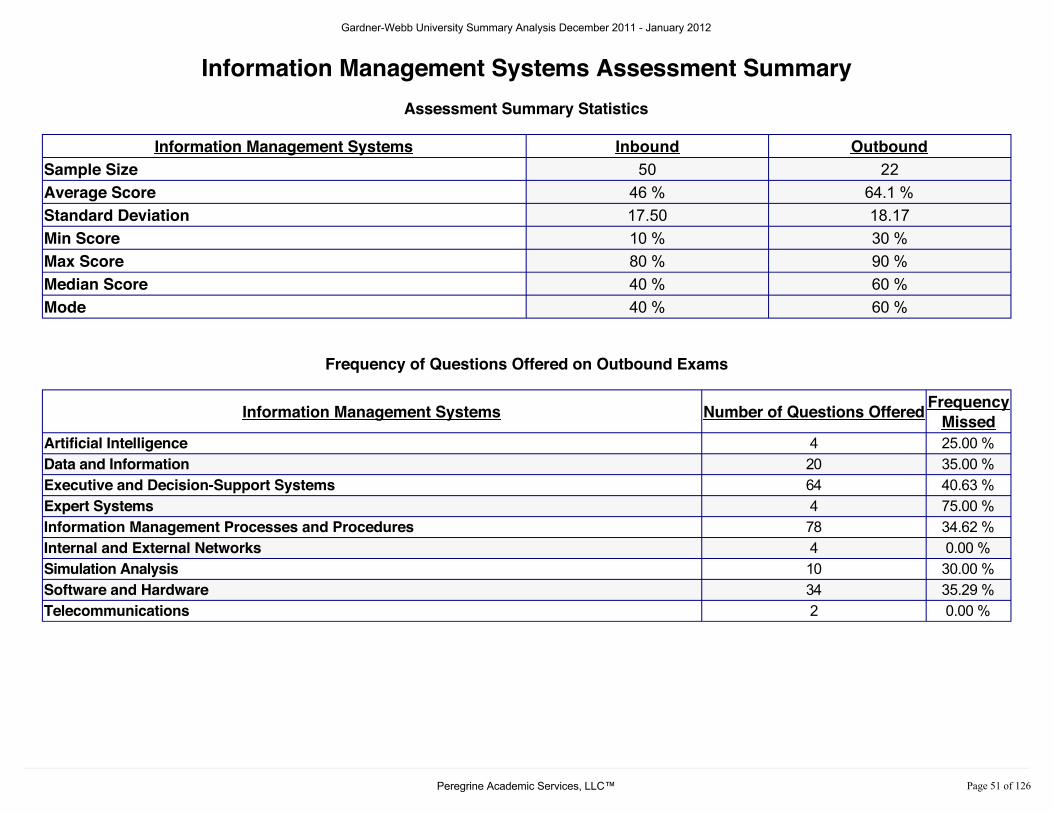
Information Management Systems Assessment SummaryAssessment Summary Statistics
Information Management Systems Inbound OutboundSample Size 50 22Average Score 46 % 64.1 %Standard Deviation 17.50 18.17Min Score 10 % 30 %Max Score 80 % 90 %Median Score 40 % 60 %Mode 40 % 60 %
Frequency of Questions Offered on Outbound Exams
Information Management Systems Number of Questions Offered FrequencyMissed
Artificial Intelligence 4 25.00 %Data and Information 20 35.00 %Executive and Decision-Support Systems 64 40.63 %Expert Systems 4 75.00 %Information Management Processes and Procedures 78 34.62 %Internal and External Networks 4 0.00 %Simulation Analysis 10 30.00 %Software and Hardware 34 35.29 %Telecommunications 2 0.00 %
I n f o r m a t i o n M a n a g e m e n t S y s t e m s
Gardner-Webb University Summary Analysis December 2011 - January 2012
3HUHJULQH�$FDGHPLF�6HUYLFHV��//&� 3DJH����RI�����
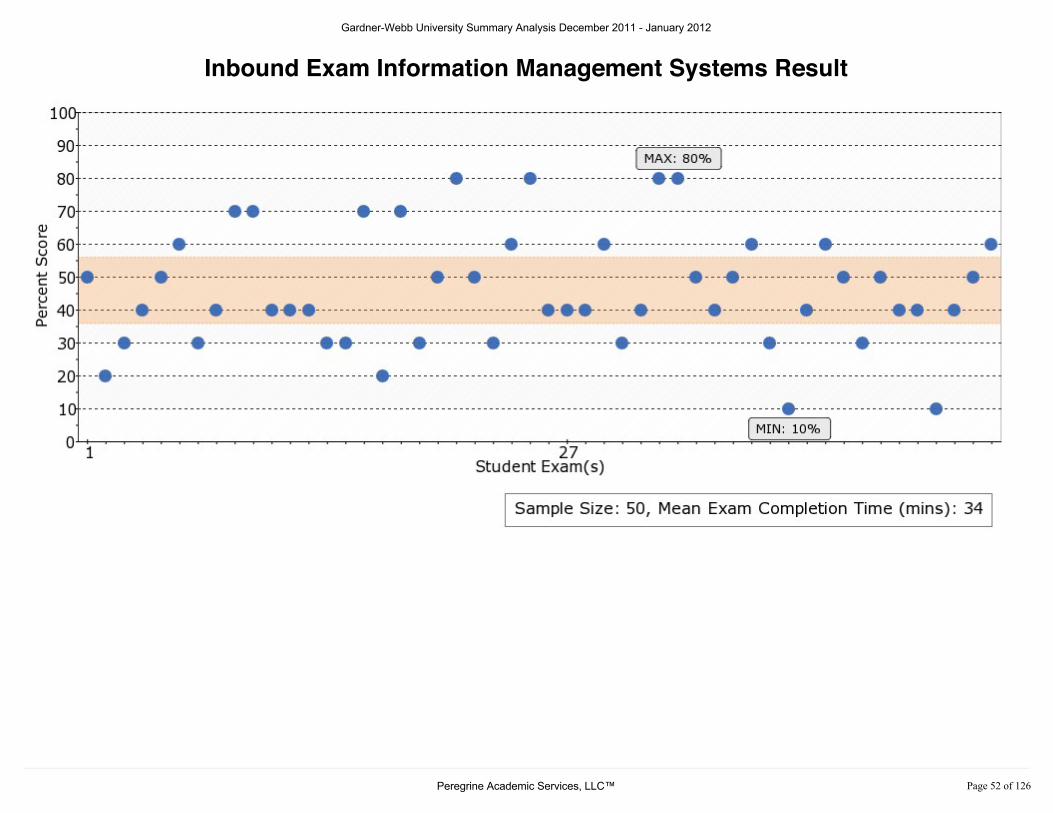
Inbound Exam Information Management Systems Result
Gardner-Webb University Summary Analysis December 2011 - January 2012
3HUHJULQH�$FDGHPLF�6HUYLFHV��//&� 3DJH����RI�����
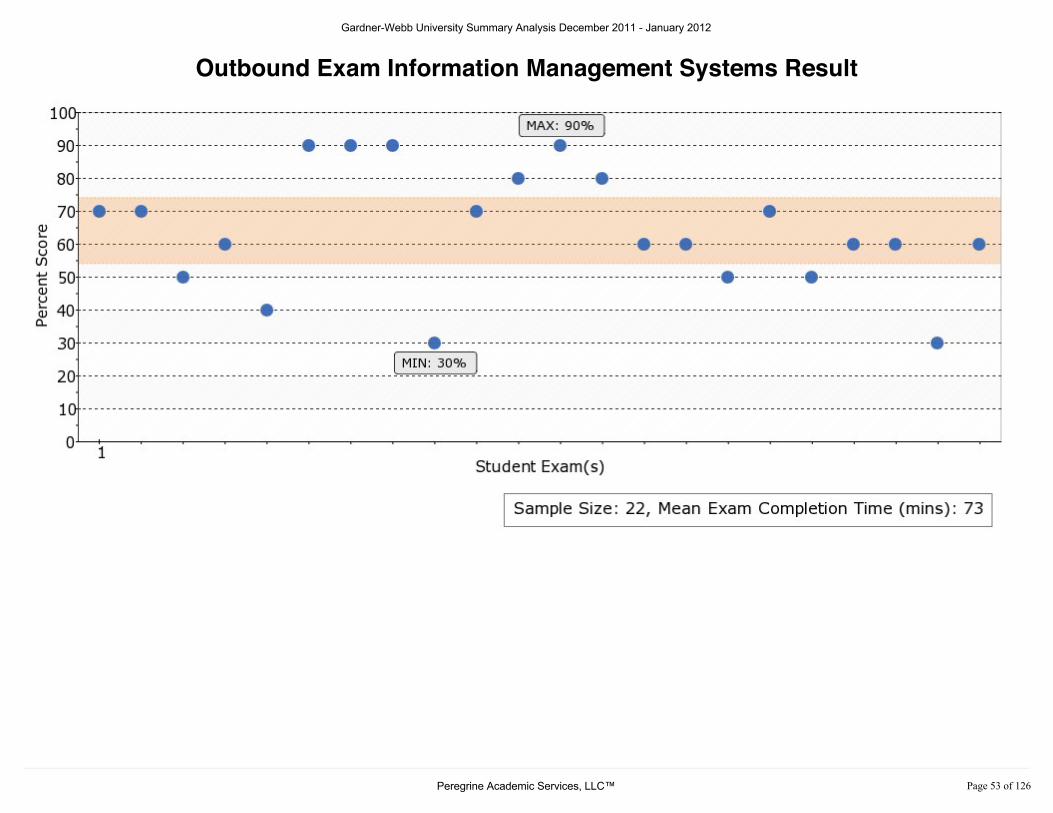
Outbound Exam Information Management Systems Result
Gardner-Webb University Summary Analysis December 2011 - January 2012
3HUHJULQH�$FDGHPLF�6HUYLFHV��//&� 3DJH����RI�����
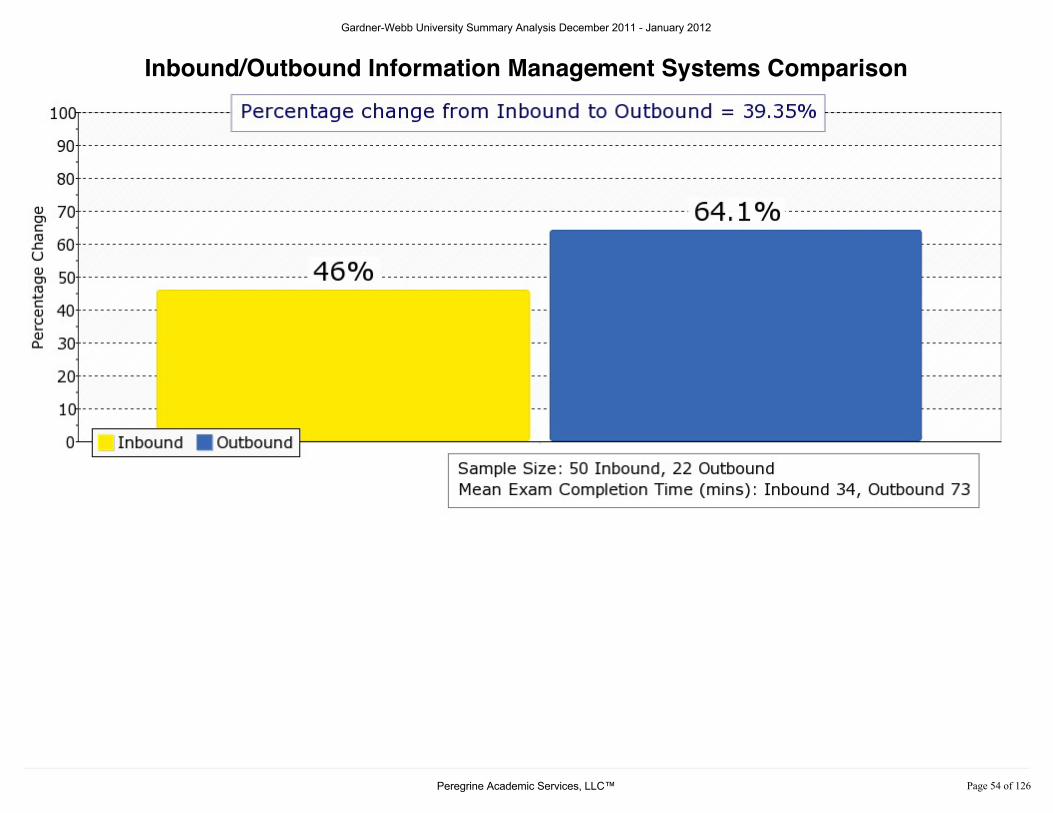
Inbound/Outbound Information Management Systems Comparison
Gardner-Webb University Summary Analysis December 2011 - January 2012
3HUHJULQH�$FDGHPLF�6HUYLFHV��//&� 3DJH����RI�����
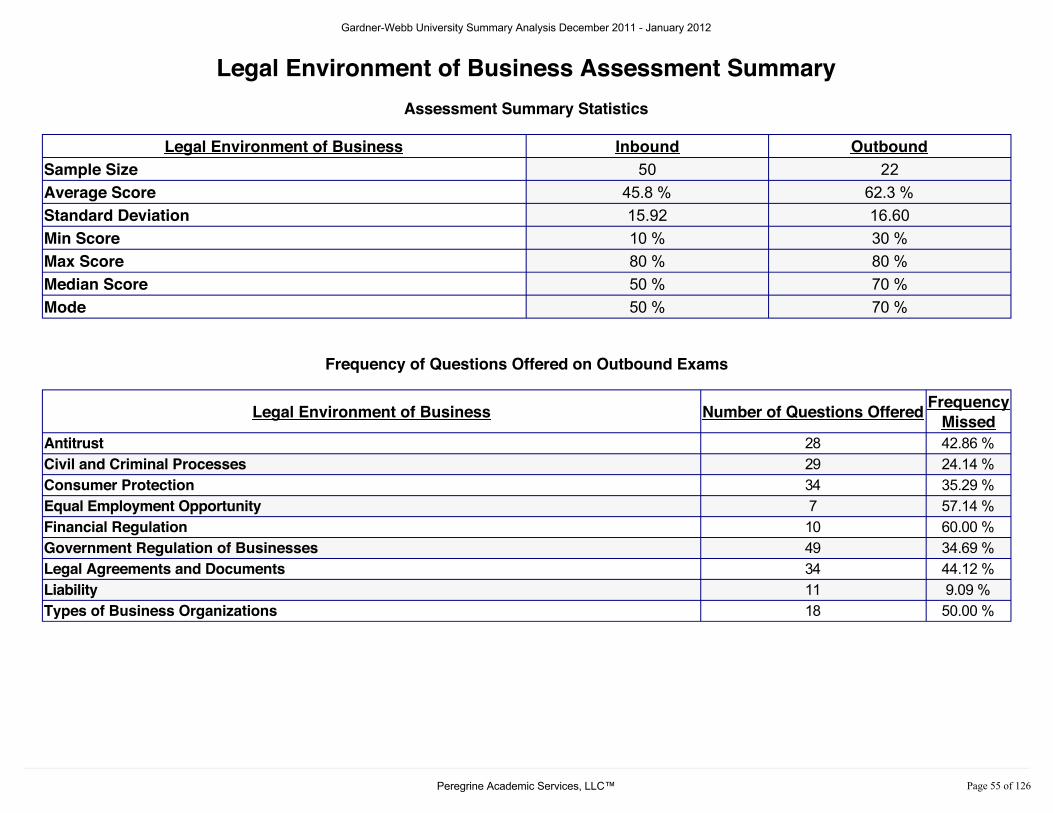
Legal Environment of Business Assessment SummaryAssessment Summary Statistics
Legal Environment of Business Inbound OutboundSample Size 50 22Average Score 45.8 % 62.3 %Standard Deviation 15.92 16.60Min Score 10 % 30 %Max Score 80 % 80 %Median Score 50 % 70 %Mode 50 % 70 %
Frequency of Questions Offered on Outbound Exams
Legal Environment of Business Number of Questions Offered FrequencyMissed
Antitrust 28 42.86 %Civil and Criminal Processes 29 24.14 %Consumer Protection 34 35.29 %Equal Employment Opportunity 7 57.14 %Financial Regulation 10 60.00 %Government Regulation of Businesses 49 34.69 %Legal Agreements and Documents 34 44.12 %Liability 11 9.09 %Types of Business Organizations 18 50.00 %
L e g a l E n v i r o n m e n t o f B u s i n e s s
Gardner-Webb University Summary Analysis December 2011 - January 2012
3HUHJULQH�$FDGHPLF�6HUYLFHV��//&� 3DJH����RI�����

Inbound Exam Legal Environment of Business Result
Gardner-Webb University Summary Analysis December 2011 - January 2012
3HUHJULQH�$FDGHPLF�6HUYLFHV��//&� 3DJH����RI�����
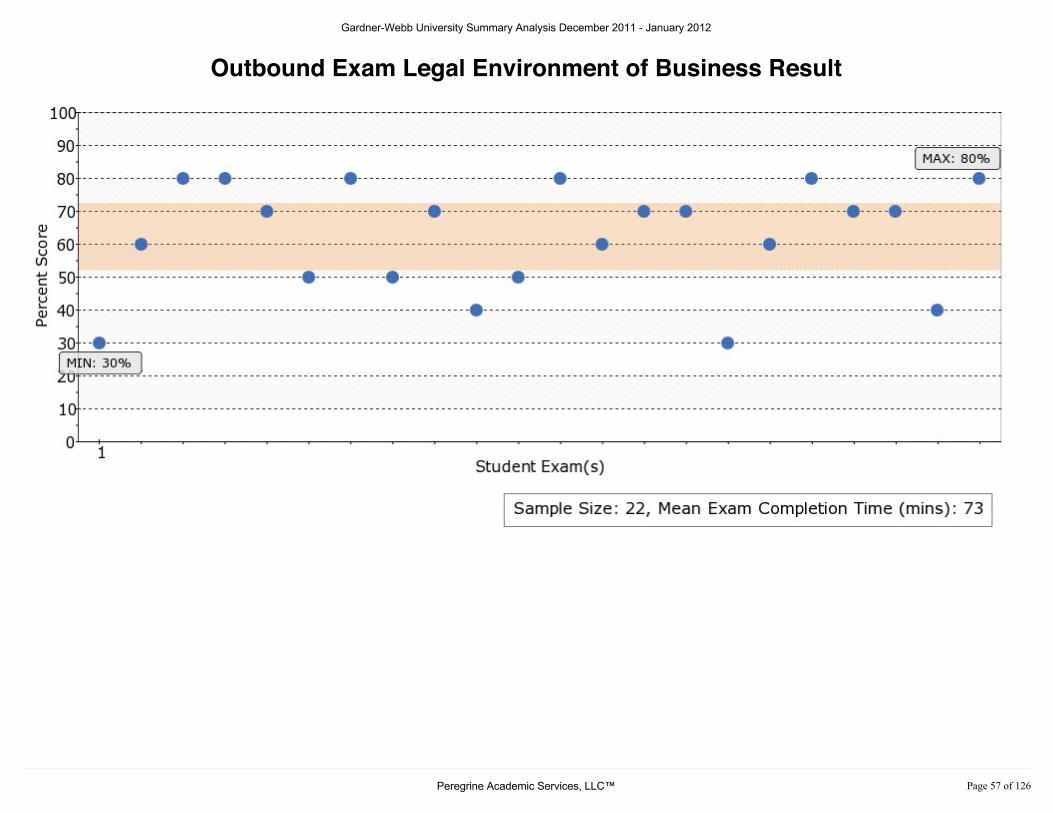
Outbound Exam Legal Environment of Business Result
Gardner-Webb University Summary Analysis December 2011 - January 2012
3HUHJULQH�$FDGHPLF�6HUYLFHV��//&� 3DJH����RI�����
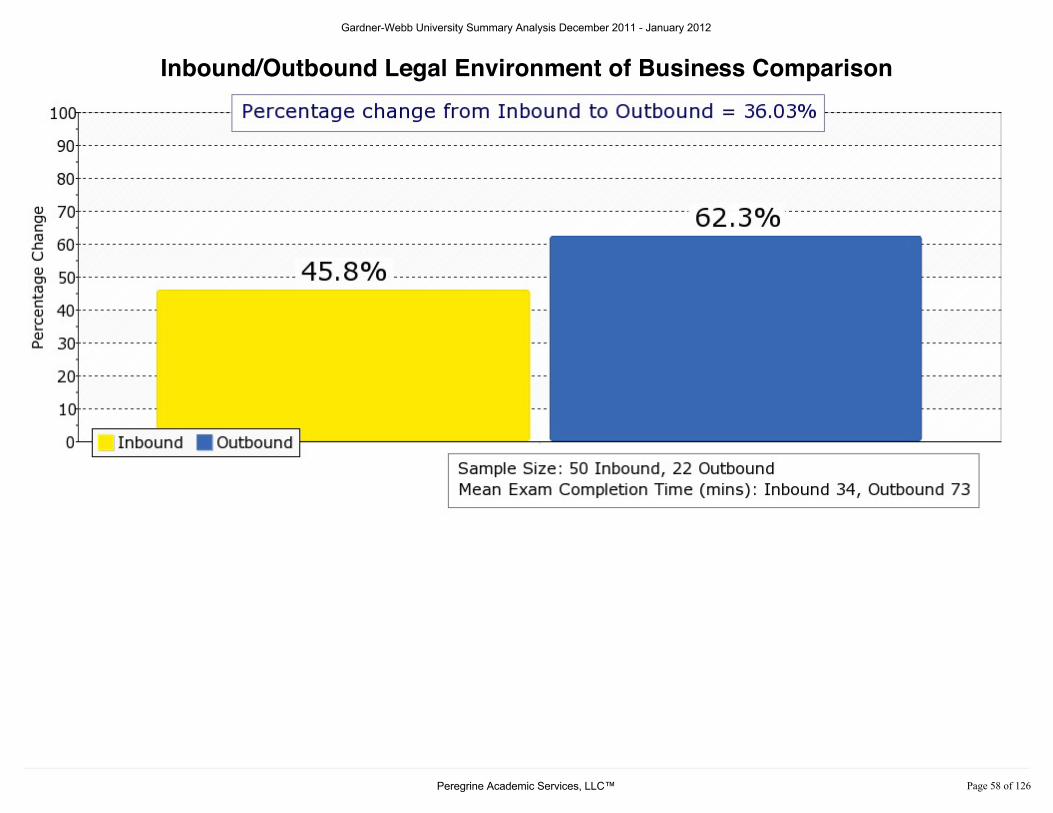
Inbound/Outbound Legal Environment of Business Comparison
Gardner-Webb University Summary Analysis December 2011 - January 2012
3HUHJULQH�$FDGHPLF�6HUYLFHV��//&� 3DJH����RI�����
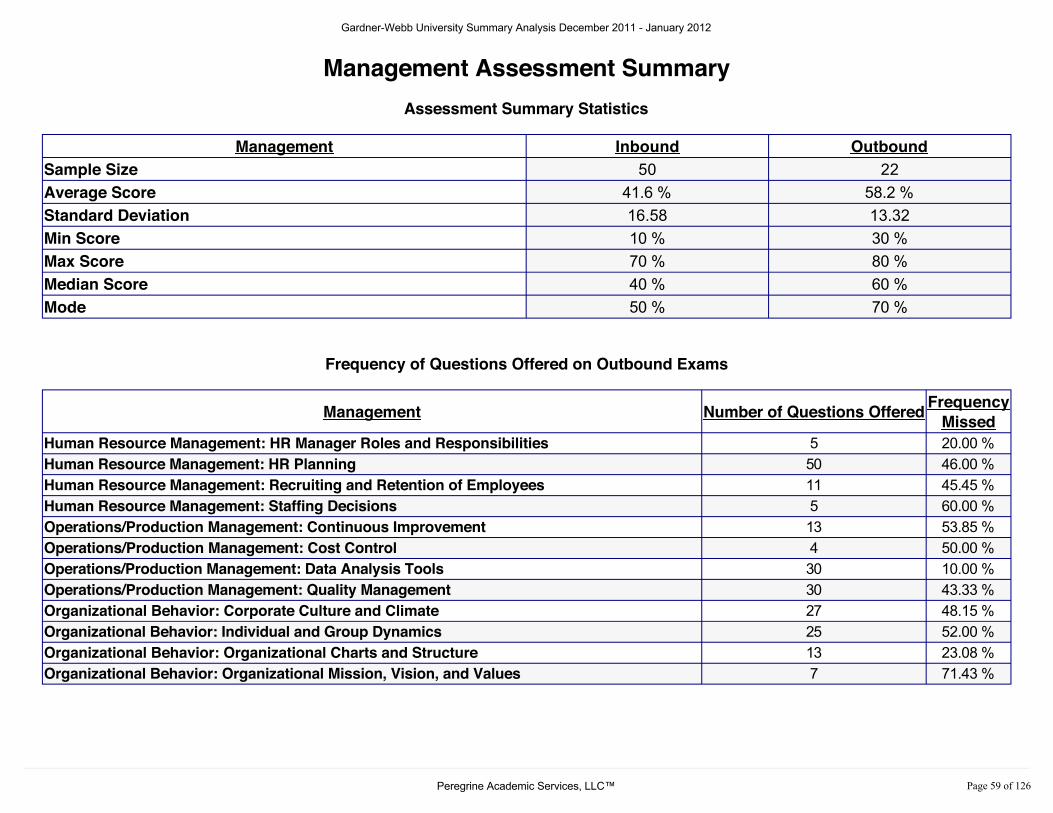
Management Assessment SummaryAssessment Summary Statistics
Management Inbound OutboundSample Size 50 22Average Score 41.6 % 58.2 %Standard Deviation 16.58 13.32Min Score 10 % 30 %Max Score 70 % 80 %Median Score 40 % 60 %Mode 50 % 70 %
Frequency of Questions Offered on Outbound Exams
Management Number of Questions Offered FrequencyMissed
Human Resource Management: HR Manager Roles and Responsibilities 5 20.00 %Human Resource Management: HR Planning 50 46.00 %Human Resource Management: Recruiting and Retention of Employees 11 45.45 %Human Resource Management: Staffing Decisions 5 60.00 %Operations/Production Management: Continuous Improvement 13 53.85 %Operations/Production Management: Cost Control 4 50.00 %Operations/Production Management: Data Analysis Tools 30 10.00 %Operations/Production Management: Quality Management 30 43.33 %Organizational Behavior: Corporate Culture and Climate 27 48.15 %Organizational Behavior: Individual and Group Dynamics 25 52.00 %Organizational Behavior: Organizational Charts and Structure 13 23.08 %Organizational Behavior: Organizational Mission, Vision, and Values 7 71.43 %
M a n a g e m e n t
Gardner-Webb University Summary Analysis December 2011 - January 2012
3HUHJULQH�$FDGHPLF�6HUYLFHV��//&� 3DJH����RI�����
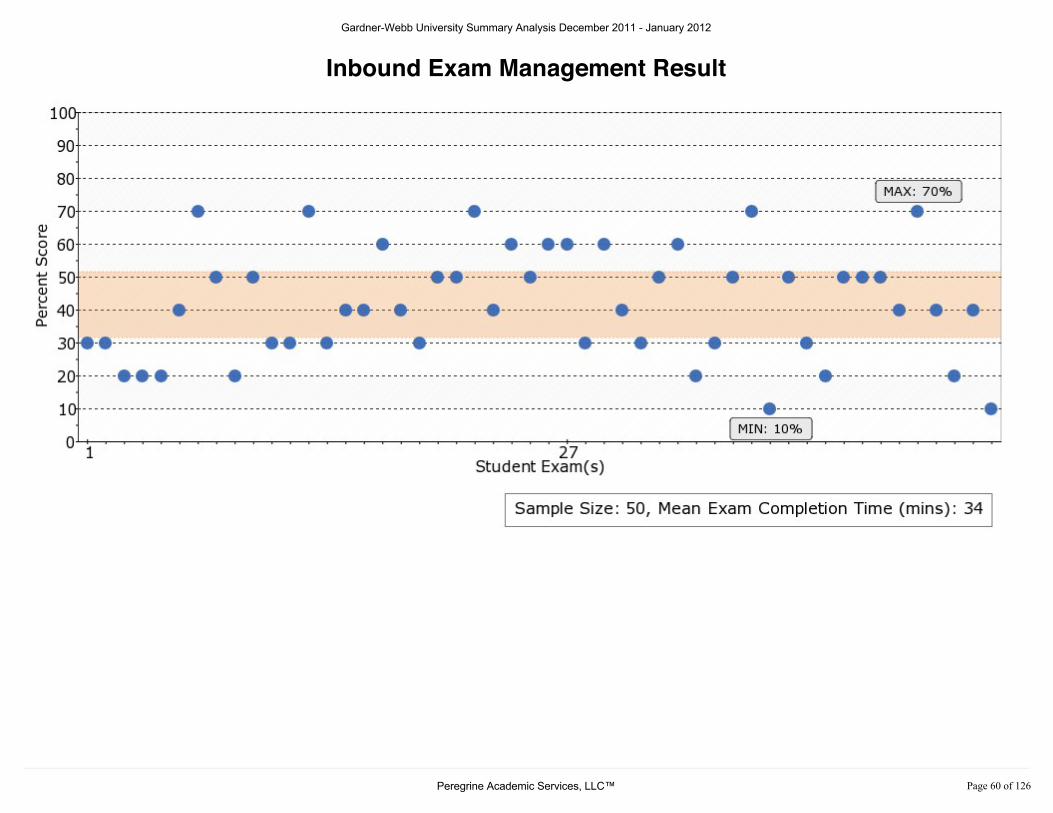
Inbound Exam Management Result
Gardner-Webb University Summary Analysis December 2011 - January 2012
3HUHJULQH�$FDGHPLF�6HUYLFHV��//&� 3DJH����RI�����

Outbound Exam Management Result
Gardner-Webb University Summary Analysis December 2011 - January 2012
3HUHJULQH�$FDGHPLF�6HUYLFHV��//&� 3DJH����RI�����
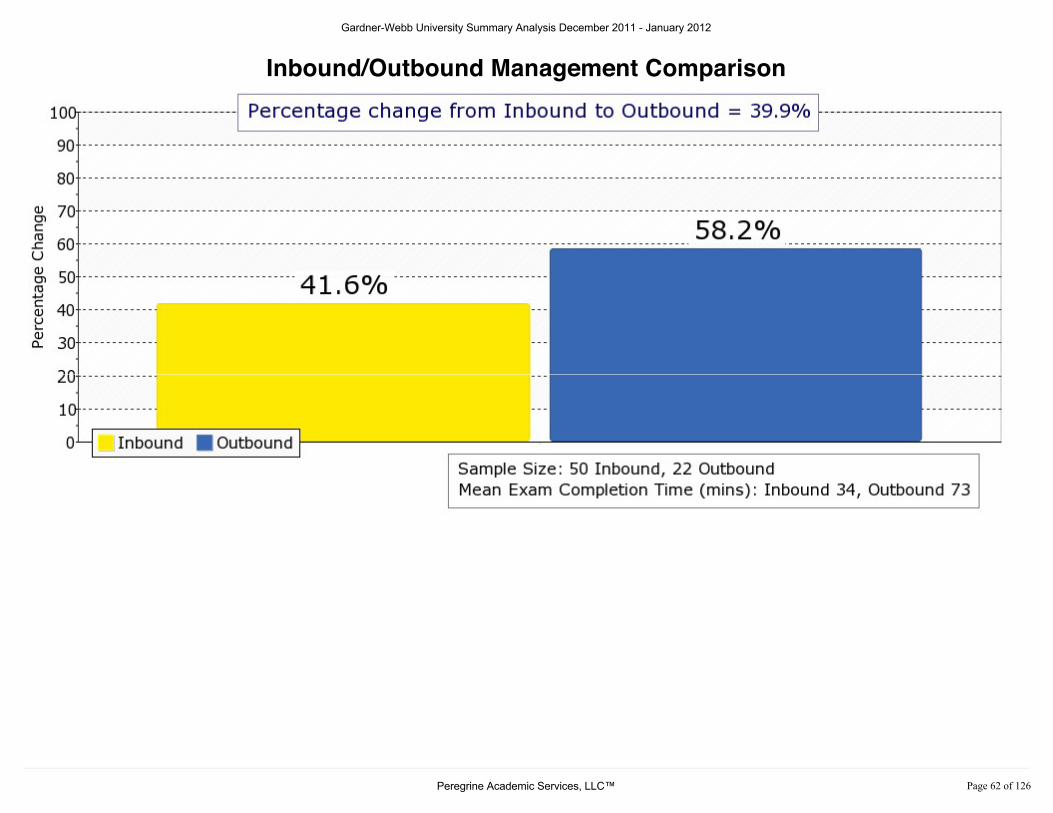
Inbound/Outbound Management Comparison
Gardner-Webb University Summary Analysis December 2011 - January 2012
3HUHJULQH�$FDGHPLF�6HUYLFHV��//&� 3DJH����RI�����
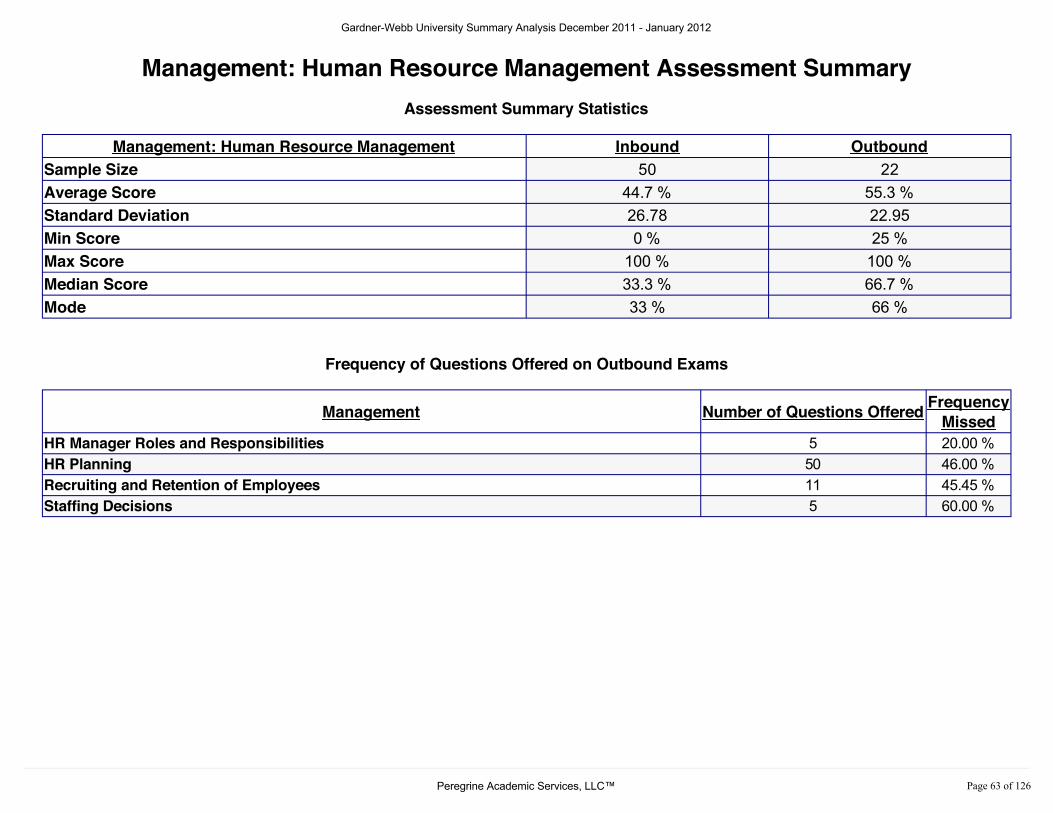
Management: Human Resource Management Assessment SummaryAssessment Summary Statistics
Management: Human Resource Management Inbound OutboundSample Size 50 22Average Score 44.7 % 55.3 %Standard Deviation 26.78 22.95Min Score 0 % 25 %Max Score 100 % 100 %Median Score 33.3 % 66.7 %Mode 33 % 66 %
Frequency of Questions Offered on Outbound Exams
Management Number of Questions Offered FrequencyMissed
HR Manager Roles and Responsibilities 5 20.00 %HR Planning 50 46.00 %Recruiting and Retention of Employees 11 45.45 %Staffing Decisions 5 60.00 %
M a n a g e m e n t : H u m a n R e s o u r c e M a n a g e m e n t
Gardner-Webb University Summary Analysis December 2011 - January 2012
3HUHJULQH�$FDGHPLF�6HUYLFHV��//&� 3DJH����RI�����
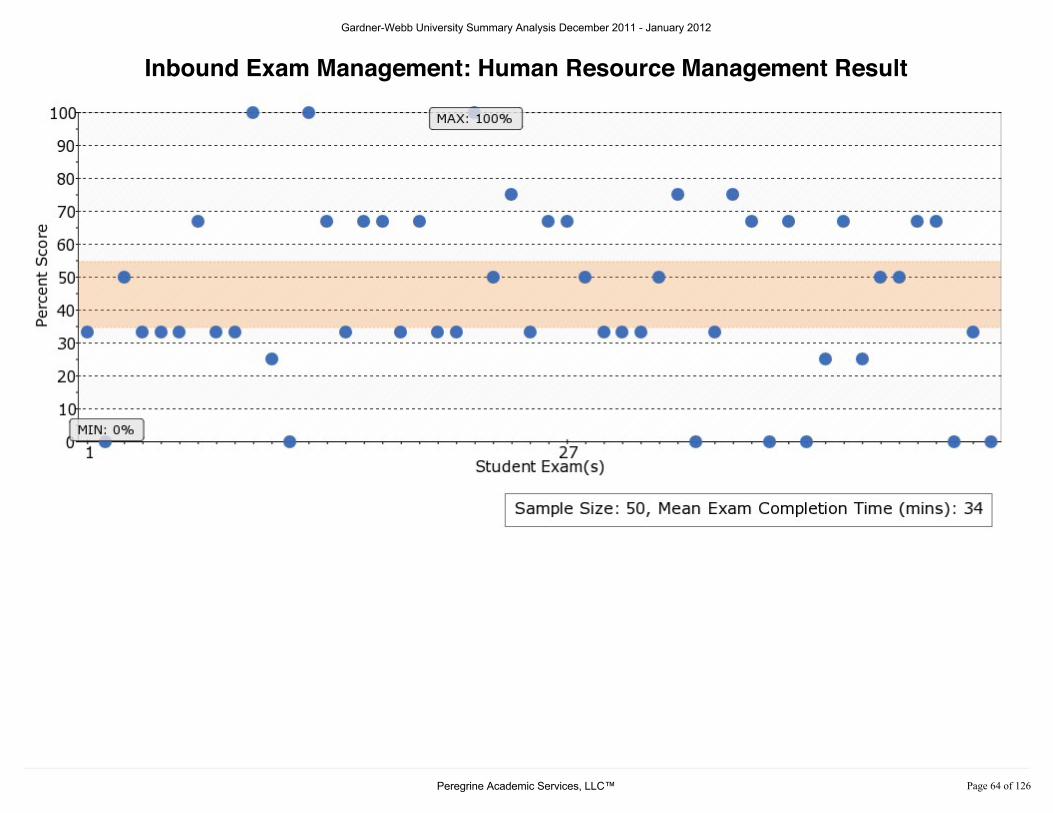
Inbound Exam Management: Human Resource Management Result
Gardner-Webb University Summary Analysis December 2011 - January 2012
3HUHJULQH�$FDGHPLF�6HUYLFHV��//&� 3DJH����RI�����
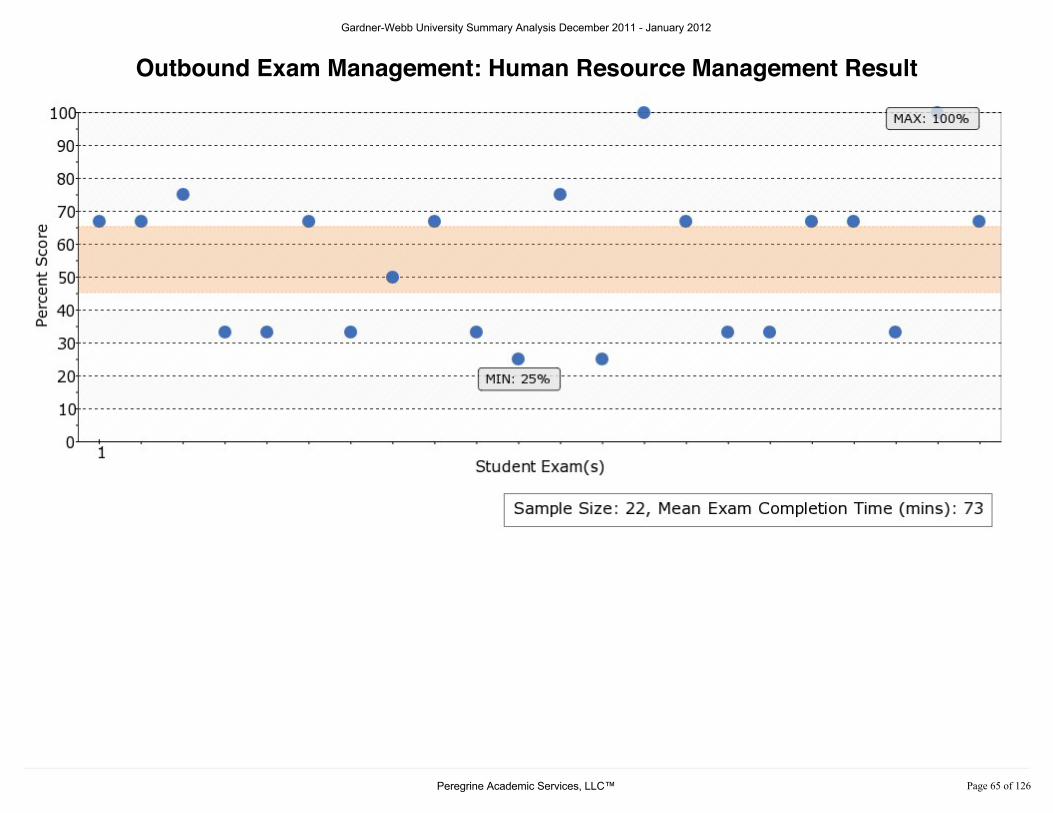
Outbound Exam Management: Human Resource Management Result
Gardner-Webb University Summary Analysis December 2011 - January 2012
3HUHJULQH�$FDGHPLF�6HUYLFHV��//&� 3DJH����RI�����
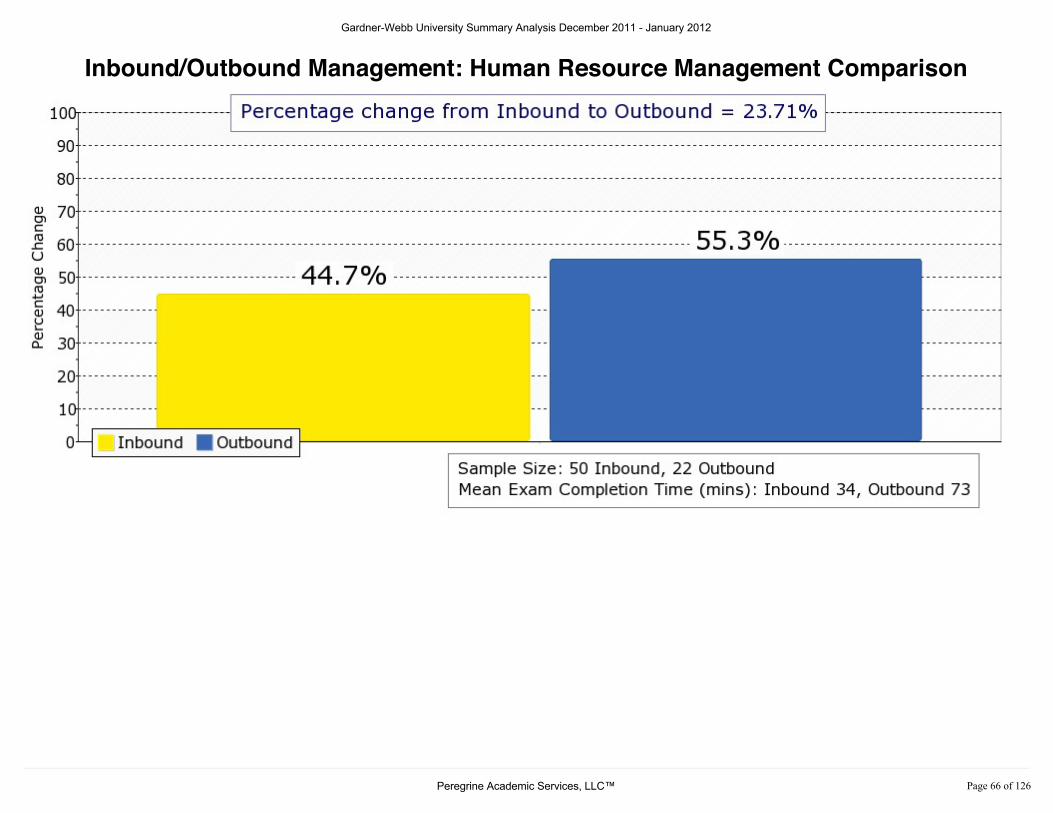
Inbound/Outbound Management: Human Resource Management Comparison
Gardner-Webb University Summary Analysis December 2011 - January 2012
3HUHJULQH�$FDGHPLF�6HUYLFHV��//&� 3DJH����RI�����
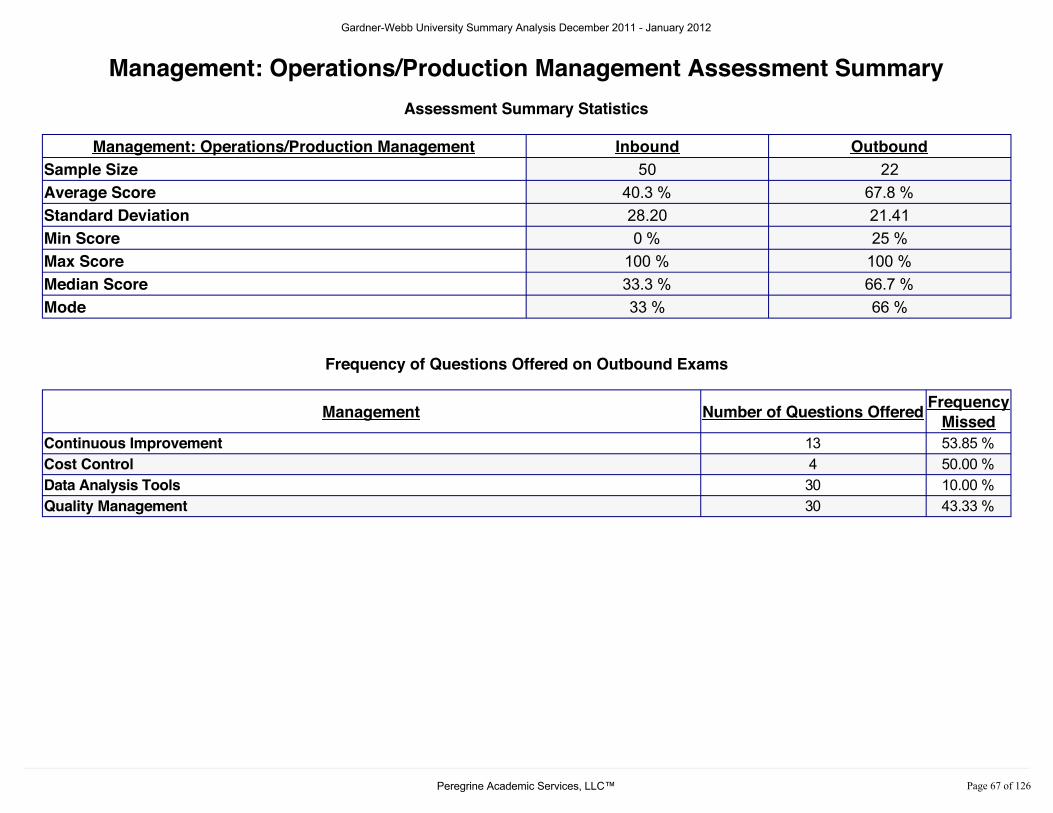
Management: Operations/Production Management Assessment SummaryAssessment Summary Statistics
Management: Operations/Production Management Inbound OutboundSample Size 50 22Average Score 40.3 % 67.8 %Standard Deviation 28.20 21.41Min Score 0 % 25 %Max Score 100 % 100 %Median Score 33.3 % 66.7 %Mode 33 % 66 %
Frequency of Questions Offered on Outbound Exams
Management Number of Questions Offered FrequencyMissed
Continuous Improvement 13 53.85 %Cost Control 4 50.00 %Data Analysis Tools 30 10.00 %Quality Management 30 43.33 %
M a n a g e m e n t : O p e r a t i o n s / P r o d u c t i o n M a n a g e m e n t
Gardner-Webb University Summary Analysis December 2011 - January 2012
3HUHJULQH�$FDGHPLF�6HUYLFHV��//&� 3DJH����RI�����

Inbound Exam Management: Operations/Production Management Result
Gardner-Webb University Summary Analysis December 2011 - January 2012
3HUHJULQH�$FDGHPLF�6HUYLFHV��//&� 3DJH����RI�����
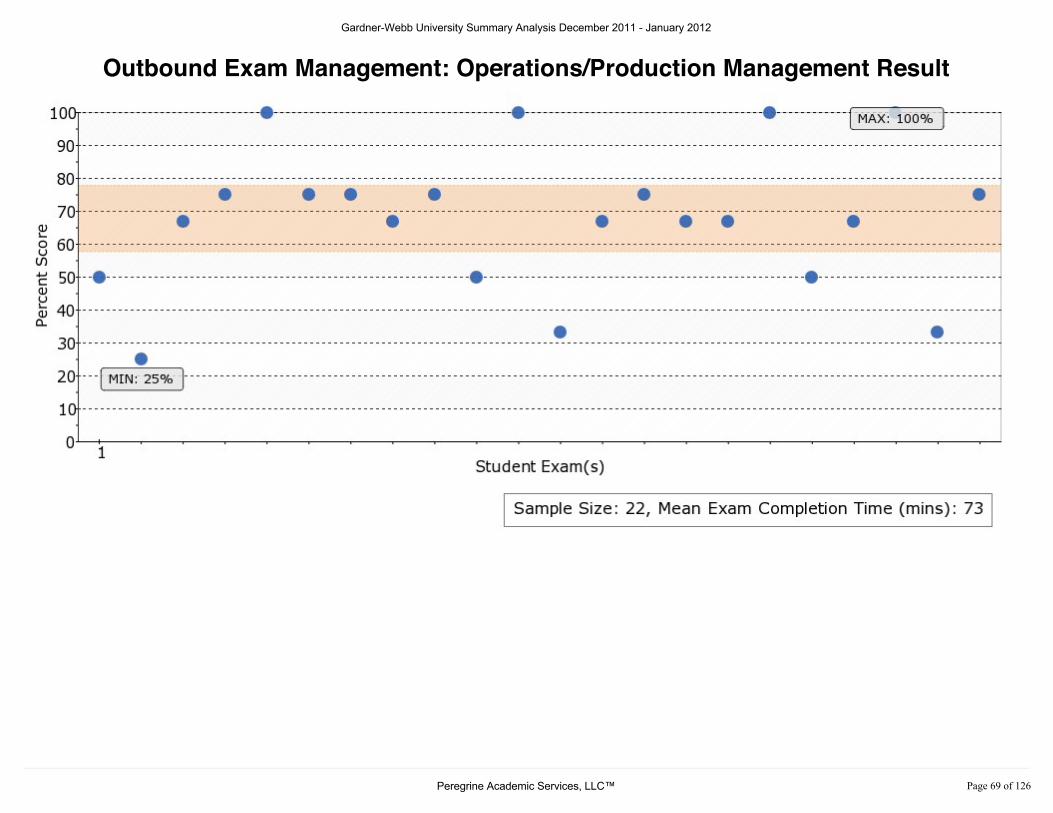
Outbound Exam Management: Operations/Production Management Result
Gardner-Webb University Summary Analysis December 2011 - January 2012
3HUHJULQH�$FDGHPLF�6HUYLFHV��//&� 3DJH����RI�����
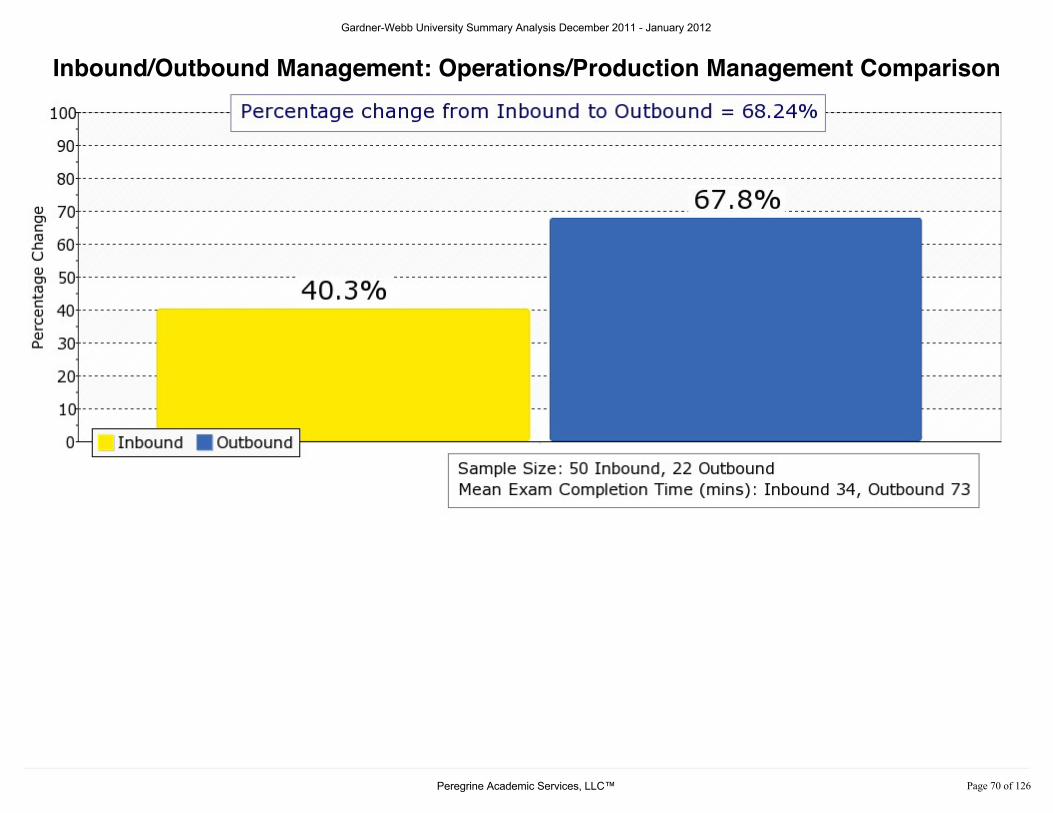
Inbound/Outbound Management: Operations/Production Management Comparison
Gardner-Webb University Summary Analysis December 2011 - January 2012
3HUHJULQH�$FDGHPLF�6HUYLFHV��//&� 3DJH����RI�����
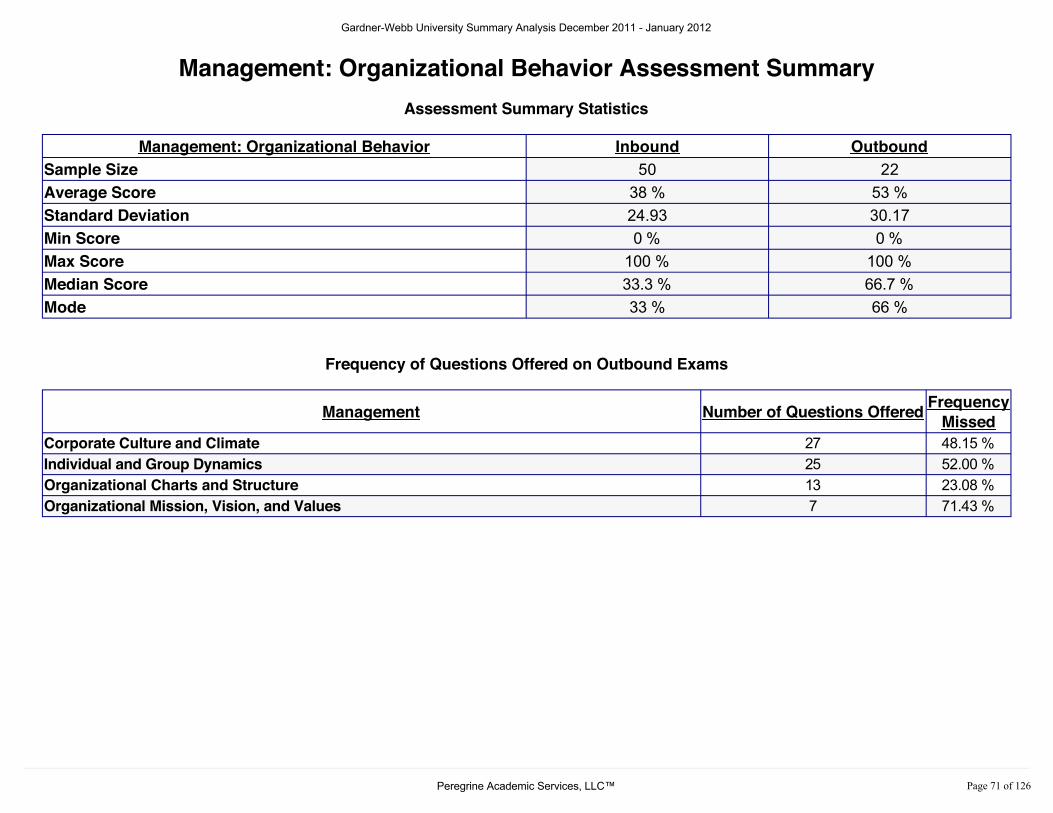
Management: Organizational Behavior Assessment SummaryAssessment Summary Statistics
Management: Organizational Behavior Inbound OutboundSample Size 50 22Average Score 38 % 53 %Standard Deviation 24.93 30.17Min Score 0 % 0 %Max Score 100 % 100 %Median Score 33.3 % 66.7 %Mode 33 % 66 %
Frequency of Questions Offered on Outbound Exams
Management Number of Questions Offered FrequencyMissed
Corporate Culture and Climate 27 48.15 %Individual and Group Dynamics 25 52.00 %Organizational Charts and Structure 13 23.08 %Organizational Mission, Vision, and Values 7 71.43 %
M a n a g e m e n t : O r g a n i z a t i o n a l B e h a v i o r
Gardner-Webb University Summary Analysis December 2011 - January 2012
3HUHJULQH�$FDGHPLF�6HUYLFHV��//&� 3DJH����RI�����

Inbound Exam Management: Organizational Behavior Result
Gardner-Webb University Summary Analysis December 2011 - January 2012
3HUHJULQH�$FDGHPLF�6HUYLFHV��//&� 3DJH����RI�����

Outbound Exam Management: Organizational Behavior Result
Gardner-Webb University Summary Analysis December 2011 - January 2012
3HUHJULQH�$FDGHPLF�6HUYLFHV��//&� 3DJH����RI�����
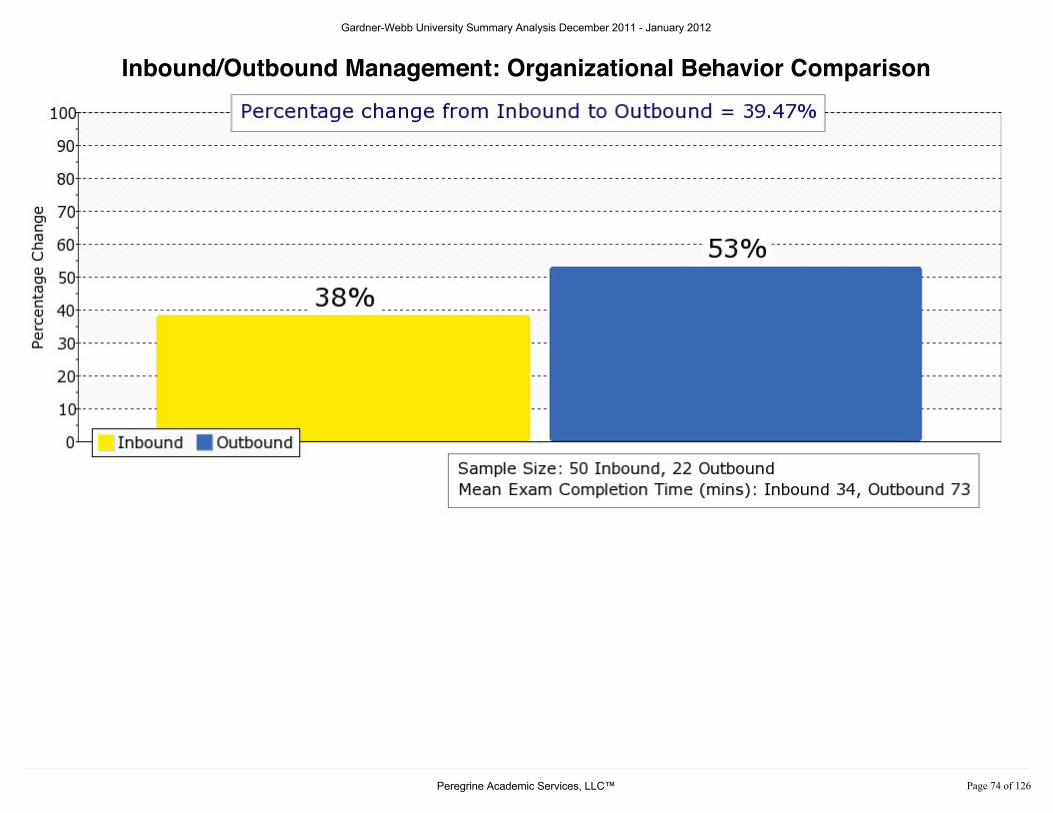
Inbound/Outbound Management: Organizational Behavior Comparison
Gardner-Webb University Summary Analysis December 2011 - January 2012
3HUHJULQH�$FDGHPLF�6HUYLFHV��//&� 3DJH����RI�����

Marketing Assessment SummaryAssessment Summary Statistics
Marketing Inbound OutboundSample Size 50 22Average Score 21.4 % 36.8 %Standard Deviation 11.61 17.29Min Score 0 % 10 %Max Score 50 % 70 %Median Score 20 % 40 %Mode 20 % 20 %
Frequency of Questions Offered on Outbound Exams
Marketing Number of Questions Offered FrequencyMissed
Marketing Research, Planning, and Strategy 58 65.52 %People 9 33.33 %Place 11 81.82 %Price 79 70.89 %Product 49 55.10 %Promotion 14 42.86 %
M a r k e t i n g
Gardner-Webb University Summary Analysis December 2011 - January 2012
3HUHJULQH�$FDGHPLF�6HUYLFHV��//&� 3DJH����RI�����
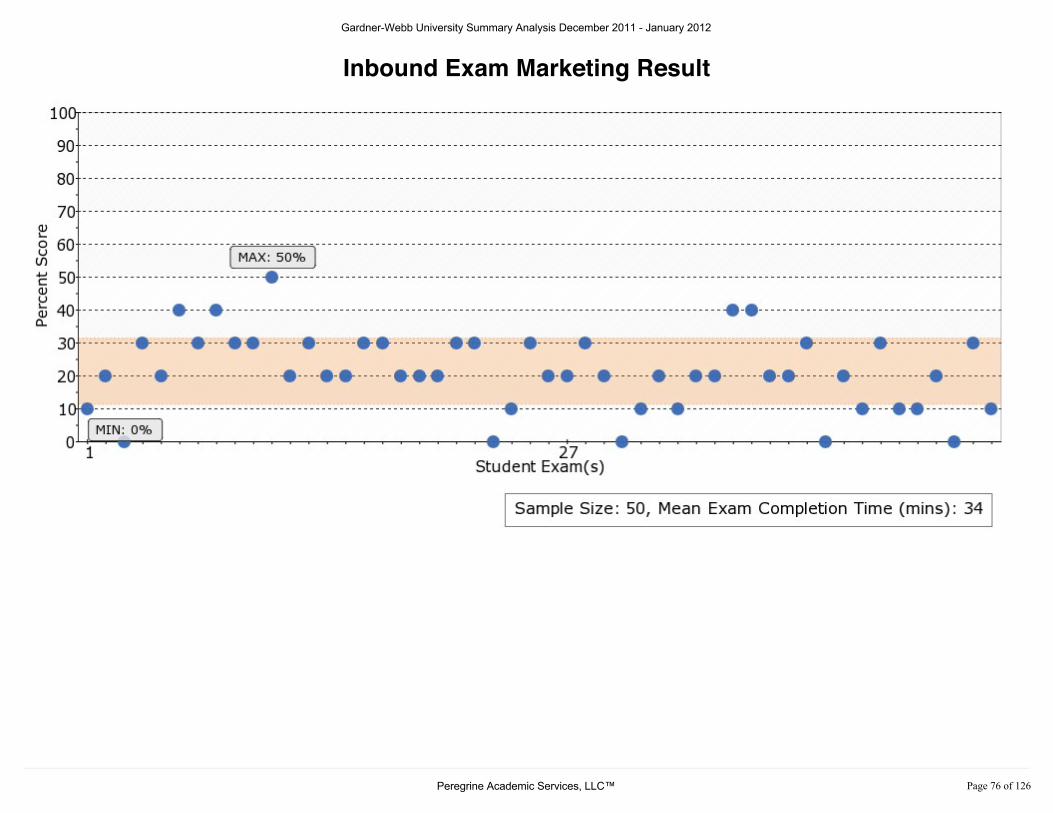
Inbound Exam Marketing Result
Gardner-Webb University Summary Analysis December 2011 - January 2012
3HUHJULQH�$FDGHPLF�6HUYLFHV��//&� 3DJH����RI�����

Outbound Exam Marketing Result
Gardner-Webb University Summary Analysis December 2011 - January 2012
3HUHJULQH�$FDGHPLF�6HUYLFHV��//&� 3DJH����RI�����
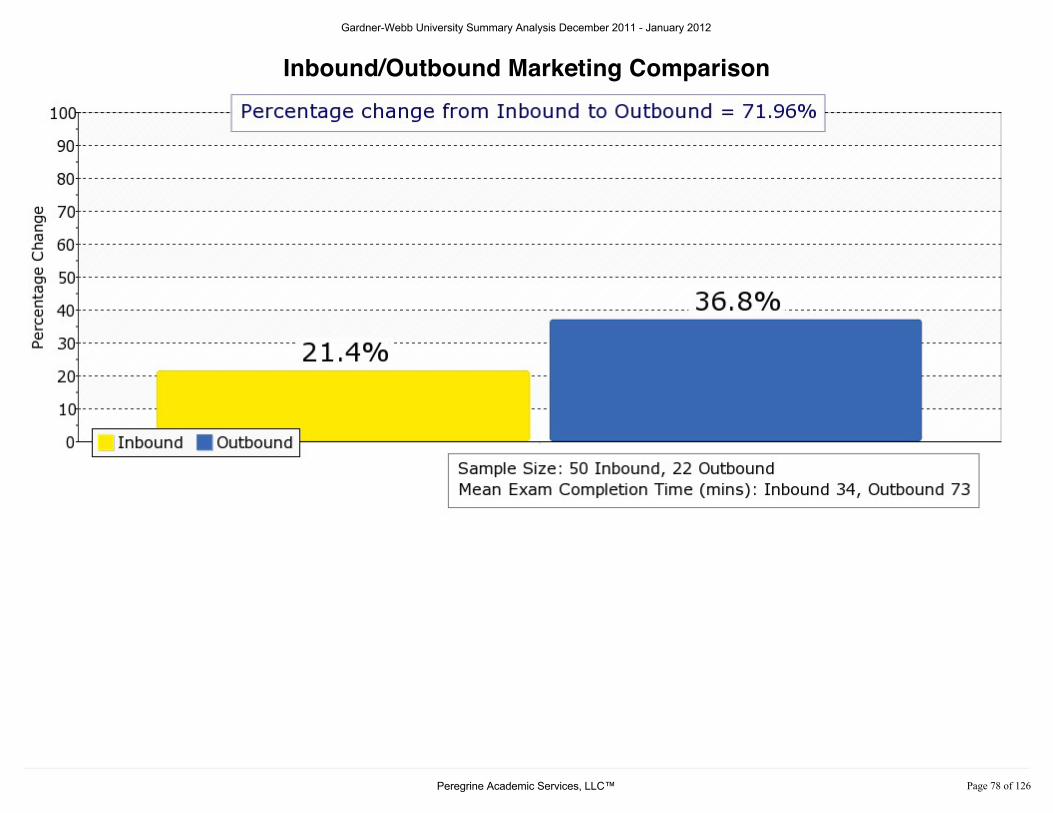
Inbound/Outbound Marketing Comparison
Gardner-Webb University Summary Analysis December 2011 - January 2012
3HUHJULQH�$FDGHPLF�6HUYLFHV��//&� 3DJH����RI�����
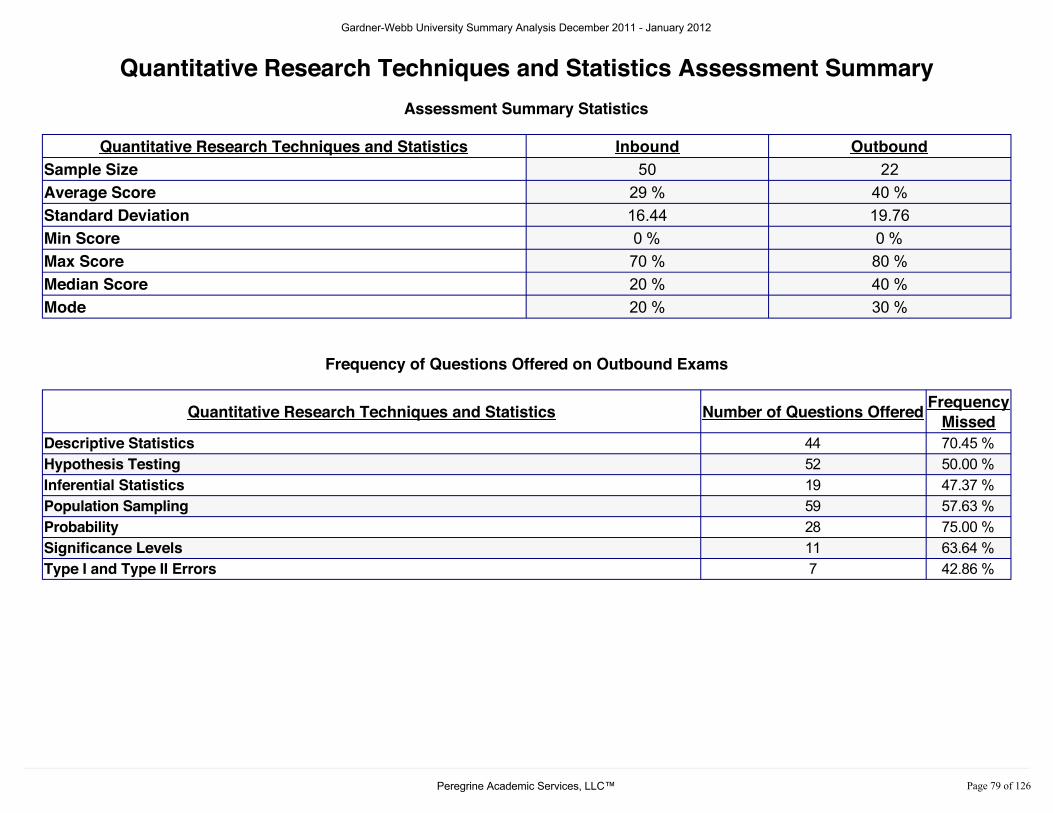
Quantitative Research Techniques and Statistics Assessment SummaryAssessment Summary Statistics
Quantitative Research Techniques and Statistics Inbound OutboundSample Size 50 22Average Score 29 % 40 %Standard Deviation 16.44 19.76Min Score 0 % 0 %Max Score 70 % 80 %Median Score 20 % 40 %Mode 20 % 30 %
Frequency of Questions Offered on Outbound Exams
Quantitative Research Techniques and Statistics Number of Questions Offered FrequencyMissed
Descriptive Statistics 44 70.45 %Hypothesis Testing 52 50.00 %Inferential Statistics 19 47.37 %Population Sampling 59 57.63 %Probability 28 75.00 %Significance Levels 11 63.64 %Type I and Type II Errors 7 42.86 %
Q u a n t i t a t i v e R e s e a r c h T e c h n i q u e s a n d S t a t i s t i c s
Gardner-Webb University Summary Analysis December 2011 - January 2012
3HUHJULQH�$FDGHPLF�6HUYLFHV��//&� 3DJH����RI�����

Inbound Exam Quantitative Research Techniques and Statistics Result
Gardner-Webb University Summary Analysis December 2011 - January 2012
3HUHJULQH�$FDGHPLF�6HUYLFHV��//&� 3DJH����RI�����
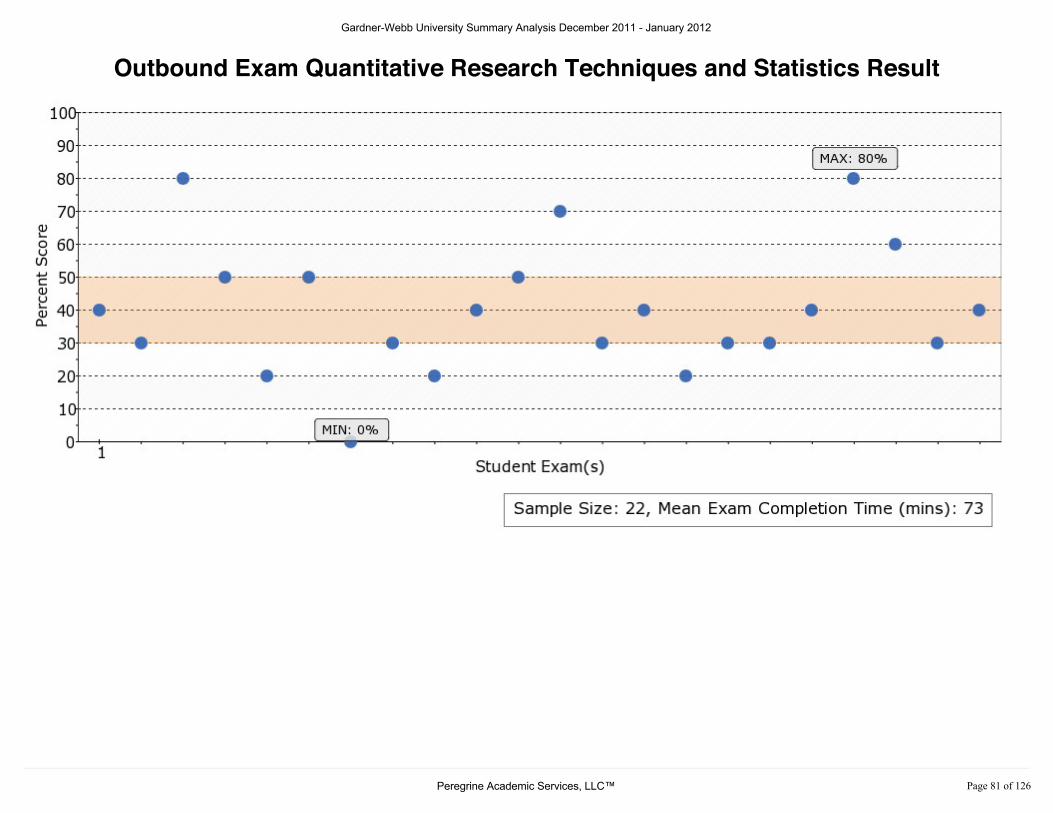
Outbound Exam Quantitative Research Techniques and Statistics Result
Gardner-Webb University Summary Analysis December 2011 - January 2012
3HUHJULQH�$FDGHPLF�6HUYLFHV��//&� 3DJH����RI�����

Inbound/Outbound Quantitative Research Techniques and Statistics Comparison
Gardner-Webb University Summary Analysis December 2011 - January 2012
3HUHJULQH�$FDGHPLF�6HUYLFHV��//&� 3DJH����RI�����
E x t e r n a l B e n c h m a r k i n g
External BenchmarkingGardner-Webb University
Academic Level: BachelorsDecember 2011 - January 2012
Included Course(s): ACCT-213, BADM-480Sample Size(s): 50 Inbound Exams, 22 Outbound Exams
Gardner-Webb University Summary Analysis December 2011 - January 2012
3HUHJULQH�$FDGHPLF�6HUYLFHV��//&� 3DJH����RI�����
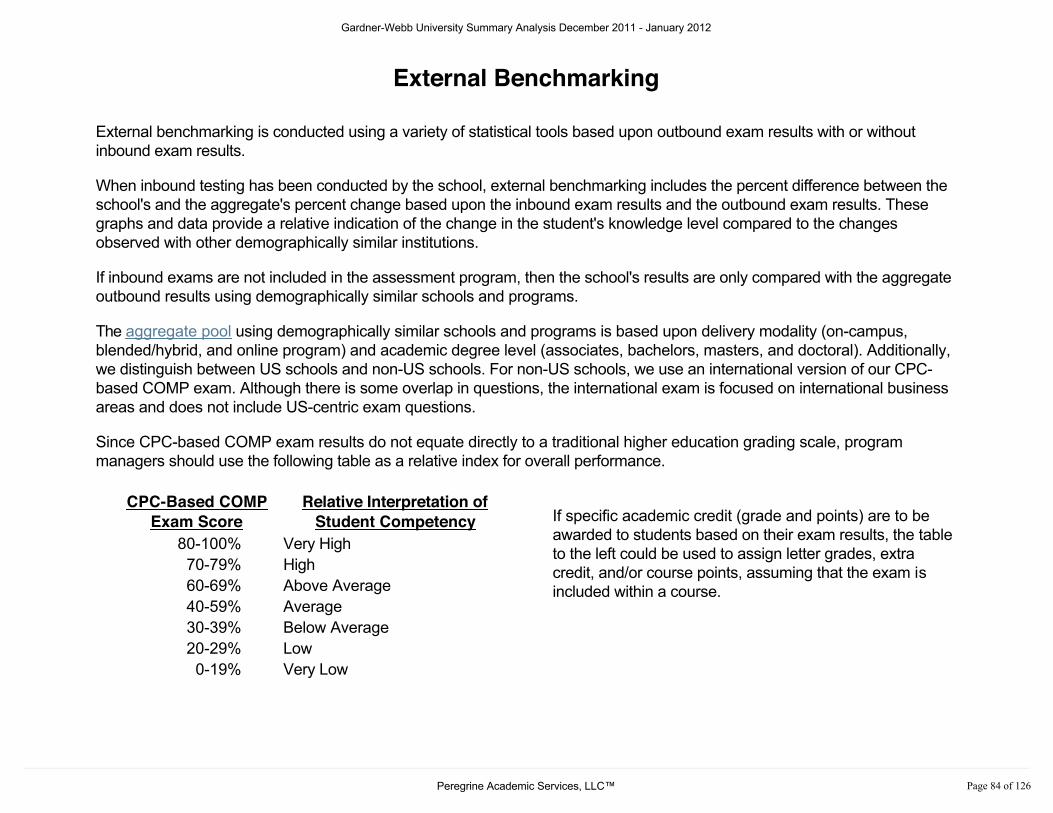
External Benchmarking
External benchmarking is conducted using a variety of statistical tools based upon outbound exam results with or withoutinbound exam results.
When inbound testing has been conducted by the school, external benchmarking includes the percent difference between theschool's and the aggregate's percent change based upon the inbound exam results and the outbound exam results. Thesegraphs and data provide a relative indication of the change in the student's knowledge level compared to the changesobserved with other demographically similar institutions.
If inbound exams are not included in the assessment program, then the school's results are only compared with the aggregateoutbound results using demographically similar schools and programs.
The aggregate pool using demographically similar schools and programs is based upon delivery modality (on-campus,blended/hybrid, and online program) and academic degree level (associates, bachelors, masters, and doctoral). Additionally,we distinguish between US schools and non-US schools. For non-US schools, we use an international version of our CPC-based COMP exam. Although there is some overlap in questions, the international exam is focused on international businessareas and does not include US-centric exam questions.
Since CPC-based COMP exam results do not equate directly to a traditional higher education grading scale, programmanagers should use the following table as a relative index for overall performance.
CPC-Based COMPExam Score
Relative Interpretation ofStudent Competency
80-100% Very High70-79% High60-69% Above Average40-59% Average30-39% Below Average20-29% Low
0-19% Very Low
If specific academic credit (grade and points) are to beawarded to students based on their exam results, the tableto the left could be used to assign letter grades, extracredit, and/or course points, assuming that the exam isincluded within a course.
Gardner-Webb University Summary Analysis December 2011 - January 2012
3HUHJULQH�$FDGHPLF�6HUYLFHV��//&� 3DJH����RI�����
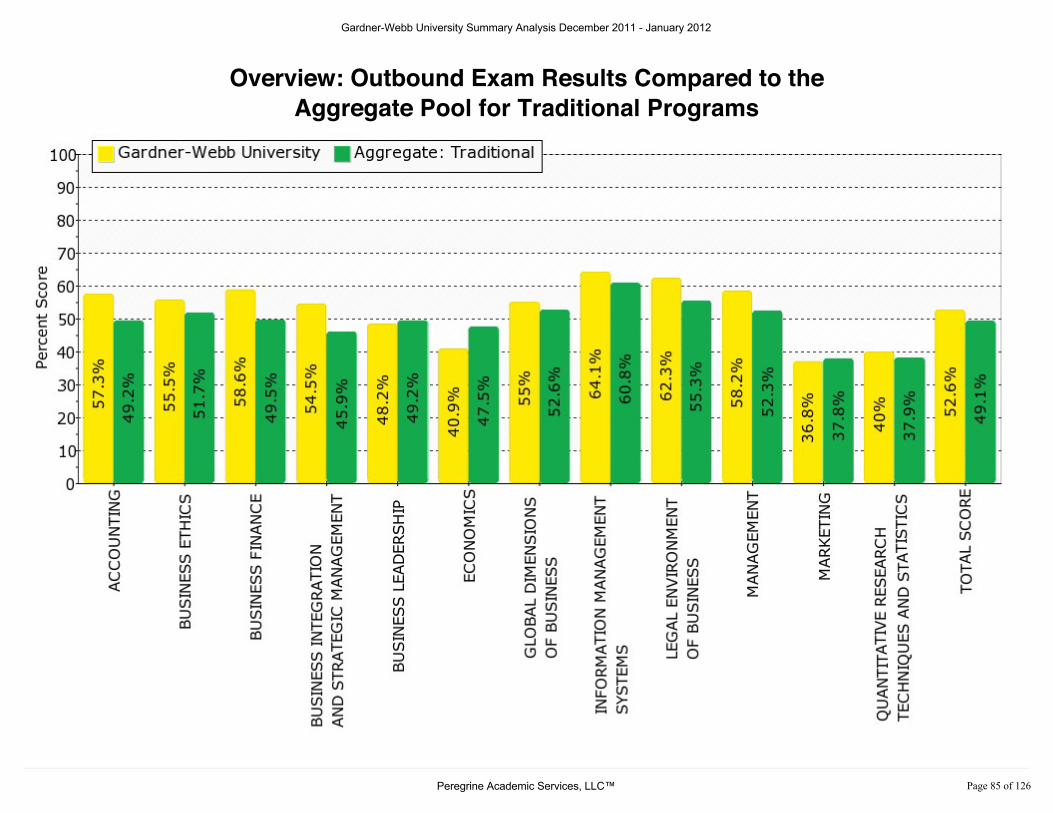
Overview: Outbound Exam Results Compared to theAggregate Pool for Traditional Programs
T o t a l R e s u l t s a n d S u m m a r y A n a l y s i s
Gardner-Webb University Summary Analysis December 2011 - January 2012
3HUHJULQH�$FDGHPLF�6HUYLFHV��//&� 3DJH����RI�����
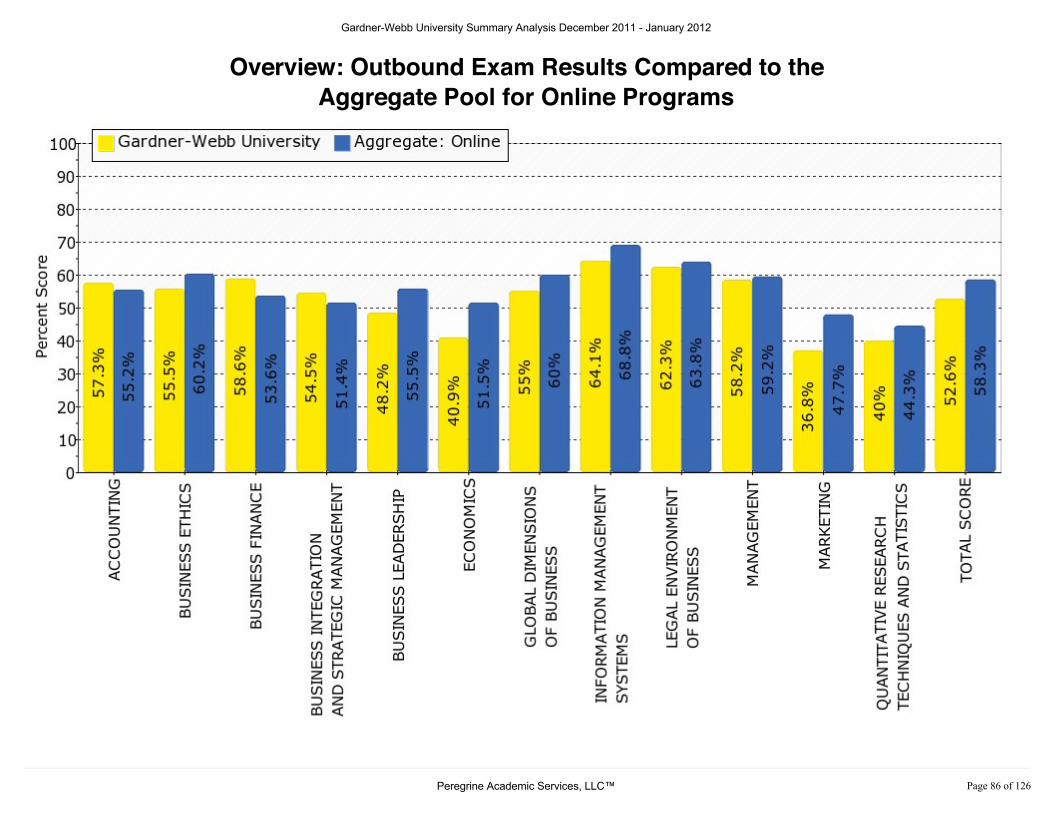
Overview: Outbound Exam Results Compared to theAggregate Pool for Online Programs
T o t a l R e s u l t s a n d S u m m a r y A n a l y s i s
Gardner-Webb University Summary Analysis December 2011 - January 2012
3HUHJULQH�$FDGHPLF�6HUYLFHV��//&� 3DJH����RI�����
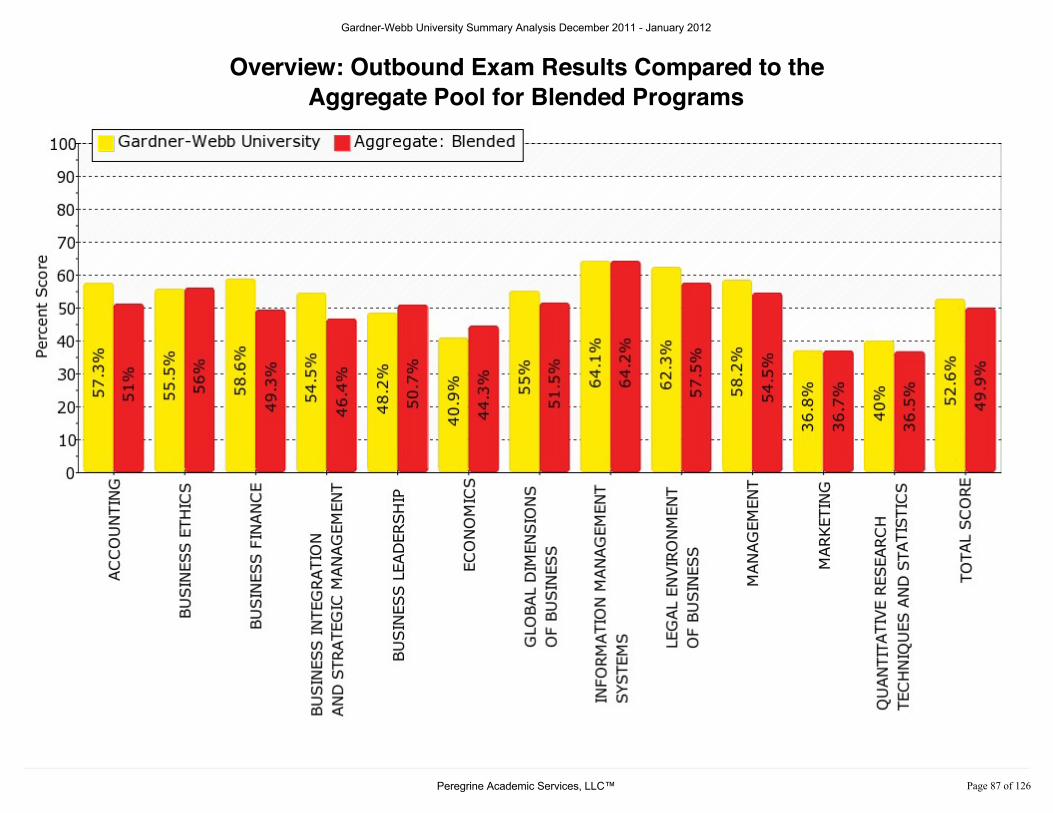
Overview: Outbound Exam Results Compared to theAggregate Pool for Blended Programs
T o t a l R e s u l t s a n d S u m m a r y A n a l y s i s
Gardner-Webb University Summary Analysis December 2011 - January 2012
3HUHJULQH�$FDGHPLF�6HUYLFHV��//&� 3DJH����RI�����
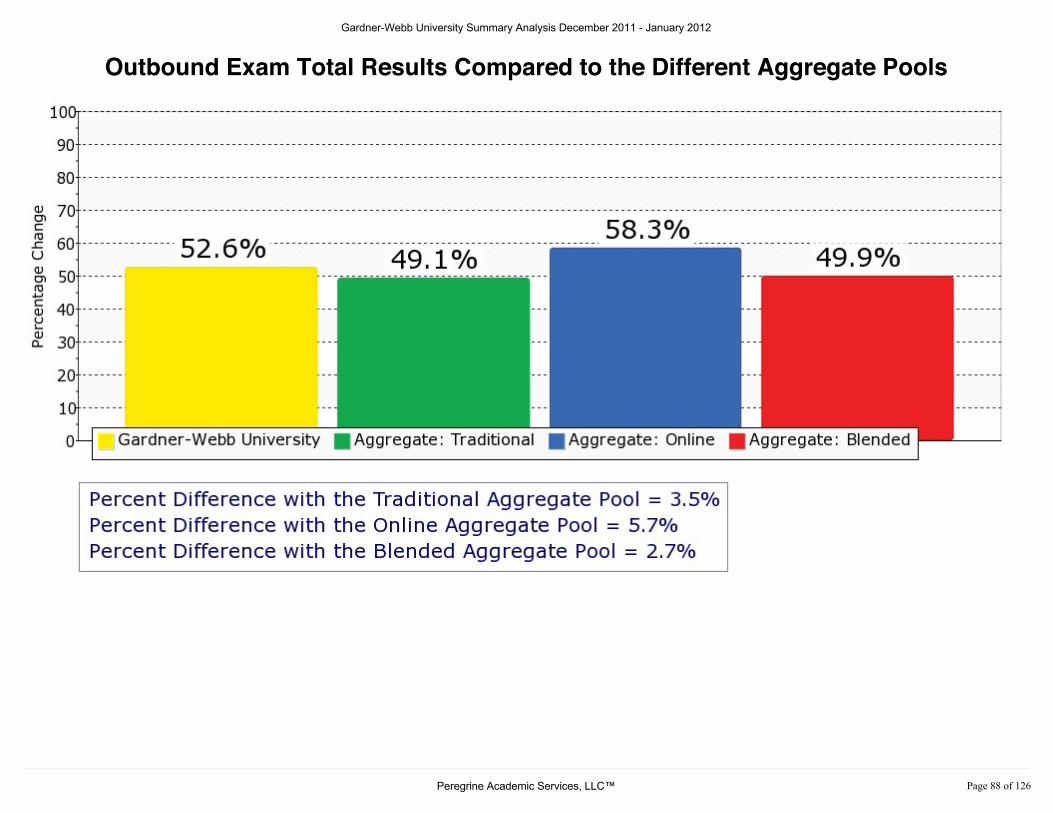
Outbound Exam Total Results Compared to the Different Aggregate Pools
Gardner-Webb University Summary Analysis December 2011 - January 2012
3HUHJULQH�$FDGHPLF�6HUYLFHV��//&� 3DJH����RI�����
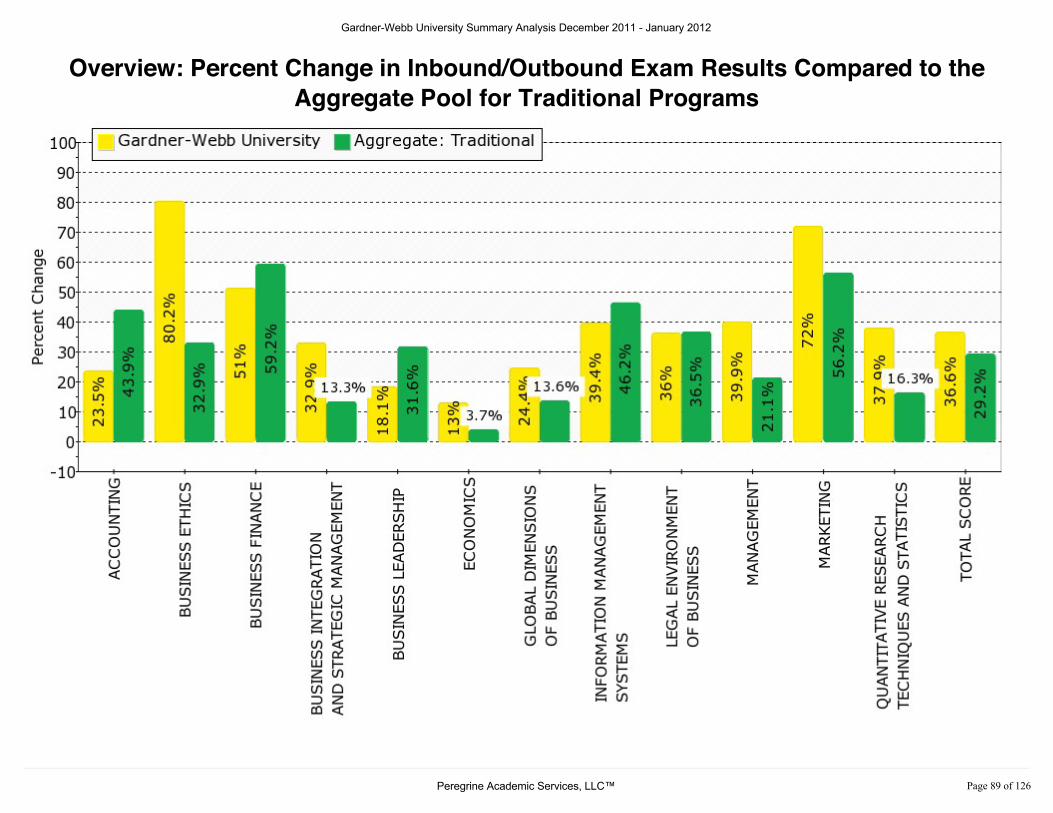
Overview: Percent Change in Inbound/Outbound Exam Results Compared to theAggregate Pool for Traditional Programs
Gardner-Webb University Summary Analysis December 2011 - January 2012
3HUHJULQH�$FDGHPLF�6HUYLFHV��//&� 3DJH����RI�����
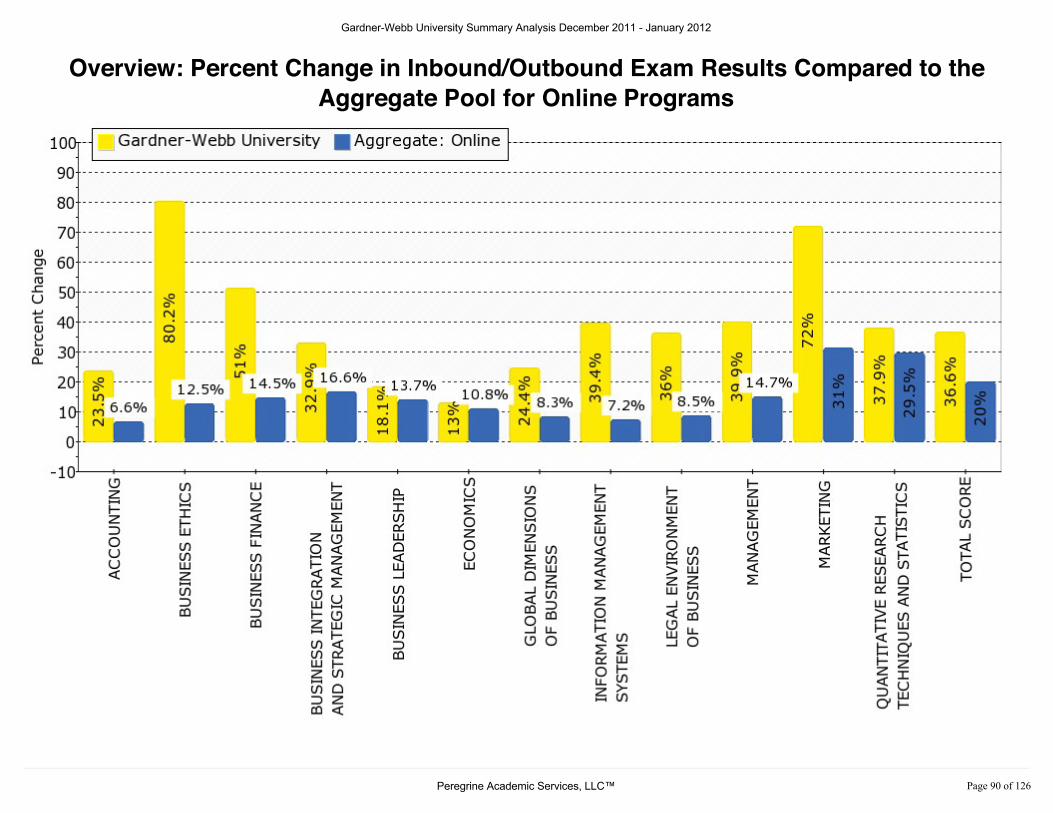
Overview: Percent Change in Inbound/Outbound Exam Results Compared to theAggregate Pool for Online Programs
Gardner-Webb University Summary Analysis December 2011 - January 2012
3HUHJULQH�$FDGHPLF�6HUYLFHV��//&� 3DJH����RI�����
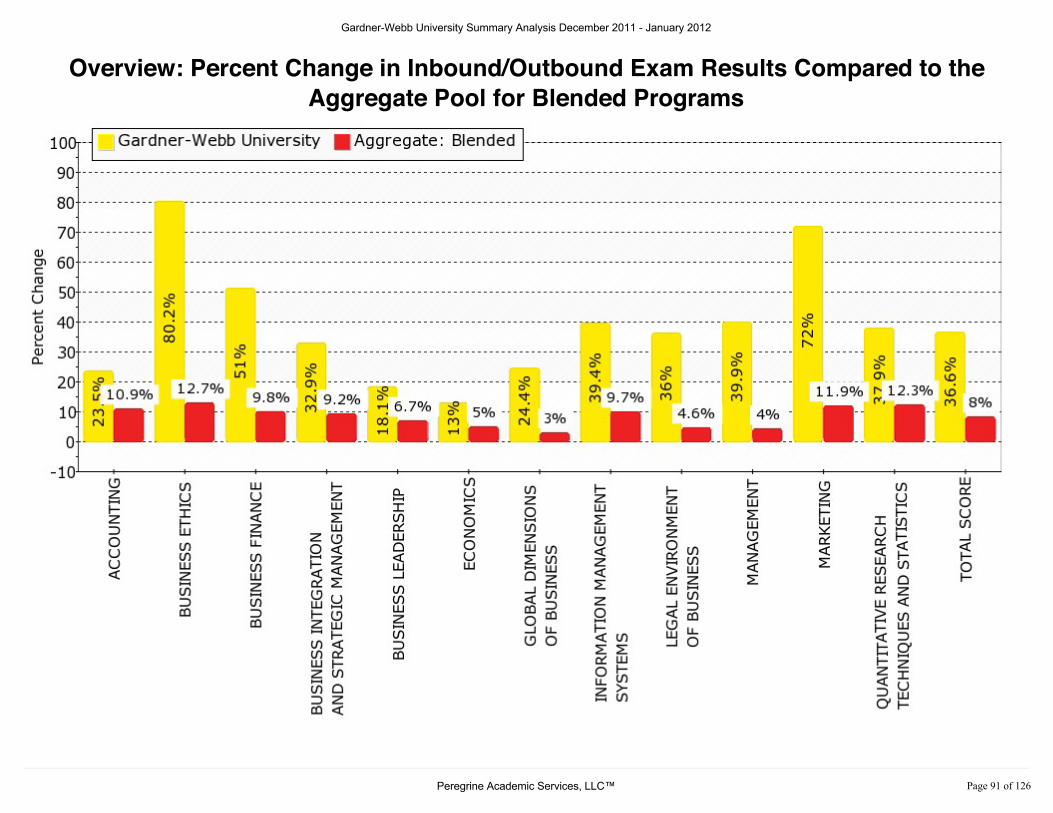
Overview: Percent Change in Inbound/Outbound Exam Results Compared to theAggregate Pool for Blended Programs
Gardner-Webb University Summary Analysis December 2011 - January 2012
3HUHJULQH�$FDGHPLF�6HUYLFHV��//&� 3DJH����RI�����
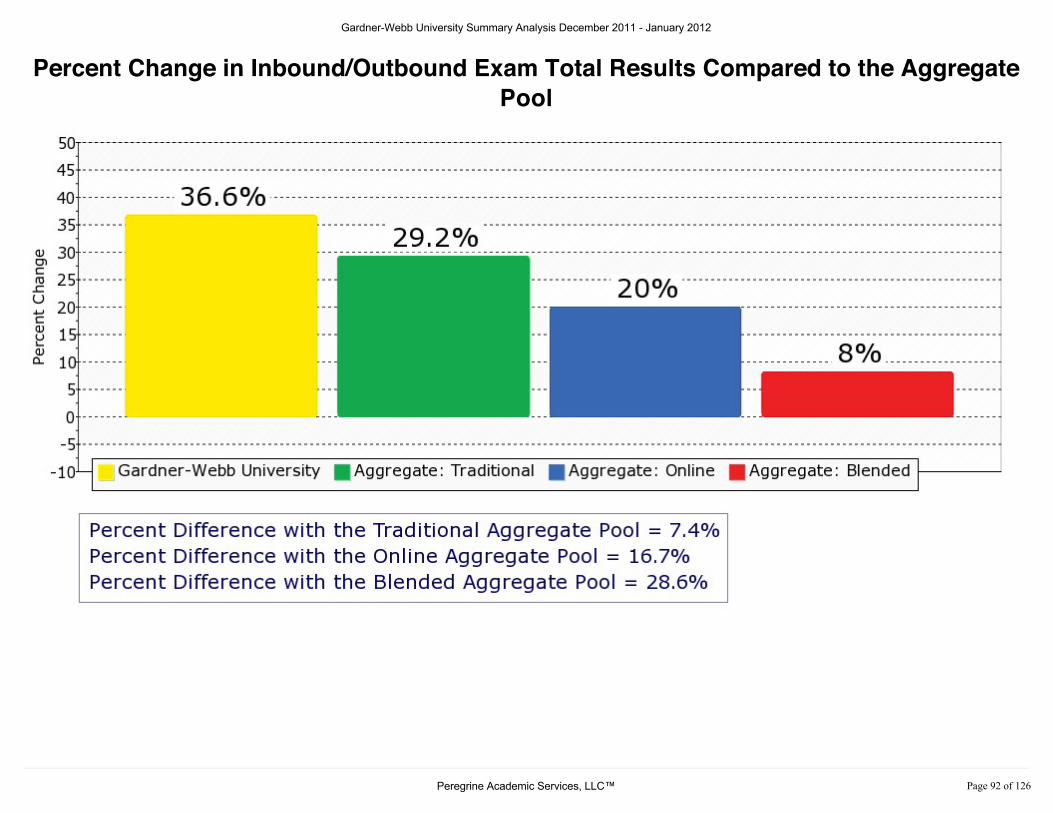
Percent Change in Inbound/Outbound Exam Total Results Compared to the AggregatePool
C P C T o p i c a n d S u b j e c t - L e v e l A n a l y s e s
A c c o u n t i n g
Gardner-Webb University Summary Analysis December 2011 - January 2012
3HUHJULQH�$FDGHPLF�6HUYLFHV��//&� 3DJH����RI�����
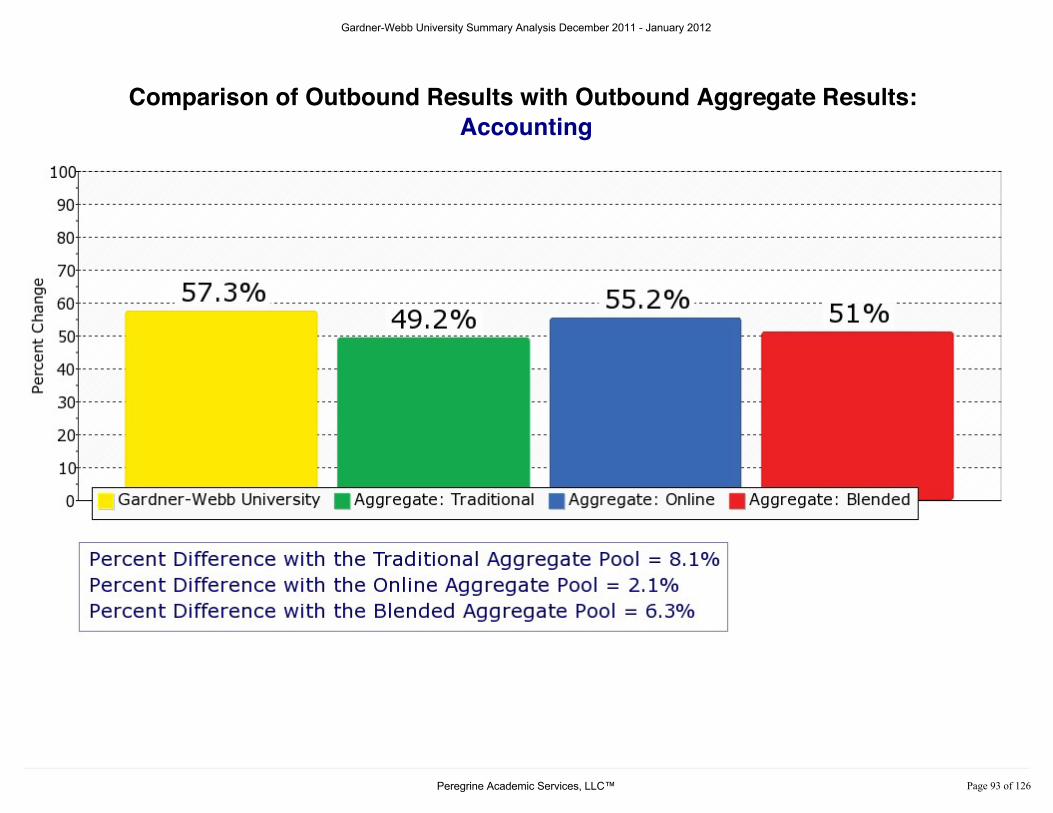
Comparison of Outbound Results with Outbound Aggregate Results: Accounting
Gardner-Webb University Summary Analysis December 2011 - January 2012
3HUHJULQH�$FDGHPLF�6HUYLFHV��//&� 3DJH����RI�����

Percent Change in Inbound/Outbound Accounting Results Compared to the DifferentAggregate Pools
B u s i n e s s E t h i c s
Gardner-Webb University Summary Analysis December 2011 - January 2012
3HUHJULQH�$FDGHPLF�6HUYLFHV��//&� 3DJH����RI�����
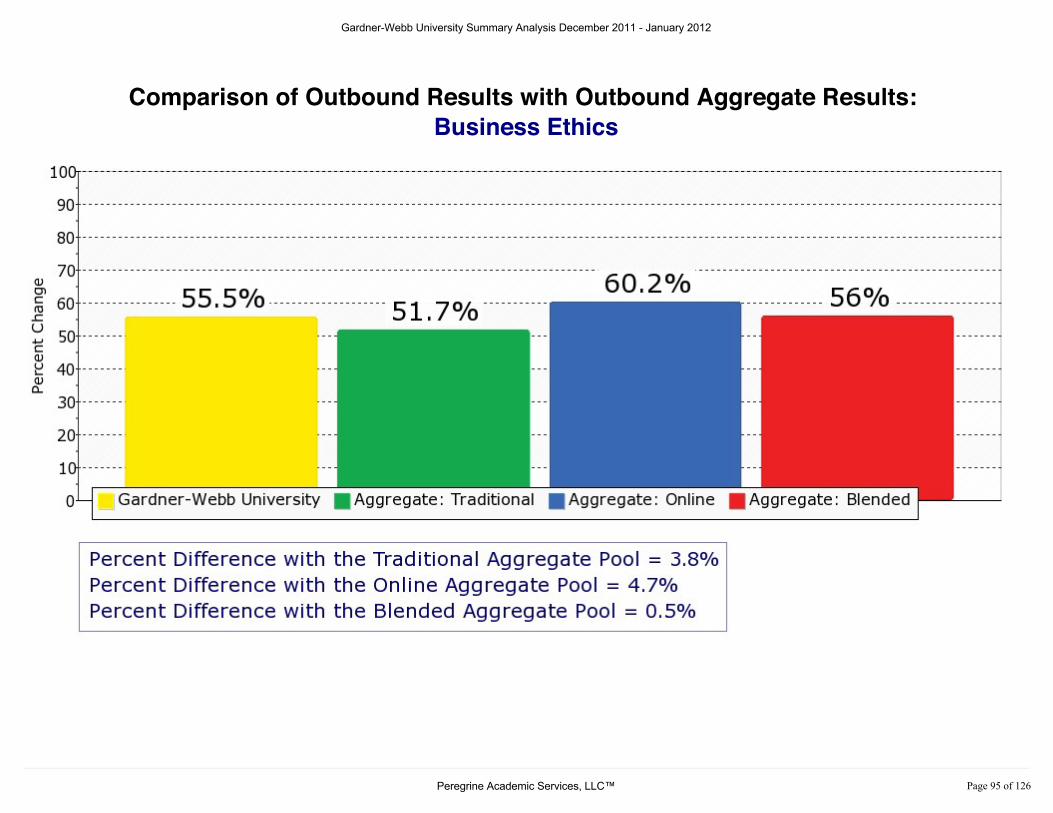
Comparison of Outbound Results with Outbound Aggregate Results: Business Ethics
Gardner-Webb University Summary Analysis December 2011 - January 2012
3HUHJULQH�$FDGHPLF�6HUYLFHV��//&� 3DJH����RI�����
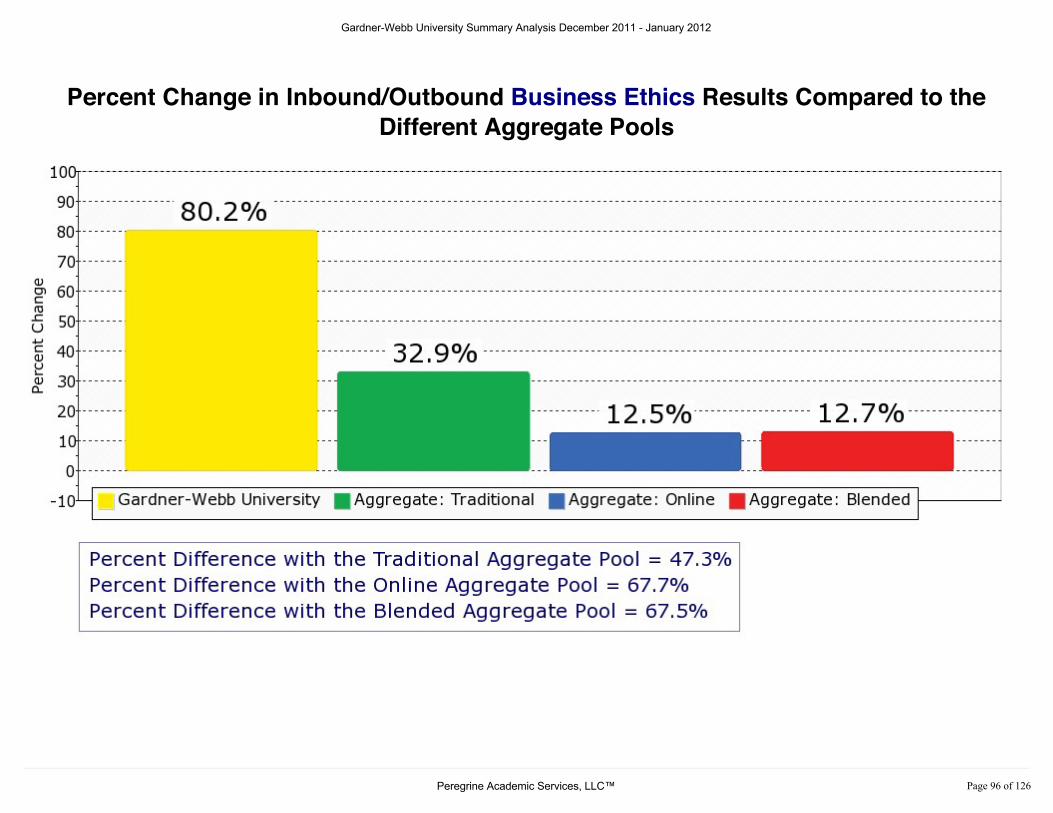
Percent Change in Inbound/Outbound Business Ethics Results Compared to theDifferent Aggregate Pools
B u s i n e s s F i n a n c e
Gardner-Webb University Summary Analysis December 2011 - January 2012
3HUHJULQH�$FDGHPLF�6HUYLFHV��//&� 3DJH����RI�����
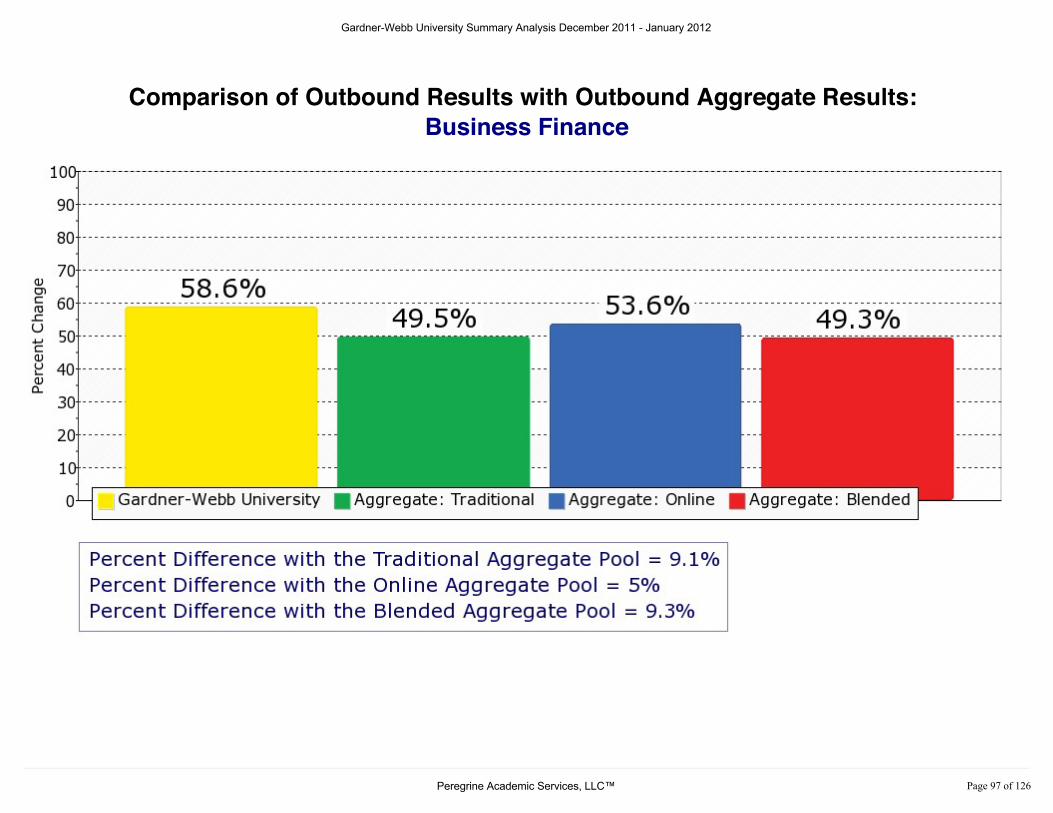
Comparison of Outbound Results with Outbound Aggregate Results: Business Finance
Gardner-Webb University Summary Analysis December 2011 - January 2012
3HUHJULQH�$FDGHPLF�6HUYLFHV��//&� 3DJH����RI�����

Percent Change in Inbound/Outbound Business Finance Results Compared to theDifferent Aggregate Pools
B u s i n e s s I n t e g r a t i o n a n d S t r a t e g i c M a n a g e m e n t
Gardner-Webb University Summary Analysis December 2011 - January 2012
3HUHJULQH�$FDGHPLF�6HUYLFHV��//&� 3DJH����RI�����

Comparison of Outbound Results with Outbound Aggregate Results: Business Integration and Strategic Management
Gardner-Webb University Summary Analysis December 2011 - January 2012
3HUHJULQH�$FDGHPLF�6HUYLFHV��//&� 3DJH����RI�����
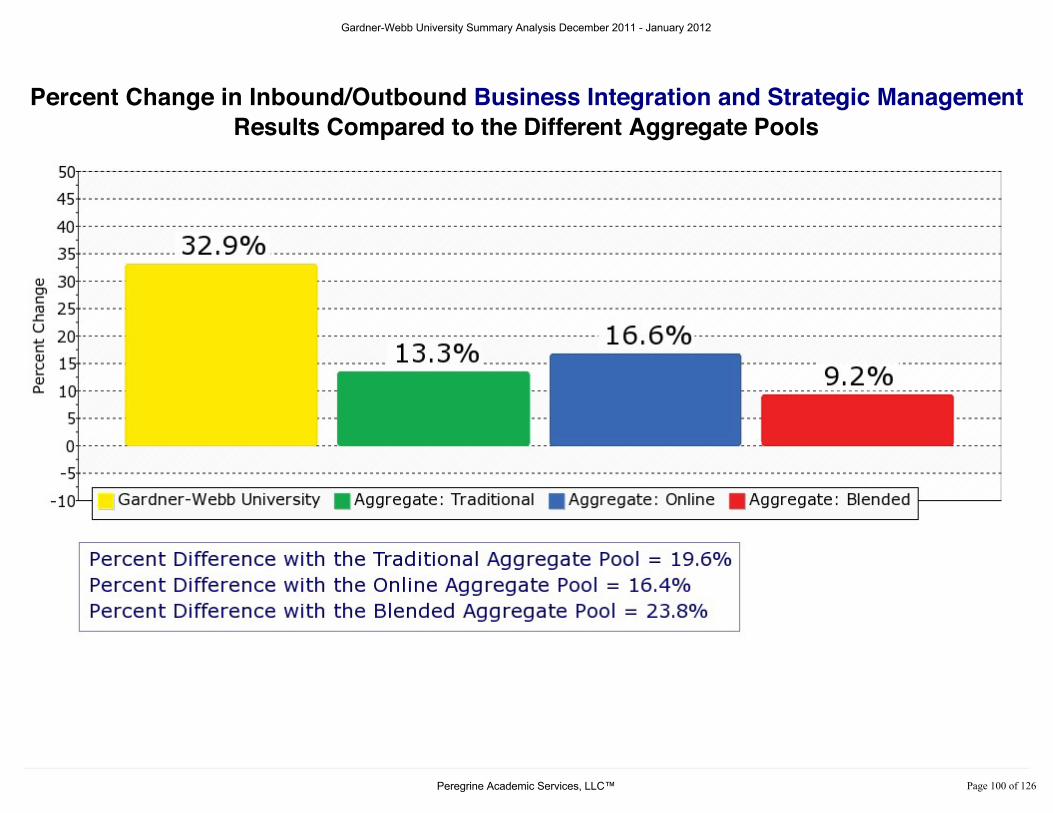
Percent Change in Inbound/Outbound Business Integration and Strategic ManagementResults Compared to the Different Aggregate Pools
B u s i n e s s L e a d e r s h i p
Gardner-Webb University Summary Analysis December 2011 - January 2012
3HUHJULQH�$FDGHPLF�6HUYLFHV��//&� 3DJH�����RI�����

Comparison of Outbound Results with Outbound Aggregate Results: Business Leadership
Gardner-Webb University Summary Analysis December 2011 - January 2012
3HUHJULQH�$FDGHPLF�6HUYLFHV��//&� 3DJH�����RI�����

Percent Change in Inbound/Outbound Business Leadership Results Compared to theDifferent Aggregate Pools
E c o n o m i c s
Gardner-Webb University Summary Analysis December 2011 - January 2012
3HUHJULQH�$FDGHPLF�6HUYLFHV��//&� 3DJH�����RI�����

Comparison of Outbound Results with Outbound Aggregate Results: Economics
Gardner-Webb University Summary Analysis December 2011 - January 2012
3HUHJULQH�$FDGHPLF�6HUYLFHV��//&� 3DJH�����RI�����
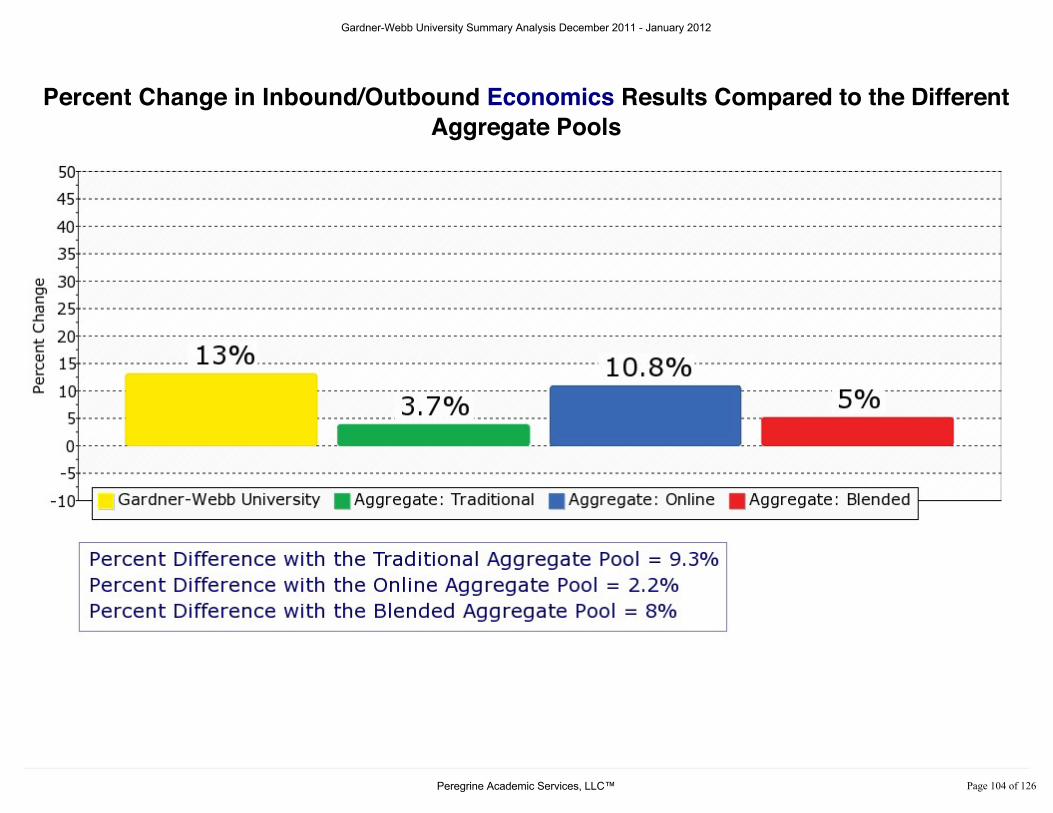
Percent Change in Inbound/Outbound Economics Results Compared to the DifferentAggregate Pools
E c o n o m i c s : M a c r o e c o n o m i c s
Gardner-Webb University Summary Analysis December 2011 - January 2012
3HUHJULQH�$FDGHPLF�6HUYLFHV��//&� 3DJH�����RI�����
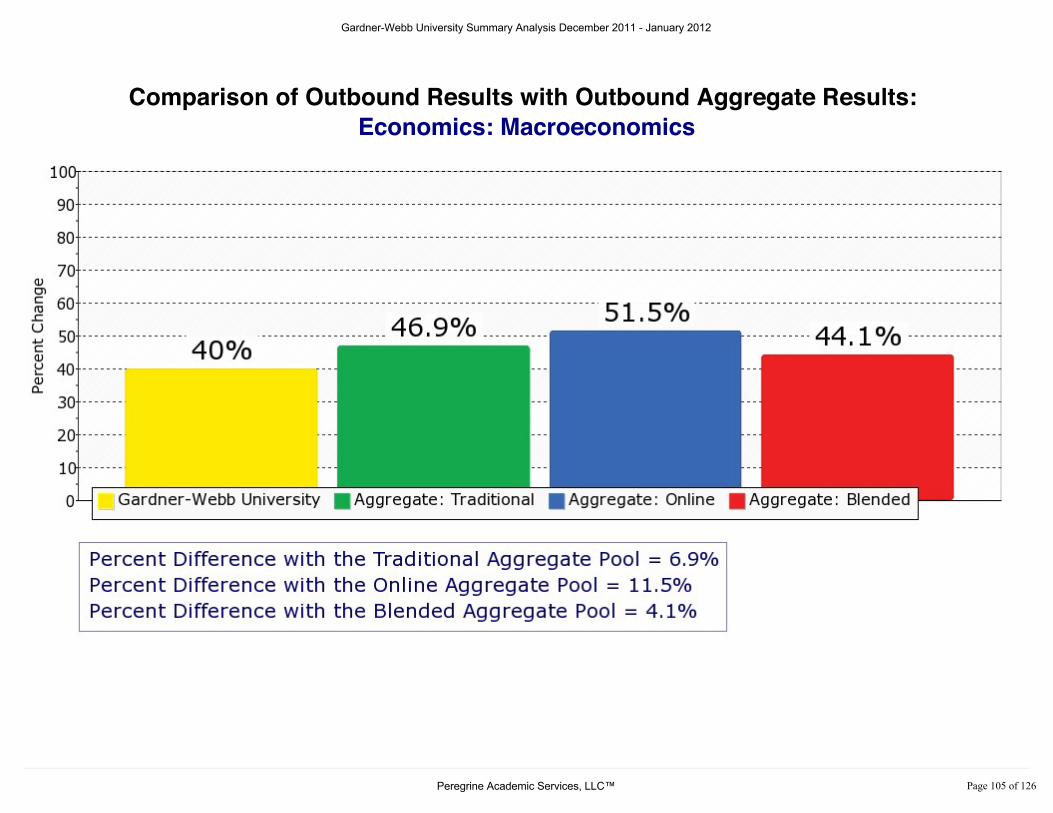
Comparison of Outbound Results with Outbound Aggregate Results: Economics: Macroeconomics
Gardner-Webb University Summary Analysis December 2011 - January 2012
3HUHJULQH�$FDGHPLF�6HUYLFHV��//&� 3DJH�����RI�����

Percent Change in Inbound/Outbound Economics: Macroeconomics Results Comparedto the Different Aggregate Pools
E c o n o m i c s : M i c r o e c o n o m i c s
Gardner-Webb University Summary Analysis December 2011 - January 2012
3HUHJULQH�$FDGHPLF�6HUYLFHV��//&� 3DJH�����RI�����

Comparison of Outbound Results with Outbound Aggregate Results: Economics: Microeconomics
Gardner-Webb University Summary Analysis December 2011 - January 2012
3HUHJULQH�$FDGHPLF�6HUYLFHV��//&� 3DJH�����RI�����

Percent Change in Inbound/Outbound Economics: Microeconomics Results Comparedto the Different Aggregate Pools
G l o b a l D i m e n s i o n s o f B u s i n e s s
Gardner-Webb University Summary Analysis December 2011 - January 2012
3HUHJULQH�$FDGHPLF�6HUYLFHV��//&� 3DJH�����RI�����

Comparison of Outbound Results with Outbound Aggregate Results: Global Dimensions of Business
Gardner-Webb University Summary Analysis December 2011 - January 2012
3HUHJULQH�$FDGHPLF�6HUYLFHV��//&� 3DJH�����RI�����
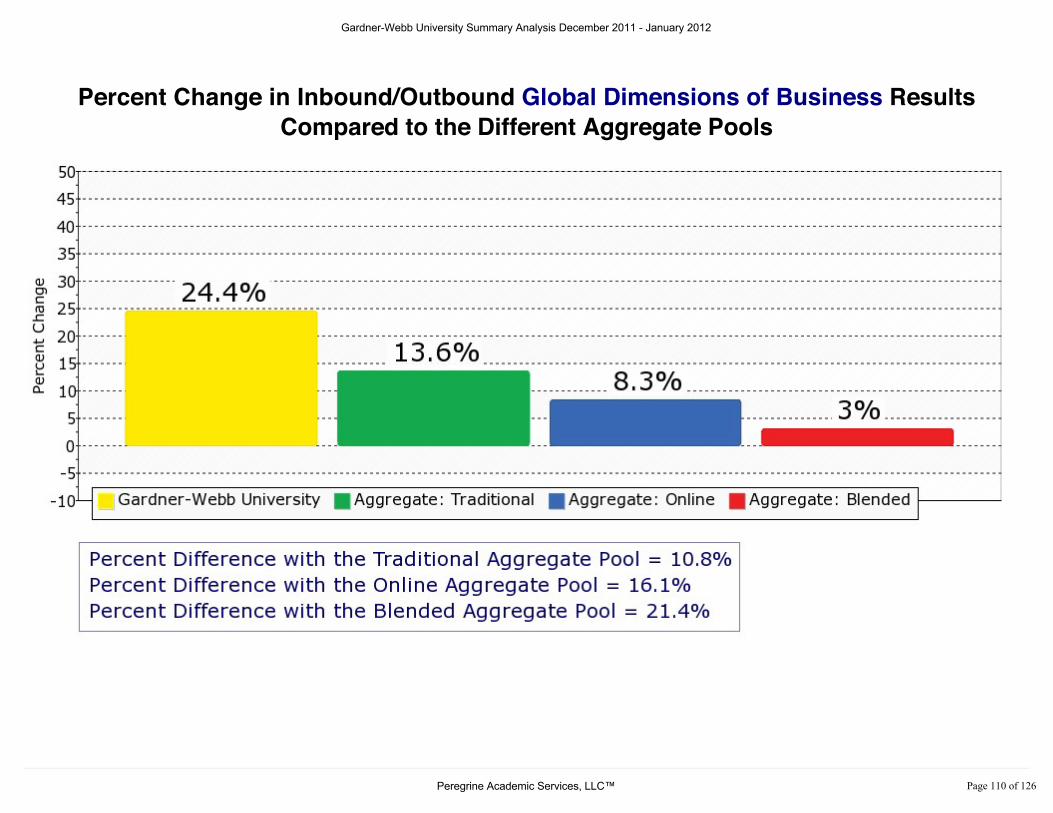
Percent Change in Inbound/Outbound Global Dimensions of Business ResultsCompared to the Different Aggregate Pools
I n f o r m a t i o n M a n a g e m e n t S y s t e m s
Gardner-Webb University Summary Analysis December 2011 - January 2012
3HUHJULQH�$FDGHPLF�6HUYLFHV��//&� 3DJH�����RI�����
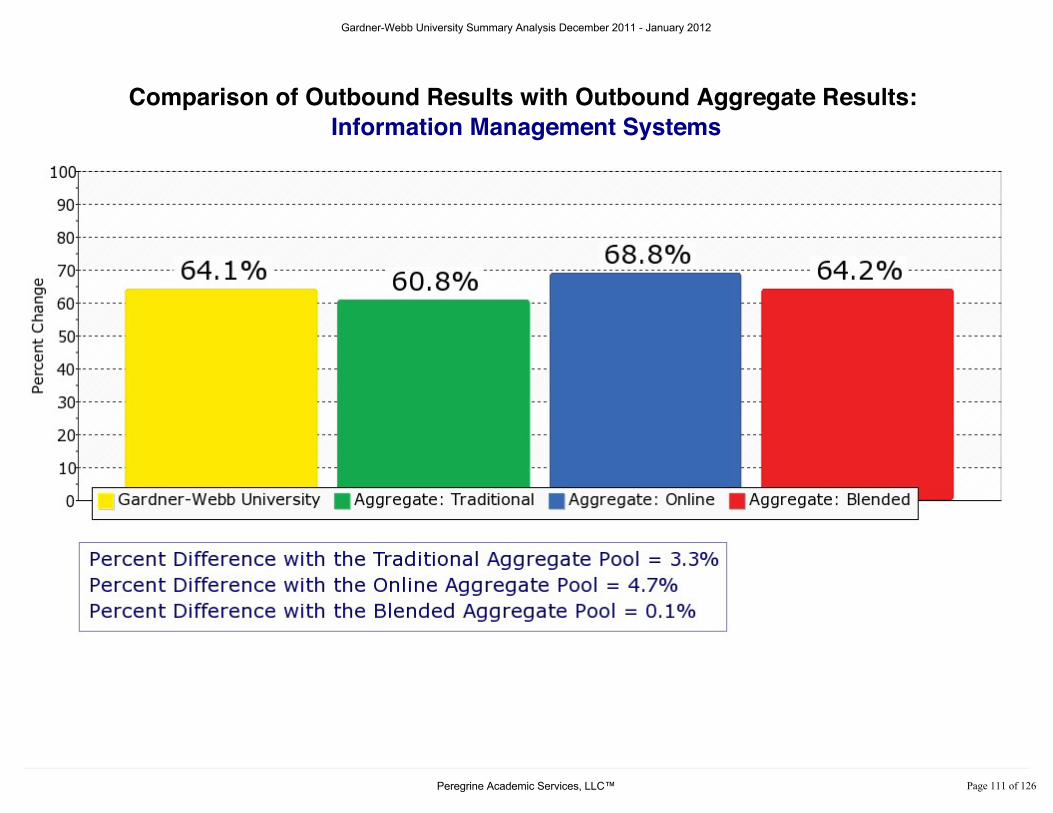
Comparison of Outbound Results with Outbound Aggregate Results: Information Management Systems
Gardner-Webb University Summary Analysis December 2011 - January 2012
3HUHJULQH�$FDGHPLF�6HUYLFHV��//&� 3DJH�����RI�����
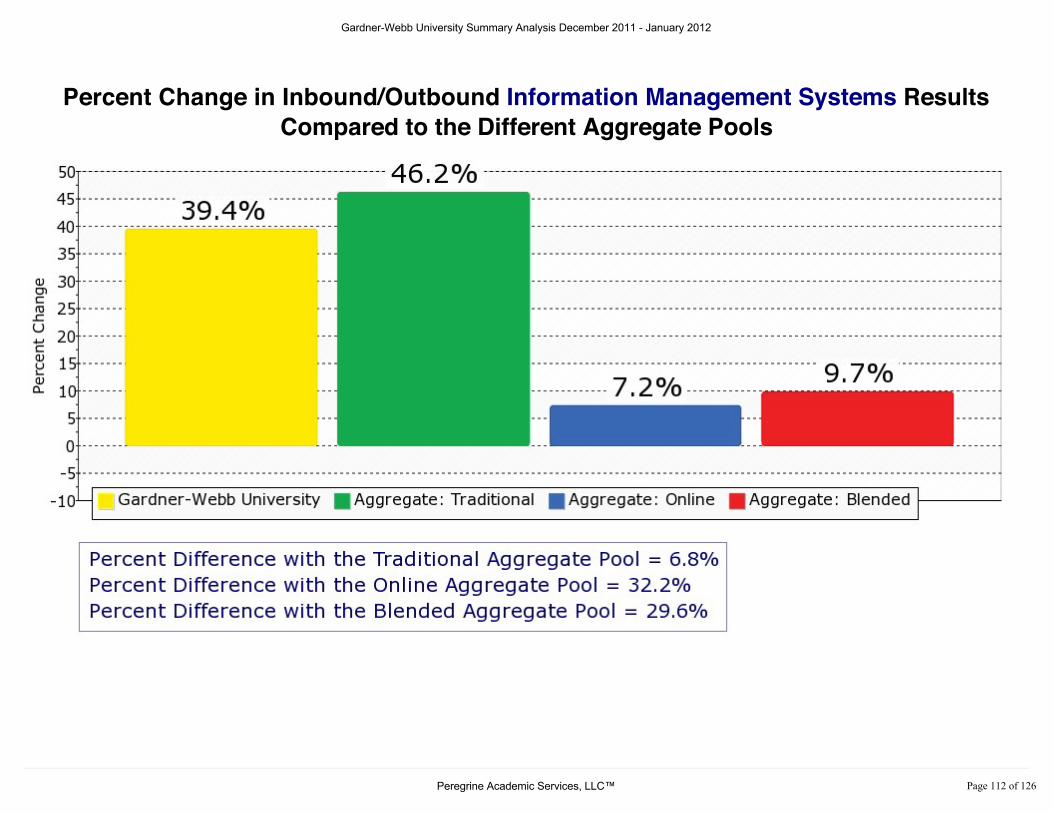
Percent Change in Inbound/Outbound Information Management Systems ResultsCompared to the Different Aggregate Pools
L e g a l E n v i r o n m e n t o f B u s i n e s s
Gardner-Webb University Summary Analysis December 2011 - January 2012
3HUHJULQH�$FDGHPLF�6HUYLFHV��//&� 3DJH�����RI�����
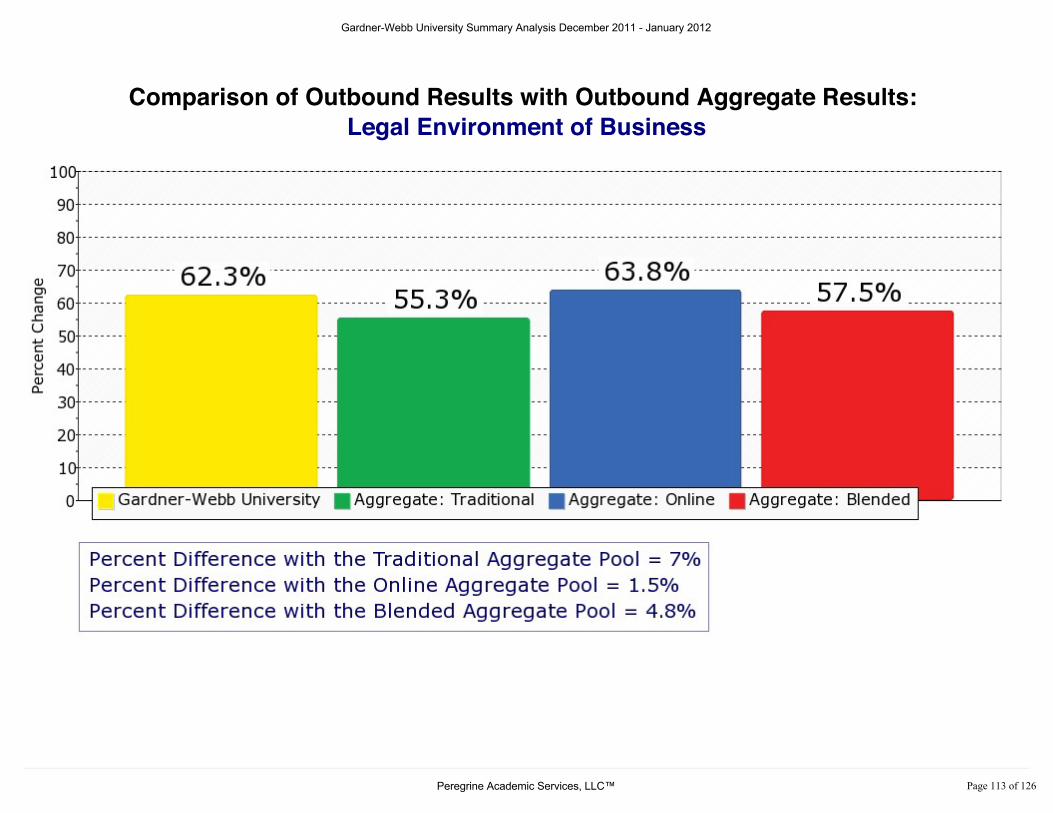
Comparison of Outbound Results with Outbound Aggregate Results: Legal Environment of Business
Gardner-Webb University Summary Analysis December 2011 - January 2012
3HUHJULQH�$FDGHPLF�6HUYLFHV��//&� 3DJH�����RI�����
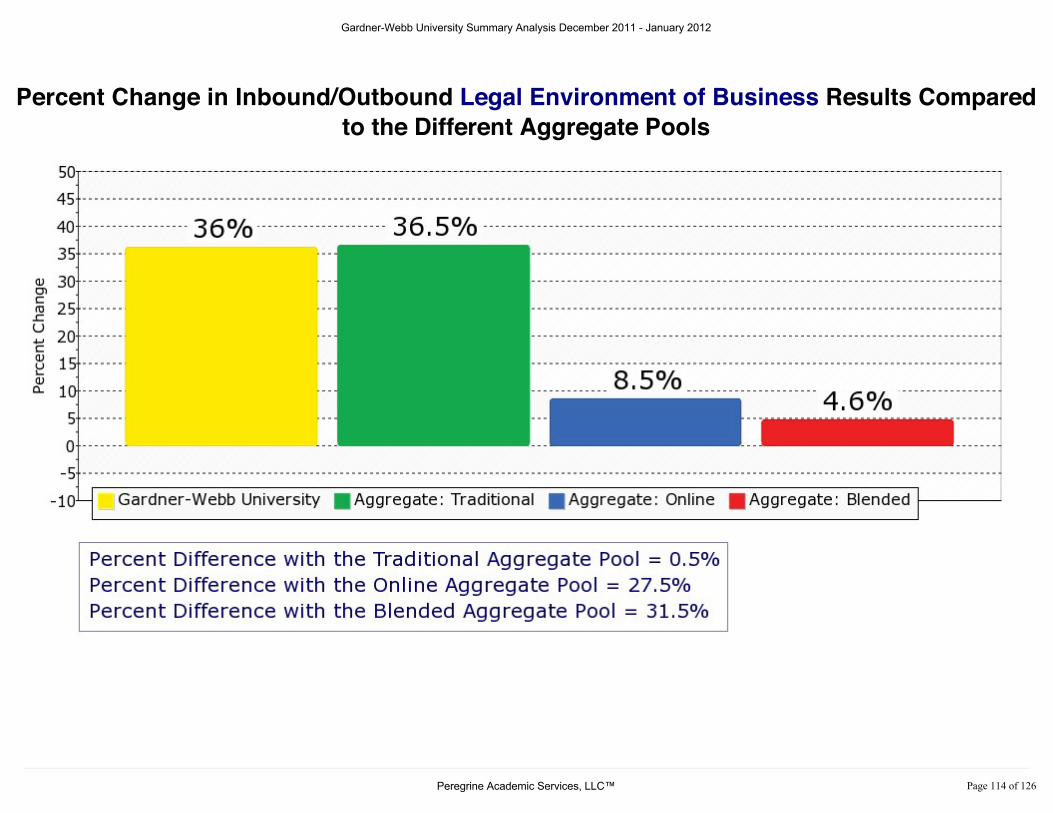
Percent Change in Inbound/Outbound Legal Environment of Business Results Comparedto the Different Aggregate Pools
M a n a g e m e n t
Gardner-Webb University Summary Analysis December 2011 - January 2012
3HUHJULQH�$FDGHPLF�6HUYLFHV��//&� 3DJH�����RI�����
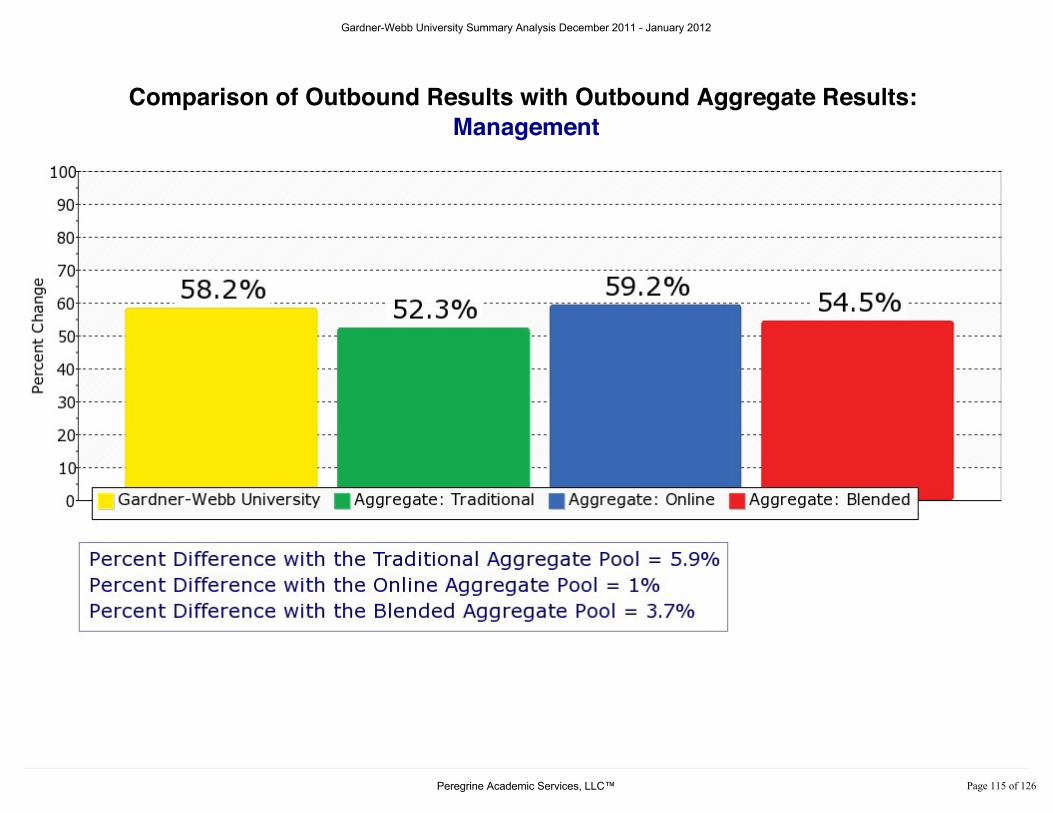
Comparison of Outbound Results with Outbound Aggregate Results: Management
Gardner-Webb University Summary Analysis December 2011 - January 2012
3HUHJULQH�$FDGHPLF�6HUYLFHV��//&� 3DJH�����RI�����
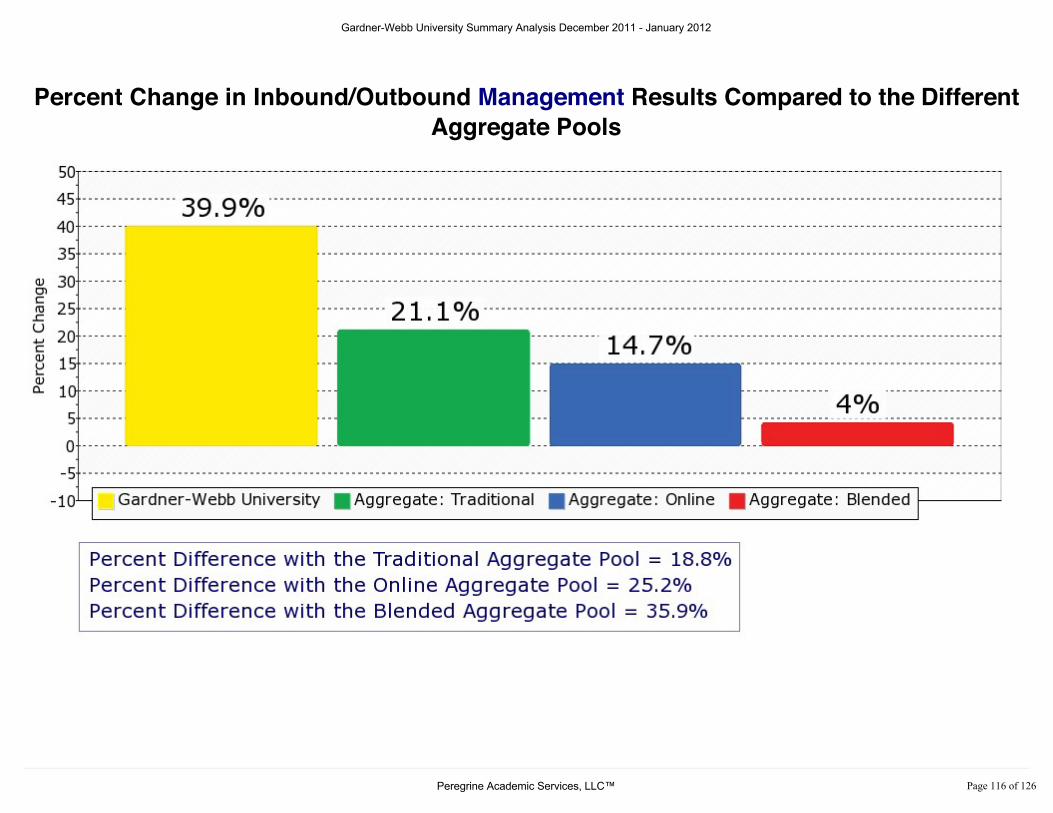
Percent Change in Inbound/Outbound Management Results Compared to the DifferentAggregate Pools
M a n a g e m e n t : H u m a n R e s o u r c e M a n a g e m e n t
Gardner-Webb University Summary Analysis December 2011 - January 2012
3HUHJULQH�$FDGHPLF�6HUYLFHV��//&� 3DJH�����RI�����

Comparison of Outbound Results with Outbound Aggregate Results: Management: Human Resource Management
Gardner-Webb University Summary Analysis December 2011 - January 2012
3HUHJULQH�$FDGHPLF�6HUYLFHV��//&� 3DJH�����RI�����

Percent Change in Inbound/Outbound Management: Human Resource ManagementResults Compared to the Different Aggregate Pools
M a n a g e m e n t : O p e r a t i o n s / P r o d u c t i o n M a n a g e m e n t
Gardner-Webb University Summary Analysis December 2011 - January 2012
3HUHJULQH�$FDGHPLF�6HUYLFHV��//&� 3DJH�����RI�����
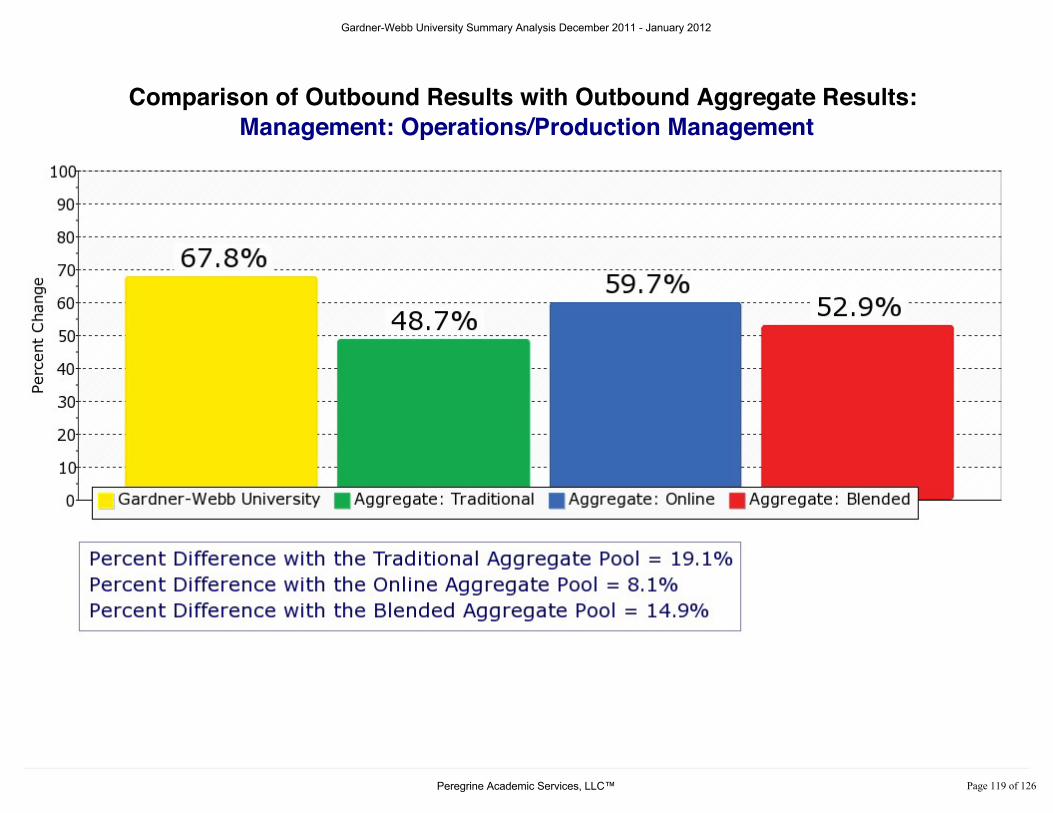
Comparison of Outbound Results with Outbound Aggregate Results: Management: Operations/Production Management
Gardner-Webb University Summary Analysis December 2011 - January 2012
3HUHJULQH�$FDGHPLF�6HUYLFHV��//&� 3DJH�����RI�����
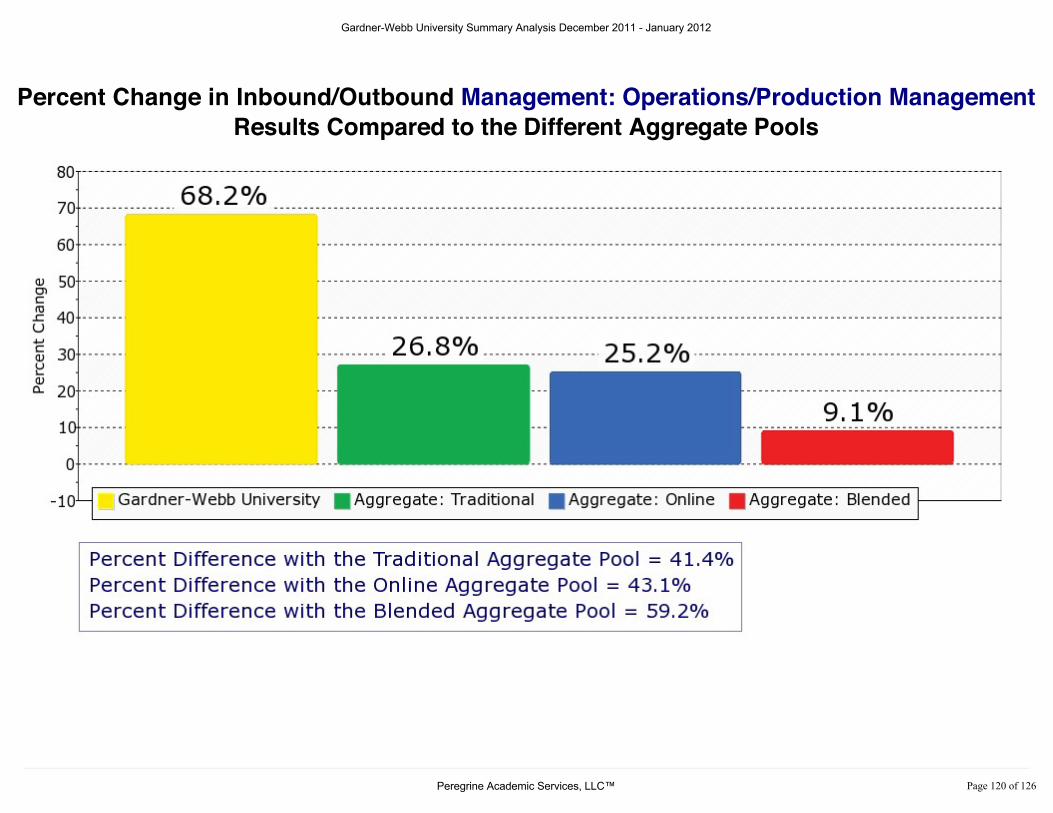
Percent Change in Inbound/Outbound Management: Operations/Production ManagementResults Compared to the Different Aggregate Pools
M a n a g e m e n t : O r g a n i z a t i o n a l B e h a v i o r
Gardner-Webb University Summary Analysis December 2011 - January 2012
3HUHJULQH�$FDGHPLF�6HUYLFHV��//&� 3DJH�����RI�����
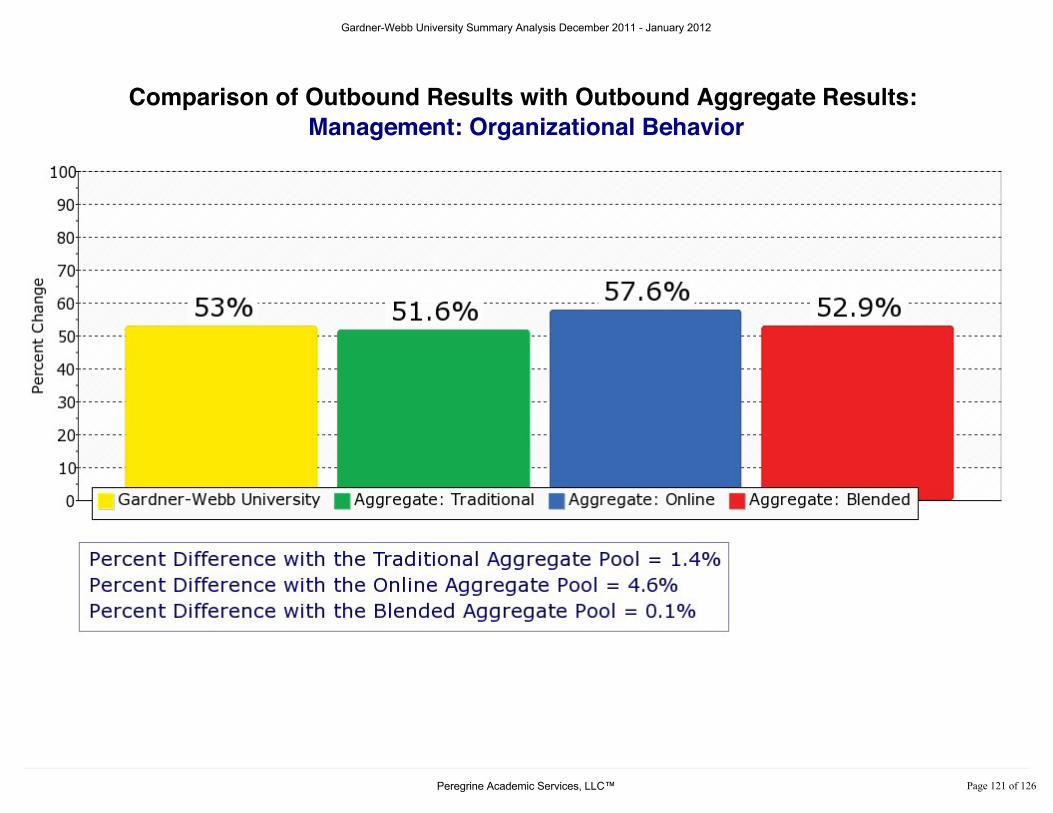
Comparison of Outbound Results with Outbound Aggregate Results: Management: Organizational Behavior
Gardner-Webb University Summary Analysis December 2011 - January 2012
3HUHJULQH�$FDGHPLF�6HUYLFHV��//&� 3DJH�����RI�����
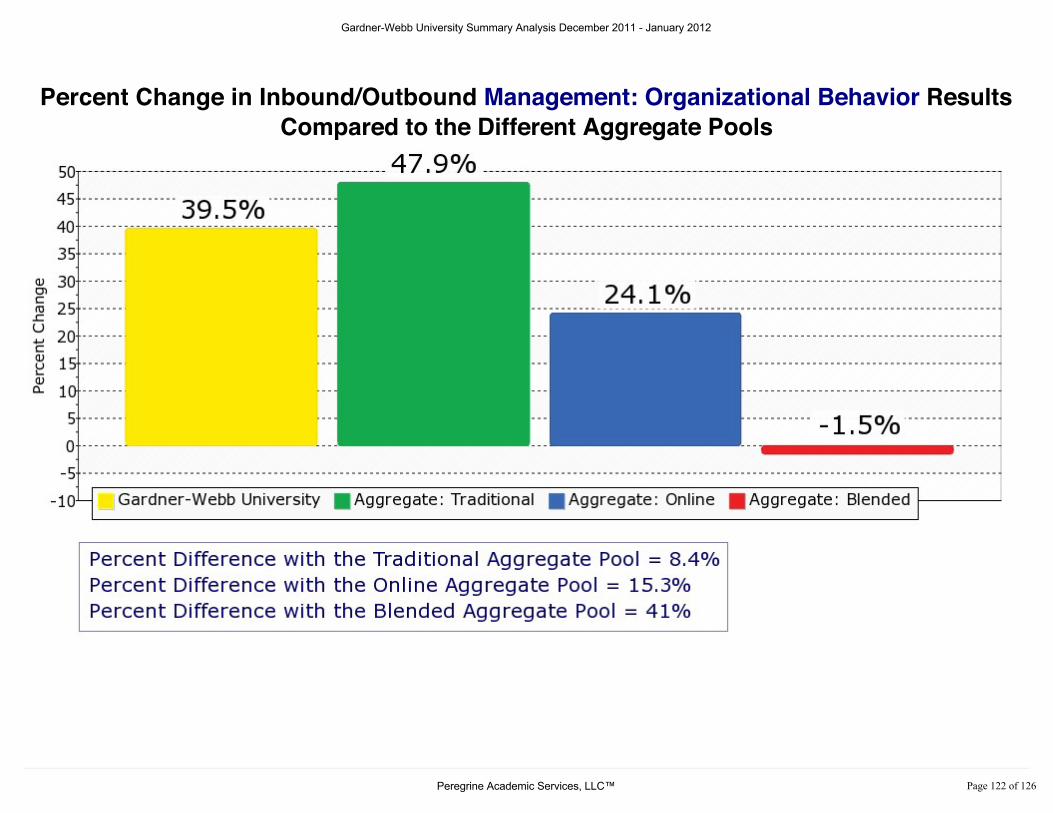
Percent Change in Inbound/Outbound Management: Organizational Behavior ResultsCompared to the Different Aggregate Pools
M a r k e t i n g
Gardner-Webb University Summary Analysis December 2011 - January 2012
3HUHJULQH�$FDGHPLF�6HUYLFHV��//&� 3DJH�����RI�����
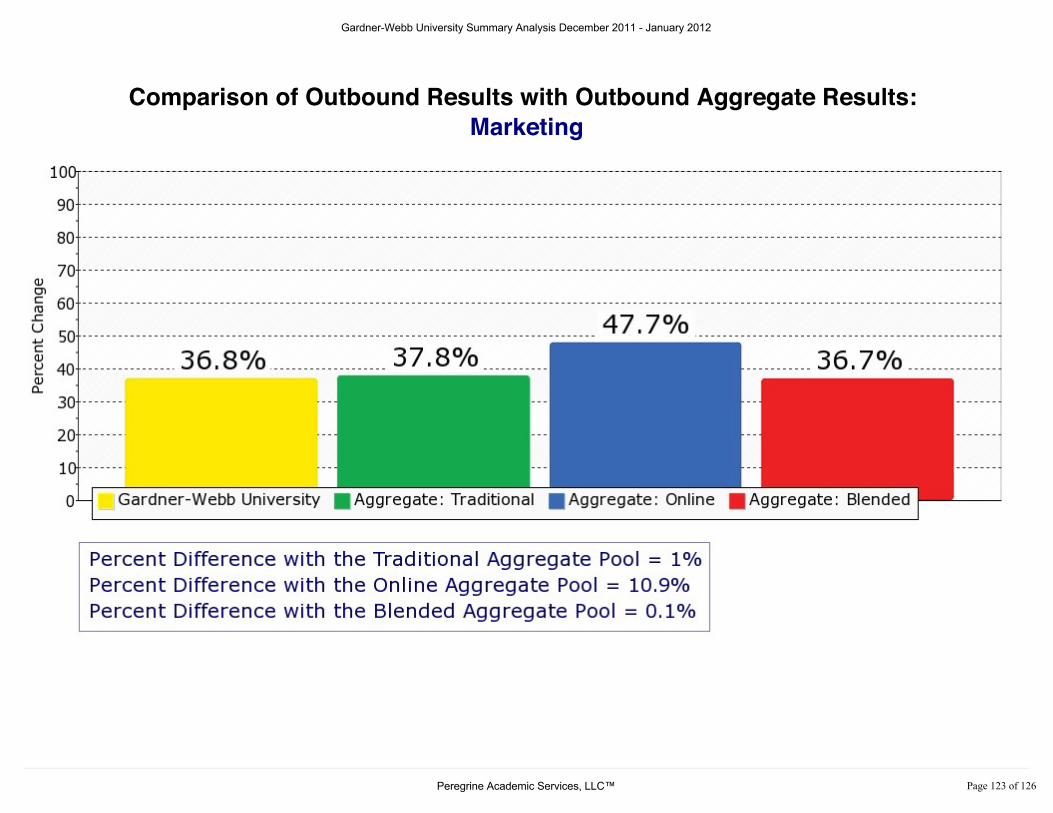
Comparison of Outbound Results with Outbound Aggregate Results: Marketing
Gardner-Webb University Summary Analysis December 2011 - January 2012
3HUHJULQH�$FDGHPLF�6HUYLFHV��//&� 3DJH�����RI�����

Percent Change in Inbound/Outbound Marketing Results Compared to the DifferentAggregate Pools
Q u a n t i t a t i v e R e s e a r c h T e c h n i q u e s a n d S t a t i s t i c s
Gardner-Webb University Summary Analysis December 2011 - January 2012
3HUHJULQH�$FDGHPLF�6HUYLFHV��//&� 3DJH�����RI�����
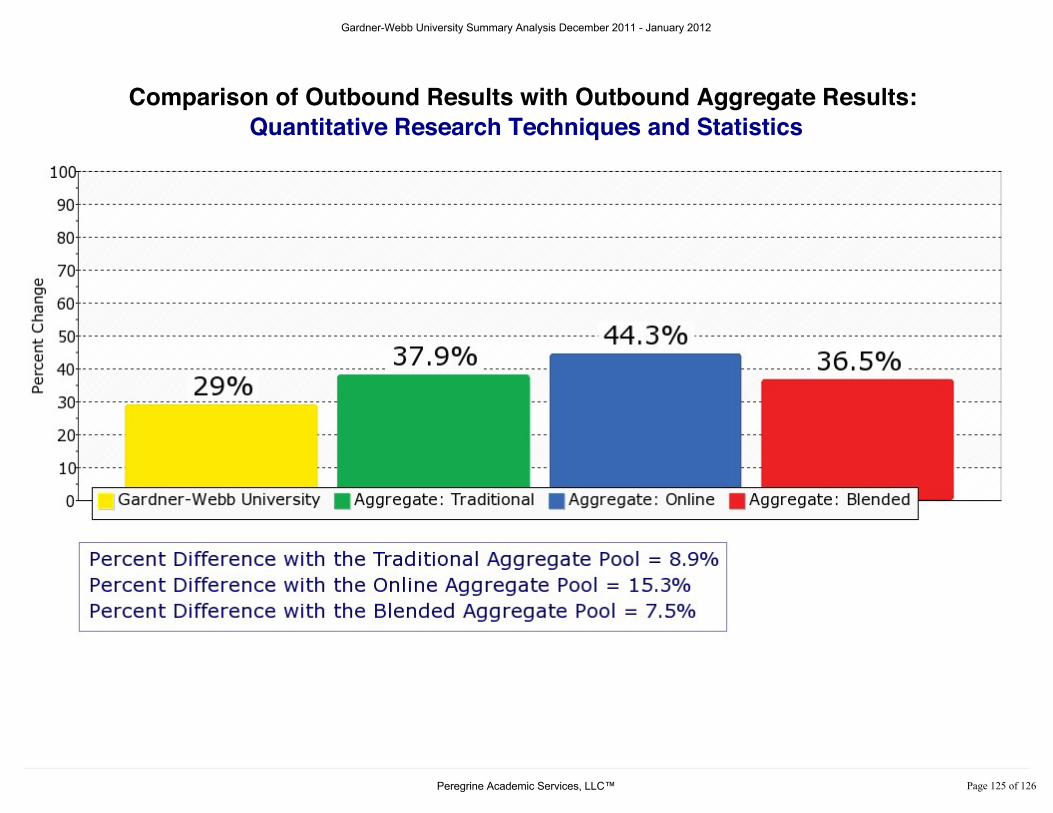
Comparison of Outbound Results with Outbound Aggregate Results: Quantitative Research Techniques and Statistics
Gardner-Webb University Summary Analysis December 2011 - January 2012
3HUHJULQH�$FDGHPLF�6HUYLFHV��//&� 3DJH�����RI�����
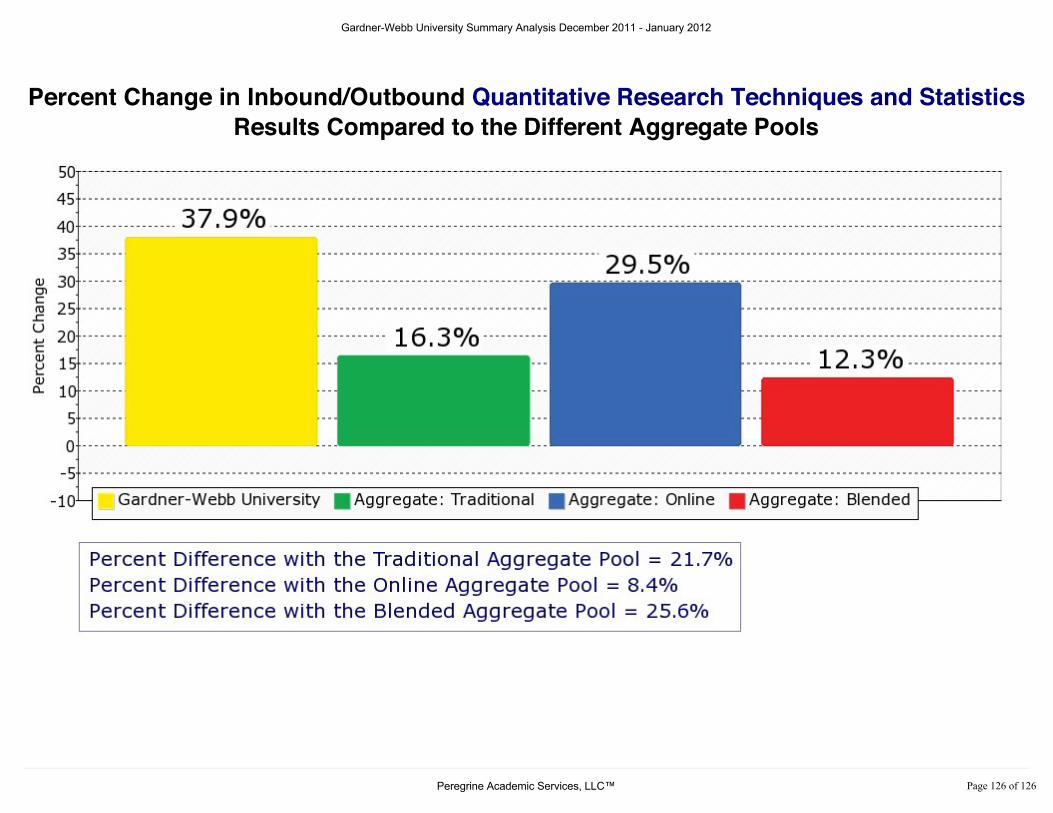
Percent Change in Inbound/Outbound Quantitative Research Techniques and StatisticsResults Compared to the Different Aggregate Pools
Gardner-Webb University Summary Analysis December 2011 - January 2012
3HUHJULQH�$FDGHPLF�6HUYLFHV��//&� 3DJH�����RI�����