people planet profit - alliancefinance.lk · email: [email protected] • our performance...
TRANSCRIPT

Annual Report 2016/17PEOPLE • PLANET • PROFIT


Our mission for the year as a proud and illustrious entity in the financial services industry, is to become more environmentally conscious; and in healing the planet we take on the actions of
restoring and revitalising not just our surroundings but the lives of those who have been a part of our legacy. We understand that
our actions have far reaching consequences in the world around us and therefore we take great pains to further our motives as a
socially responsible corporate citizen now and into the future.
PEOPLE • PLANET • PROFIT
Alliance Finance Company PLC | Annual Report 2016/17
Contents
Overview
About this Report..................................................................04Welcome to our Annual Integrated Report .....................04About Our Company ............................................................06Vision, Mission, Core Values ...............................................08Performance Highlights .......................................................09Our Track Record of Value Creation..................................10Value Added Statement - Company ..................................11Our Excellence ......................................................................12Our Journey of Six Decades ...............................................14Chairman’s Review ................................................................17Deputy Chairman/Managing Director’s Review ............19
Management Discussion and Analysis
Operating Context and StrategyValue Creation Model ..........................................................24Stakeholder Engagement ....................................................25Stakeholder Interest-Power Matrix ...................................25Defining Report Content .....................................................28Materiality Matrix .................................................................29Our Strategy ..........................................................................30Our Approach to Sustainability ..........................................31Our Commitment to the Sustainable Development Goals.....................................32
StewardshipBoard of Directors ................................................................36Corporate Management ......................................................39Senior Management .............................................................41Corporate Governance ........................................................48Risk Management .................................................................60
Our PerformanceEconomic and Industry Review ..........................................72Delivering Strategy Through Our Business Lines ..........79
Value Creation against our CapitalsFinancial Capital .............................................................. 88Manufactured Capital .................................................... 94Human Capital ................................................................. 96Social and Relationship Capital ..................................104Intellectual Capital ........................................................114Natural Capital ...............................................................115

03
Financial Information
Annual Report of the Directors .................................123Report by the Board on Internal Control .................127Directors’ Responsibility for Financial Reporting ...128Report of the Audit Committee .................................129Independent Auditors’ Report ....................................131Statement of Profit or Loss .........................................132Statement of Comprehensive Income ......................134Statement of Financial Position .................................135Statement of Changes In Equity ................................137Statement of Cash Flows ............................................139Significant Accounting Policies ..................................141Notes to the Financial Statements ............................163
Supplementary Information
Contribution to National Economy ...........................243Depositors Information ...............................................245Debenture Investor Indicators ...................................249Ten Year Summary - Company ..................................250Shareholder Information .............................................252GRI G4 Index Table .......................................................254Glossary ...........................................................................261
Statutory Information
Notice of Meeting .............................................264Form of Proxy.....................................................265Notes ...................................................................267Corporate Information .....................................268

04
Alliance Finance Company PLC | Annual Report 2016/17
Overview Management Discussion & Analysis
Financial Reports Supplementary information
About this Report
We are committed towards directing our strategy in a way that balances both business and sustainability considerations
WelCOme tO Our AnnuAl IntegrAted rePOrtAFC first embraced the principles of Integrated Reporting in 2015, and this year we hope to build on that foundation to provide our stakeholders with a balanced and comprehensive review of our financial, social and environmental performance. We are committed towards directing our strategy in a way that balances both business and sustainability considerations, and adoption of the IR Framework has ensured that our corporate reporting model complements the Group’s integrated thinking. Through this Report, we aim to provide a holistic yet concise overview of matters which are most material to our shareholders including emerging risks and opportunities, performance against our strategy and successes and challenges in delivering our strategy.
Scope and boundaryThe Report covers the operations of Alliance Finance Company PLC (“AFC”) and its subsidiary Alfinco Insurance Brokers (Pvt) Ltd and associates Macbertan (Pvt) Ltd and Alliance Tech Trading (Pvt) Ltd for the period from 1st April 2016 to 31st March 2017. Any material events after this date and up to approval of this report by the Board of Directors on 30th May 2017 have also been included for completeness. The financial information disclosed in this Report
represents all four entities (unless otherwise mentioned) while the non-financial information pertains only to the parent entity. We adopt an annual reporting cycle and this Report builds on our previous annual report for the year ending 31st March 2016. The material aspects included in this Report have been selected using a structured and systematic process as detailed on pages 28 to 29 of this Report and objectively represent our key stakeholder interests and emerging trends in the operating landscape. There were no significant changes to the Group’s size, structure, shareholding or supply chain during the period under review.
reporting enhancementsIntegrated Reporting is a continuously evolving journey, and every year we seek to improve the meaningfulness and readability of our Report. This year our reporting has focused on,
• Selection of material aspects has been extended beyond the aspects prescribed by GRI to include factors that are specific to our operating environment, business and strategy
• Enhanced the connectivity of information through linking the narrative to our strategy and material issues
• Demonstrate the interdependencies and trade-offs of our capital inputs

04 05
Alliance Finance Company PLC | Annual Report 2016/17
Overview Management Discussion & Analysis
Financial Reports Supplementary information
05
reporting Principles and AssuranceIntegrated Report Annual Financial
StatementsCorporate Governance Risk Management Report
Sustainability Performance
Stan
dard
s an
d Pr
inci
ples
• Integrated Reporting Framework of the International Integrated Reporting Council (IIRC)
• Sri Lanka Financial Reporting Standards
• Finance Leasing Act No.56 of 2000
• Finance Business Act No.42 of 2011
• Companies Act No. 7 of 2007
• Listing Requirements of the Colombo Stock Exchange
• Central Bank’s stipulations applicable to the Registered Finance Leasing establishments
• Listing requirements of the CSE
• Code of Best Practice on Corporate Governance issued by the ICASL and SEC
• Global Reporting Initiative- G4 standards (Core)
Ass
uran
ce Baker Tilly Edirisinghe & Co; Chartered Accountants
How to read this reportThe content included in this Report has been carefully selected and structured to show how the Group creates, delivers and ensures value creation for its stakeholders.
• The Company aims to provide the reader with an overview of the organisation, our key products and services and our leadership reviews
• Operating context and strategy describes the landscape in which we operate, the matters that could potentially affect our value creation process and our strategic focus areas
FeedbackWe welcome suggestions, feedback and queries on our Report as we seek to continually enhance the quality and meaningfulness of information presented. Please contact,
the Chief Financial OfficerAlliance Finance Company PLC84, Ward Place, Colombo, Sri LankaEmail: [email protected]
• Our performance demonstrates how we performed against our strategic targets for the year, the successes and challenges and how our key business lines contributed towards delivering our strategy
• Value creation against our capital demonstrates how we transformed and added value to our capital inputs during the year, ensuring sustainable value creation to all our stakeholders

06
Alliance Finance Company PLC | Annual Report 2016/17
Overview Management Discussion & Analysis
Financial Reports Supplementary information
About Our CompanyAFC is one of Sri Lanka’s most trusted and respected financial institutions, with an excellent track record of over Six decades. As Sri Lanka’s 3rd oldest licensed finance company, AFC has nurtured relationships with four generations of customers, partnering socio economic progress and contributing towards financial inclusion across the island. The Company has successfully carved out a niche position in an intensely competitive market by offering a unique business proposition which is underpinned on stability, trust, innovation and relationship-driven customer service. With an asset and deposit base of Rs. 30 billion and Rs.10.1 billion respectively as at end-March 2017, we operate a network of 89
customer contact points in 24 districts across the island, providing a range of innovative investment and lending solutions. The Company is powered by the dynamism and skills of 1,222 employees, who drive our strategic ambitions and live our corporate values.
Profit After TaxRs.649Mn
Customers 117,534
Assets Rs.30Bn
DepositsRs.10.1Bn
Touchpoints89
Employees1,222
An industry pioneer in sustainability, the Company is deeply committed towards embedding sustainability considerations in its business decisions and is embodied in its People-Planet-Profit approach towards strategy and value creation. The Company is governed by the Finance Business Act No.42 of 2011, Finance Leasing Act No. 56 of 2000 and is an approved credit agency under the Mortgage Act and the Trust Receipt Ordinance. The Company is listed on the Main Board of the Colombo Stock Exchange with a market capitalisation of Rs. 1.85 billion as at end-March 2017.
An excellent track record of over 60 years, providing innovative product solutions and unmatched service to four generations of Sri Lankans.
Nurturing relationships with our diverse stakeholders are at the core of our culture and we strive to make every relationship a lasting one.
Track Record
Our Relationships
Corporate Values
Our Approach
Our Unique Strengths
At our core, are a set of values which define who we are-people centric, integrity, innovation, dynamism, unity and serving people & conserving nature
Our approach towards business embodies a triple bottom-line thinking, thereby balancing the competing needs of our stakeholders
OvERviEw

06 07
Alliance Finance Company PLC | Annual Report 2016/17
Overview Management Discussion & Analysis
Financial Reports Supplementary information
Organisational structureThe parent company (AFC) is the most significant contributor to the Group, contributing 98.7% and 98.5% to revenue and profits respectively and accounting for 99.6% of the Group’s total assets.
Licensed Finance establishment offering the following solutions;• Investment solutions: savings deposits, fixed
deposits
• Financing solutions: leasing, gold loans, pledge loans, equipment financing, business loans, quick cash, personal loans, SME financing and microfinance
One of the top 10 insurance brokers in the country, Alfinco was formed as a strategic partnership between AFC and Arpico Finance PLC, which was formerly a subsidiary of the Group.
An associate company, Macbertan is engaged in the manufacture of thermal and impact insulation products with a range of domestic and industrial applications.
An associate company, Alliance Tech Trading (Pvt) Ltd. engaged in provision office interior and turnkey solutions to corporates.
AFCAlfinco Insurance Brokers (64%)
macbertan (Pvt) ltd (24.7%)
Alliance tech trading (Pvt) ltd (40%)

08
Alliance Finance Company PLC | Annual Report 2016/17
Overview Management Discussion & Analysis
Financial Reports Supplementary information
Core Values1. People CentricPeople includes all our stakeholders with a special emphasis on customers and staff. We consider customers as our first priority and provide what they need, ensuring their utmost satisfaction. Staff is our greatest asset and we value the voice of our staff and maintain an open door policy in the office premises to encourage dialogue.
2. IntegrityWe maintain the highest standards of integrity and accountability in all we say and do. We also strive to uphold customer trust earned throughout the period of our stand, by being committed to the highest levels of transparency. In addition to this, aligning to international standards of social performance management with close monitoring of our impact created though microfinance, we continue to be a Company accountable in providing responsible finance solutions to all our clients.
3. InnovationWe strive to keep our forward march steady in the current turbulent industry environment by positively undertaking various innovations to drive us ahead, whilst strengthening research and development to make innovation a continuous process.
4. Serve People & Conserve NatureWhilst adhering to the concept of triple bottom line, we as a company place high priority on social and environmental sustainability, with which the long term goals of the Company are strongly entwined.
VisionTo be the most respected Licensed Finance Company in Sri Lanka, delivering superior stakeholder returns whilst supporting financial inclusion and social and environmental sustainability.
Mission To uphold the highest standards of social and environmental sustainability by delivering inclusive and innovative financial solutions to uplift the lives of people, whilst ensuring a superior experience for all our stakeholders
5. DynamicThe business environment today is subject to rapid changes and is therefore very turbulent. Being dynamic is about keeping pace in the ever changing landscape and taking responsive action in order to meet challenges and surge ahead of the competition.
6. UnityWe take pride in the cohesion of the workforce in the Company working towards a common goal and it is a value that can only be created not infused. “All for one and one for all” philosophy has always been a key driving force of the Company’s success and we strive to maintain its consistency throughout.

08 09
Alliance Finance Company PLC | Annual Report 2016/17
Overview Management Discussion & Analysis
Financial Reports Supplementary information
Performance Highlights
Unit 2016/17 2015/16Y-o-y
change (%)
FInAnCIAl CAPItAlPerformance Gross income Rs. Mn 5,377 4,576 18Net interest income Rs. Mn 2,515 2,220 13Operating profit before VAT Rs. Mn 1,002 604 66Profit before tax Rs. Mn 834 530 57Profit after tax Rs. Mn 649 419 55Dividends Rs. Mn 199 129 54Financial PositionTotal assets Rs. Mn 30,022 25,845 16Gross loans and advances Rs. Mn 23,807 19,697 21Total deposits Rs. Mn 10,088 10,464 -4Shareholders’ funds Rs. Mn 4065 2,722 49Operating ratios Return on assets before tax % 3.0% 2.3% 29Return on equity after tax % 19.1% 16.2% 18Efficiency Ratio % 62.5% 64.0% -2Gross NPL ratio % 2.11% 2.46% -14mAnuFACtured CAPItAlProperty Plant and Equipment
Rs. Mn 2,123 1,447 47
Capital Expenditures Rs. Mn 65 424 -85
ProfitPeople
Planet
Unit 2016/17 2015/16Y-o-y
change (%)
HumAn CAPItAlEmployees Number 1,222 1,203 2Total training hours Hours 2,674 3,570 -28Average training hours Hours 5.0 8.4 -40SOCIAl And relAtIOnSHIP CAPItAlCustomers Number 117,534 133,984 -12Customer touchpoints Number 89 87 2Investment in Entrepreneur Development Service
Rs. Mn 1.2 1.8 -33
Beneficiaries of EDS No. 2,665 4,477 -40Investment in community engagement
Rs. Mn 7.5 6.0 27
Unit 2016/17 2015/16Y-o-y
change (%)
IntelleCtuAl CAPItAlBrand value Rs.Mn 816 643 27nAturAl CAPItAlElectricity consumption Kw 374,526 404,723 -7Water consumption Litres 12,822 NA -Paper recycled Kg 1,576 5,370 -71
OvERvIEw

10
Alliance Finance Company PLC | Annual Report 2016/17
Overview Management Discussion & Analysis
Financial Reports Supplementary information
Our Track Record of Value Creation
To Employees 37%
To Government 25%
To Providers of Capital 10%
To Expansion & Growth 28%
Value Distribution 2016/17
To Employees 46%
To Government 22%
To Providers of Capital 8%
To Expansion & Growth 24%
Value Distribution 2015/16
Tax payments to government
0
12/13
Rs.million
13/14
14/15
15/16
16/17
100 200 300 400 500 600
value created to shareholders
0
12/13
Rs.million
13/14
14/15
15/16
16/17
50 100 150 200 250
value created to employees
0
12/13
Rs.million
13/14
14/15
15/16
16/17
200 400 600 800 1000
OvERvIEw
Cost of External Services
0
12/13
Rs.million
13/14
14/15
15/16
16/17
500 1000 1500
Income
0
12/13
Rs.million
13/14
14/15
15/16
16/17
1,000 2,000 3,000 4,000 5,000 6,000
Interest Expense
0
12/13
Rs.million
13/14
14/15
15/16
16/17
500 1000 1,500 2,000 2,500 3,000

10 11
Alliance Finance Company PLC | Annual Report 2016/17
Overview Management Discussion & Analysis
Financial Reports Supplementary information
Value Added Statement For the year ended 31st march 2017 2016 rs. % rs. %
VAlue Added
Income 5,331,343,714 4,473,444,982Interest Expense (2,462,431,850) (1,868,434,772)Cost of External Services (783,728,971) (983,276,557) 2,085,182,893 1,621,733,654
dIStrIButIOn OF VAlue Added
to employeesSalaries & other benefits 774,573,157 37.15% 750,965,495 46.31%
to governmentTaxes 527,537,408 25.30% 353,180,338 21.78%
to Providers of CapitalDividend 198,806,400 9.53% 128,790,000 7.94%
To Expansion & GrowthDepreciation 110,301,757 5.29% 99,934,198 6.15%Reserves 473,964,171 22.73% 288,863,623 17.81% 584,265,928 28.02% 388,797,821 23.97% 2,085,182,893 100.00% 1,621,733,654 100.00%
OvERvIEw

12
Alliance Finance Company PLC | Annual Report 2016/17
Overview Management Discussion & Analysis
Financial Reports Supplementary information
12
Our Excellence OvERvIEw

12 13
Alliance Finance Company PLC | Annual Report 2016/17
Overview Management Discussion & Analysis
Financial Reports Supplementary information
1312
Sequence Awarding body Awarded for Awarded/Accolade Received Category Year
1 Labour Department of SL Social Dialog and Work Place Cooperation
Merit Award Service Sector Large Scale Category 2016
2 Employer Branding Institute
Best Employer with outstanding Employee culture
Certificate of Recognition Human Resources 2016
3 CMO Asia Awards for Excellence in Branding and Marketing
AFC Motobike Show - 2016 Excellence for " Marketing Campaign of the year 2016
Marketing 2016
ICASL Annual Report Certificate of Compliance Non-Bank and Financial Sector 20165 ICASL Annual Report Certificate of Recognition Non-Bank and Financial Sector 20156 EA Asia Responsible Entrepreneurship Winner Green Leadership 20147 EOSD Ezy Taxi Merit Certificate Best Innovation in Sustainable Financial
Products and Services2013
8 ICASL Annual Report Certificate of Recognition Non-Bank and Financial Sector 20139 DNV BCMS ISO 22301 Not Applicable 2013
10 NCCSL NBEA Gold - Joint winner Non-Bank and Financial Sector 201211 NCCSL NBEA Silver Performance Management Practices- Overall 201212 ICASL Annual Report Certificate of Recognition Non-Bank and Financial Sector 201213 BSI BCMS BS25999 Not Applicable 201214 NCCSL NBEA Silver Specialised Banking and Finance Sector 201115 ICASL Annual Report Certificate of Recognition Non-Bank and Financial Sector 201116 ICASL Annual Report Certificate of Recognition Non-Bank and Financial Sector 201017 ICASL Annual Report Certificate of Recognition Non-Bank and Financial Sector 2009
BSI - British Standards InstitutionEA - Enterprise AsiaDNV - Det Norske Veritas
EOSD - European Organisation for Sustainable DevelopmentICASL - Institute of Chartered Accountants of Sri LankaNCC - National Chamber of Commerce of Sri Lanka

14
Alliance Finance Company PLC | Annual Report 2016/17
Overview Management Discussion & Analysis
Financial Reports Supplementary information
1st DecaDe1956-1966
• AFC was incorporated on the 18th July 1956 at No.43, Campbell Place, Colombo 8 with the motto “ Earn before you spend & Others before self”
• The Company’s shares quoted in the Colombo Brokers Association
2nD DecaDe1967-1976
• Acquired “ Arpico Finance”
• AFC purchases the land and buildings at No.84, Ward place, Colombo 7
5th DecaDe1997-2006
• Incorporates “Alfinco Insurance Brokers”’, a joint venture between Alliance Finance & Arpico Finance
• Became the first Financial institution to be awarded the prestigious ISO 9001:1994 status by DNV and the Company to upgrade into ISO 9001: 2000
• Opens the first collection centre in Kurunegala
• Launches quick cash loan plan for depositors
• First Finance Compnay to introduce Savings Accounts
• Celebrated the Golden Anniversary
• Launches a deposit scheme for senior citizens “Pride of Priority”
3rD DecaDe1977-1986
• Commemorated the Company’s Silver Jubilee
4th DecaDe1987-1996
• AFC moves into “Alliance House”- a new, three storied complex which is today a well-known landmark in the city
• Introduces the concept of Collaboration Finance, customized financial packages for entrepreneurs
• Forms the “Alliance - Excel Collaboration” to import floor & wall tiles and sanitary ware
Our Journey of Six DecadesOvERvIEw

14 15
Alliance Finance Company PLC | Annual Report 2016/17
Overview Management Discussion & Analysis
Financial Reports Supplementary information
6th DecaDe2007-2016
• The Chairman and Joint Managing Director Mr. Pratapkumar de Silva retires from the post of joint MD and continues as Chairman. Mr. Romani de Silva continues as Deputy Chairman and takes on the role of MD
• Alliance Finance becomes the joint winner (with Peoples’ Leasing and Finance Company) of the Gold Award at the National Business Excellence Awards 2012
• Wins the overall Silver Award for “ The Best Performance Management Practices” at the National Business Excellence Awards 2012
• Introduced the symbolic wave in blue, green and orange to all brand communiques signifying and reminding all its Stakeholders of the Company’s commitment to the triple bottom line; PEOPLE, PLANET and PROFIT
• Receives an international accolade for its initiative to develop Sustainable Business products with a Merit Award at the Global Sustainable Finance Conference held in Germany for the AFC Ezy Drive Green taxi initiative
• The branch network is increased to 32 branches with a representation in every province in Sri Lanka
• Launches the Microfinance Strategic Business Unit
• Awarded the Asia Responsible Entrepreneurship Award for the Ezy Drive gas taxi project
• Obtained AFC’s inaugural strategic foreign funding line from prestigious Triodos Bank of Netherlands along with the first FCY loan facility from Bangladesh
• AFC joins hands with Associated Motorways to promote two wheelers to prospective AFC customers
Year2017• Celebrated the 60th year Anniversary of the Company
• Organized the “AFC Motorbike Show 2016” the first ever two wheeler exhibition and stunt show conducted by a finance company in Sri Lanka
• Won the CMO award for the best marketing campaign of the year for the AFC Motorbike Show 2016
• Won the Merit award for Social Dialogue and Workplace Cooperation from the Sri Lanka Department of Labor
• Won the Best Employer Brand Award 2016 awarded by the Employer Branding Institute
• Obtained USD 4 million subordinated debt from the Netherlands based Triodos Bank and a USD 10 million loan from Switzerland based Investment Fund; Symbiotics Organization
• Signed an MOU with Diesel & Motor Engineering PLC to promote land vehicles including tractors to potential AFC customers

Alliance Finance Company PLC | Annual Report 2016/17
Overview Management Discussion & Analysis
Financial Reports 16
Our performance goes beyond financial numbers and our philosophy has been about having a meaningful impact through our business.
Sunil KarunanayakeChairman30th May 2017Colombo

17
Alliance Finance Company PLC | Annual Report 2016/17
Overview Management Discussion & Analysis
Financial Reports Supplementary information
16
Chairman’s Reviewdear Shareholders,It is my pleasant duty to set before you the Annual Report and Accounts for the financial year ended 31st March 2017 and welcome you to the 61st Annual General Meeting of the Company.
Your Company has delivered a strong performance recording Rs. 649 Mn profit after tax for the financial year 2016/17 which is a 55% increase over the previous year. This was supported by strong portfolio growth of 21% driving Net Interest Income and a decline in the non-performing loans ratio from 2.46% to 2.11% which resulted in a significantly reduced impairment charge. The rising cost of funds was a key concern during the year as interest expense increased by 32% due to both increased borrowing and higher interest rates. We have broad based our funding structure by sourcing a credit line from the Triodos Bank in The Netherlands and Symbiotics in Switzerland which marks a milestone as our pioneering foreign credit lines supporting our inclusive growth aspirations. Additionally, we capitalized our reserves with a scrip issue and strengthened our core and risk weighted capital ratios with a rights issue during the year.
It is noteworthy that our performance goes beyond financial numbers. Our philosophy has been about having a meaningful impact through our business. Therefore, I am duty bound to give you an account of how we looked beyond the bottom line and implemented initiatives to drive the socio-economic progress of our key stakeholders taking accountability for our impact on the environment.
Your Company works primarily with small credit business, providing access to finance to people with ambition, skill and commitment who choose to follow their dreams. These micro entrepreneurs and SMEs are the backbone of our economy and we are frequently their first financier in the formal financial sector of the country. Consequently, our leasing portfolio comprises mainly of three wheelers and motor cycles while our loans portfolio caters to the financing requirements of family run businesses. We impact their lives positively and we now wish to use this ability to drive even more meaningful change, providing responsible options through innovative and structured products that improve our world socially, economically and environmentally. Examples of products in the pipeline include the leasing product being structured for low carbon emission-gas kits for three wheelers and hybrid vehicles. Our goal here extends beyond a mere financing role to a more environmentally sustainable solution. Our recently launched “tika tika ge dora” product is another example of how we want to change social behaviour by encouraging the customer to build or invest in a small home at an early stage of life and then extending it or moving up market as the earning capacity grows.
It is also necessary to set our performance in the context of its operating environment. GDP growth moderated to 4.4% as the agriculture sector contracted due to adverse weather conditions. The trade gap widened during the year to 11.2% of GDP as sluggish demand from key export markets resulted in a decline in export revenues while imports increased. Implementation of an increased loan to value ratio early in the year resulted in declining demand for vehicle imports and leases.
The Financial services sector remained buoyant as private sector demand remained strong during 2016, improving profitability despite challenges in managing cost of funds due to rising interest rates. The NBFI sector also recorded a strong growth of 21.7% on its asset base which was supported by lending activities. Growth was funded mainly through borrowings which accounted for 58% of the increase while the remainder was funded through equity, deposits and other liabilities. The NPL ratio declined from 5.7% to 5.3% during the year improving the credit risk profile of the industry. Profit growth in the sector also remained robust with a significant increase witnessed across the industry.
The governance structure of the Company was strengthened with the appointment of a Consultant Director Finance and Operations to provide expert guidance in managing the funding and financing requirements of the Group. We continue to engage the Indian company Microsave on microfinance related development. They have significant experience in the field and are in a position to carry out special internal audits on the product and report to the Board with recommendations in relation to the resolution of issues identified.
In closing, I wish to record my appreciation of the hard work done by the team at Alliance Finance, ably led by the Deputy Chairman and Managing Director Mr. Romani De Silva and count on their fullest support in realizing our lofty ambitions. I thank the Board for their diligence and contributions which proved insightful in guiding a sound strategy for the Group. I thank our shareholders for the trust and confidence placed in me to steer this Group to success.
OvERvIEw

18
Alliance Finance Company PLC | Annual Report 2016/17
Overview Management Discussion & Analysis
Financial Reports
We have crafted a holistic strategy aligned with the government agenda that seeks to improve access to finance which supports the socioeconomic progress of the country
romani de SilvaDeputy Chairman/Managing Director
30th May 2017Colombo

18 19
Alliance Finance Company PLC | Annual Report 2016/17
Overview Management Discussion & Analysis
Financial Reports Supplementary information
dear Shareholders, Alliance Finance Company PLC recorded a solid performance enhancing the shareholder value by delivering a profit growth of 55%. We strengthened the Balance Sheet with total asset growth of 16%, whilst the portfolio grew by 21%. It is my pleasure to present our 61st Annual Report for the financial year ending 31st March 2017.
Focused growthPortfolio growth moderated to a prudent 21% during the year keeping pace with industry growth as we implemented a more selective growth strategy. Consequently, the total portfolio amounted to Rs. 23.8 Bn reflecting initial efforts to diversify the portfolio. The leasing portfolio grew by 19% as its growth momentum moderated due to tightening fiscal and monetary policy. Loans and advances grew by 33% as we increased our focus on this key area, facilitating diversification of the portfolio. Comprising mainly pledge loans, this product proved popular as it enabled the growth of entrepreneurs and facilitated a higher return due to the short term nature of the product. We decelerated the growth of the group based component of our microfinance portfolio as we focused more on training our staff on best practices and strengthening the recovery process. Consequently, the group based microfinance portfolio declined by 11%. The Gold loan portfolio reflected a growth of 27% with product concentration maintained well below
portfolio exposure limits. The hire purchase portfolio continues to decline due to the changes in the tax policies of the country. These movements are reflected in the portfolio composition at the close of the year.
We worked with the Triodos Bank positioned as one of the world’s most sustainable banks to obtain a credit line to support micro entrepreneurs in Sri Lanka. We were able to secure a subordinated debt of USD 4 Million from the Triodos Bank and a credit line of USD 10 Million from Symbiotics, Switzerland during the year. This initial breakthrough has also paved the way for us to engage with other such lenders as we seek to broad base our funding sources to support our inclusive growth strategy.
We also grew our footprint to support 89 customer support touchpoints during the year, supporting portfolio growth and increasing brand visibility. This was carefully aligned to strategy to drive focused growth, streamlining the number of gold loan centres and collection centres while expanding those touchpoints that offered a wider service or a highly specialised service.
delivering PerformanceNet Interest Income (NII) increased by 13% to Rs.2.5 bn during the year supported by portfolio growth. Tightening monetary policy and market liquidity resulted in a sharp increase in interest rates which had an adverse impact on our cost of funds.
Growing our footprintFYE
2016/17FYE
2015/16
Branches 39 37
Collection / Support Centres 17 13Gold Loan Centres 12 16Microfinance Co-ordinating Offices
21 21
Total 89 87
Deputy Chairman/Managing Director’s Review
20172016
Assets Growth
Portfolio Asset Base
19,6
97
23,8
07
25,8
45
30,0
22
20172016
Shareholders’ Fund
Portfolio
2,72
2 4,06
5
OvERvIEw

20
Alliance Finance Company PLC | Annual Report 2016/17
Overview Management Discussion & Analysis
Financial Reports Supplementary information
Interest expenses increased by 32% due to increased interest rates and borrowings exerting pressure on Net Interest Margins (NIM) which declined from 9.7% in the previous year to 9.0% for the reporting year. This trend was observed industrywide as high exposure to leasing, which is a fixed interest rate product with tenures of 3-5 years, did not allow the pass through of increasing interest rates to existing leasing customers. As a result, industry NIM declined from 8.5% to 7.9% in 2016.
Total Operating Income increased by 10% over the previous year to Rs. 2.9 Bn tempered by the decline in Net Commission Income and Net Gains on trading which was offset to a great extent by the increase of 7% in Other Operating Income.
Impairment and bad debt write off charges declined sharply by 55% as a result of the improvement in Non-Performing Loans (NPL) due to the strengthening of recovery processes. Alliance Finance internally adopts a portfolio at risk (PAR) classification of 30 days for microfinance and 90 days for others to give impetus to recoveries prior to the regulatory classification of 180 days. The gross NPL ratio improved from 2.46% to 2.11% during the reporting period comparing well with the industry NPL ratio of 5.3% at the close of the year. Consequently, the impairment charges declined substantially from Rs. 166 mn in the previous year to Rs. 74 mn for 2017. This contributed to the increase of 23% in Net Operating Income which was Rs. 2.8 bn.
Operating expenses increased by 8% as processes were strengthened, resulting in more efficient operations. Value Added Tax on financial services increased due to tightening fiscal policy from 11% to 15% during the year resulting in a 112% increase in VAT payments. The profit of our associate company Macbertan declined by 18% to Rs. 30 Mn during the year under review due to the transfer of the Pidilite product range to a joint venture Company with our principal, the Indian multinational Pidilite Group. In return Macbertan was able to receive a significant stake in the new joint venture Pidilite Lanka Private Limited. This strategic joint venture located in the Polgahawela free trade zone will manufacture a broad range of adhesives for the Sri Lankan Market. The range to be marketed will include the household adhesive brand “Chemifix”, the ownership of which will accrue to Pidilite Lanka under a business acquisition agreement with CIC Holdings PLC.
Group taxation increased by 63% due to the increased profitability of the Company. The Group delivered Rs.660 Mn as profit after tax reflecting an increase of 51% over the previous year.
Earnings per share increased during the year from Rs.13 (restated) to Rs. 20 due to the increased profitability.
Focus on StabilityTotal Asset growth of 16% from Rs. 25.9 Bn to Rs. 30 Bn was largely driven by portfolio growth. This growth was supported by increased borrowings from banks and equity as we implemented a strategic decision to not compete for higher cost customer deposits given the tightening liquidity in financial markets. Consequently, borrowings increased by 41% from Rs.8.3 Bn to Rs. 11.7 Bn. Deposits inevitably declined marginally by 4% as we maintained our stance to refrain from intense price competition as liquidity was not a major concern for the Company.
As a part of our journey to strengthen the capital structure of the Company, AFC carried out a series of measures consisting of a share split, capitalization of reserves and a rights issue during the year. This helped the Company to increase the number of shares in issue from 2,430,000 to 33,696,000 while increasing the stated capital by Rs. 589.68 Mn to Rs. 613.98 Mn. More information in this regard is given in note number 40 of the Notes to the financial statements.
The Rating Review issued by Fitch Ratings Lanka Ltd., assigned a rating of BB+(lka) with a stable outlook. The core capital ratio improved during the year from 10.2% to 10.4% above the regulatory requirement of 5%. Our total capital ratio declined from 13.5% to 12.1% due to the redeemed subordinated debentures.
Deputy Chairman/Managing Director’s ReviewOvERvIEw
20 21
Alliance Finance Company PLC | Annual Report 2016/17
Overview Management Discussion & Analysis
Financial Reports Supplementary information
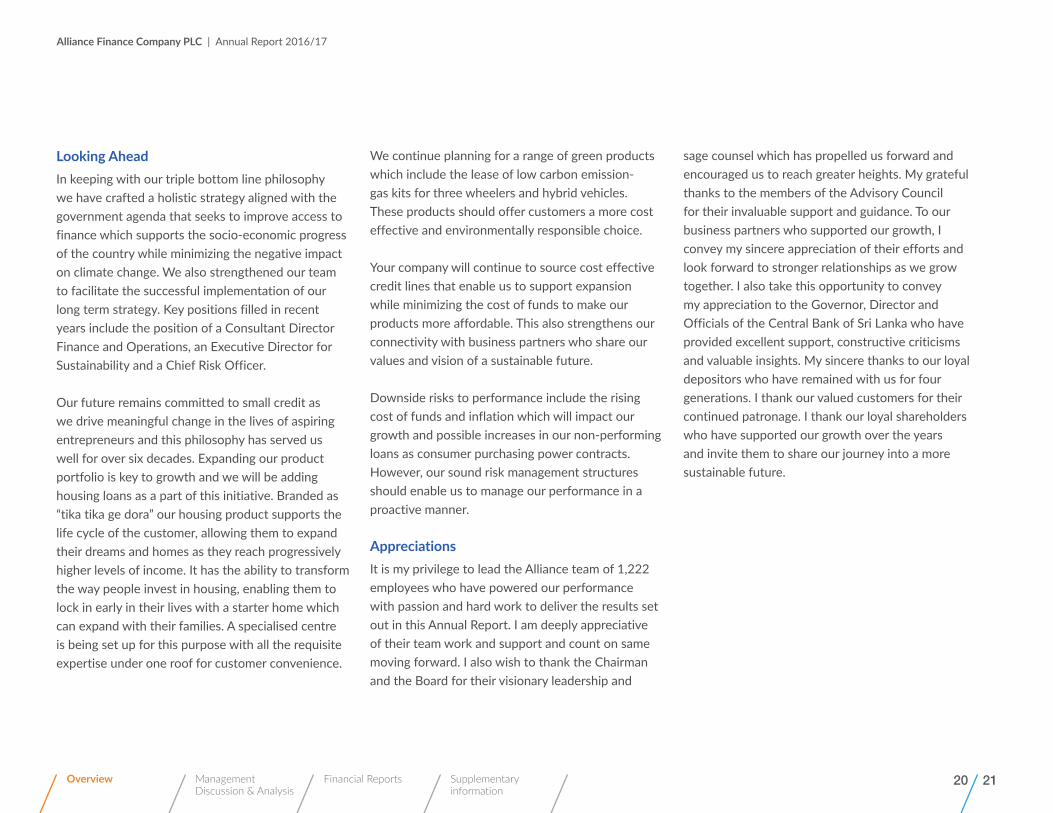
looking AheadIn keeping with our triple bottom line philosophy we have crafted a holistic strategy aligned with the government agenda that seeks to improve access to finance which supports the socio-economic progress of the country while minimizing the negative impact on climate change. We also strengthened our team to facilitate the successful implementation of our long term strategy. Key positions filled in recent years include the position of a Consultant Director Finance and Operations, an Executive Director for Sustainability and a Chief Risk Officer.
Our future remains committed to small credit as we drive meaningful change in the lives of aspiring entrepreneurs and this philosophy has served us well for over six decades. Expanding our product portfolio is key to growth and we will be adding housing loans as a part of this initiative. Branded as “tika tika ge dora” our housing product supports the life cycle of the customer, allowing them to expand their dreams and homes as they reach progressively higher levels of income. It has the ability to transform the way people invest in housing, enabling them to lock in early in their lives with a starter home which can expand with their families. A specialised centre is being set up for this purpose with all the requisite expertise under one roof for customer convenience.
We continue planning for a range of green products which include the lease of low carbon emission-gas kits for three wheelers and hybrid vehicles. These products should offer customers a more cost effective and environmentally responsible choice.
Your company will continue to source cost effective credit lines that enable us to support expansion while minimizing the cost of funds to make our products more affordable. This also strengthens our connectivity with business partners who share our values and vision of a sustainable future.
Downside risks to performance include the rising cost of funds and inflation which will impact our growth and possible increases in our non-performing loans as consumer purchasing power contracts. However, our sound risk management structures should enable us to manage our performance in a proactive manner.
AppreciationsIt is my privilege to lead the Alliance team of 1,222 employees who have powered our performance with passion and hard work to deliver the results set out in this Annual Report. I am deeply appreciative of their team work and support and count on same moving forward. I also wish to thank the Chairman and the Board for their visionary leadership and
sage counsel which has propelled us forward and encouraged us to reach greater heights. My grateful thanks to the members of the Advisory Council for their invaluable support and guidance. To our business partners who supported our growth, I convey my sincere appreciation of their efforts and look forward to stronger relationships as we grow together. I also take this opportunity to convey my appreciation to the Governor, Director and Officials of the Central Bank of Sri Lanka who have provided excellent support, constructive criticisms and valuable insights. My sincere thanks to our loyal depositors who have remained with us for four generations. I thank our valued customers for their continued patronage. I thank our loyal shareholders who have supported our growth over the years and invite them to share our journey into a more sustainable future.

22
Alliance Finance Company PLC | Annual Report 2016/17
Overview Management Discussion & Analysis
Financial Reports Supplementary information
Building for the Next GenerationOur purpose is to nurture our valued stakeholders and build a future for the next generation that is ripe with promise. We are motivated by our strong foundation of trust, powered by innovation and are driven to excellence in every sphere of our activity to ensure a prosperous tomorrow that will enable the next generation to create wealth and exponentially improve their standard of living.

22 23
Alliance Finance Company PLC | Annual Report 2016/17
Overview Management Discussion & Analysis
Financial Reports Supplementary information

24
Alliance Finance Company PLC | Annual Report 2016/17
Overview Management Discussion & Analysis
Financial Reports Supplementary information
MAnAGEMEnT DISCUSSIOn AnD AnAlYSIS
Value Creation modelOur integrated value creation model strives to deliver value to stakeholders, partnering their socio economic progress while balancing our economic, social and environmental impacts. Our value creation model graphically depicts the types of capital and relationships we depend on, the activities we engage in and the outputs and outcomes of our value creating process.
CAPITAL INPUTS VALUE SHAREDVISION AND MISSION
Our strategic pillars
Key business lines
Key products
Financial CapitalShareholders’ funds: Rs 4,065 MnDebt: Rs. 14,266 MnDeposits: Rs. 10,088 Mn
Manufactured CapitalCustomer contact points: 89
Human CapitalSkills, attitudes and values of our 1,222 employees
Social & Relationship CapitalCustomer relationships: 117,534Supplier relationshipsRelationships with our communities
Intellectual CapitalTacit knowledge and organizational capitalBrand
natural CapitalWater use: 12,822 ltrEnergy consumption: 374,526 Kwh
ShareholdersValue creation through dividends and appreciation in share price (pages 92 - 93)
CustomersWe provide a range of holistic and innovative financial services (pages 104 - 105)
EmployeesOur employee value proposition comprises of engaging, developing and rewarding employees (pages 98 - 99)
SuppliersSupplier engagement and development (page 110)CommunitiesWe uplift communities through job creation, providing financial access and development services (Pages 110 - 113)
GovernmentTax contributions and regulatory compliance (page 10)
Corp
orat
e g
over
nanc
e
risk
man
agem
ent
Regional financial services
(pages 79-82)
Profitability
Social Sustainability
Growth
Gold loans (page 86)
Deposits(page 87)
Micro finance
(pages 83-85)
Credit InvestmentLeasingMicrofinance group loansMortgage loansPledge loansGold loansOther loans
SavingsFixed deposits
Environmental Sustainability
Support services: Treasury, HR, IT, Recoveries, Audit, Legal, Finance, Administration, MIS
OutPutS And OutCOmeS
Net profit: Rs. 649 Mn
Interest paid to customers: Rs. 1,100 Mn
Payments to employees: Rs. 775 Mn
Spend on CSR: Rs. 7.5 Mn
Training hours: 2,674
Operating Context and Strategy
24 25
Alliance Finance Company PLC | Annual Report 2016/17
Overview Management Discussion & Analysis
Financial Reports Supplementary information
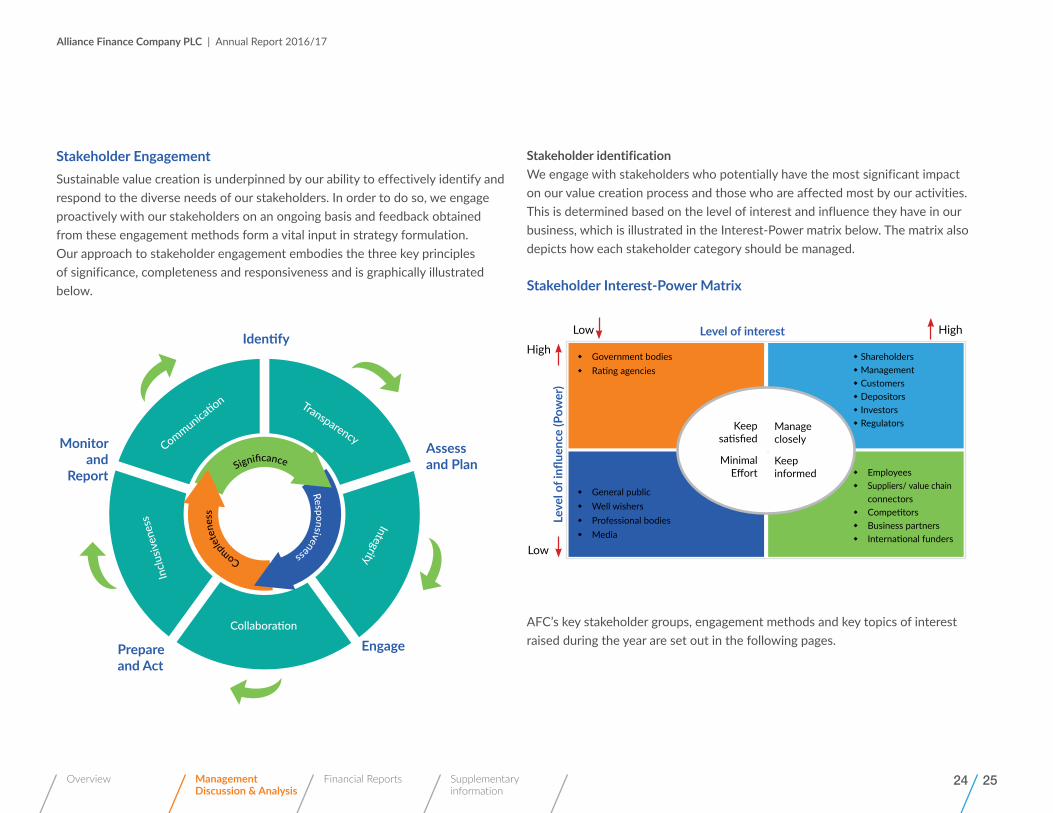
Stakeholder engagementSustainable value creation is underpinned by our ability to effectively identify and respond to the diverse needs of our stakeholders. In order to do so, we engage proactively with our stakeholders on an ongoing basis and feedback obtained from these engagement methods form a vital input in strategy formulation. Our approach to stakeholder engagement embodies the three key principles of significance, completeness and responsiveness and is graphically illustrated below.
Communication Transparency
Integrity
Collaboration
Incl
usiv
enes
s
S
ignif cance
Responsiveness Comple
tene
ss
Identify
Assess and Plan
engagePrepare and Act
monitor and
report
Stakeholder identificationWe engage with stakeholders who potentially have the most significant impact on our value creation process and those who are affected most by our activities. This is determined based on the level of interest and influence they have in our business, which is illustrated in the Interest-Power matrix below. The matrix also depicts how each stakeholder category should be managed.
Stakeholder Interest-Power matrix
Low
Low
High
High
Leve
l of i
nflue
nce
(Pow
er)
level of interest
Government bodies Rating agencies
Shareholders Management Customers Depositors Investors Regulators
Employees Suppliers/ value chain connectors Competitors Business partners International funders
Keep satisfied
Minimal Effort
Manage closely
Keep informed
General public Well wishers Professional bodies Media
AFC’s key stakeholder groups, engagement methods and key topics of interest raised during the year are set out in the following pages.

26
Alliance Finance Company PLC | Annual Report 2016/17
Overview Management Discussion & Analysis
Financial Reports Supplementary information
Stakeholder How we engage Areas of interest/expectations in 2016/17 Stakeholder management approach and response
Shareholders • AGM and Annual Report (annually)
• Interim financial statements (quarterly)
• Corporate website (continuous basis)
• Announcements to the CSE (continuous basis)
• Press releases (continuous basis)
• Sustainable growth
• Adequate risk return balance
• Corporate governance and risk management frameworks
• Corporate reputation and brand
• Transparency and credibility of disclosures
We provide our shareholders with timely, relevant and complete information to facilitate effective and informed decision making
relevance to Strategy: Growth, Profitability, Social Sustainability, Environmental Sustainability
CustomersWe serve approximately 117,534 credit and deposit customers across the island
• Customer satisfaction survey (bi-annually/quarterly)
• Customer relationship management function (continuous)
• Customer exit surveys in microfinance (annual)
• Customer hotline (continuous)
• Customer education programmes (continuous)
• Online and social media platforms (continuous)
• Value for money
• Convenience and accessibility
• Innovative product offerings
• Security of deposits
• Ease of transacting
• Quality of service
Our customer value proposition is based on personalised service, innovative products and trust.
relevance to Strategy: Growth, Social Sustainability, Environmental Sustainability
employees
Our team comprises 1,222 individuals recruited from across the island
• Stakeholder feedback survey (annual)
• Performance appraisal (annual)
• Multi-level staff meetings (continuous)
• Open door policy (continuous)
• Training need assessment (annual)
• Social media platforms (continuous)
• Work-life balance initiatives (continuous)
• Competitive remuneration
• Equal opportunity
• Opportunities for skill development and career progression
• Work-life balance
We seek to provide ongoing opportunities for skill and career development in a dynamic and challenging work environment
relevance to Strategy: Growth, Profitability, Social Sustainability
MAnAGEMEnT DISCUSSIOn AnD AnAlYSIS
Operating Context and Strategy

26 27
Alliance Finance Company PLC | Annual Report 2016/17
Overview Management Discussion & Analysis
Financial Reports Supplementary information
Stakeholder How we engage Areas of interest/expectations in 2016/17 Stakeholder management approach and response
Business Partners and SuppliersWe have partnered with diverse sets of suppliers who are an integral part of our business
• Direct dialogue (continuous)
• Service quality survey (annual)
• Stakeholder feedback survey (annual)
• Ease of transactions
• Business expansion
• Capacity building and financial support
• Equitable and on-time payments
We strive to nurture long-term partnerships with our diverse supplier base and propagate sustainable business practices along our supply chain
relevance to Strategy: Growth, Profitability Social sustainability
regulators/ government Bodies Our main regulators are the Central Bank of Sri Lanka, the SEC and CSE.
• Regulatory reporting (continuous)
• CBSL audits (annual)
• Special meetings for regulatory clarifications (continuous)
• Press releases and CSE disclosures (continuous)
• Good governance and compliance
• Sustainable business practices
• Ethical business
Growth, Profitability,
We engage in a productive and constructive dialogue with our regulators and the government to ensure a conducive industry environment.
relevance to strategy: Growth, Profitability, Environmental sustainability, Social sustainability
CommunityWe maintain proactive and mutually beneficial relations with the communities in which we operate
• CSR initiatives (periodic)
• Press releases and publications (continuous)
• Engagement through branches (continuous)
• Employment generation
• Livelihood and community development
• Commitment towards preserving the environment
We maintain cordial and mutually respectful relationships with the communities in which we operate.
relevance to strategy: Environmental sustainability, Social sustainability

28
Alliance Finance Company PLC | Annual Report 2016/17
Overview Management Discussion & Analysis
Financial Reports Supplementary information
defining report ContentIn determining the content to be included in this Report, we have conducted a materiality analysis which reflects the issues which could potentially have the most significant impact on our ability to create value. The material aspects listed below reflect the feedback obtained from our stakeholder engagement mechanisms, market dynamics as well as the Group’s overarching strategic agenda. The Group conducts the materiality assessment on an annual basis, and this year, we have expanded the scope of our material aspects by looking beyond the aspects prescribed by the GRI framework and including issues that are specific to our industry and strategic agenda. We have also clearly identified how these selected material aspects correspond to the aspects prescribed by GRI and how these issues link to our strategy.
Identify issues that could have an impact on the
Group’s value creation process with reference to feedback obtained from stakeholder engagement mechanisms
as well as internal strengths and weaknesses and broader
contextual trends.
Evaluate their significance to the Group and the impacted stakeholders
Prioritize matters based on their relative
significance
Determine matters to be
disclosed in the Integrated
Report.
Influ
ence
on
stak
ehol
der d
ecis
ions
Significance Of Impacts
2,5,9,11,14,15
10
1,3,4,6,7,8,12,13
MAnAGEMEnT DISCUSSIOn AnD AnAlYSIS
Operating Context and Strategy

28 29
Alliance Finance Company PLC | Annual Report 2016/17
Overview Management Discussion & Analysis
Financial Reports Supplementary information
materiality matrix
Material Aspect Corresponding GRI Aspect Aspect Boundary Reference in Report (Pages)
Strategic Priority: Growth
1 Financial performance Economic Performance Internal 88-932 New product development - Internal 1043 Employee value proposition Employment, Training and education, Labour management relations, Equal
remuneration for men and women, Labour practices and decent workInternal 96-103
4 Branch reach - Internal 94,965 Brand awareness - External 81
Strategic Priority: Proftability
6 Operational efficiency - Internal 79-877 Employee productivity - Internal 98 Portfolio quality - Internal 919 Portfolio diversification - Internal 79-80
Strategic Priority: Environmental Sustainability
10 Minimising our environmental impact
Energy, water, raw materials, waste and effluents, carbon footprint, Compliance (EN)
Internal/external 115-119
11 Environmental screening Supplier environmental assessment Internal 110Strategic Priority: Social Sustainability
12 Responsible lending practices Product & Service labelling, Marketing communications, Customer privacy, Compliance-PR
Internal 81,107
13 Customer education - External 85,10814 Supplier relationships - External 11015 Community engagement Local communities External 111-113

30
Alliance Finance Company PLC | Annual Report 2016/17
Overview Management Discussion & Analysis
Financial Reports Supplementary information
Our Strategy Strategy determination process
The Group’s strategic plan for 2016-2019 builds on the foundation put in place by the Strategic plan for 2012-2015, and was formulated following extensive stakeholder engagement and an evaluation of AFC’s unique strengths. Strategy is also informed by emerging opportunities and threats in the operating landscape. The Group’s strategic plan clearly identifies four strategic objectives with defined performance indicators and time plans for achievement.
Emerging trends (Pgs. 72-78)
Value creation model (Pg. 24)
Stakeholder concerns
(Pgs. 25-27)
Material issues (Pgs. 28-29)
Strategic focus areas (Pg. 30)
Profitability
Government policy
Regulatory framework Sustainability considerations
Tech
nolo
gyC
onsu
mer
pre
fere
nces
Demographics
Com
petitionInterest rates
Corp
orat
e g
over
nanc
e
risk managem
ent
Gro
wth Social
Sustainability
Environmental Sustainability
Portforlio diversity Operational efficiencyCost efficiencyPortfolio quality
Responsible lendingCommunity engagement
Green financingMinimising environmental impacts
Optimise geographical footprintBrand recognition outside Western ProvinceEmployee value proposition
MAnAGEMEnT DISCUSSIOn AnD AnAlYSIS
Operating Context and Strategy

30 31
Alliance Finance Company PLC | Annual Report 2016/17
Overview Management Discussion & Analysis
Financial Reports Supplementary information
Our Approach to SustainabilitySocial and environmental sustainability are two key pillars of the Group’s strategic agenda and embodies the Group’s commitment towards the triple bottom line approach. In recent years, we have sought to increasingly embed sustainability considerations into our business operations, in order to effectively respond to emerging sustainability dynamics and minimise our social and environmental impacts. As a financial services organisation, we believe our most significant contribution towards environmental and social sustainability is through our lending practices. The planned implementation of an integrated Environmental and Social Sustainability Management System (ESMS) in the next financial year is expected to transform the way we do business, by introducing social and environmental KPIs and driving employee awareness on sustainability considerations.
People
PlanetProfit
Strategic Priority : Social Sustainability
Human CapitalSocial & Relationship
Capital
Fina
ncia
l Cap
ital
Man
ufac
ture
d Ca
pita
lIn
telle
ctua
l cap
ital N
atural Capital
Strategic Priority : Environm
ental Sustainability
Stra
tegi
c Pr
iorit
y :
Gro
wth
and
Pr
ofita
bilit
y

32
Alliance Finance Company PLC | Annual Report 2016/17
Overview Management Discussion & Analysis
Financial Reports Supplementary information
Our Commitment to the Sustainable development goalsIn September 2015, leaders from 193 states adopted the United Nations Sustainable Development Goals, galvanizing global efforts to end poverty, promote prosperity and protect the environment. Governments, private sector entities and all communities are expected to play a contributory role in the achievement of these goals and as an Organisation we are exploring how we can contribute most effectively ourselves. The infogram below lists out the goals which are of greatest relevance to us and how we are currently contributing towards the achievements of these targets.
Through our “tree for a lease” initiative, AFC has planted 15,800 trees to date. We also hope to introduce 300 eco-friendly three wheelers with a gas conversion kit.
The Company is an industry pioneer in green three-wheeler financing and hope to further expand this product line, together with hybrid leasing facilities. We also engage employees in our energy conservation efforts.
We have a high female participation rate of 21% in our team. Through our micro-financing initiative we empower women, contributing to their socio-economic progress
Through our leasing facilities, AFC contributes towards enhancing access to transportation across the island
MAnAGEMEnT DISCUSSIOn AnD AnAlYSIS
Operating Context and Strategy

32 33
Alliance Finance Company PLC | Annual Report 2016/17
Overview Management Discussion & Analysis
Financial Reports Supplementary information
We place an ongoing focus on developing the skills of our employees through on the job training and opportunities for external training.
We offer our employees competitive remuneration and opportunities for skill and career development in a dynamic and challenging work environment.
Through our group based microfinance and EDS programmes we contribute towards economic and social empowerment, thereby alleviating poverty through financial inclusion
Relevance to our operations
34
Alliance Finance Company PLC | Annual Report 2016/17
Overview Management Discussion & Analysis
Financial Reports Supplementary information
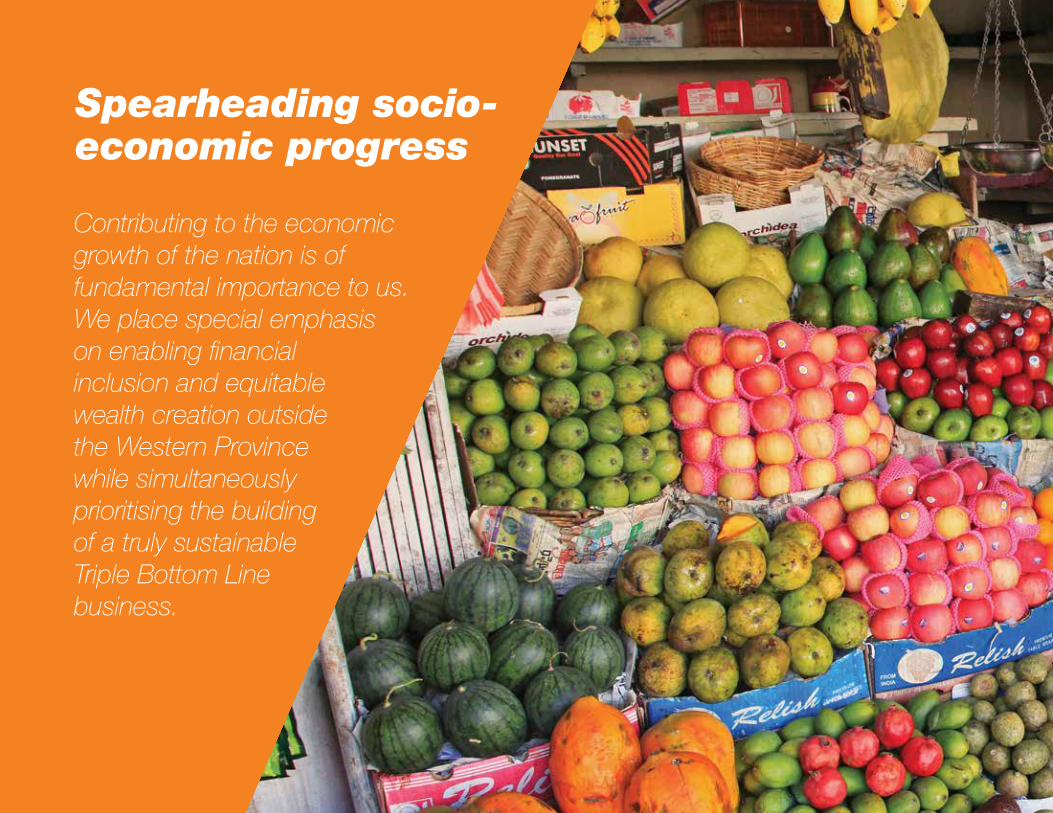
Spearheading socio-economic progress
Contributing to the economic growth of the nation is of fundamental importance to us. We place special emphasis on enabling financial inclusion and equitable wealth creation outside the Western Province while simultaneously prioritising the building of a truly sustainable Triple Bottom Line business.

34 35
Alliance Finance Company PLC | Annual Report 2016/17
Overview Management Discussion & Analysis
Financial Reports Supplementary information

36
Alliance Finance Company PLC | Annual Report 2016/17
Overview Management Discussion & Analysis
Financial Reports Supplementary information
Board of Directors
Mr. Sunil KarunanayakeChairman
Mr. Mahinda GunasekaraExecutive Director - Sustainability
Mr. Romani de SilvaDeputy Chairman/ Managing Director
Dr. L.A.P. MedisConsultant Marketing Director
Mrs. R.N. PonnambalamNon-Executive Director
Lt. Col. (Retd) A.R. SamarasingheIndependent Non-Executive Director
Mr. Kusal JayawardanaConsultant Director Finance and Operations
STEwARDSHIP

36 37
Alliance Finance Company PLC | Annual Report 2016/17
Overview Management Discussion & Analysis
Financial Reports Supplementary information
mr. Sunil KarunanayakeChairman
He joined the Board on 26th January 2012 as an Independent Non-Executive Director and was appointed as the Chairman with effect from 1st June 2013. He is also the Chairman of the Audit Committee. Mr. Karunanayake is a Fellow Member of the Institute of Chartered Accountants (FCA), Chartered Institute of Management Accountants (FCMA) and also holds an MBA from the Postgraduate Institute of Management at the University of Sri Jayewardenepura. He counts over 30 years of experience in a leading multinational company. Mr. Karunanayake also serves as a Non-Executive Director on the Boards of Ceylon Grain Elevators PLC, Orient Garments PLC and Three Acre Farms PLC. He also functions as the Chairman of the Audit Committee in the said listed companies.
mr. romani de SilvaDeputy Chairman / Managing Director
A Fellow Member of the Institute of Credit Management, Sri Lanka, Mr. Romani de Silva holds Directorates in many companies. He possesses almost 30 years of experience in the finance Industry. He is the pioneer of Collaboration Financing, a unique financing concept designed to provide finance for entrepreneurs to expand businesses. The creation of this concept resulted in Alliance Finance
becoming the first and only finance company in Sri Lanka to be awarded the ISO 9001 Certificate for designing business specific financial solutions. He was also awarded two Bronze Awards for this innovation at Provincial and National Level at the “Sri Lanka Entrepreneur of the Year 2001” contest. He is a Life Member of the Sri Lanka Institute of Directors and the Chamber of Young Lankan Entrepreneurs.
lt. Col. (retd) A. r. SamarasingheIndependent Non-Executive Director
A retired Army Officer, having served for 20 years, he has had the opportunity of commanding two Reinforcement Battalions in the Infantry role and two Signals Regiments in its classic role of the Signals Corps and functions as an Enterprise Security Strategist. He holds a Bachelor’s degree in Information Technology from the University of Colombo and an MSc in Computer Science (Security) from the University of Moratuwa.
mrs. r. n. PonnambalamNon-Executive Director
She has held several senior management positions in large private sector entities and has served as a Director of McLarens Holdings Ltd. Mrs. Ponnambalam currently serves as the CEO/ Managing Director of Macbertan (Pvt) Ltd. and as a Non-Executive Director of Hotel Services (Ceylon) PLC & Amaya Leisure PLC. She has served in key roles in international negotiations for securing and development of business opportunities of international repute for expansion and growth of local business enterprises. She is also a holder of Diploma in Directorship from the prestigious Singapore Management University (SMU).
mr. mahinda gunasekeraExecutive Director - Sustainability
Mahinda Gunasekera has 30+ years of experience in the fields of Microfinance, SME finance, livelihood development, and agribusiness in Sri Lanka, Afghanistan, Bangladesh and Nepal. In addition he has short term work experience in Tajikistan, Bangladesh, Philippines, Thailand, Japan, and the United States. Over that period he worked for large governmental organizations such as US Agency for International Development and undertook specialist assignments with the World Bank/ IFC, the Asian Development Bank and US based INGOs/ PVOs.

38
Alliance Finance Company PLC | Annual Report 2016/17
Overview Management Discussion & Analysis
Financial Reports Supplementary information
Board of DirectorsHe is an expert in the rural finance sector and SME sector development and was a long term MF and SME consultant as well. As a Banking and Finance Expert for ADB, he also has extensive experience in institutional, due-diligence and performance analysis of several dozens of Commercial Banks, Development Banks and MFIs in Asia.
was been a Managing Director/CEO of three MFIs, one in Afghanistan and the other two in Sri Lanka. Mahinda holds an MBA, B. SC, Agriculture and Microfinance training from the University of Colorado, USA.
dr. l. A. P. medisConsultant Marketing Director
Dr. Ajith Medis has served AFC as Board Consultant Marketing prior to be appointed as Consultant Marketing Director in August 2016. He has considerable experience in the field of marketing and sales, which is his forte and has served in many different capacities in the NBFI sector. Currently he is attached to the academia of the University of Kelaniya. Training of staff in marketing is another one of his core strengths.
Dr. Medis holds a doctorate in Strategy from Management and Science University, Malaysia, Bachelor of Commerce (Special) Honours Degree from the University of Kelaniya, Postgraduate Diploma in Marketing from CIM (UK), MBA from the University of Sri Jayewardenepura and is also a Certified Management Accountant of Australia.
mr. Kusal Jayawardana Consultant Director Finance and Operations
Kusal brings nearly 20 years of experience in investment banking, corporate finance, credit and operations. He was appointed to the Board of AFC in April 2017 as Consultant Director – Finance and Operations. He was involved and has lead deal teams in introducing a number of innovative capital market products to Sri Lanka and Bangladesh which includes different types of securitization structures, convertible securities and derivatives and executing several landmark capital market transactions. Kusal played a key role in setting up NDB Capital Limited, Bangladesh and Emerald Sri Lanka Fund, the first private equity country fund to be set up in Sri Lanka.
His notable previous engagements include Managing Director/CEO of NDB Capital Limited, Bangladesh and Chief Operating Officer of NDB Capital Holdings Limited. Kusal was a Director of a number of listed
STEwARDSHIP
and private companies including Resus Energy PLC, Panasian Power PLC, Lanka Communication Services Limited, Prosperous Capital and Credit Limited, Liege Capital Partners (Private) Limited and NDB Capital Limited.
Kusal is a Chartered Financial Analyst, Associate Member of The Chartered Institute of Management Accountants, UK and the Chartered Global Management Accountant, USA and was an Associate member of the Association of Chartered Certified Accountants, UK. He also holds an MBA from the Open University of Sri Lanka in collaboration with Commonwealth of Learning, Canada.
Kusal also acts as a lecturer, trainer and consultant in corporate finance and strategy.

38 39
Alliance Finance Company PLC | Annual Report 2016/17
Overview Management Discussion & Analysis
Financial Reports Supplementary information
Corporate Management
Michael J. BenedictChief Risk Officer
Chamindra De SilvaChief Financial Officer
Sujith Lakshan FernandoDeputy Financial Controller – Corporate Planning / Business Support
Andrew SamuelHead of Microfinance/Chief Continuous Improvement Officer
Chathura Prasanna SandaruwanAssistant General Manager - Internal Audit
Aruna RodrigoAGM - Credit
Champa NakandalaAssistant General Manager Deposit
STEwARDSHIP
Mr. E.C.S.R. MuttupulleChief Operating Officer

40
Alliance Finance Company PLC | Annual Report 2016/17
Overview Management Discussion & Analysis
Financial Reports Supplementary information
Sanjaya SeneviratneAssistant General Manager - Treasury
Hilary CalistusAssistant General Manager - Recoveries
Roshan RathnayakaAssistant General Manager - RFS
Prasanna Shyam PeirisAssistant General Manager - RFS & Gold Loan
Sujan CoorayAssistant General Manager - RFS - Unit II
Corporate ManagementSTEwARDSHIP
Prabhath RangajeewaHead of Gold Loan

40 41
Alliance Finance Company PLC | Annual Report 2016/17
Overview Management Discussion & Analysis
Financial Reports Supplementary information
PrasadSanjeewaRegionalManager
ViduppriyaPriyangaFernandoRegionalManager
RohanSilvaAssistantManagerAdministration
S.S.SathiyadaranITConsultant
AntonPereraConsultantHeadofDepartmentHR
RanilPereraManager-BranchOperations&Performance
LolitaPerpetualJunePapalieManager-Deposits
AchalaWanniarachchiManager-Legal
Senior ManagementSTEwARDSHIP

42
Alliance Finance Company PLC | Annual Report 2016/17
Overview Management Discussion & Analysis
Financial Reports Supplementary information
DamindaMalawiarachchiManager-HumanResources
UdayaSuranjithRegionalManager
SamanPalithaMedagodaRegionalManager
ChamaraAselaPriyadarshanaRegionalManager
IsankaGayanRegionalManager
WasanthaKumaraMaldeniyaRegionalManager
Senior Management
GaneshalingamMathieswarannManager-MIS
LakmalManiksagaraManager-QM&BCMS
STEwARDSHIP

42 43
Alliance Finance Company PLC | Annual Report 2016/17
Overview Management Discussion & Analysis
Financial Reports Supplementary information
SujithUdaraRegionalManager
LasanthaCandappaRegionalManager
ThanubaalasingamKumarathasRegionalManager
NohanKrishanthaRegionalManager
MallikeJayathilakaRegionalManager(SeniorManager)
AsokiFerdinandsSeniorManager
ChrishanthiWavitaSeniorManager-Deposit
DillonThajudeenSeniorManager-Marketing&Deposits

44
Alliance Finance Company PLC | Annual Report 2016/17
Overview Management Discussion & Analysis
Financial Reports Supplementary information
DumindaNeranjanActingSeniorOperationManager
DharshanaSampathdeSilvaActingSeniorOperationManager
DanielSaththiyendraRegionalManager
SureshMothaHeadofRiskTeam
BuddhikaKoduthuwakkuManagerCreditFinanceRisk
KapilaBandaraActingRegionalManager
ManojPrasannaSiriwardanaSeniorManager-Marketing
ThamaraSandyaKumariRathnayakaSeniorManagerFinance
Senior ManagementSTEwARDSHIP
44 45
Alliance Finance Company PLC | Annual Report 2016/17
Overview Management Discussion & Analysis
Financial Reports Supplementary information
SelvarathnamNishanthanRegionalManager
TiranAbeysekaraOperationalManager

46
Alliance Finance Company PLC | Annual Report 2016/17
Overview Management Discussion & Analysis
Financial Reports Supplementary information
Bolstering community developmentFrom helping the unemployed find self-employment to facilitating the creation of a sustainable agro-economy through the provision of transport solutions to enabling the social well-being of our people and finally, promoting business practices that respect and enhance the well-being of the earth and the environment, our financial products and services are geared towards helping the community elevate their quality of life.

46 47
Alliance Finance Company PLC | Annual Report 2016/17
Overview Management Discussion & Analysis
Financial Reports Supplementary information

48
Alliance Finance Company PLC | Annual Report 2016/17
Overview Management Discussion & Analysis
Financial Reports Supplementary information
STEwARDSHIP
Corporate GovernanceSound corporate governance practices are fundamental in ensuring sustainable value creation and as an organization we are committed to upholding the highest standards of integrity, accountability and transparency. In addition to the legal requirements, the Company’s corporate governance framework embraces best practices, complies with voluntary frameworks and provides a strong foundation for managing our economic, social and environmental risks. Our corporate governance framework is based on the following internal and external steering instruments;
External instruments Internal standards and principles Governance mechanisms
Companies Act No. 07 of 2007 Articles of Association
IT governance
Investor relations
Talent management
Risk management
and compliance
Stakeholder engagement
Risk management
and compliance
Finance Business Act No.42 of 2011 Board and Sub-Committees Charter
Finance Leasing Act No. 56 of 2000 Code of EthicsAll directions for licensed finance companies issued by the Central Bank of Sri Lanka including the Corporate Governance Direction No. 3 of 2008
Code of Conduct
Continuing listing requirements of the Colombo Stock Exchange
Integrated Risk Management Framework
Mortgage Act No. 6 of 1949 Board approved policy framework
G4 Standards for Sustainability Reporting issued by the Global Reporting Initiative
An effective BoardThe Company’s Board comprises of Seven Directors of whom Five operate in a Non-Executive capacity, of the Five Non-Executive Directors two are independent. Full profiles of the Directors are available on pages 37 to 38 of this Report. The Board is diverse in terms of skills, experience and industry exposure thereby leading to constructive debate and discussion on key aspects enhancing the overall effectiveness of the Company. The Board is supported by four sub committees in discharging of its duties, as graphically illustrated below. The composition, responsibilities and activities of the Committees during the year given on page 123 to 130 of this Report.
We are committed to upholding the highest standards of integrity, accountability and transparency.

48 49
Alliance Finance Company PLC | Annual Report 2016/17
Overview Management Discussion & Analysis
Financial Reports Supplementary information
regular meetings The Board convenes regularly and met 12 times in 2016/17. A calendar of all meetings is drawn up to ensure maximum participation at meetings and the notices of all Board meetings are given at least seven days prior to the holding of the meeting, thereby ensuring adequate time for Members to prepare. Meeting agendas and Board papers are circulated to all Board Members prior to the meeting. Attendance at Board meetings is given on page 130 of this Annual Report. Directors are supplied with comprehensive and timely information that is required to discharge their duties effectively. Quantitative and qualitative information which includes performance against objectives, stakeholder relationships, progress on achieving strategic objectives and risk indicators are furnished to all Directors prior to Board/Sub-Committee meetings
Chairman and managing directorIn line with best practice, the role of Chairman and MD has been separated to ensure appropriate balance of power and authority. The Chairman is a Non-Executive Director whilst the MD functions as an Executive Director. There is no financial, business, personal or other relevant material relationship between the Chairman and the MD.
Accountability and AuditThe Board holds apex responsibility in presenting a balanced and accurate assessment of the Company’s financial position, performance and prospects. Interim performance reports are circulated to the CSE within 45 days of each quarter end whilst other price sensitive information is disclosed in accordance with the reporting requirements prescribed by the Colombo Stock Exchange and the Central Bank of Sri Lanka. The Company’s financial statements are prepared in accordance with the Sri Lanka Financial Reporting Standards laid down by the Institute of Chartered Accountants of Sri Lanka. Furthermore, the Company’s Annual Report conforms to the G4 guidelines on sustainability reporting, prescribed by the Global Reporting Initiative and the Integrated Reporting Framework published by the International Integrated Reporting Council. Director’s responsibility with regards to financial statements is given on page 128 of this Annual Report.
An effective Board
Managing Director
Chief Operating
Officer
Corporate Management
Board of Directors
Shareholders Board Audit Committee
Board Remuneration Committee
Board Risk Management Committee
Related Party Transactions Committee

50
Alliance Finance Company PLC | Annual Report 2016/17
Overview Management Discussion & Analysis
Financial Reports Supplementary information
CSE Rule Ref. Status of Adherence7.10 (1)
Non Executive Directors to be at least 2 or 1/3 of the total number of Directors whichever is higher
Four Non Executive Directors on the Board of the total Board of Directors of six.
7.10 (2)
Independent Directors to be at least 2 or 1/3 of the total number of Non Executive Directors. Submission of Declaration
Two Directors are Independent of the four Non Executive Directors.
The four Non Executive Directors have furnished the required declaration.7.10(3) a
Names of Independent Directors Mr. Sunil KarunanayakeLt. Col. (Retd) A.R. Samarasinghe
7.10(3) b
The criteria of independence has been met by both Independent Directors and there are no qualifying statements. None of the Non Executive Directors have served on the Board for over 9 years.
7.10(3) c
Publish a resume of each Director on the Board. Refer page 37 and 387.10(3) d
Appointment of new Director A new Director was appointed on the Board and the necessary approvals were obtained and the required disclosures were made
STEwARDSHIP
Corporate Governance

50 51
Alliance Finance Company PLC | Annual Report 2016/17
Overview Management Discussion & Analysis
Financial Reports Supplementary information
CSE Rule Ref. Status of Adherence
7.10 (5)
remuneration Committee(a) Composition
(b) Functions
(c) Disclosures
Four Non Executive Directors of which two are independent. The Chairman is an Independent Non-Executive Director makes recommendations to the Board of proposed remuneration for Executive Directors.
Makes recommendations to the Board of proposed remuneration for Executive Directors.
Names of the Directors of the Remuneration is set out on page 268. Refer page 224 for aggregate remuneration paid to Directors and Key Management Personnel of the Company.
7.10(6)
Audit Committee(a) Composition
(b) Functions
(c) Disclosures
Comprises of two independent Non-Executive Directors. The Chairman of the Committee is a member of ICASL.
The Committee is assisted by internal and external auditors and secretaries and the functions conforming with the detailed outline given in the CBSL guidelines and CSE guidelines.
Refer page 36 for the names of Directors. The Audit Committee Report appears on page 129.

52
Alliance Finance Company PLC | Annual Report 2016/17
Overview Management Discussion & Analysis
Financial Reports Supplementary information
CBSl Corporate governance ComplianceDescription and paragraph reference Ref code Degree of complianceResponsibilities of the Board - paragraph 2
Approving business strategy, strategic direction for 3 years, risk policy and management with measurable goals for at least three years and communication thereof
2 (1) a & b Complied
Identification and management of risk prudently. 2 (1) c CompliedApproving a process of communication with all stakeholders. 2 (1) d CompliedReview adequacy and the integrity of internal control systems and MIS 2 (1) e CompliedIdentification and designation of key management personnel 2 (1) f CompliedDefining areas of authority and key responsibilities for the board and key management 2 (1) g CompliedEnsuring that key management personnel oversee the affairs appropriately. 2 (1) h CompliedAssessing effectiveness of governance practices including nomination/ selection of Directors & key management, managing conflict of interests, determining weaknesses and effecting changes
2 (1) i Complied
Periodically assessing the effectiveness of the governance practices ensuring that there is a succession plan for key management personnel.
2 (1) j Complied
Meeting regularly with key management personnel to review policies, establish lines of communication and monitor progress. 2 (1) k CompliedUnderstanding the regulatory environment 2 (1) l CompliedExercising due diligence in hiring and oversight of external auditors. 2 (1) m CompliedBoard shall define and approve the functions of chairman and chief executive officer (Managing Director functions as CEO) 2 (2) CompliedProcedure to enable the directors to seek independent professional advice upon reasonable request. 2 (3) CompliedDirector shall abstain from voting on any Board Resolution where he is interested 2 (4) CompliedBoard shall have a formal schedule of matters reserved to it and ensure that direction and control is under its authority 2 (5) Not ApplicableFinance Company being unable to meet its obligations or is about to become insolvent if applicable to make public disclosure 2 (6) CompliedBoard shall include in Annual Report a corporate governance report setting out compliance with this Direction 2 (7) CompliedBoard shall adopt a scheme of Self-assessment to be undertaken by each Director annually and maintain such records. 2 (8) Complied
STEwARDSHIP
Corporate Governance

52 53
Alliance Finance Company PLC | Annual Report 2016/17
Overview Management Discussion & Analysis
Financial Reports Supplementary information
Description and paragraph reference Ref code Degree of compliance
Meetings of the board - Paragraph 3
Board shall meet twelve times in a financial year. 3 (1) CompliedArrangements for the Directors to add agenda items pertaining to the promotion of business and the management of risks. 3 (2) Complied. Agenda is
circulated in advance permitting time for changes.
At least seven days notice for the regular board meetings and reasonable notice for other meetings. 3 (3) CompliedA Director shall attend at least 2/3 of the meetings and shall cease to be a Director if he/she has not attended the immediately preceding three consecutive meetings
3 (4) Complied
Appointment of Company Secretary to handle statutory, regulatory and secretarial services. 3 (5) CompliedPreparation of the agenda for a board meeting by Company Secretary. 3 (6) CompliedDirectors’ access to advice and services of the Company Secretary. 3 (7) CompliedMaintenance of minutes of board meetings by the Company Secretary and make it available for inspection by any Director. 3 (8) CompliedRecording of the minutes of board meetings with sufficient detail to gather whether the board acted with due care and prudence in performing its duties
3 (9) Complied
Composition of the Board- Paragraph 4
Directors on board shall not be less than 5 and not more than 13 4 (1) CompliedPeriod of service of a Director other than an Executive Director shall not exceed nine years. 4 (2) CompliedNumber of Executive Directors shall not exceed one-half of the number of directors on the Board. 4 (3) Complied. Of the six
members on the Board four are Non Executive Directors
The Number of independent Non-Executive Directors of the Board shall be at least one fourth of the total number of Directors.
4 (4) Complied. Two Directors are Independent Non-Executive.

54
Alliance Finance Company PLC | Annual Report 2016/17
Overview Management Discussion & Analysis
Financial Reports Supplementary information
Description and paragraph reference Ref code Degree of compliance
Alternate Director 4 (5) There are no Alternate Directors
Non-Executive Directors shall have necessary skills and experience on strategy, performance and resources. 4 (6) Complied
Quorums for Board meeting one half are Non Executive Directors. 4 (7) Complied
The independent Non-Executive Directors shall be expressly identified in all corporate communications and in the annual corporate governance report.
4 (8) Complied
A formal and transparent procedure for the appointment of new Directors and for their orderly succession. 4 (9) Complied
All Directors appointed during the year retire at the Annual General Meeting following the appointment. 4 (10) Complied
If a Director resigns or is removed from office the Board shall announce to the shareholders and notify the Director of the Department of Supervision of Non-Bank Financial Institutions.
4 (11) Complied
Criteria to assess the ftness and propriety of directors - Paragraph 5
A person over the age of 70 years shall not be a Director. 5 (1) Complied
A Director shall not hold office as a Director or other equivalent position in more than 20 Companies/ Societies/ body corporate nor in 10 specified business entities.
5 (2) Complied
Delegation of functions – Paragraph 6
Board shall not delegate any matters to anyone so as to significantly hinder or reduce the ability of the Board to discharge its functions.
6 (1) Complied
Board shall review the delegation process periodically 6 (2) Complied
The Chairman and the Chief Executive Officer – Paragraph 7
Separation of the roles of Chairman and Chief Executive Officer/ Managing Director 7 (1) Complied
The Chairman shall be an independent Non-Executive Director. 7 (2) Complied
Disclosures in the Annual Corporate Governance Report the relevant details of the Chairman and Chief Executive Officer (Managing Director)
7 (3) Complied
Chairman shall provide leadership to the Board, ensure effective discharge of responsibilities and all issues are discussed in a timely manner.
7 (4) Complied
STEwARDSHIP
Corporate Governance

54 55
Alliance Finance Company PLC | Annual Report 2016/17
Overview Management Discussion & Analysis
Financial Reports Supplementary information
Description and paragraph reference Ref code Degree of compliance
Responsibility of the Chairman for either the preparation or delegating the preparation of agenda to the Company Secretary. 7 (5) Complied
The information to be disseminated to the Directors prior to the Board meetings 7 (6) Complied
Chairman shall encourage Directors to make a full and active contribution and ensure that the Board acts in the best interest of the Company.
7 (7) Complied
Chairman shall facilitate effective contribution by Non-Executive Directors and constructive relationships among Directors 7 (8) Complied
Chairman shall not engage in direct supervision of key management personnel or any other executive duties. 7 (9) Complied
Chairman shall ensure that appropriate steps are taken for the effective communication with Shareholders and the views of the Shareholders are communicated to the Board
7 (10) Complied
The Chief Executive Officer (MD) shall function as the Apex Executive in charge of the finance company’s day to day management of operations and business
7 (11) Complied
Board Appointed Committees –Paragraph 8
Company shall have at least two Board Committees (Audit & Risk) reporting directly to the Board. 8 (1) CompliedAudit Committee 8 (2)
Chairman shall be a Non- Executive Director with an accounting qualification 8 (2) a Complied. Mr. Sunil Karunanayake - FCMA (UK), FCA
Members shall be Non- Executive Directors. 8 (2) b CompliedShall make recommendations about the appointment of Auditors, service period, audit fee, period of an engagement of an audit partner and the application of accounting standards.
8 (2) c Complied
Review the effectiveness of audit process and monitor the External Auditors’ independence and objectivity. 8 (2) d Complied.Management letter is directed to the Board.
Develop a policy for non audit work 8 (2) e Complied. Non audit assignments were not given to external auditors.

56
Alliance Finance Company PLC | Annual Report 2016/17
Overview Management Discussion & Analysis
Financial Reports Supplementary information
Description and paragraph reference Ref code Degree of compliance
Shall have authority to set the scope for the annual audit and assess the compliance, preparation of the financials in accordance with accounting principles
8 (2) f Complied
Review the financial statements of the Company and ensure integrity of the annual report and financials prepared focus on major judgmental areas, changes in accounting policies and practices, significant adjustments arising from audit, going concern assumption, compliance with relevant accounting and legal requirements
8 (2) g Complied
To discuss matters relating to the interim and annual audits 8 (2) h CompliedReview the Management Letter 8 (2) i CompliedInternal Audit Function 8 (2) j & o Complied. Covered in
a separate report
To meet with the External Auditors once in 6 months 8 (2) l CompliedAnnual Report to disclose activities of the Audit Committee, Audit Committee meetings and attendance of each individual member.
8 (2) m & p Complied
The Secretary shall record and keep detailed minutes. 8 (2) n CompliedReview arrangements for employees to raise concerns in confidence about financial reporting and internal control and ensure fair and independent investigation and appropriate follow up action.
8 (2) q Complied
Risk Management Committee 8 (3)
Consists of one Non-Executive Directors, MD and Key management personnel. 8 (3) a CompliedAssess all risks on a monthly basis using risk indicators and MIS. 8 (3) b CompliedReview adequacy and effectiveness of all management committees and the management of risks. 8 (3) c Complied
The actions to mitigate the effects of specific risks if such risks are beyond the internal policy or regulatory limits. 8 (3) d Complied
Shall meet at least quarterly to assess risk management and BCP. 8 (3) e CompliedSubmit risk assessment report within a week of each meeting for the board’s review and specific directions. 8 (3) g CompliedEstablish compliance function with a Compliance Officer to report about compliance with laws, rules, regulations & directions etc. 8 (3) h CompliedRelated party transactions – Paragraph 9
Board shall avoid any conflict of interest from any transaction with any person and particularly with persons considered as related parties.
9 (2) Complied
Board shall ensure that the Company does not engage in transactions which would grant a related party “more favourable treatment” than is accorded to other constituents.
9 (4) Complied
STEwARDSHIP
Corporate Governance

56 57
Alliance Finance Company PLC | Annual Report 2016/17
Overview Management Discussion & Analysis
Financial Reports Supplementary information
Description and paragraph reference Ref code Degree of compliance
Disclosures - Paragraph 10
A statement to the effect that audited financial statements are prepared in line with applicable accounting standards and regulatory requirements.
10 (2) a Complied
A report by the Board that the financial reporting system has been designed to provide a reasonable assurance regarding the reliability and the preparation of financial statements is in accordance with the relevant accounting standards and regulatory requirements.
10 (2) b Complied
External Auditor’s Certification on the effectiveness of the Internal Control Statement 10 (2) c Complied
Details of the Directors including names, transactions with the company. 10 (2) d Complied
Fees and remuneration paid by the Company to the Directors in aggregate. 10 (2) e Complied
Net accommodation outstanding in respect of each category of related parties and net accommodation outstanding as a percentage of the finance company’s capital funds.
10 (2) f Complied
Aggregate values of remuneration paid and transactions with its key management set out by Broad categories such as remuneration paid, accommodation granted and deposits or investments.
10 (2) g Complied
A report setting out details of compliance with prudential requirements, regulation, laws, internal controls and measures to rectify non-compliances, if any.
10 (2) h Complied. Directors, Auditors, internal control, Audit and Risk Committees and governance reports form part of this requirement.
The External Auditors Certification of Compliance with the Act, rules and directions issued by the Monetary Board 10 (2) j Complied
Our External Auditors certify that the disclosures and related content in the Corporate Governance Report is consistent with the Corporate Governance Direction No. 3 of 2008 issued by the Central Bank of Sri Lanka.
(Sgd.)Alliance Management Services (Pvt) Ltd.Secretaries30th May, 2017

58
Alliance Finance Company PLC | Annual Report 2016/17
Overview Management Discussion & Analysis
Financial Reports Supplementary information
Uplifting the fisheries sector
We are committed to supporting financial inclusion and spearheading social upliftment across the board. The fisheries sector is one particular industry that we pay special attention to. Among our myriad offerings are leasing, loan and saving solutions tailor-made to elevate the quality of lives of workers in the fisheries’ sector and facilitate a stable and promising future for them.

58 59
Alliance Finance Company PLC | Annual Report 2016/17
Overview Management Discussion & Analysis
Financial Reports Supplementary information
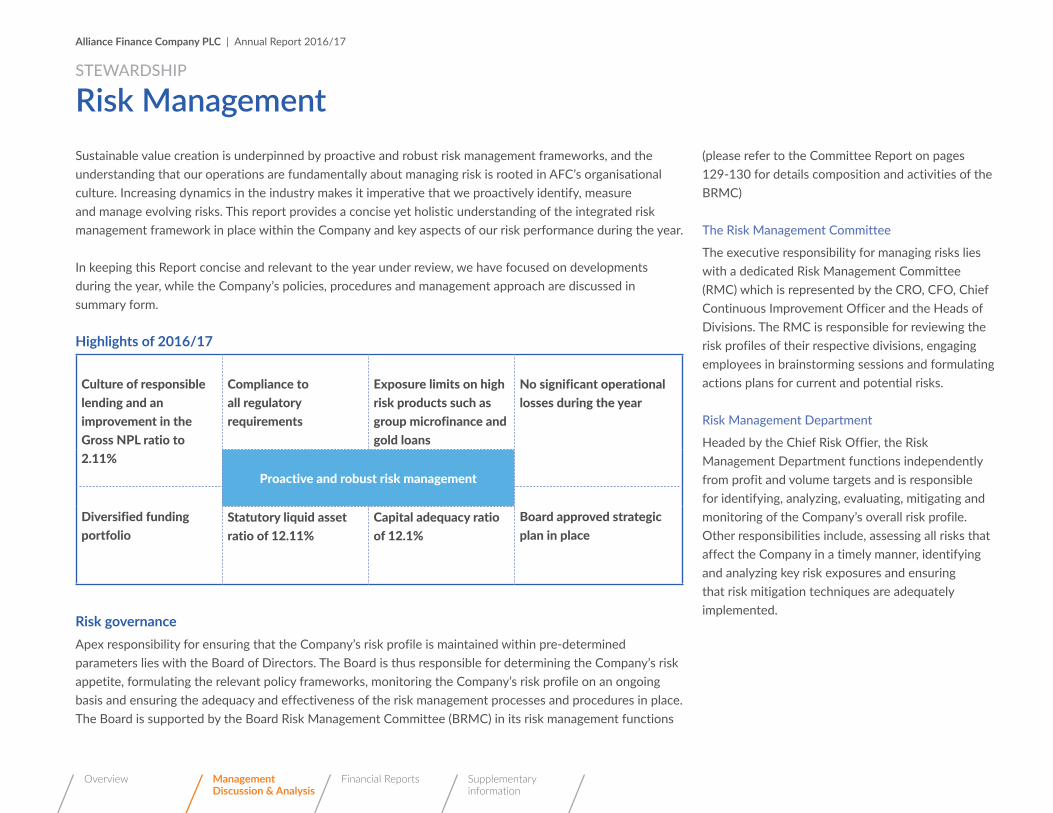
60
Alliance Finance Company PLC | Annual Report 2016/17
Overview Management Discussion & Analysis
Financial Reports Supplementary information
Sustainable value creation is underpinned by proactive and robust risk management frameworks, and the understanding that our operations are fundamentally about managing risk is rooted in AFC’s organisational culture. Increasing dynamics in the industry makes it imperative that we proactively identify, measure and manage evolving risks. This report provides a concise yet holistic understanding of the integrated risk management framework in place within the Company and key aspects of our risk performance during the year.
In keeping this Report concise and relevant to the year under review, we have focused on developments during the year, while the Company’s policies, procedures and management approach are discussed in summary form.
Highlights of 2016/17
Culture of responsible lending and an improvement in the Gross NPL ratio to 2.11%
Compliance to all regulatory requirements
Exposure limits on high risk products such as group microfinance and gold loans
No significant operational losses during the year
Proactive and robust risk management
Diversified funding portfolio
Board approved strategic plan in place
Statutory liquid asset ratio of 12.11%
Capital adequacy ratio of 12.1%
risk governanceApex responsibility for ensuring that the Company’s risk profile is maintained within pre-determined parameters lies with the Board of Directors. The Board is thus responsible for determining the Company’s risk appetite, formulating the relevant policy frameworks, monitoring the Company’s risk profile on an ongoing basis and ensuring the adequacy and effectiveness of the risk management processes and procedures in place. The Board is supported by the Board Risk Management Committee (BRMC) in its risk management functions
Risk Management(please refer to the Committee Report on pages 129-130 for details composition and activities of the BRMC)
The Risk Management Committee
The executive responsibility for managing risks lies with a dedicated Risk Management Committee (RMC) which is represented by the CRO, CFO, Chief Continuous Improvement Officer and the Heads of Divisions. The RMC is responsible for reviewing the risk profiles of their respective divisions, engaging employees in brainstorming sessions and formulating actions plans for current and potential risks.
Risk Management Department
Headed by the Chief Risk Offier, the Risk Management Department functions independently from profit and volume targets and is responsible for identifying, analyzing, evaluating, mitigating and monitoring of the Company’s overall risk profile. Other responsibilities include, assessing all risks that affect the Company in a timely manner, identifying and analyzing key risk exposures and ensuring that risk mitigation techniques are adequately implemented.
STEwARDSHIP

60 61
Alliance Finance Company PLC | Annual Report 2016/17
Overview Management Discussion & Analysis
Financial Reports Supplementary information
Audit Committee
Internal Audit
Board of directors
managing director
Chief Risk Officer
risk management unit
Credit Committee
Credit risk
Asset and liability Management committee
liquidity risk market risk
It Steering Committee
It risk Reputational Risk
CSr Committee
Operational Risk
Board risk management Committee
Compliance unit

62
Alliance Finance Company PLC | Annual Report 2016/17
Overview Management Discussion & Analysis
Financial Reports Supplementary information
risk management framework and approachAFC has implemented an Enterprise Risk Management (ERM) framework which underpins the foundation for managing risk and clearly defines the standards, tools and activities required to identify, measure, manage and report all risk exposures. A comprehensive framework of policies ensures the consistency and clarity in the identification, measurement and management of key risks. Clearly defined roles and responsibilities, both at Board and Executive Committee level ensure independence of judgement and judicious empowerment.
The goals and objectives of the ERM are as follows;• To provide a policy and organisational structure
for risk management
• To define risk management roles and responsibilities within AFC and outline procedures to mitigate risks
• To ensure consistent and acceptable management of risks throughout the business
• To define a reporting framework to ensure effective communication
• To constantly adapt to the changing risk management needs of AFC while maintaining control of the overall risk position
• To detail the approved methods for risk assessment
• To implement a system that ensures that risk management information is captured, monitored and reported efficiently
the three lines of defense modelThe Company’s risk management framework is based on the globally accepted three lines of defense model, which ensures the clear segregation of duties as well as transparency and accountability in risk management.
First line of defense• The identification,
management and reporting of risks at business unit level, ensuring that specific risks are managed at the source as effectively as possible
• Responsibility of the Divisional Heads and Risk Coordinators
Third line of defense• Provides independent
and objective assurance on the risk exposures, processes and practices in place.
• Responsibility of the Board of Directors, Audit Committee, Internal Audit and External Audit functions
Second line of defense• Centralised oversight of
the first line of defense by the RMC
Risk ManagementSTEwARDSHIP

62 63
Alliance Finance Company PLC | Annual Report 2016/17
Overview Management Discussion & Analysis
Financial Reports Supplementary information
members
risk
risk score Card,Risk Meeting Minutes
risk Sheet
monthly,Quarterly,Annually
Quarterly,monthly
monthly,When required
Appropriate members of Board of directors
Executive Level Members / All Heads of divisions
Risk Management Committee 2nd line of defense
divisional level risk Coordinator
Board Risk Committee3rd line of defense
daily risk management1st line of defense
Meeting Frequency related document
RISK STRUCTURE & LINE OF DEFENSE
risk management Process
establish the context
risk identification risk analysis evaluate and
prioritise riskmanage and
report
Risk context: This comprises setting the risk context against the backdrop of the operating environment, the Company’s strategic priorities and the emerging internal and external trends.
Risk identification: Potential risks are identified at business unit level at least on an annual basis through various risk identification methods.
Risk analysis
A range of quantitative and qualitative tools are used to measure the impact of the identified risk exposures. These methods include analytical review, scenario and what-if analysis, stress testing, inquiry and confirmation among others. Risk Analysis is also conducted at Business Unit level and verified by the Risk Management Division.
Evaluate and prioritise risk
All identified risks are analysed for their potential impact and likelihood. Accountability is assigned to the person who is best able to make appropriate decisions depending on the individual’s level of competence, authority, responsibility and available resources to manage the risk in question
Manage and report:
Structured risk reporting processes ensure that the Board and the BRMC is kept updated on the Company’s risk profile on a continuous basis. Additionally, the Risk Management division also compiles various risk evaluation reports for the decision making process. Further, the compliance report is submitted to the Board on a quarterly basis.

64
Alliance Finance Company PLC | Annual Report 2016/17
Overview Management Discussion & Analysis
Financial Reports Supplementary information
risk universeThe Company’s operations give rise to a range of risk exposures comprising those that can directly be managed by the Company and risks which are typically beyond the Company’s control. These risks are monitored to assess the potential impact on capital. The Company’s key risk exposures can be categorized as follows;
Risk UniverseManaged by AFC
Risk type Financial risk Other RisksRisk exposure
Credit risk Liquidity riskFunding risk
Market risk Strategic risk Reputation risk
Operational risk
Compliance Risk
Monitored by AFC to assess impact
Risk type Geopolitical Macro-economic
Regulatory
risk performance in 2016/17Credit Risk
Credit Risk is defined as the potential losses to earnings and/or capital arising from the inability of customers, clients or market counterparties to fulfil their contractual obligations to AFC. Credit Risk takes the form of default risk and concentration risk and arises primarily from the Company’s lending portfolio.
Managing Credit Risk
As the first line of defense, the responsibility for identifying credit risk lies with the respective credit functions. The identified exposures together with the measures in place to manage them are reviewed regularly by the Credit Risk Committee, a hybrid committee comprising an executive director, the AGM - Credit, COO and the CRO. The credit risk management framework is governed by a suite of robust risk policy frameworks, a culture of risk consciousness among ground level employees and stringent and well-defined credit criteria. Meanwhile, limits on disbursements, product-wise and category-wise exposures are defined in line with the Company’s overall risk appetite. Monthly reports on the Company’s credit risk exposures are provided to the Board through the BRMC.
Risk ManagementSTEwARDSHIP

64 65
Alliance Finance Company PLC | Annual Report 2016/17
Overview Management Discussion & Analysis
Financial Reports Supplementary information
• Multiple levels of approval authority
• Prudential limits for concentration risk including sectors and products
• Formalised credit criteria
• A culture of responsible lending
Pre-credit sanctioning Post-credit monitoring
• Ongoing portfolio evaluation
• Robust credit review mechanism
• Review of selected significant exposures
• Persistent monitoring of NPLs at multiple levels including branches, regions, sectors and product exposures
• Regular monitoring by Internal Audit
• Periodic reporting
Developments in 2016/17
• Streamlined collection efforts through simplifying collection targets and ratios
• Strengthened risk evaluation in the gold loan unit by investing in employee training on assessing gold and customer behaviour patterns
• Regular review and update of the credit risk policy framework, credit criteria and exposure limits
Credit risk Performance in 2016/17Default risk
Default risk is the key component of credit risk and comprises of potential losses arising from the default of a borrower or counterparty. AFC’s total loans and advances grew by 21% during the year, mainly supported by growth in SME loans, pledge loans, leasing and gold loans while group based microfinance contracted during the year. Impairment charges declined by 55% during the year, reflective of an overall improvement in portfolio quality. Despite a marginal 4% increase in gross NPLs during the year, the Company’s gross NPL ratio declined to 2.1% from 2.5% the year before. AFC’s gross NPL ratio continued to be significantly better than the industry average, which clocked in at 5.3% as at end-March 2017.
% of portfolio Gross NPL ratio (%)- 2016/17
Gross NPL ratio (%)- 2015/16
Leasing 67% 1.8 2.1Hire purchase 1% 19.4 9.6Term loans 16% 3.0 2.9Microfinance - group lending 8% 2.1 3.1Other loans 7% 1.5 1.9Gold loans 2% 0.4 0.8

66
Alliance Finance Company PLC | Annual Report 2016/17
Overview Management Discussion & Analysis
Financial Reports Supplementary information
Credit portfolio
Gross NPL ratio (%)
loan growth vs gross NPL ratio
0 0.00%
2013
2014
2015
2016
2017
5005.00%
10.00%
15.00%
20.00%
10,000
15,000
20,000
25,000
Rs.m
illio
n
Concentration riskConcentration risk arises from high lending exposure to a particular sector, product, region or customer/Company. These risks are managed through pre-defined limits against which actual exposures are monitored on an ongoing basis. The Company’s exposure to name concentration (risks arising from large exposures to specific individual borrowers) is low, given the granular nature of its portfolio. For instance, the Company’s average loan size is Rs. 202,551/- with its top 20 borrowing customers representing only 3.8% of the Company’s credit portfolio.
Strategic focus on diversifying its portfolio has enabled the Company to reduce exposure to product/sector concentration risk. Although leasing still contributes the most significant share of the portfolio, during the year leasing exposure reduced to 67% of the portfolio, compared to 68% the year before. Meanwhile, although a lucrative segment, the Company intends to limit its exposure to the relatively high-risk group based microfinance segment to 10% of its total loan portfolio.
The Company’s credit portfolio is also regionally well diversified with approximately 60% of credit and advances originating outside the Western Province. The portfolio is also well diversified in terms of sector exposure, with the largest individual sector (industry) accounting for 25% of the total lending portfolio.
Portfolio composition
0
15/16
16/17
20% 40% 60% 80% 100%
68%
71%
22%
17%
8%
10%
2%
2%
Leasing & HPGold loans
Other loansMicrofinance
Central 12%Eastern 6%North Central 5%North Western 9%Northern 7%Sabaragamuwa 8%Southern 7%Uva 6%Western 40%
Regional breakdown of lending portfolio
Agriculture & Fishing 14%Construction 2%Consumption 14%Financial Services 1%Food, Beverage & Tobacco 1%Government 0%Hotel & Tourism 1%Industry 26%Other 23%Services 4%Transport 16%
Sector wise lending portfolio
Risk ManagementSTEwARDSHIP

66 67
Alliance Finance Company PLC | Annual Report 2016/17
Overview Management Discussion & Analysis
Financial Reports Supplementary information
mArKet rISKMarket risk is the potential risk of losses in AFC’s on-balance sheet and off-balance sheet positions arising from movements in market variables. Market Risk can arise due to adverse movement in interest rates, equity market, commodity market and exchange rates.
market risk managementExecutive responsibility for overseeing the Company’s market risk exposures lies with the Asset Liability Management Committee (ALCO) and Treasury. A Board-approved policy framework which details the Company’s Risk Management policy provides guidance on the procedures, tools and techniques for identifying, evaluating, monitoring and reporting all aspects related to market risk.
Interest rate riskThe Company is exposed to interest rate risk through its deposit liabilities, lending activities as well as investments. The ALCO regularly monitors the movements in the market interest rates together with the Company’s asset liability maturity mismatches and exposures.
Commodity riskThe Company’s exposure to commodity risk arises through its gold loan portfolio, which is secured against gold jewellery. A sharp or sustained decline in gold prices could result in increased delinquencies stemming from the gold loan portfolio, as the value of the collateral could fall below the outstanding loan amount. Exposure to this risk is managed through revising loan to value ratios based on monthly gold loan prices and maintaining LTV of not more than 70%. Meanwhile, the Company’s risk appetite also defines a limit of 5% on exposure to gold loans.
equity riskAFC’s exposure to equity risk is minimal as its equity investment portfolio amounted to Rs. 198 million or 0.7% of its total assets as at end-March 2017.
exchange rate riskThe Company’s exposure to exchange rate stems mainly from its foreign funding, in which repayment amounts could vary in line with exchange rate volatilities. The Company hedges these exposures through retaining the foreign funding received in a foreign currency deposit and obtaining local currency borrowings against this balance, thereby eliminated the need for hedging. As at end-March 2017, borrowings from these foreign sources amounted to USD 15 million.
market risk performance in 2016/17The Company’s interest rate risk exposures were maintained within the pre-defined limits during the year. The net positive gap between the rate sensitive assets and liabilities amounted to 5.4% of rate sensitive assets in the short term (compared to a negative gap of 1.3% in the previous year), reflecting the inherent maturity mismatch of the Company’s assets and liabilities.
Rs. Mn Up to 3 months
3-12 months
1-5 years Over 5 years
Interest earning assets 5,003 9,273 12,462 387Interest bearing liabilities 6,354 7,151 10,998 756Gap (1,351) 2,122 1,464 (369)
During the year, gold prices increased by 7% and thereby did not have an adverse impact on the Company’s gold loan portfolio.

68
Alliance Finance Company PLC | Annual Report 2016/17
Overview Management Discussion & Analysis
Financial Reports Supplementary information
lIQuIdIty And FundIng rISKLiquidity risk is the potential loss arising from the changes in the Company’s ability to sell or dispose assets and settle liabilities in a timely manner.
Managing liquidity risk is crucial to any financial institution given the inherent maturity mismatch between its assets and liabilities. Sudden liquidity crises could result in irreversible reputational damage and affect the continuity of operations. The Company’s liquidity risk management framework ensures that the Company maintains adequate funds to meet its contractual obligations on a timely basis. The Treasury is responsible for ensuring that the Company holds sufficient liquid assets to meet its immediate and unforeseen liabilities. Effective management of the liquidity risk is also supported by the following;
• Diversified funding strategy with liquidity sourced from multiple sources
• Maintaining a portfolio of highly liquid assets
• Consistent monitoring of the Company’s liquidity position to ensure compliance to internal targets and regulatory requirements
During the year, the Company maintained its liquidity levels well within the stipulated minimum limits.
Meanwhile, the Company also maintains a diverse funding portfolio with deposits accounting for just 45% of total funding. Increasing contributions from
foreign funding agencies (in the form of borrowings) have enabled the Company to curtail exposure to liquidity risk arising from potential confidence crises in the industry etc.
Meanwhile, the Company’s capitalisation levels are healthy and improved during the year following the receipt of the foreign funding line. Accordingly, AFC’s Core capital adequacy ratio improved to 10.4% (2016: 10.2%) while the total capital ratio reduced to 12.1% from 13.5% the year before, due to redeemed subordinated debentures.
Statutory liquid asset ratio: 12.11%Liquid assets as a % of total assets: 8.99%
Deposits 36%Shareholders’ Funds 14%Borrowings 50%
Funding Mix 2016/17
OPerAtIOnAl rISKOperational risk is defined as the direct or indirect loss resulting from inadequate or failed internal processes, people and systems or from external events.
At AFC, operational risk is managed through,• Implementation of a comprehensive business
continuity plan to minimise interruptions to operations in the event of systems and process failures
• People related risks are managed through maintaining a strong employee value proposition, which has enabled us to attract and retain the industry’s top talent. Employee behaviour is governed by a Code of Conduct, comprehensive policy frameworks and clearly defined governance structures
• Robust IT infrastructure
IT Risk is a key component of operational risk and comprises potential losses to earnings, reputation and/or customers arising from system/IT failures.
The Company’s exposure to IT risks are managed through,• Investing in robust IT infrastructure- during
the year we upgraded to our system to a blade infrastructure enabling more reliability, efficiency and security of our information. We also operate a fully-fledged disaster recovery site in Rajagiriya.
Risk ManagementSTEwARDSHIP

68 69
Alliance Finance Company PLC | Annual Report 2016/17
Overview Management Discussion & Analysis
Financial Reports Supplementary information
• Dedicated IT team responsible for ensuring that technology related risks are identified and managed proactively.
• The IT infrastructure is secured by “Techcert” to identify potential security threats to the system
Internal Audit Operational risk is also managed through a proactive Internal Audit function, which reports directly to the Audit Committee. For RFC, Internal Audit carries out six audits per month ensuring that the internal controls in place are sufficient in managing emerging risks. For microfinance, we have engaged nine regional officers who are responsible for carrying out five audits per week. Given the high risk nature of the group based microfinance business, a sub-Audit Committee is in place for microfinance to ensure that the internal audit recommendations are implemented. Any identified operational breach is directed to the operational management team for follow-up and action.
During the year under review, there were no significant losses arising from operational risks.
Strategic riskStrategic risks are the potential losses arising from the possibility of the Company’s future business plans and strategies being inadequate.
AFC’s strategic risk is managed through,• Implementation of a Board approved strategic
plan which takes cognisance of industry trends, stakeholder needs and the strength and weaknesses of our value creation model
• Continuous monitoring of industry trends including market dynamics, macro-economic changes and competitor behaviour.
• Reviewing performance of the strategic plan against pre-defined performance indicators on a consistent basis
• Conducting variance analysis by comparing budgeted against actual performance and recommending appropriate strategies.
• Reviewing industry trends and competitor behavior
reputational riskReputational risks are those that impact the Company’s current or prospective earnings capacity and organisational value arising from the loss of confidence, breakdown in relationships and negative perceptions of transactional stakeholders.
The Company’s exposure to reputational risk is managed through,• Strategic agenda and approach to value creation
underpinned by the triple bottom line principles
• Dedicated Director of Sustainability to identify and mitigate any emerging sustainability issues
• Strong brand reputation and established track record
• Application of the IFC exclusion list in lending
• Sound corporate governance and risk management practices

70
Alliance Finance Company PLC | Annual Report 2016/17
Overview Management Discussion & Analysis
Financial Reports Supplementary information
Ushering in an eco-conscious era
Environmental sustainability is a priority of ours that goes beyond simply engaging in activities that efficiently manage the consumption of energy and other non-renewable resources. Whilst enabling financial inclusion and equitable wealth creation outside the Western Province, we are dedicated to building a truly sustainable Triple Bottom Line business.

70 71
Alliance Finance Company PLC | Annual Report 2016/17
Overview Management Discussion & Analysis
Financial Reports Supplementary information

72
Alliance Finance Company PLC | Annual Report 2016/17
Overview Management Discussion & Analysis
Financial Reports Supplementary information
The economic and industry review section of this report focuses on understanding the emerging trends, opportunities and threats in our economic and business environments. The Report is structured as follows;
review of Industry drivers
economic review
Economic GrowthInterest ratesInflationExternal trade activity
Industry PerformanceBudget 2017Private Sector CreditLeasing and Hire purchaseMicrofinance SME
ProfitabilityAsset GrowthAsset EfficiencyLoan growthInfrastructureLiabilities
economic growthSigns of recovering growth were witnessed across most regions in the backdrop of growing global demand and better investor sentiments. Rebound in Investments, trade and manufacturing activity coupled with an improvement in investor confidence, resulted in improving overall growth prospects, compared to the somewhat subdued growth in 2015. As per the IMF, global growth is expected at 3.5% in 2017 compared to 3.1%1 in 2016. Advanced economies driven by US,UK and Europe are expected to grow at 2.0% in 2017 compared to 1.7% in 2016. Growth in emerging markets are expected to be more fast paced at 4.5% in 2017 compared to 4.1% in 2016. South Asia and commodity exporters such as Russia are expected to be among the high growth areas driving emerging markets despite challenging country-specific factors such as demonetization in India and financial sector risks that were persistent in 2016.
IMF April 2017 issue and World Bank (South Asia Economic focus _ April 2017)
economic growthGDP growth was moderate at 4.4% in 2016 due to declining agricultural output impacted by adverse weather conditions. However, growth in trade, construction, manufacturing and banking services supported the overall growth to be maintained above 4%. Financial services grew at 17% YoY in 2016, higher than any other sectoral growth.
OUR PERFORMAnCE
Economic and Industry Review

72 73
Alliance Finance Company PLC | Annual Report 2016/17
Overview Management Discussion & Analysis
Financial Reports Supplementary information
Economic Growth - Global
0.00
2015
2016
2017
2018
2.00
4.00
6.00
8.00%
Global
Advanced Economies
Emerging and Developing markets
Emerging and developing Asia
Real GDP growth
Growth in financial and insurance services
Economic Growth Sri lanka
0 0%
2013
2014
2015
2016
2017
2 5%
10%
15%
20%
25%
30%
4
6
8
10%

74
Alliance Finance Company PLC | Annual Report 2016/17
Overview Management Discussion & Analysis
Financial Reports Supplementary information
Interest ratesInterest rates have increased substantially since the US elections in November 2016 due to expected inflationary pressures from higher global demand and a less accommodative US monetary policy. The US Federal Reserve increased interest rates twice in late 2016 and early 2017 and IMF expects two more rate hikes by end 2017 or early 2018. The spillover effects of US rate hikes and other political uncertainties resulted in a rise in interest rates across many key economies such as Europe, UK, Germany and Japan.
US 10 year treasury bill
0.00
2015
-05-
26
2015
-01-
2620
15-0
2-26
2015
-04-
2620
15-0
3-26
2015
-12-
26
2015
-10-
2620
15-1
1-26
2015
-09-
2620
15-0
8-26
2015
-07-
2620
15-0
6-26
2015
-07-
2620
15-0
6-26
2015
-05-
26
2015
-10-
26
2015
-12-
2620
15-0
1-26
2015
-08-
2620
15-0
9-26
2015
-11-
26
2015
-02-
2620
15-0
3-26
2015
-04-
26
0.50
1.00
1.50
2.00
2.50
3.00
Interest ratesA visible change in the interest rate policy of the government was seen in 2016 with two interest rate hikes in 2016 and a hike in March 2017. Monetary policy was tightened with the objective of curtailing inflationary pressures and supporting the balance of payments. Resultantly, both lending and deposit rates in the market increased.
1-year T-bill rate AWFDR AWLR
Interest rates
0
Jan
- 16
Feb
- 16
Mar
- 16
Apr -
16
May
- 16
Jun
- 16
Jul -
16
Aug
- 16
Sep
- 16
Oct
- 16
Nov
- 16
Dec
- 16
2
4
6
8
10
12
14%
OUR PERFORMAnCE
Economic and Industry Review

74 75
Alliance Finance Company PLC | Annual Report 2016/17
Overview Management Discussion & Analysis
Financial Reports Supplementary information
InflationGlobal inflation levels have been increasing in 2016 driven by an increase in commodity prices against the backdrop of a rise in global oil prices. Inflationary pressure was more significant in advanced economies than emerging economies.
InflationThe higher interest rate scenario, together with an increase in commodity prices and energy costs resulted in inflation gradually picking up towards the latter part of 2016. Severe drought conditions and increasing indirect taxes resulted in an increase in overall inflation levels. Current year on year inflation measured by NCPI stands at 8.6% in March 2017 compared to 2.2% in March 2016.
trade growthGlobal Trade in 2016 grew by 2.2% YoY in volume terms, marked to be the slowest pace since 2009. However, increasing demand and investment activity in emerging economies signaled a recovery by the second half of 2016. IMF estimates trade growth to improve to 4% by 2017-18.
trade growthExport growth slowed in 2016 due to declining export volumes of textiles and tea especially to key export regions such as US on lackluster global demand. However, the rupee depreciation against USD, enabled exports to grow in value terms by 5% YoY in 2016. Imports increased at 10% YoY in 2016 driven by growth in intermediate and investment goods despite a decline in imports of consumer goods.

76
Alliance Finance Company PLC | Annual Report 2016/17
Overview Management Discussion & Analysis
Financial Reports Supplementary information
review of Industry driversGovernment Policies impacting licensed Finance Companies (lFCs)
Interest rates: the Government has set limits on the interest rates offered of deposits by finance companies, which is linked to the 1 year Treasury Bill rates.
Minimum capital requirements: an increase in minimum capital requirements for leasing and finance companies are expected to materialize in 2017 promoting consolidation within the segment.
Policies impacting the leasing sector based on Budget 2017 • Changing Loan to value ratios from current 70%
to varying limits by vehicle type. Three Wheelers 25%, Motor Cars and Vans 50% and Commercial Vehicles (Lorries and Heavy Vehicles) 90%. The three wheeler and motor segment was most affected.
• A change in the vehicle valuation method on imports that determine the applicable taxes. The vehicle value will be determined by the Director General of Customs.
• Improving the debt recovery process of licensed finance companies by applying the Debt Recovery (Special) Provisions Act No. 2 of 1990 to all finance companies
• Financial Asset Management Agency (FAMA), to restructure the distressed finance companies
Credit to private sector
Tightened monetary policies and curtailed import growth impacted private consumption and vehicle imports particularly during the latter half of 2016.The NBFI sector accounts for 17% of total private sector credit and during the year, credit from the sector increased by 17%. Most sector players pursued portfolio diversification during the year, venturing into both microfinance and SME lending. leasing and hire purchaseFollowing a period of significant growth, vehicle registrations and leasing activity slowed in 2016. Vehicle registrations declined by 26% YoY in 2016 due to limits on Loan to Value ratios, increasing interest rates, change in vehicle valuation method and higher import taxes. Three-wheelers and motor cars segments were most affected.
Growth (YoY) 2014 2015 2016
New registrations 32% 56% (26%)Three wheelers -6% 64% (56%)Motor cars 37% 172% (57%)Motor cycles 61% 36% (8%)
OUR PERFORMAnCE
Leasing 47.4%
Hire Purchase 4.6%
Loans 44.9%
Real Estate 0.2%
Pawning Advances 3.0%
Composition of Loans lFC Sector
Economic and Industry Review
Leasing
Hire purchase
leasing and Hire purchase of lFC
0
Mar
- 14
Mar
- 15
Mar
- 16
Dec
- 16
100,000
200,000
300,000
400,000
500,000
(Rs. Mn)

76 77
Alliance Finance Company PLC | Annual Report 2016/17
Overview Management Discussion & Analysis
Financial Reports Supplementary information
Sme and microfinanceA segment which is poised for strong growth, the SME and Microfinance markets presents numerous opportunities for portfolio diversification. Microfinance is considered a high-risk, high-return product segment and presents multiple opportunities for growth given government impetus towards strengthening regional financial inclusion. Growth in manufacturing and services sectors have resulted in an increasing demand for SME loans with 80% of current establishments being SME in nature. Further support, for SME sector was driven by government initiatives in addition to projects undertaken by World Bank to support SME growth. Loan growth in LFCs increased by 38% YoY in 2016 on the backdrop of higher loan demand by the SME segment in both industrial and service sectors. Despite intensified competition in the SME segment, LFCs have the potential to reach a larger number of entrepreneurs especially in rural areas whilst also leveraging on higher risk appetite in comparison to banks and more responsible lending practices in comparison to the informal sector.
Industry Performance LFCs are a vital component of the country’s financial system, catering to a segment that often falls beyond the risk appetite of the banking sector. LFCs currently account for 7.2% of total financial sector assets with 46 players operating an island-wide network of 1,225 branches.
AssetsAssets of LFCs grew by 21.5% YoY in during the 9 months ended Dec 2016 to RS. 1,112 Bn driven by 38% YoY growth in loan portfolios accounting for 79% of LFC assets. Term loans, revolving loans, microfinance, factoring and draft loans contributed to 73% of loan growth. Hire purchase activity remained resilient declining by (42%) YoY by December 2016 due to declining imports of consumer goods. .
Branch networkA growing branch network distributed across many regions increased the reachability of finance companies to small and medium scale entrepreneurs. The sector added 97 new branches during the year
to its network, bringing the total count to 1,225 branches as at end-December 2016.
Asset qualityAsset quality improved during the year despite relatively aggressive loan expansion. The growth in Gross NPLs of RS. 5.6Bn in 2016 is insignificant compared to loan growth. Thus, Gross NPL ratios declined to 5.6% over the 9 months ended December 2016 compared to 6% in 9 months ended December 2015. Meanwhile, net NPL ratio also declined to 1.2% from 1.6% the year before. Screening of customers and sound debt collection procedures contributed to the NPL decline in addition to absolute growth in loans.
Mar-14
Mar-15
Mar-16
Dec-16
Assets Growth
0
Asse
ts
Loan
s
500,000
1,000,000
1,500,000(Rs. Mn)
new Branches in 2016
0
Cen
tral
East
ern
Nor
th C
entr
al
Nor
th W
este
rn
Nor
ther
n
Saba
raga
muw
a
Sout
hern
Uva
Wes
tern
5
10
15
20
25
35
30

78
Alliance Finance Company PLC | Annual Report 2016/17
Overview Management Discussion & Analysis
Financial Reports Supplementary information
liabilities
Liabilities increased by 21% during the first 9 months ended December 2016 with a higher contribution from growth in borrowings than deposits. A gradual shift from reliance on deposits to borrowing was seen over the last two years. Borrowings predominantly from banking and finance sector, increased by 42% YoY over 9 months to December 2016 and accounted for 34% of sector liabilities. Deposits grew at a slower pace by 10% over 9 months to December 2016 and accounted for 47% of LFC funding driven by growth in time deposits.
Sector liability Growth
0
Mar
- 14
Mar
- 15
Dec
- 16
Dec
- 16
200,000
400,000
600,000
800,000
1,000,000
1,200,000
Performance
Overall performance of the LFCs remained strong with growth in both interest and non interest income driven by loan growth despite narrowing of net interest margins. Interest income increased by 25% YoY over 9 months to Dec 2015 whilst interest expenses increased at a faster 41%, an industry-wide trend given the rising interest rate scenario. Margins were stressed resulting in net interest margins declining to 7.4% in 9 months to December 2016 compared to 8.32% in 9 months to December 2015. As a result, net interest incomes of RS. 60 Bn, grew at a slower pace of 10% YoY. Non- Interest income accounting for 14% of sector income increased by 25% YoY during the 9 months to 2016 to RS. 20 Bn. The focus on improving cost efficiency, resulted in overall overhead costs declining by 6% YoY over 9 months to December 2016. Resultantly, efficiency ratios (measured as operating costs as % of total income less interest expenses) improved to 58% by Dec 2016. Profit before tax improved to RS. 27Bn in 9M2016 compared to RS. 14 Bn in 9M2015. ROE improved to 20.23% in 9M2016 compared to 15% in 2015/16.
OUR PERFORMAnCE
Economic and Industry Reviewliquidity and capitalization:
Liquid assets consist primarily of treasury bills and remained comfortably above the statutory minimum. Liquid assets as percentage of total assets declined to 6.95% in 9M2016 compared to 7.69% in 2015/16, as excess liquidity was channelled towards lending activities.
The regulatory capital of the LFCs increased during the year driven by higher retained profits and remained above regulatory capital requirements. Capital adequacy ratios of the SLC/LFC sector increased to 11.4% and 11.7% respectively, from 10.5% and 11.2% the year before.

78 79
Alliance Finance Company PLC | Annual Report 2016/17
Overview Management Discussion & Analysis
Financial Reports Supplementary information
The Group’s strategy is driven through four business units, which are profit centers and work towards the achievement of the common strategic objectives described on page 30. In addition, nine support service functions are in place to ensure the smooth functioning and continuity of operations. The following section provides an overview of the key factors driving performance in the respective business lines during the year, opportunities and challenges in the operating context and outlook over the short to medium term.
Business unit Business unit
regional financial services (rFS)As the Group’s most significant business line, RFS offers a range of lending products including leasing, pledge loans, term loans, quick cash and equipment financing targeting the retail and SME sectors.
group based microfinanceAFC empowers nearly 60,000 impoverished women by providing access to finance through our unique group based microfinance proposition
gold loansThese are short tenured facilities which are secured against gold jewellery, providing easy access to bridging short-term cash shortfalls.
depositsWe offer attractive and secure investment opportunities through a range of deposit products including saving and fixed deposits
OUR PERFORMAnCE
Delivering Strategy Through Our Business Lines

80
Alliance Finance Company PLC | Annual Report 2016/17
Overview Management Discussion & Analysis
Financial Reports Supplementary information
KEY ACHIEvEMEnTS• Highest disbursements in the Group’s history
• Portfolio growth of 24%
• Current collection ratio of 82%
REGIONAL FINANCIAL SERvICES (RFS)RFS is the Group’s most significant business line, and through this unit we offer a wide array of lending products including leasing, mortgage, pledge and personal loans targeting the retail, SME, micro and corporate sectors. The effective implementation of a timely and proactive strategy enabled the unit to achieve strong performance growth.
Product mapleasing Other• Two-wheelers • Pledge loans
• Three-wheelers • Mortgage loans
• Four-wheelers • Personal loans
• Equipment leasing • Speed cash
• Customised solutions for the corporate sector • Microfinance
Operating contextKey developmentsThe leasing industry witnessed a year of multiple challenges, due to regulatory limitations on the lTv, higher interest rates and revisions to the import tariffs and calculation methodologies. However, demand for other credit products was strong during the year, with growth in products such as term loans, and revolving loans accounting for over 70% of the nBFI sector’s credit growth during the year.
OpportunitiesGrowth potential from the SME sector Opportunities for portfolio diversificationCredit demand from outstation regionsleasing facilities for the registered vehicle market
risks/threatsChallenges in expanding the leasing portfolioIncreased competition in segmentsPrevalent high interest rate scenario
Strategy and Performance2016/17 2015/16 % change
y-o-y
Portfolio 21,308 17,164 +24%No. of customers 40,348 39,074 +3%% of portfolio outside the Western Province 59% 58% 2%No. of electric and hybrid vehicles 618 475 +30%
A strategy centered on diversificationThe year’s success can be attributed to the Unit’s effective diversification strategy, through which it expanded its focus to other lending products from its traditional focus on leasing. The challenges which prevailed in the leasing industry compelled AFC to widen its exposure to pledge and mortgage loan targeting the SME sector, enabling the Unit to grow its loan portfolio by 24%. Mortgage and pledged loans grew by a respective 69% and 133% during the year, while growth in leasing was relatively subdued at 19%. Efforts made to streamline collections and strengthen recovery systems allowed the business unit to maintain credit quality.
OUR PERFORMAnCE
Delivering Strategy Through Our Business Lines
Leasing & HP
Pledge loans
Term loans
Quick cash
RFS portfoliogrowth
0
2013
2014
2015
2016
2017
500
1000
1500
2000
2500
(Rs.Mn)

80 81
Alliance Finance Company PLC | Annual Report 2016/17
Overview Management Discussion & Analysis
Financial Reports Supplementary information
leasingThe Company is an industry pioneer in instalment credit, offering tailor-made lease and hire purchase solutions to both the retail and corporate sectors. Our product proposition includes registered and unregistered two, three and four-wheeler vehicles as well as consumer durables. The leasing/HP portfolio grew by 16% during the year and accounted for 68% of the Group’s total lending portfolio.
Units 2016 2017 Y-o-y %
2-wheeler 6,252 6,682 +73-wheeler 25,511 23,373 -84-wheeler 6,935 9,020 +30Tractor 457 883 +93
Leasing portfolio composition
0
2016
2017
20% 40% 60% 80% 100%
5%
3%
32%
55%41%8%
2% 4%
Two-wheelerFour-wheeler
Three-wheelerTractor
Traditionally, the Group’s largest leasing exposure has been to the three- and four-wheeler markets. During the year under review however, we pursued aggressive growth in the two-wheeler segment, in which the LTV restrictions are relatively lax. In order to enhance AFC’s brand in the two-wheeler segment we organized the ‘AFC motorbike show’ in May
2016, providing a platform for motor bike enthusiasts to engage with dealers. The event also featured open stunt show competitions, test riding shows, road safety demonstrations and vintage motor bike stalls among others, attracting large number of spectators. The campaign won the Marketing Campaign of the Year -2016 at the CMO Asia Awards for excellence in branding and marketing. In addition, the Group successfully acquired new customers through expanding its dealer network, introducing new incentive schemes for the dealers and building new relationships with franchise partners. We also launched an innovative 3D hoarding initiative for the motor bike segment to promote our convenient one day leasing service. We continue to engage with our customers through regional promotions such as our Riya Pola, which was carried out in 16 locations during the year.
AFC Motorbike Show 2016
Marketing Campaign of the Year -2016 at the CMO Asia Awards
Units 2016 2017 Y-o-y %
Hybrid vehicles 455 578 +27Electric vehicles 20 40 +100
We also placed emphasis on strengthening our presence in the agricultural equipment segment, particularly in tractors and harvester machines. Accordingly, we entered into a strategic partnership with DIMO to promote the use of Mahindra land vehicles, particularly tractors and harvesters. We hope to pursue further expansion in this segment with the dual objectives of supporting the agricultural sector while achieving further diversification of our portfolio. In furthering our environmental agenda of reducing dependence on fossil fuels, the Group continues to offer specialised leasing facilities for hybrid vehicles and gas three

82
Alliance Finance Company PLC | Annual Report 2016/17
Overview Management Discussion & Analysis
Financial Reports Supplementary information
wheelers and as at end-March 2017, had provided facilities for 40 electric vehicles and 578 hybrid vehicles. (Refer to page 81 for further information)
Strategic Partnership with DIMO
acquisition as well as entry into new market segments. The pledge loan portfolio grew by 133% to Rs. 1.55 billion during the year as the Company nurtured new relationships with vehicle importers to grant revolving facilities against the value of their vehicle fleets. Meanwhile, term loans grew by 43% supported mainly by the strong growth in mortgage loans. Our mortgage loan portfolio consists primarily of loan mortgages for individuals and SMEs.
Improvements in portfolio quality
During the year, the Unit placed emphasis on enhancing the quality of its portfolio through streamlining the collection and recovery mechanisms. Accordingly, the KPIs and targets for the recovery team were refined and simplified, providing more clarity on our collection goals. Resultantly, the Unit achieved its highest ever collection rate of 82% during the year, while the current gross NPL ratio of leasing, term loans and other loans declined during the year.
Credit Quality
Leasing
HP
Term loans
Other loans1.62%
1.94%
2.98%
2.85%
19.40%9.60%
1.80%
2.10%
2017 2016
Responsible lending practices
We seek to propagate sustainable business practices among our customers through adopting social and environmental screening criteria when evaluating credit. Key parameters considered include compliance to CEA regulations, policies against child/forced labour and environmental implications of operations. In furthering our triple bottom line approach, we hope to introduce a holistic ESMS framework in the next financial year, which is expected to further strengthen the weightage given to sustainability considerations in our credit appraisals.
Way forwardWe will seek further diversification of our portfolio with the dual objectives of enhancing profitability and diversifying risk exposure. To this end, we hope to further widen our product portfolio with the addition of innovative solutions in the coming financial year. We also hope to capitalize on emerging opportunities in the registered vehicle market, which has become increasingly attractive due to the high cost of brand new vehicles; accordingly emphasis will be placed on the registered two-wheeler and three-wheeler segment.
OUR PERFORMAnCE
Delivering Strategy Through Our Business Lines
2017 2016
0
Term
lo
ans
Pled
ge lo
ans
500
1,000
1,500
2,000
2,500
3,000
3,500
4,000
(Rs.Mn)Pledge and term loans
Pledge loan facilities are aimed towards bridging the short-term working capital requirements of SME and corporate customers while term loan comprise primarily of mortgage loans, personal loans and soft collateral business loans. During the year under review, we focused on increasing our exposure to these product lines through customer

82 83
Alliance Finance Company PLC | Annual Report 2016/17
Overview Management Discussion & Analysis
Financial Reports Supplementary information
grOuP BASed mICrOFInAnCeThe Group’s venture into Group based microfinance in 2013, fortified its position as an entity truly committed to the triple bottom line principles. Since commencing operations the Unit has empowered and contributed to the socio economic progress of nearly 60,000 impoverished individuals while placing emphasis on client protection, customer education and nurturing a culture of risk consciousness.
In addition to group based microfinance lending unit involved with following products and services.
Product/Service map
lending Customer Education
micro Sme loansPersonal loansmicro lesasingPlantation loans
general life skillslivelihood skills
Operating contextKey developmentsThe Microfinance Act No.6 of 2016 was enacted during the year, with the objective of regulating microfinance institutions. Accordingly, the CBSL issued rules on licensing criteria, minimum core capital, statutory reserves, minimum liquid asset ratios and assessment of shareholders among others. Lending to the microfinance sector is estimated to have recorded strong growth during the year
Opportunities- Potential for growth in outstation regions- Government policy impetus towards financial
inclusion
Risks/threats- Increased over burdened customers. - Difficulties in retaining employees due to the
entry of new players to the industry- Exploitation of customers by unregulated
institutions- Loans utilised for consumption
Strategy and performance2016/17 2015/16 % change y-o-y
Outstanding portfolio (Rs. Mn) 1,873 2,064 -9No. of customers 60,316 66,590 -9Portfolio outside the Western Province (%) 73 77 -5Microfinance customer touchpoints 37 37 -Beneficiaries of EDS 2,665 4,477 -40No. of field staff 316 245 +22Clients per field officer 190 271 +2
Key achievements• Recruitment and development of 250 trainees
• 2,665 Customers educated through EDS Services

84
Alliance Finance Company PLC | Annual Report 2016/17
Overview Management Discussion & Analysis
Financial Reports Supplementary information
A sustainable operating modelIn 2016/17, strategic focus was placed on investing in employee and customer development in order to build a sustainable foundation for strong business growth. Having clearly understood the high-risk dynamics of this market segment, our efforts during the year were focused towards consolidating the portfolio and nurturing a culture of responsible lending among our employees in parallel to improving financial discipline and risk awareness of our customers. Although the portfolio contracted by 9% during the year, we believe AFC is well positioned for sustainable growth in this segment, resulting in long-term value creation for our customers. In maintaining the Group’s overall risk profile within the limits defined by its risk appetite, our exposure to this segment will be maintained at around 10% of total loans over the short to medium term.
We disburse group based microfinance facilities through a network of 4,795 village centres serviced by 37 coordinating officers, covering all districts across the island. More than 70% of our customers are from outstation regions. Our facilities are primarily aimed towards supporting the entrepreneurial ventures of women from low-income families, particularly in outstation regions. Considerable emphasis is placed on client protection principles and social performance standards in testament to which we successfully obtained a ß+ international rating from M-CRIL.
Investment in employee developmentFollowing the entry of several new players to the microfinancing space, the competition for industry talent has intensified and during the year retaining our microfinancing employees was a key challenge. In effectively addressing this challenge, we recruited 250 trainees to the unit and invested in training and development targeted towards nurturing a unique lending culture of risk consciousness and client protection. In addition to managing the Unit’s risk profile, this approach is expected to be a key source of competitive advantage over the medium term.
effective portfolio managementStrategic emphasis was also placed on improving portfolio quality, through rigorous monitoring of both the absolute non-performing-loans and the gross NPL ratio. Ongoing engagement with our customers together with a strict focus on recoveries and collections enabled the sector to decline NPL levels.
developing industry engagementAlthough a relatively new entrant to this industry space, AFC initiated proceedings to generate a platform for effective engagement among microfinance lenders. This has facilitated the formulation of a voluntary code of ethics amongst NBFI’s which are engaged in microfinance activities and the introduction of best practices to ensure client protection and principle-based lending.
OUR PERFORMAnCE
Delivering Strategy Through Our Business LinesCustomer distribution
SabaragamuwaNorthern
North WesternNorth Central
EasternCentral
SouthernUva
Western
0 5000 10000 15000
14015
5521
4579
1692
11323
7218
5588
6029
4351
loan cycle disbursements
0
Customers
Portfolio
10% 20% 30% 40% 50% 60% 70% 80% 90% 100%
44% 30% 17.1% 8.9%
61% 25% 11.1% 2.8%
Cycle 1 Cycle 3Cycle 2Cycle 4 Cycle 5
Outstanding microfnance portfolio
0
2014
2015
2016
2017
500
1000
1500
2000
2500
(Rs. Mn)

84 85
Alliance Finance Company PLC | Annual Report 2016/17
Overview Management Discussion & Analysis
Financial Reports Supplementary information
Customer educationOur customer value proposition extends beyond mere financial support to provide long-term value through providing access to a wide array of skill development opportunities. Through our unique Entrepreneurial Development Services (EDS) program, we provide training aimed towards enhancing the general quality of life (such as raising HIV awareness, reproductive health and disease prevention) as well as technical training aimed towards enhancing entrepreneurial skills. These workshops are conducted island-wide, in partnership with the respective branches as well as external specialists and consultants. Each branch engages in a minimum of one such program every quarter, and during the year we conducted 100 such programmes with a total beneficiary base exceeding 2,600. (Please refer to pages 108-109 for further information). In addition, we have also partnered the Good Market and the Women’s Chamber of Commerce to provide a platform for our micro entrepreneurs to sell their goods.
no. of beneficiaries : 2,665no. of training programmes : 100
Way ForwardThe solid foundation put in place during the year under review has afforded us a strong platform for growth and in the next financial year we will place strategic emphasis on expanding our reach and acquiring new customers. Despite being a relatively new entrant to this market, we have been successful in partnering foreign funding agencies to obtain funding to grow this business line. We are deeply committed to the Group’s sustainability agenda and will continue to add sustainable value to our customers through nurturing financial discipline and developing entrepreneurial skills to promote socio economic empowerment. Ongoing focus will be placed on maintaining the quality of our portfolio in order to effectively manage our risk return dynamics.
EDS Program

86
Alliance Finance Company PLC | Annual Report 2016/17
Overview Management Discussion & Analysis
Financial Reports Supplementary information
gOld lOAnSDuring the year, the Group revived its gold loan business line, which had been curtailed since 2014/15 due to the sharp drop in gold prices. Resultantly, the portfolio expanded for the first time since 2012/2013 while losses reduced in comparison to the previous year.
Operating contextKey developments
Global gold prices increased during the year led by the rise in commodity prices. Resultantly, the pawning segment picked up growth during the year, particularly in the North/Eastern region of the country.Opportunities• Growth potential in the
North/East
Risks/threats• Risks arising from dud items
• Exposure to fluctuations in gold prices
• Difficulties in retaining skilled talent
Strategy and performance2016/17 2015/16 % change
y-o-y
Gold loan portfolio (Rs. Mn) 468 368 +27No. of customers 7,143 6,988 +2Portfolio outside the Western province (%) 73.35 65.36 +12
Revival of the Gold loan Segment
Following the sharp decline in gold prices several years ago, the Group curtailed its exposure to gold loans, closing down several branches and deploying the pawning staff to other business units. In 2016/17 we made a strategic decision to revisit this segment and gradually expand its operations to capitalize on the opportunities presented by the revival in gold prices. Resultantly, AFC recruited a skilled industry practitioner to drive business growth supported by which the
Group’s gold loan portfolio expanded by 27% to Rs.467.6 million during the year. During the year focus was placed on recruiting employees to the business line and investing in training specific to handling gold loans. With several gold loan centers having been closed in the past, we also focused on optimising the existing locations and leveraging on our branch network to drive portfolio growth. Efforts were also directed towards strengthening risk management and internal audit processes pertaining to gold loans.
Proactive Risk Management
The Group maintains a maximum Loan to Value ratio of 70% in its gold loans segment while densi meters are used to assess the genuity of the article being pawned. Ongoing training programs ensure that employees are upskilled on identifying dud articles as well as gauging customer behaviour, particularly in preventing lending against stolen items. Verifications are conducted by Group internal audit as well as gold inspection officers who visit centers/branches to verify the physical stock of gold. The required physical infrastructure is also in place which comprises alpha safes, access controls as well as key and number verifications. As a secondary measure the full portfolio is insured.
Way ForwardCurrently, we offer gold loan facilities through 12 centers and 20 branches and in the next financial year we hope to shift 6 centers to more optimal locations which are likely to draw more crowds. We will also focus on strengthening our team and hope to attract the industry’s top talent through offering competitive remuneration. We hope to aggressively grow this portfolio in the coming year. The revival of this business line is anticipated to contribute towards strengthening the bottom line over the short to medium term.
OUR PERFORMAnCE
Delivering Strategy Through Our Business Lines

86 87
Alliance Finance Company PLC | Annual Report 2016/17
Overview Management Discussion & Analysis
Financial Reports Supplementary information
dePOSItS Our value proposition in deposits is underpinned on trust, stability and personalised service, characteristics that are strongly associated with the Alliance brand. Our risk consciousness and relatively cautious approach towards business growth have enabled AFC to demonstrate resilience to numerous confidence crises in the industry, further strengthening its deposit proposition as a trusted and secure institution for investment.
2016/17 2015/16 % y-o-y change
Total deposits (Rs. Mn) 10,088 10,464 -4Deposit renewal rate (%) 81.4 79.5 2Deposit customers 149,337 117,106 +27Average deposit size (Rs.) 65,068 85,205 -24Average deposit rate (%) 10.7 9.9 8
Strategy and performanceWe offer a range of investment solutions to our customers including fixed deposits, savings accounts as well as savings options for specific customer segments including senior citizens, minors and three-wheeler savings. During the year under review, our retail deposit base declined by 4% as we leveraged on relatively low cost funding options which were available to the Company. Overall, our savings and deposit customer base including Microfinance savers, grew by 27% during the year. The fixed deposit renewal rate continues to be healthy at around 80%.

88
Alliance Finance Company PLC | Annual Report 2016/17
Overview Management Discussion & Analysis
Financial Reports Supplementary information
OverviewGroup performance improved significantly during the year with asset growth of 16% YoY and a profit growth of 51% YoY driven by expansion of the lending portfolio together with an improvement in portfolio quality. This performance was achieved despite a tough operating environment, which saw a regulatory limit on the LTV of vehicle leases, curtailed demand for consumer goods, difficulties in debt recoveries from customers and intensified competition from banks. Loan disbursements were driven by mortgage and pledge loans. During the year, we focused on strategically rebalancing our lending portfolio and building a strong platform for growth driven by sound recovery process. We strategically focused on consolidating our group based microfinance portfolio through investing in customer education and employee training during the year. This would enable us to manage our risk profile in this relatively high-risk, high-return product category. Overall, the Company’s Gross NPL ratio improved to 2.11% during the year compared to 2.46% last year and continues to be lower than the industry average while leading to a decline in impairments and bad debt write offs.
30.2
26
15.8 660 10.1
5.5 7.5Total Assets16% Growth
Total Liabilities12% Growth
Leases19% Growth
Profit AfterTax
51% Growth
Deposits4% Decline
Gross Income18% Growth
Loans33% Growth
Rs.
Rs.
Rs. Rs.
Billion
Billion
Billion Million Billion
Billion Billion
Financial PerformanceGross Income of the Company increased by 18% to Rs.5.4 Bn during the year driven by growth in interest income and other operating income despite a moderation in fee based income and trading gains. Interest income increased by 22% as the lending portfolios expanded. Other non-interest income declined by 8% impacted by lower fee based income and normalization of gains from trading activities. Bad debt recoveries of Rs. 54 Mn resulted in other operating income increasing by 7% during the year.
vAlUE CREATIOn AGAInST OUR CAPITAlS
Financial Capitalgroup Financial Highlights

88 89
Alliance Finance Company PLC | Annual Report 2016/17
Overview Management Discussion & Analysis
Financial Reports Supplementary information
Composition of interest income
Interest income increased by 22% during the year driven by growth in both loan and leasing portfolios, while the hire purchase portfolio contracted. Leases accounted for 59% of interest income, growing by 18% YoY in 2016/17 with an increase in four wheeler vehicles that offset the decline in the three wheeler segment. Interest income from loans recorded a significant growth of 98% during the year upheld by portfolio growth in mortgage, pledge and gold loan segments.
Leases 59%
Hire purchase 1%
Treasury bills & Bonds 3%
Loans 13%
Pledge Loan 3%
Gold Loan 2%
Microfinance 16%
Income Composition 2017
Leases 61%
Hire purchase 4%
Treasury bills & Bonds 3%
Loans 8%
Pledge Loan 1%
Gold Loan 2%
Microfinance 19%
Income Composition 2016
Interest expenses increased by 32% during the year to Rs 2.5 Bn as we obtained increased exposure to foreign funding and bank borrowings, which increased by 41% during the year. Average cost of funds increased to 10.3% in 2016/17 compared to 9.4% in 2015/16 given the rise in market interest rates. Interest expenses from bank borrowings accounted for 38% of the total and surged by 142% YoY. Interest expenses on deposits accounted for 45% of the total and increased by 7% during the year. Expenses on debt instruments declined as several were redeemed during the year.
Bank Borrowings 38%
Fixed Deposits & Savings 45%
Debt Instruments 16%
Other Financial Liabilities 1%
Interest Expense Composition 2017
Net interest income of Rs. 2,515 Mn reflected a growth of by 13% during the year, recording a faster growth rate than the overall industry. Interest income driven by portfolio growth sustained the impact of declining net interest margins. NIM declined to 9% during the year compared to 9.7% in 2015/16 as interest spreads narrowed with an increase in the average cost of funds.
Alliance Industry
net Interest Income Growth Trend ( AFC vs Industry)
0.0%
Mar
- 09
Mar
- 10
Mar
- 11
Mar
- 12
Mar
- 13
Mar
- 14
Mar
- 15
Mar
- 16
Mar
- 17
2.5%
5.0%
7.5%
10%
net Interest Income Growth Trend ( AFC vs Industry)
0.0%
2013
2014
2015
2016
2017
5.0%
10.0%
15.0%
20.0%
25.0%
30.0%
Average Cost of Funds Average Interest Rate
14.7%
24.6%
21.7%20.6% 20.0% 19.7%
14.8%
10.9%9.4%
10.3%

90
Alliance Finance Company PLC | Annual Report 2016/17
Overview Management Discussion & Analysis
Financial Reports Supplementary information
Net operating incomes increased by 23% during the year to Rs. 2,795 Mn compared to Rs. 2,271 Mn in the previous year with a decline in impairment charges and reversal of gold loan auction losses.
Total impairment charges declined by 84% to Rs. 24 Mn due to impairment write backs and decline in bad debt written offs to Rs. 98 Mn compared to Rs. 319 Mn in the previous year. In addition, increasing gold prices enabled a recovery of gold auction losses during the year.
Personnel 43%
Administration 47%
Selling 3%
Depreciation 7%
Operating Expenses 2017
Operating expenses increased by 8% during the year. Personnel expenses accounted for 43% of operating expenses and increased by 3% in 2016/17. Administration expenses accounting for 47% of operating expenses increased by 12% during the year primarily driven by the growth in motor vehicle running and maintenance costs. Efficiency ratio improved to 62.5% in 2016/17 compared to 64% in the previous year as the Company focused on cost management initiatives and improving labor productivity.
ProfitabilityOperating profits before value added tax increased by 66% during the year to Rs. 1,002 Mn driven by growth in interest incomes, a reduction in impairments and reversal of gold auction losses during the period. Value added tax (VAT) increased to Rs. 179 Mn as the government increased VAT for financial services to 15% from 11% in the previous year. Profit before taxation improved by 57% to Rs. 834 Mn despite the VAT increase. Provision for income taxes increased by 66% YoY during the year due to increase in profit before taxes and a change in the product mix. Profit After tax (PAT) increased by 55% during the year to Rs. 649 Mn, the highest level in our history.
Financial PositionRs. Mn Growth %
2016/175 year
CAGR %
Total Assets 30,022 16 19Loans & Advances 7,478 33 33Lease rentals 15,837 19 20Hire Purchase 168 -64 -39Financial Investments
1,740 14 26
AssetsTotal assets of the Company expanded by 16% to Rs. 30 billion during the year, supported by the growth in the lending portfolio. The asset composition remained relatively unchanged in comparison to the previous year, with the lending portfolio accounting for 78% of assets.
The lending portfolio comprising of leases, loans and hire purchase increased by 21% during the year. An increasing number of new customers were seen in the mortgage and pledge loan segments. Loan disbursements increased by 10% YoY to Rs 17,932 Mn.
Portfolio Rs. Mn
Portfolio Trend
0
2013
2014
2015
2016
2017
5,000
10,000
15,000
20,000
25,000
(Rs.Mn)
14,2
99
14,4
04
15,4
24
19,6
97 23,8
07
vAlUE CREATIOn AGAInST OUR CAPITAlS
Financial Capital

90 91
Alliance Finance Company PLC | Annual Report 2016/17
Overview Management Discussion & Analysis
Financial Reports Supplementary information
Disbursements
2017
2,00
0
4,00
0
6,00
0
8,00
0
10,0
00
12,0
00
14,0
00
16,0
00
18,0
00
20,0
00
2016 9,569 3,244 3,488
9,049 3,024 5,859
Leasing Microfinance
Term and Pledge Loans
Portfolio compositionLeasing portfolio increased by Rs. 2,554 Mn growing at 19% YoY as leases to the four wheeler assets increased during the year offsetting the 9% decline in the three wheeler category. Three wheelers accounted for 33% of leasing portfolio and were impacted by the regulatory cap on the loan to value (LTV) ratios. Loans and advances increased by 33% during the year driven by the growth in mortgage, pledge and gold loans. With increasing gold prices, we revived the gold loan segment and increased the portfolio by 27% during the year to Rs. 468 Mn. Group based microfinance continues to be a lucrative area of interest where we focused on building a strong foundation with a sound recovery process that will drive our future growth. During the year, group based microfinance portfolio declined by 11% as our focus was on educating customers, developing employees and streamlining the recovery processes.
Portfolio composition
2016
2017 67%
68% 2% 13% 2%10% 4%
1% 16% 2% 8% 7%
Leasing Term loansHire purchaseGold loans Microfinance loans Pledged & other loans
Asset quality
Non-performing loans (NPLs) increased slightly by 4% to Rs. 502 Mn significantly slower than the portfolio growth of 21% during the year. Accordingly, the gross NPL ratio declined to 2.1% during the year compared to 2.46% last year. Provisions declined by 7% YoY and amounted to Rs. 323 Mn with decreasing provisions in the hire purchase, loans and microfinance segments. The Net NPL ratio increased to 0.8% in 2016/17 compared to 0.7% last year as provisions were reduced. This improvement reflects ongoing efforts to strengthen our credit appraisal and recovery mechanisms, including streamlining our recovery process, appointment and training of recovery officers, providing target oriented incentives to collection officers and reducing the microfinance
portfolio due to difficulties in collection. Our focus on reducing NPLs in recent year has enabled us to outperform the industry with gross NPL of 2.1% compared to the industry gross NPL of 5.3%.
FundingRs
MnGrowth % 2016/17
5 year CAGR %
Equity 4,065 49 23Liabilities 25,957 12 18Deposits 10,088 -4 8Borrowings 11,718 41 26Debt instruments 2,548 -17 52
The main sources of funding during the year were new bank borrowings and rights issues that contributed Rs. 3,389 Mn and Rs. 71.3 Mn to our funding base. Debts and Deposits accounted for 86% of funding and increased by 11% YoY in 2016/17 as we obtained foreign currency loans amounting to USD 10 Mn from Symbiotic as a senior debt. Another USD 1 Mn senior debt and USD 4 Mn subordinated debt were received from Tridos Bank of Netherlands. The Company’s ability to obtain foreign funding lines is a testament to the stability of its earnings profile and strength of its balance sheet.
Gross and net nPls
Net NPL Gross NPL
0
2013
2014
2015
2016
2017
2.0%
4.0%
6.0%
8.0%
10.0%
12.0%
14.0%
16.0%
18.0%
20.0%
2.0%
0.7% 0.7% 0.8%
18.2%
8.3%
2.5% 2.1%
15.4%
5.2%

92
Alliance Finance Company PLC | Annual Report 2016/17
Overview Management Discussion & Analysis
Financial Reports Supplementary information
Deposits accounting for 39% of liabilities declined by 4% YoY as both fixed and savings deposits reduced during the year. The Company did not aggressively pursue deposit growth during the year as it had sufficient access to low cost funding such as foreign and local borrowings. Debt instruments accounted for 10% of liabilities and declined by 17% as a result of some debentures were redeemed during the year.
Liability Composition
FYE 2015/16
FYE 2016/17 45% 39% 10% 3%
4%
3%
2%13%36% 45%
Due to banks Debt instruments issued and other borrowed funds
Due to customersOther non financial liabilities
Other financial liabilities
Deposit Debt
Growth in Liabilities
0
2013
2014
2015
2016
2017
2,000
4,000
6,000
8,000
10,000
12,000
14,000
16,000
(Rs. Mn)
Net assets per share recorded Rs 121 per share due to the share split and rights issue that added 31Mn new shares during the year.
Capital adequacyThe Core capital adequacy ratio increased marginally to 10.4% during the year (10.2% the year before) comfortably above the regulatory minimum. The overall RWCAR decreased to 12.1%, due to the redemptions of debentures.
Investor returns
Shareholders’ funds increased by 49% YoY to Rs. 4,065 Mn with the rights issue of shares and growth in retained profits. Stated capital increased to Rs. 613 Mn in 2016/17 compared to Rs. 24.3 Mn in 2015/16. The number of shares issued increased during the year to 33 Mn shares compared to 2.4 Mn shares in 2015/16. The share split (21mn new shares), reserve capitalization (8mn new shares) and rights issues (1.3mn new shares) contributed to the increase in shares.
EPS (Rs.)
EPS (Rs.)
0
2013
2014
2015
2016
2017
50
100
150
200
250
Investor returns improved during the year driven by growth in profitability. Return on equity (ROE) increased to 19.1% in 2016/17 compared to 16.2% in the previous year mainly driven by the 49% growth in profit after tax.
vAlUE CREATIOn AGAInST OUR CAPITAlS
Financial Capital

92 93
Alliance Finance Company PLC | Annual Report 2016/17
Overview Management Discussion & Analysis
Financial Reports Supplementary information
Shareholders’ (Rs. Mn)
ROE (After Tax)
Shareholders’ Funds and Return on
Equity
0.00 0%
2013
2014
2015
2016
2017
1,000 5%
10%
15%
20%
25%
30%
2,000
3,000
4,000
5,000
Returns to Our ShareholdersSignificant Growth In Profits Profit after tax reached Rs 649
Mn, the highest in our historyDividend Per Share Total dividend per share of Rs.
5.9 that includes Rs. 3.7 interim and Rs. 2.2 proposed.
Stock dividend of Rs 64/share from capitalization of reserves.

94
Alliance Finance Company PLC | Annual Report 2016/17
Overview Management Discussion & Analysis
Financial Reports Supplementary information
fully fledged branches and 4 collection centers to our network while 4 gold loan centers were temporarily discontinued with the objective of shifting them to more prominent locations amalgamated with the fully fledged branches.
Physical network
Fully fledged Branches: 39Gold loan centers: 12Microfinance Coordinating Offices: 21Collection centers and other: 17
digital infrastructureThe digital revolution in financial services is transforming the way financial entities engagement with their customers. For AFC, driving growth efficiencies and the customer relationship through digital infrastructure is a key area of focus and during the year we invested over Rs. 30 million in upgrading our IT infrastructure to a blade center thereby facilitating integration and virtualization of the full system. This upgrade is also expected to generate process efficiencies, enhance the reliability of information and support more effective decision making through providing access to better and timely information.
Information securityThe Company’s security infrastructure is also robust and the transition to a common platform has facilitated stronger security and reliability. There have been no significant breakdowns or any threats on customer privacy during the year. AFC also operates a fully-fledged disaster recovery site in Rajagiriya and the transition to a blade server has enabled the real-time backup of data online. AFC was the first Sri Lankan company in the non-banking finance sector to receive the ISO 22301 certification for its business continuity management systems and the only finance company in South Asia to obtain the BCMS 25999 accreditation.
Customer engagementDuring the year we also strengthened customer engagement via online platforms through the upgrade of our website and a more active social media presence. Over the medium term, we hope to further enhance our customer value proposition through the launch of online and mobile banking facilities.
AFC’s manufactured capital comprises tangible and intangible infrastructure which includes its branches, gold loan and collection centers and microfinance co-ordinating offices as well as its information systems and other digital infrastructure. The Manufacturing capital plays a vital role in enhancing the customers’ experience and we have continued to invest in expanding and enhancing the quality of this capital to maximize customer reach and generate efficiencies.
Physical infrastructureAs the key contact point for customer engagement, we ensure that our physical network enhances customer experience while nurturing brand recognition. RFC, gold, micro loans and deposit product offerings are promoted to customers through the branch network facilitating both credit growth and deposit mobilization. By end-March 2017, we operated a total of 89 contact points across 24 districts in the island. Of the 89 contact points, 62 are located outside the Western province, of which more than 35 are located in rural and impoverished localities, thereby demonstrating our commitment to driving financial inclusion in the regions. During the year under review, strategic emphasis was placed on optimising the current island-wide branch network and we added 2 new
vAlUE CREATIOn AGAInST OUR CAPITAlS
Manufactured Capital

94 95
Alliance Finance Company PLC | Annual Report 2016/17
Overview Management Discussion & Analysis
Financial Reports Supplementary information
In the next financial year, we will focus on the implementation of a new IT - MIS system which will transform our operations through process efficiencies and strengthen our risk management practices. We have already identified the vendor and a customized solution will be developed for the Company’s specific requirements.
Value addition to our manufactured CapitalDuring the year under review we invested Rs. 65 million in strengthening our Manufactured capital, the breakdown of which is illustrated below.
Manufactured Capital
0
Furn
iture
& fi
tting
s
20
40
80
60
100
120Nos
Equi
pmen
t
Mot
or v
ehic
les
& a
cces
sorie
s
Com
pute
rs

96
Alliance Finance Company PLC | Annual Report 2016/17
Overview Management Discussion & Analysis
Financial Reports Supplementary information
Our engaged and motivated team of 1,222 employees is our most valued capital for the Group and a critical source of competitive advantage. We in turn are committed to providing attractive remuneration and numerous opportunities for skill and career development in a dynamic and rewarding work environment.
Highlights
Our team1,222
Investedin Training 1.5 Mn
DiverseWorkforce
136 employees promoted in 2016/17 compared to 91 in 2015/16
Total value created for employees774 Mn
How We Grow and
Retain Our Employees
85% of cadre eligible for annual appraisals
Continuous employee engagement
Zero incidents on human rights, safety and discrimination
Implemented sound HR policies linked to corporate strategy
Our Hr policies and approachOur approach to people management is governed by a comprehensive suite of HR policies, which ensure the fair and equitable treatment of all employees. The policy framework has been formulated to ensure compliance with all relevant regulatory requirements including prohibition of child labor and forced/compulsory labor. The framework covers numerous aspects of HR including recruitment, remuneration, talent development and performance management among others. During the year, we focused on refining our Human Resource (HR) strategy by;
• Implementing a talent management framework and succession planning with the objective of developing a talent pipeline and nurturing the next generation of leaders within the organization.
• Revamping existing Human resource systems and automating the performance management systems. This is expected to facilitate better analytics thereby enhancing decision making capabilities.
vAlUE CREATIOn AGAInST OUR CAPITAlS
Human Capital
Male 76%Female 24%
Gender Workforce by Location
0%
Cen
tral
Wes
tern
East
ern
Saba
raga
muw
a
Sour
ther
n
Nor
th C
entr
al
Nor
ther
n
Nor
th W
este
rn
Uva
5%
10%
15%
20%
25%
35%
40%
45%
50%
30%
Permanent 1201FTC - Fixed Term Contract 21
Employment Contract
Operational 87%Supervisory 13%
Employment Category
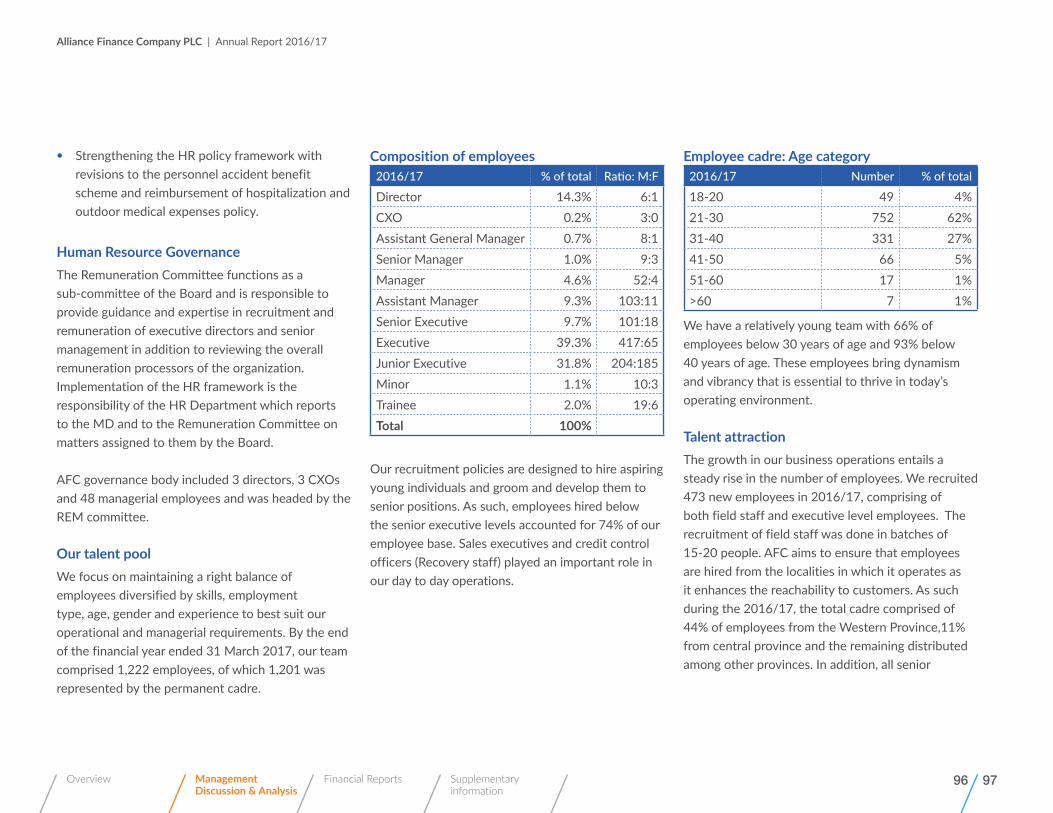
96 97
Alliance Finance Company PLC | Annual Report 2016/17
Overview Management Discussion & Analysis
Financial Reports Supplementary information
• Strengthening the HR policy framework with revisions to the personnel accident benefit scheme and reimbursement of hospitalization and outdoor medical expenses policy.
Human resource governance The Remuneration Committee functions as a sub-committee of the Board and is responsible to provide guidance and expertise in recruitment and remuneration of executive directors and senior management in addition to reviewing the overall remuneration processors of the organization. Implementation of the HR framework is the responsibility of the HR Department which reports to the MD and to the Remuneration Committee on matters assigned to them by the Board.
AFC governance body included 3 directors, 3 CXOs and 48 managerial employees and was headed by the REM committee.
Our talent poolWe focus on maintaining a right balance of employees diversified by skills, employment type, age, gender and experience to best suit our operational and managerial requirements. By the end of the financial year ended 31 March 2017, our team comprised 1,222 employees, of which 1,201 was represented by the permanent cadre.
Composition of employees 2016/17 % of total Ratio: M:F
Director 14.3% 6:1CXO 0.2% 3:0Assistant General Manager 0.7% 8:1Senior Manager 1.0% 9:3Manager 4.6% 52:4Assistant Manager 9.3% 103:11Senior Executive 9.7% 101:18Executive 39.3% 417:65Junior Executive 31.8% 204:185Minor 1.1% 10:3Trainee 2.0% 19:6total 100%
Our recruitment policies are designed to hire aspiring young individuals and groom and develop them to senior positions. As such, employees hired below the senior executive levels accounted for 74% of our employee base. Sales executives and credit control officers (Recovery staff) played an important role in our day to day operations.
employee cadre: Age category2016/17 number % of total
18-20 49 4%21-30 752 62%31-40 331 27%41-50 66 5%51-60 17 1%>60 7 1%
We have a relatively young team with 66% of employees below 30 years of age and 93% below 40 years of age. These employees bring dynamism and vibrancy that is essential to thrive in today’s operating environment.
talent attractionThe growth in our business operations entails a steady rise in the number of employees. We recruited 473 new employees in 2016/17, comprising of both field staff and executive level employees. The recruitment of field staff was done in batches of 15-20 people. AFC aims to ensure that employees are hired from the localities in which it operates as it enhances the reachability to customers. As such during the 2016/17, the total cadre comprised of 44% of employees from the Western Province,11% from central province and the remaining distributed among other provinces. In addition, all senior

98
Alliance Finance Company PLC | Annual Report 2016/17
Overview Management Discussion & Analysis
Financial Reports Supplementary information
management was hired from the local community. In line with our recruitment policies, we continued to maintain our position as an equal opportunity employer with no bias towards any gender, ethnic group or religion in both recruitment and retention.
rewards and recognitionOur rewards policy aims to ensure that we attract and retain the industry’s best talent. Performance of all employees are linked to Key Performance Indicators (KPIs) communicated to the employee at the beginning of the review period. A one to one ratio of basic salary by gender was maintained during the year in addition to a salary which is well above the regulatory requirements at the entry level. The following benefits were given to employees.
Above regulatory EPF contributions of 20% by Employer
Festival advances
Performance-based bonuses Subscriptions for professional associationsAnnual increments Educational expenses reimbursementTravelling/Fuel allowances Staff LoansMobile allowances as entitled Maternity leave: 15 employees were on maternity
leave in 2016/17 with 11 employees returning to work after maternity leave.
GratuityIn-house Medical Insurance schemePersonal Accident benefit scheme for employees who travel frequently
In line with our remuneration policies, we have maintained a fair salary and remuneration ratio of male to female based on the composition of our employee cadre. There were no incidents of discrimination and no grievances filed on human rights during the review period.
Grade Salary and remuneration Ratio (Male: Female)
CXO/AGM 1:1Senior Manager 1:1Manager 1:1Assistant Manager 1:1Senior Executive 1:1Executive 1:1Junior Executive 1:1
vAlUE CREATIOn AGAInST OUR CAPITAlS
Human Capital

98 99
Alliance Finance Company PLC | Annual Report 2016/17
Overview Management Discussion & Analysis
Financial Reports Supplementary information
Our process of employee engagement ensures that our employees
• Perform at optimum levels
• Continuously develop skills
• Able to deal with challenging tasks and projects
• Evaluate Employee satisfaction
• Develop a sense of team and camaraderie
The following concerns were raised through employee engagement and our responses are listed below;
PersonalTraining needs
Career development
Networking and socialization
Work life and Balance
Compensation
OrganizationalBusiness continuity
Target
Operational practice and defeciencies
Internal communication
Environmental and social sustainability
employee engagementOur employee engagement mechanisms ensure that we maintain open, two-way communication with our employees whilst ensuring that employees perform their responsibilities in an efficient and consistent manner.
We engage with employees as follows:
Engagement Frequency
Management meetings and target evaluation meetings
Monthly
Open door policy All the timePerformance appraisals AnnuallyCorporate Planning AnnuallyBCMS and ISO trainings PeriodicallyIntranet RegularlyE-mails and memos RegularlyNetworking events PeriodicallyInternal training and development sessions
Periodically
Branch/division level short meetings PeriodicallyIndividual/ small group feedback sessions
Regularly
Employee satisfaction survey AnnuallyEmployee exit interviews As required
Our responsesPersonal Organizational• Employee training
program• Operations manuals
• Career development • Motivation• Promotions • Internal audits• Performance based
awards• E-mails and circulars
• Sports events and get together
• CSR
• Incentives and performance based increments

100
Alliance Finance Company PLC | Annual Report 2016/17
Overview Management Discussion & Analysis
Financial Reports Supplementary information
employee networkingReligious ceremonies were conducted at head office and all our branches to celebrate the 60th anniversary of the company. The annual carol service was held in December at head office premises with the participation of all Colombo based staff members and their families. In addition, staff get together and sports events were organized during the year. We engaged employees to our CSR projects with all employees contributing to the flood relief programs by providing immediate dry rations for flood affected people and donating 750 pairs of shoes to the students of Gothatuwa Maha Vidyalala.
Skill developmentWe offer numerous opportunities for skill development and our HR policies facilitate a structured training program based on the company expectations and future requirements of management and divisions of our organization. Skill gaps are identified through a comprehensive and systematic training and development program at the start of every year. The plan aims to fulfill employee training needs and create a learning culture that will nurture the necessary skills and knowledge for value creation in the organization.
Induction Process: All new recruits undergo an induction program introducing them to the Company’s history, corporate culture, products and services as well as overall operational framework. Given our increasing focus on microfinance, our induction program provided special attention to increasing knowledge and skills in microfinance using a comprehensive 3-month training program in collaboration with the Sri Lanka Institute of Credit Management.
vAlUE CREATIOn AGAInST OUR CAPITAlS
Human Capital
New Year Ceremony - 2017 Long Service Awards - 2016
Christmas Carols AFC sports event

100 101
Alliance Finance Company PLC | Annual Report 2016/17
Overview Management Discussion & Analysis
Financial Reports Supplementary information
training and development Highlights2016/17 2015/16
No. of staff that participated in training programs
550 423
% of total staff 43% 35%No. of training programs conducted
39 43
Total Investment for the training programs (LKR mn)
1.5 2.3
Total training hours 2,674 3,570Average training hours per employee
5.00 8.44
During the period of review, our employees participated in 39 training programs at a cost of LKR 1.5mn. Training hours declined by (25%) during the year to 2,674 hours in total.
Internal/external trainingInternal External
No. of staff that participated in training programs
445 110
Total no of training hours 2,247 427Average training hours 30 20
Training programs included both internal and external programs. A higher participation of 445 staff was in internal programs which covered areas such as business operation related trainings, Soft skills development, Business strategy and IT/Software Skill development.
training programs and training hoursno of
programsno of
participants
Business operations/ Marketing
30 503
Business strategy 1 4IT/Software 2 7Business continuity management
1 2
Soft skills development 5 34Total 39 550
A total of 39 training programs were conducted during the year with greater emphasis on business operations/marketing such as documentation, recovery and feedback management programs. A higher participation was seen in business operations related training programs that accounted for 91% of staff participation during the year. In terms of employee category, the highest number of training hours was for Executives representing 19% of total.
Male 508
Female 288
Training Hours by Gender

102
Alliance Finance Company PLC | Annual Report 2016/17
Overview Management Discussion & Analysis
Financial Reports Supplementary information
Employment TypeTraining
HrsHours per employee
per year
DirectorCXO 16 3.2Assistant General Manager 20 4.0Senior Manager 12 12.0Manager 48 3.9Assistant Manager 411 25.6Senior Executive 785 87.1Executive 999 45.4Junior Executive 383 38.3MinorTraineegrand total 2,674
Career developmentA total of 1,044 employees, representing 85% of the employee cadre were eligible for annual appraisals in 2016/17. Employee development through promotions significantly increased during the year with 136 employees being promoted to senior positions compared to 71 employees in 2015/16.
Promotions 2015/16 2016/17
New Grade Count CountSenior Manager 1 2Assistant Manager 6 17Senior Executive 23 50Executive 32 53Manager 9 14Grand Total 71 136
number of employees promoted
74
2015
/16
2016
/17
76
78
82
84
86
(%)
Percentage eligible for annual
appraisal
74
2015
/16
2016
/17
76
78
82
84
86
(%)
employee turnoverOne of the major challenges that confronted AFC during the year under review was the incidence of high staff turnover of the group based microfinance unit as the industry segment is grappling with this problem. Nevertheless, the Company has put in place several employee value creating policies such as off the job and on the job training, attractive reward practices and employee benefits.
As such we implemented the following actions: 1. Increased career progression opportunities with
internal employees being given the first priority on vacancies.
2. Staff of well performing branches were provided with opportunities such as foreign visits to gain exposure.
3. Award ceremonies to recognize the best performers
4. Adoption of industry best practices
vAlUE CREATIOn AGAInST OUR CAPITAlS
Human Capital

102 103
Alliance Finance Company PLC | Annual Report 2016/17
Overview Management Discussion & Analysis
Financial Reports Supplementary information
Health and safetyThe health and safety committee includes 14 employees and focuses on occupational health and safety programs. The programs conducted during the year include first aid training and a fire incident management training. There were no workers involved in high incidence or high risk operations in the Company.
Fire Safety Training

104
Alliance Finance Company PLC | Annual Report 2016/17
Overview Management Discussion & Analysis
Financial Reports Supplementary information
The Group’s Social and Relationship capital represents the long-term relationships we have nurtured with our diverse stakeholders, primarily our customers, business partners and the communities we operate in. These relationships are a fundamental element of our value creation process and provide us the social license to operate.
Customers Business partners Communities
Industry networks
Highlights of 2016/17
Island-wide network of over 117,000 customers
89 customer contact points
100 customer education programmes during the year
Total investment in CSR Rs 7.5 million
Our commitment to our stakeholders and networks
Supplier evaluation comprising social and environmental criteria
Over 65% of our customers have been with AFC for over 5 years
Active participant in industry forums
60% of our lending portfolio is outside the Western Province
Customer relationshipsCustomer profile
We have developed long-standing relationships with an island-wide network 117,534 customers, comprising individuals, SME and micro enterprises. We serve our customers through a wide array of lending and deposit products which are often customized to satisfy the specific requirements of clients. A unique value proposition characterized by trust, innovation and stability has enabled the Group to nurture engaged and loyal customers with over 65% of our deposit customer base having been with us for at least 5 years. During the year under review, total customers recorded a decline of around 12% mainly due to strategic efforts in consolidating microfinance portfolio as well as write-offs in the RFS portfolio. We maintain a high level of engagement with our customers facilitated through face to face interaction, customer satisfaction surveys, social media platforms and a dedicated customer relationship management function.
vAlUE CREATIOn AGAInST OUR CAPITAlS
Social and Relationship Capital

104 105
Alliance Finance Company PLC | Annual Report 2016/17
Overview Management Discussion & Analysis
Financial Reports Supplementary information
2016/17 2015/16 % Y-o-Y
Deposit customers 9,413 9,804 -4RFS and other lending customers 48,195 66,455 -10Microfinance 59,926 57,725 -17Total 117,534 133,984 -12
Our regional inclusion objectives are reflected in the regional analysis of our lending portfolio, in which 60% of the portfolio originates outside the Western Province. Meanwhile, deposits are still concentrated primarily in the Western province with more than 90% of total deposits originating from Colombo.
Portfolio
Customers
12% 6% 6% 9% 7% 8% 7% 6% 40%
11% 9% 8% 12% 15% 6% 7% 8% 23%
Central
Eastern
North Central
North Western
Northern
Sabaragamuwa
Southern
Uva
Western
Central 15%
Eastern 11%
North Central 8%
North Western 12%
Northern 13%
Sabaragamuwa 6%
Southern 8%
Western 27%
Deposit Customers - Regional Breakdown
Value propositionOur unique customer value proposition is built on the principles of trust and stability and is characterized by four key strengths which has enabled us to retain our base and attract new customers despite increasing competitive intensity in the industry. The value proposition is illustrated in the infogram below.
Accessibility
Customer satisfaction
Responsible lending
Customer education
Customer value
proposition

106
Alliance Finance Company PLC | Annual Report 2016/17
Overview Management Discussion & Analysis
Financial Reports Supplementary information
AccessibilityWe engage with and serve our customers through an island-wide network of 89 contact points, comprising fully fledged branches, collection centers, microfinance coordinating offices and gold loan centers. These contact points are designed and located strategically to optimize the Company’s geographical reach to attract relevant customer segments. For instance, gold loan centers are located in areas which draw large crowds, for example city centers or transport hubs. During the year, we further expanded our network and by end-March 2017 operated a total of 89 contact points across the island. Of the 89 contact points, 62 are located outside the Western province, out of which more than 30 are located in rural and impoverished localities, thereby demonstrating our commitment to driving financial inclusion in the regions. Further details of our points of presence are avalible in our website (www.alliancefinance.lk/contact/branches).
JaffnaThirunaweli
Chankanai
ChawakachcheriChunnakam
PointPedroNelliady
Kilinochchi
Mulativu
ParakramapuraTown
Vavuniya
TrincomaleeMedawachchiya
Anuradhapura Kantale
Kalpitiya
Puttalam Hingurakgoda
Galgamuwa
Nikawaratiya
KuliyapitiyaKurunegala
KaduruwelaDambulla
Galewela
Matale
Kandy
RikillagaskadaNawalapitiya
Nittambuwa
Godakawela
Ratnapura
Homagama
Kaduwela
Avissawella
NuwaraEliya
KegalleGaligamuwaNegombo
Ja-elaPugodaKirindiwelaKadawathaKandana
GanemullaGampaha
Kohuwala
Piliyandala
Kelaniya
MaharagamaMalabe Athurugiriya
PanaduraHorana
Aluthgama
Ambalangoda
Galle
Kalutara
Chilaw
DehiattakandiyaBatticaloa
Kaluvanchikudy
Ampara
Mahiyanganaya
Badulla
Bandarawela
WelimadaHattonMonaragala
Wellawaya
TissamaharamaEmbilipitiya
Ambalanthota
Balangoda
Matara
Akuressa
vAlUE CREATIOn AGAInST OUR CAPITAlS
Social and Relationship Capital
Branches
Collection centers & Others
Gold loan centers
Microfinance
Co-ordinating Offices
Geographical reach
0
2013
2014
2015
2016
2017
20
40
80
60
100
120
28
25
11
4
26
8
8
16
19
10
35
21
16
13
37
21
12
17
39
Nos

106 107
Alliance Finance Company PLC | Annual Report 2016/17
Overview Management Discussion & Analysis
Financial Reports Supplementary information
responsible lending practicesProduct & Service Labelling and Marketing communicationsWe practice responsible marketing communications and all information relevant to particular products, including interest rates on deposits, loans and lending rates are clearly communicated to customers. During the year under review, there were no instances of non-compliance to any relevant product and service related regulation or other guidelines. AFC’s marketing communications are designed to ensure compliance to all relevant regulatory requirements, ethics and branding guidelines. During the year there were no incidents of non-compliance to any regulations, voluntary codes or other guidelines pertaining to marketing communications.
Client protectionAs a micro-finance practitioner, we are committed to ensuring client protection and safeguarding customer interests. Accordingly, we comply with the International Client Protection principles published by the Smart Campaign, which is also a prerequisite for obtaining an M-CRIL rating for microfinance. The Standards specify 7 Client Protection Principles (listed below) and 25 standards of care.
Client protection principles
Appropriate product design and delivery
Prevention of over indebtedness
Transparency
Responsible pricing
Fair and respectful treatment of clients
Privacy of client data
Mechanism for complaints resolution
Protecting customer informationWe understand the obligation we have towards preserving the financial and personal information of our customers. During the year, the IT infruastructure was upgraded to a blade center thereby enabling the complete virtualization of the system; this has allowed for stronger and more holistic IT infrastructure. There were no substantiated complaints pertaining to the breach of customer privacy or loss of customer data during 2016/17.
Customer satisfaction
Ensuring the highest levels of customer service and satisfaction is a key focus in our customer value proposition. We continue to invest in strengthening employees’ product knowledge and soft skills with the objective of serving our customers better. Multiple platforms are in place to facilitate the measurement of customer satisfaction. These are,• Structured customer satisfaction surveys are carried out periodically by the RFS, Microfinance and
Deposit business lines while microfinance also carries out exit surveys
• Grievances presented to the customer hotline
• Mystery shopper initiative to gauge customer satisfaction in the branches
• Meanwhile structured and formalised systems are in place to manage customer queries and customer grievances as illustrated below;

108
Alliance Finance Company PLC | Annual Report 2016/17
Overview Management Discussion & Analysis
Financial Reports Supplementary information
Customer grievance handlingDuring the year under review we received 54 customer grievances, which were resolved during the period.
Operational units/BUsCustomer care deskCustomer satisfaction surveys
Investigation Review and assessment Correction/corrective action
Formal lettersOne on one meetingsMediation (financial ombudsman/CBSL)
Forward complaints to Agm/director
lodging the complaint
response
Customer education
Our group based microfinance value proposition extends beyond mere financial support to enhancing the socio-economic progress of impoverished families through developing financial literacy, life skills and entrepreneurial skills. Perfectly aligned with the Group’s triple bottom line approach, this holistic value proposition has enabled AFC to nurture a strong base of financially disciplined and socially empowered customers. The customer education services are conducted through a structured Entrepreneurial Development Service, which operates within the group based microfinance business line.
entrepreneurial development ServicesThe training programs are conducted as ongoing sessions throughout the island with every branch being required to conduct at least 1 training session per quarter. The sessions are coordinated through the respective branches and engage the services of external consultants and professionals when necessary. During the year under review we invested Rs. 1.2 million in 98 such programs which were carried out across the island with a total beneficiary base of over 2,400.
In addition to the trainings two medical camps were also conducted under the EDS program serving 223 benificiaries.
The training sessions that are conducted are two-fold;
Entrepreneurial
skills
This comprises training programmes aimed towards uplifting the general quality of life, such as financial literacy, health and hygiene, reproductive health and medical camps among others.
Aimed at introducing and developing knowledge on potential micro enterprises and ventures particularly cottage industries.
During the year we conducted numerous programmes on beauty culture, production of sweets, sewing, manufacturing bags, mushroom cultivation, manufacturing slippers, vegetable farming etc.
General life skills
vAlUE CREATIOn AGAInST OUR CAPITAlS
Social and Relationship Capital
Geographical reach
0
Apr-
16
Sep-
16
May
-16
Oct
-16
Jun-
16
Nov
-16
Jul-1
6
Dec
-16
Feb-
17
Aug-
16
Jan-
17
Mar
-17
2
4
8
6
10Nos
4 4
8
4
7
6
4
1
2
1
5
8

108 109
Alliance Finance Company PLC | Annual Report 2016/17
Overview Management Discussion & Analysis
Financial Reports Supplementary information
Topic of the training program no. of sessions
Total benefciaries
Financial Literacy 45 1,015Apparel & Garment 11 274Crop cultivation 8 254Goods manufacturing 6 126Slippers/Leather products 6 241Social Empowerment Programs 6 116Food and beverage production 7 157Animal Husbandry 4 163Beauty & Fashion 4 73Arts and crafts 1 23
Integrated Farming projectIn an innovative concept mirroring the Group’s triple bottom line approach, we launched a model Integrated Organic Farm in Nuwara Eliya during the year. Conceptualised with the objective of propagating sustainable agricultural practices among our group based microfinance customers, the Farm enables the cultivation of multiple crops thereby generating a source of secondary income to farmers. The Farm features a bio-gas unit which absorbs garden and other wastage to generate clean energy which is in turn used for cooking purposes. With an initial investment of Rs. 0.4 million the Farm is used as an effective platform to engage customers on the use of green energy, minimising wastage and spread awareness on the correct application of chemicals/fertilizers.
Integrated Organic Farming
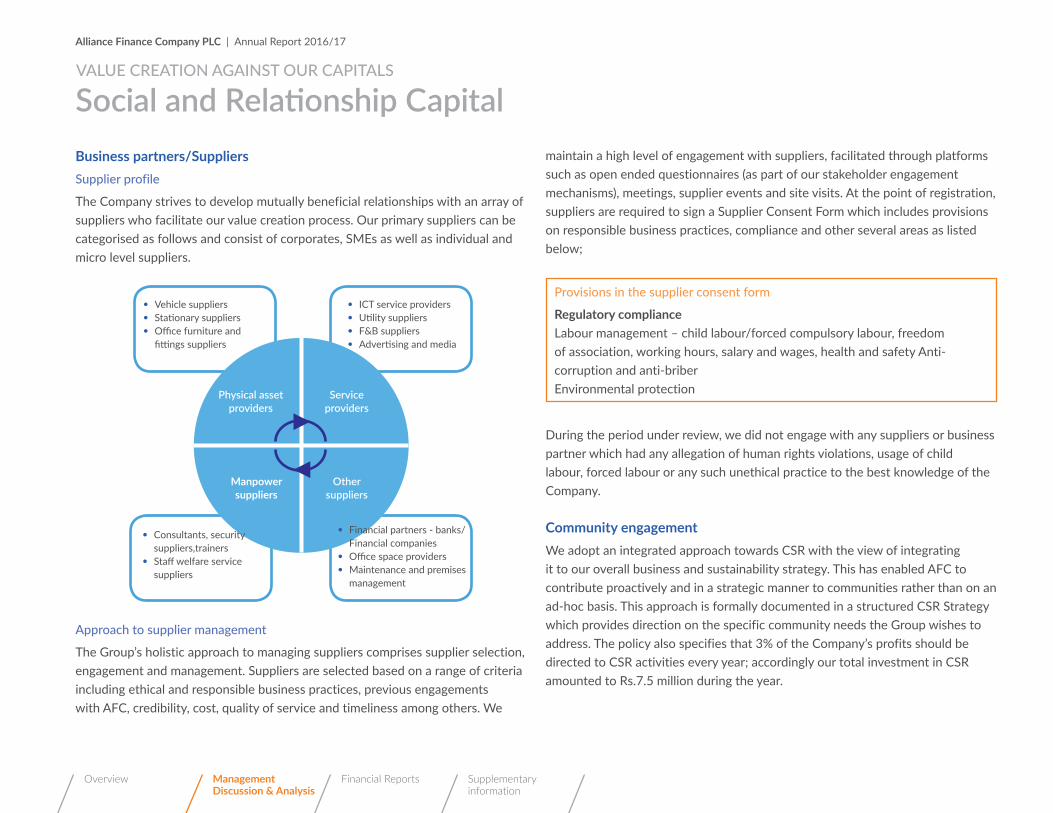
110
Alliance Finance Company PLC | Annual Report 2016/17
Overview Management Discussion & Analysis
Financial Reports Supplementary information
Business partners/SuppliersSupplier profile
The Company strives to develop mutually beneficial relationships with an array of suppliers who facilitate our value creation process. Our primary suppliers can be categorised as follows and consist of corporates, SMEs as well as individual and micro level suppliers.
Physical asset providers
Service providers
Other suppliers
manpower suppliers
• Vehicle suppliers• Stationary suppliers• Office furniture and
fittings suppliers
• Consultants, security suppliers,trainers
• Staff welfare service suppliers
• Financial partners - banks/Financial companies
• Office space providers• Maintenance and premises
management
• ICT service providers• Utility suppliers• F&B suppliers• Advertising and media
Approach to supplier management
The Group’s holistic approach to managing suppliers comprises supplier selection, engagement and management. Suppliers are selected based on a range of criteria including ethical and responsible business practices, previous engagements with AFC, credibility, cost, quality of service and timeliness among others. We
maintain a high level of engagement with suppliers, facilitated through platforms such as open ended questionnaires (as part of our stakeholder engagement mechanisms), meetings, supplier events and site visits. At the point of registration, suppliers are required to sign a Supplier Consent Form which includes provisions on responsible business practices, compliance and other several areas as listed below;
Provisions in the supplier consent form
regulatory complianceLabour management – child labour/forced compulsory labour, freedom of association, working hours, salary and wages, health and safety Anti-corruption and anti-briberEnvironmental protection
During the period under review, we did not engage with any suppliers or business partner which had any allegation of human rights violations, usage of child labour, forced labour or any such unethical practice to the best knowledge of the Company.
Community engagementWe adopt an integrated approach towards CSR with the view of integrating it to our overall business and sustainability strategy. This has enabled AFC to contribute proactively and in a strategic manner to communities rather than on an ad-hoc basis. This approach is formally documented in a structured CSR Strategy which provides direction on the specific community needs the Group wishes to address. The policy also specifies that 3% of the Company’s profits should be directed to CSR activities every year; accordingly our total investment in CSR amounted to Rs.7.5 million during the year.
vAlUE CREATIOn AGAInST OUR CAPITAlS
Social and Relationship Capital
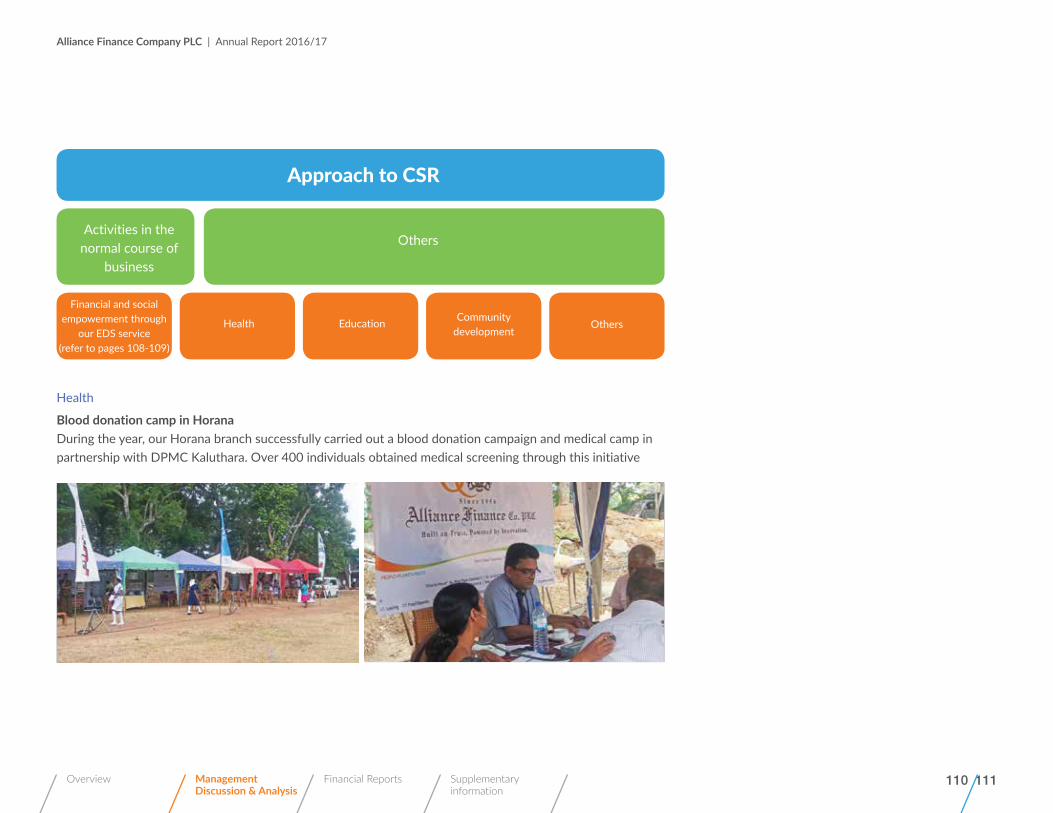
110 111
Alliance Finance Company PLC | Annual Report 2016/17
Overview Management Discussion & Analysis
Financial Reports Supplementary information
Approach to CSR
Activities in the normal course of
business
Financial and social empowerment through
our EDS service (refer to pages 108-109)
Health Education Community development
Others
Others
Health
Blood donation camp in HoranaDuring the year, our Horana branch successfully carried out a blood donation campaign and medical camp in partnership with DPMC Kaluthara. Over 400 individuals obtained medical screening through this initiative

112
Alliance Finance Company PLC | Annual Report 2016/17
Overview Management Discussion & Analysis
Financial Reports Supplementary information
Education
• Ongoing support to the ratnapura Sethmini CSr Program
Carried out in partnership with Caritas Ratnapura as an ongoing initiative, we have partnered the Sethmini CSR foundation to support schools with improving access to water supply, sanitation and toilet facilities and the development of library facilities among others.
• youth encounter on Sustainable marketing
We partnered the Department of Marketing Management of the University of Kelaniya to assist in the publications of the Department’s events and activities through mass media. This enables the Company to share its knowledge in the sphere of marketing with the objective of generating future marketing leaders.
Community development
• tree Planting
We have committed towards planting one million endemic plants in each city with the objective of enhancing bio diversity and contributing towards the overall reduction of emissions. As the second phase of this project we have sponsored notice boards displaying city limits in nearly 24 districts island-wide.
• Pareigama village development
AFC partnered the undergraduates of the University of Sri Jayewardenepura, to provide access to drinking water to the students of Pareigama Maha Vidyalaya. Through this program we contributed towards the construction of a sink area in the school premises and provided sports equipment and facilities.
vAlUE CREATIOn AGAInST OUR CAPITAlS
Social and Relationship Capital
Improving Access to Water Supply
Kelaniya University Sustainable Marketing Tie-Up
Sponsored for Notice Boards Displaying in City Limits
Providing Sports Equipment and Drinking Water Facility

112 113
Alliance Finance Company PLC | Annual Report 2016/17
Overview Management Discussion & Analysis
Financial Reports Supplementary information
Others
• Flood relief: During the extreme flooding conditions in 2016, AFC stepped up to support its own affected employees and the general public affected by flooding. Further, Managing Director and other senior management team members along with AFC staff members contributed to raise a fund to assist flood relief effort to give helping hand to the needy people. We distributed dry food, Medicine, Hygiene products, cloths and baby products joined hands with “Manusath Derana” flood relief programme. In addition to that, we donated shoes and stationary items to the students from flood affected families of Gothatuwa Maha Vidyalaya.
• In the Kurunegala branch, we gifted a plant to all customers who visited the branch on the 1st day of 2017
Industry networksAs one of Sri Lanka’s oldest and most respected LFCs, we are cognisant of the role we have to play in supporting the development of a profitable, sustainable and conducive industry environment. As such, AFC is an active participant in numerous industry forums, with several members of the senior management team holding positions in industry associations. During the year AFC initiated proceedings to generate a platform for effective engagement among microfinance lenders, there facilitating the formulation of a voluntary code of ethics among microfinance institutions and the introduction of best practices to ensure client protection and principle-based lending.
Industry associations in which AFC holds membershipLeasing Association of Sri LankaNational Chamber of CommerceFinance Houses Association of Sri Lanka
Flood Relief Program
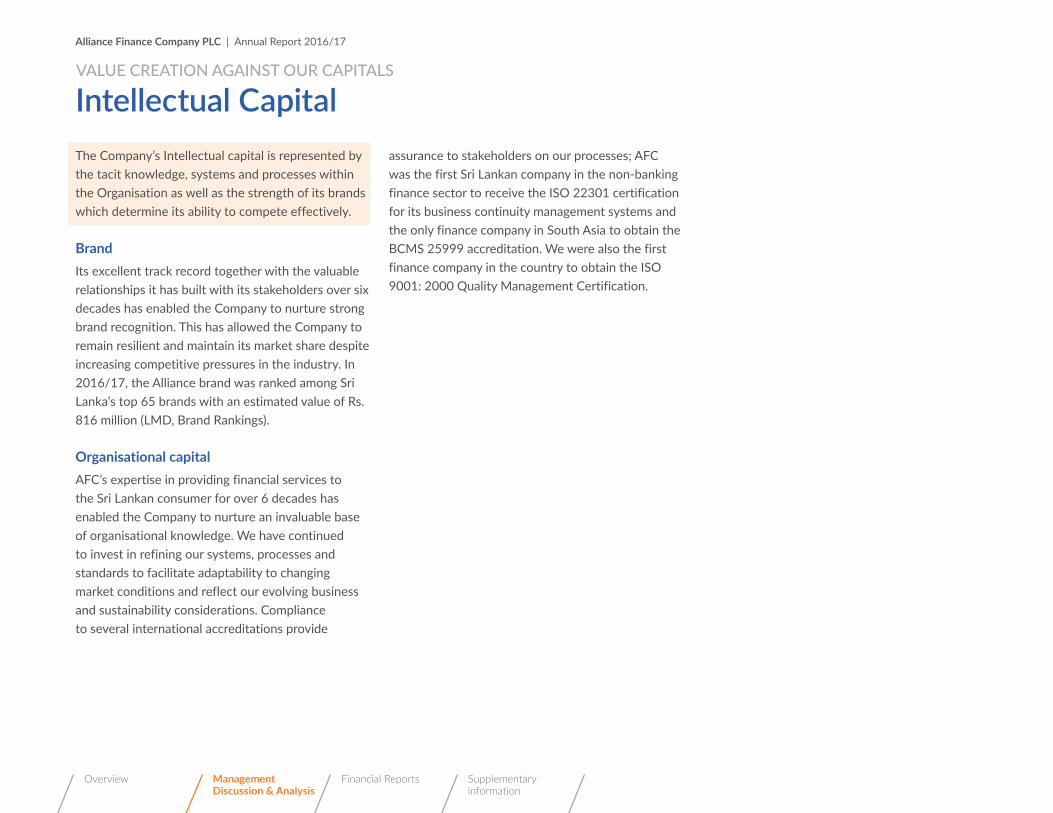
114
Alliance Finance Company PLC | Annual Report 2016/17
Overview Management Discussion & Analysis
Financial Reports Supplementary information
The Company’s Intellectual capital is represented by the tacit knowledge, systems and processes within the Organisation as well as the strength of its brands which determine its ability to compete effectively.
BrandIts excellent track record together with the valuable relationships it has built with its stakeholders over six decades has enabled the Company to nurture strong brand recognition. This has allowed the Company to remain resilient and maintain its market share despite increasing competitive pressures in the industry. In 2016/17, the Alliance brand was ranked among Sri Lanka’s top 65 brands with an estimated value of Rs. 816 million (LMD, Brand Rankings).
Organisational capitalAFC’s expertise in providing financial services to the Sri Lankan consumer for over 6 decades has enabled the Company to nurture an invaluable base of organisational knowledge. We have continued to invest in refining our systems, processes and standards to facilitate adaptability to changing market conditions and reflect our evolving business and sustainability considerations. Compliance to several international accreditations provide
assurance to stakeholders on our processes; AFC was the first Sri Lankan company in the non-banking finance sector to receive the ISO 22301 certification for its business continuity management systems and the only finance company in South Asia to obtain the BCMS 25999 accreditation. We were also the first finance company in the country to obtain the ISO 9001: 2000 Quality Management Certification.
vAlUE CREATIOn AGAInST OUR CAPITAlS
Intellectual Capital

114 115
Alliance Finance Company PLC | Annual Report 2016/17
Overview Management Discussion & Analysis
Financial Reports Supplementary information
As an industry pioneer in adopting the tripe bottom line approach, we remain passionate about the preservation and enrichment of our natural capital although our direct impacts on the environment are relatively limited.
Our approach to environmental managementAs a responsible corporate entity, we are committed towards preserving and enriching our natural environment as we pursue sustainable and responsible growth. Driven by the underlying concept of “Greener and Cleaner environment”, we have increasingly focused on four main areas namely electricity, water, paper and fuel consumption. The objectives of our environment management strategy are fourfold namely reducing emissions, efficient use of natural resources such as energy and water, minimizing negative environmental impacts and increasing awareness among employees. In recent years, we have strengthened the mechanisms in place to monitor environmental indicators, thereby allowing the proactive identification of potential areas for improvement. As testament to our commitment, we invested 31% of our CSR spend on environment sustainability initiatives during the year.
Our Approach Achievements in 2016/17
Minimising our natural inputsElectricitySignificance: The energy sector in Sri Lanka contributed to 40% of emissions in 2011.1
Replaced CFL bulbs with more energy efficient LED bulbs. Focused on replacing conventional ACs with inverter type energy efficient ACs to reduce costs and minimize environmental impact. We plan to convert all conventional ACs to invertor type. ‘AFC Green Pledge’, a pledge undertaken by the Company during the previous financial year to reduce energy consumption by 5% in 2016/17.
All new bulbs purchased were LED in addition to an increasing number of branches converting to LED from CFL bulbs.Currently 75% of our ACs are inverter type energy efficient ACs.Electricity consumption declined by (7%) in 2016/17 to 374,526 Kwh, despite an increase in operational activity.AFC pledge for the year 2017/18 focuses on reducing energy consumption by 5% and paper consumption by 10%.
Fuel We started monitoring fuel consumption across all branches and head office. We owned 09vehicles including hybrid cars used for company transportation purposes.
Fuel consumption from both vehicles and generators amounted to 13,850 Liters. Diesel and petrol amounted to 31% and 69% of fuel consumption.
Water We started monitoring water consumption during the year.
Nearly 12,822 Liters of water was consumed during the year.
Minimize paper usage Reduced paper usage with the underlying objective of moving towards a paperless office.
Recycled 1,576 kg of waste paper during the year.
vAlUE CREATIOn AGAInST OUR CAPITAlS
Natural Capital

116
Alliance Finance Company PLC | Annual Report 2016/17
Overview Management Discussion & Analysis
Financial Reports Supplementary information
Our Approach Achievements in 2016/17
Managing our natural outputs and impactsWaste includes waste paper and e-waste
Engaged in paper recycling initiatives. Recycled 1,576 kg of waste paper during the year.
Minimizing negative impact on environment and climate
Tree for lease initiative- Under this we plan to plant 100,000 trees over the next five years. Screening of customers for environmental critiera such as compliance with CEA licenses and no social and human right violations.
To date we have planted 15,800 trees in Deduru Oya and Hiniduma supporting the initiative of the Rotary club – ‘Pledge to plant a tree for every lease given”.We use the IFC exclusion list to ensure that we do not grant any loans that are environmentally or socially harmful. We plan on implementing an Environment and Social Management system (ESMS) that will improve our customer screening process and reduce environment and social risks.
Reducing Carbon EmissionsReducing carbon emissions Significance: Sri Lanka aims to reduce GHG emissions by 7% to 2030 with energy being a focal point. 2
Testing of gas conversion kits developed by Viallle-Netherlands, a renowned emission reduction gas kit manufacturer in Europe.
Increasing financing of hybrid vehicles and Electric cars.
The test kit was installed in three wheelers and further testing is scheduled along with planned modification to the kit, compared to three in the previous year.
618 hybrids and electric cars were financed during the year, which is a 30% increase compared to previous year.
vAlUE CREATIOn AGAInST OUR CAPITAlS
Natural Capital
A Tree for Lease

116 117
Alliance Finance Company PLC | Annual Report 2016/17
Overview Management Discussion & Analysis
Financial Reports Supplementary information
Our Approach Achievements in 2016/17
Engaging employees in environmental managementIncreasing awareness of employees
Focused on initiatives to increase employee engagement in environment management. Planned investment in ESMS of EUR 36,500 (Rs. 5.1mn).
Under ’AFC Green Pledge’ concept, the pledge of the year was circulated to all employees which consisted of energy saving initiatives, electricity usage and monthly reduction rates. ESMS will increase employee commitment as the impact will be measured and monitored.
1. USAID_ https://www.climatelinks.org/resources/greenhouse-gas-emissions-factsheet-sri-lanka2. US AID_ https://www.climatelinks.org/resources/greenhouse-gas-emissions-factsheet-sri-lanka
Potential impacts of climate change: Climate Change
The main implication of adverse weather conditions such as floods and landslides is that customers in the Agriculture sector and affected areas may not be able to meet debt obligations on time. In addition, demand from the Agriculture sector, which is susceptible to erratic weather conditions would be impacted. Agriculture loans accounted for 38% of the group based microfinance portfolio during the year. The adverse climate changes that occurred during the year had a direct impact on the NPL of the Agriculture portfolio. Though we have not estimated the financial implications of climate change on our business operations, we have undertaken measures to reduce its impact to the environment and climate.
managing our inputsEnergy
Electricity and fuel are the main sources of energy used in the day to day operations. Electricity is mainly used to power up office equipment and lighting purposes. Fuel is consumed by company-owned vehicles and generators. We have continued to widen the scope of our energy measurement mechanisms and the energy consumption of the head office was monitored during the year.
2015/16 2016/17
Units (Kwh) 404,723 374,526Intensity (Units/employee) 1,212 1,105Cost (LKR) 10,163,741 9,482,551Intensity (cost/employees) 30,430 27,972
Focus on reducing electricity consumption from our business operations is an important element of our sustainability goals. AFC’s Green pledge aims to reducing energy consumption by 5% during 2016/17 and we are happy to have exceeded our targets during the year. With increasing number of branches

118
Alliance Finance Company PLC | Annual Report 2016/17
Overview Management Discussion & Analysis
Financial Reports Supplementary information
shifting to LED bulbs and increasing awareness among employees on minimizing electricity usage, the consumption of electricity declined by (7%) during the year. In addition to monitoring consumption levels, monthly monitoring reports were shared with employees to enhance awareness and engage employees in our efforts.
Fuel2016/17
Units (Litres) 13,850Intensity (Units/employee) 41Cost (LKR) 1,617,916Intensity (cost/employees) 4,773% of fuel cost from vehicle usage 83%% of fuel cost from generators 16%
During the year, we monitored the fuel consumption. At the head office Fuel consumption was subdivided between vehicles and generators. Nearly 83% of fuel consumption stemmed from vehicle usage. Client visits, business visits, traveling between branches and training visits were the most frequent trips undertaken.
water
We have initiated monitoring water consumption at the head office for the first time. At the premises, bottled mineral water is used for drinking purposes and tap water obtained from the municipal council is used for other water requirements. In the next year this monitoring and control process will be expanded to all branches.
2016/17
Units (Liters) 12,822Intensity (Units/employee) 38Cost (LKR) 1,393,438Intensity (cost/employees) LKR 4,110
managing our outputswaste
Key types of waste generated from our operations are paper waste and e-waste. Paper recycling initiatives enabled us to responsibly dispose 1,576 Kg of paper waste during the year. However, in the long -term we focus on shifting to a ‘paperless office’ using measures such as encouraging electronic communication, engaging in paper saving initiatives and reducing paper usage. Some of the initiatives we continued to focus on include:• Encouraging the usage of SMS services instead of mailing in areas such as
reminder letters to customers.
• Scanning of customer documents instead of maintaining physical files.
• Usage of printers that enables double sided printing.
• Usage of one color envelopes.
• Reduced unnecessary document copy printing.
• Increasing employee awareness on minimizing paper usage in printing.
• Reducing the paper size of letters and other documents sent to customers
vAlUE CREATIOn AGAInST OUR CAPITAlS
Natural Capital

118 119
Alliance Finance Company PLC | Annual Report 2016/17
Overview Management Discussion & Analysis
Financial Reports Supplementary information
Carbon footprintThe ultimate goal of our environmental management framework is achieving a reduction in our carbon emissions.
To this end, we have focused on, 1. Increase financing for Hybrids and Electric cars
accounting for 16% of Four-wheeler leasing portfolio.
2. Introducing new green solutions for three wheelers using the emission reduction solution that was implemented last year. The testkit has been designed in collaboration with Vialle of Netherlands, a renowned emission reduction gas kit manufacturer in Europe. During year, two numbers of three wheelers were sent to The Netherlands for testing.
Compliance
Corporate customers were screened for compliance using IFC exclusion list and ensuring conformity to environmental licensees such as CEA. The ESMS will further improve our customer screening process on implementation.
Products and services
As a financial services provider, we believe the most significant environmental value addition we can make is through ensuring that businesses financed by us are conscious of their environmental impacts. We undertook the following initiatives with the objective of extending our environmental focus to products and services:
• Screening of customers for environmental and social factors using IFC exclusion list
• Introduction of new green solutions to three wheelers with a view of reducing emission levels.
• Initiatives to implement ESMS to improve customer screening process and reduce environment and social risks.
• Increase leasing of hybrid and electric cars. Leasing of hybrid and electric cars increased by 48% during the year and accounted for 16% of the four wheeler leasing portfolio.
way forward
Environmental management will continue to be an integral part of our sustainability agenda and will be driven by the four main areas of our environmental management strategy. The planned implementation of an integrated and holistic ESMS system will provide a strong platform for employee and customer engagement, propagation of sustainable environment practices and enable the continuous monitoring of environmental indicators. This will enable us to actively pursue our growing urge of responsible growth.

120
Alliance Finance Company PLC | Annual Report 2016/17
Overview Management Discussion & Analysis
Financial Reports Supplementary information
Making sustainability profitable
Our Triple Bottom Line approach to enterprise is not simply about us staying abreast of global trends in business. We truly believe that the sustainability of an entity’s profits ultimately depend on the sustainability of the community and the environment that it is a part of. This is our motivation behind our uncompromising dedication to reducing income disparities that exist between the Western province and the rural hinterlands of the country.

121 121
Alliance Finance Company PLC | Annual Report 2016/17
Overview Management Discussion & Analysis
Financial Reports Supplementary information

122
Alliance Finance Company PLC | Annual Report 2016/17
Overview Management Discussion & Analysis
Financial Reports Supplementary information
Financial InformationAnnual Report of the Directors 123Report by the Board on Internal Control 127Directors’ Responsibility for Financial Reporting 128Report of the Audit Committee 129Independent Auditors’ Report 131Statement of Profit or Loss 132Statement of Comprehensive Income 134Statement of Financial Position 135Statement of Changes In Equity 137Statement of Cash Flows 139Significant Accounting Policies 141Notes to the Financial Statements 163

122 123
Alliance Finance Company PLC | Annual Report 2016/17
Overview Management Discussion & Analysis
Financial Reports Supplementary information
Annual Report of the Directors
The Board of Directors of Alliance Finance Company PLC is pleased to present the Annual Report of the Directors together with the Audited Statement of Accounts of the Company for the financial year ended 31st March 2017.
Board of Directors StructureAs at the Balance Sheet date the Board is comprised of four Non Executive Directors and two Executive Directors. The offices held by the Executive are Managing Director and Executive Director Sustainability. Subsequent to the Balance Sheet, Mr. W.P.K. Jayawardana was appointed, Consultant Director Finance and Operations who was appointed on 4th April 2017 in the Non-Executive capacity. The appointment was made to further strengthen the functions of the Finance Department and to give impetus to the performance by improving operational efficiencies.
There were no resignations during the year under review.The profiles of the Directors appear on pages 37 to 38.
Executive Non Executive Independent Non ExecutiveMr. R.K.E.P. de Silva – Deputy Chairman & Managing Director
Mrs. R.N. Ponnambalam Mr. S.K. Karunanayake
Mr. J.M. Gunasekera – Executive Director Sustainability
Mr. L.A.P. Medis – Consultant Director Marketing
Mr. A.R. Samarasinghe
Mr. W.K.P. Jayawardana – Consultant Director Finance and Operations
Principal Activities The Company’s performance improved along the principal Lines of Business during the year under review. Whilst moderated growth was witnessed in the growth of some product lines others performed well. The growth was in keeping with our business model for the financial year and in keeping with the budget. Business expansion was stymied due to regulatory and market conditions despite the Company has performed well.
The product portfolio with contributions from some namely Consumer Durable Finance, Collaboration Finance, Import Finance, Real Estate, General Trading and Share Portfolio Management remained unchanged.
The Company continued to enjoy infusion of foreign funding from Triodos BV Netherlands in the form of Senior Debt of USD six million and a noteworthy accomplishment was their lending USD 4 Mn as Sub Debt. Symbiotics, Switzerland also extended credit to the value of USD 10 Mn.
Management Discussion and AnalysisAn in depth analysis of the Company’s performance and attributes is extensively covered in this review with overall assessment of the Company’s Financial position and performance during the year, with comments on Financial results and special events that occurred.
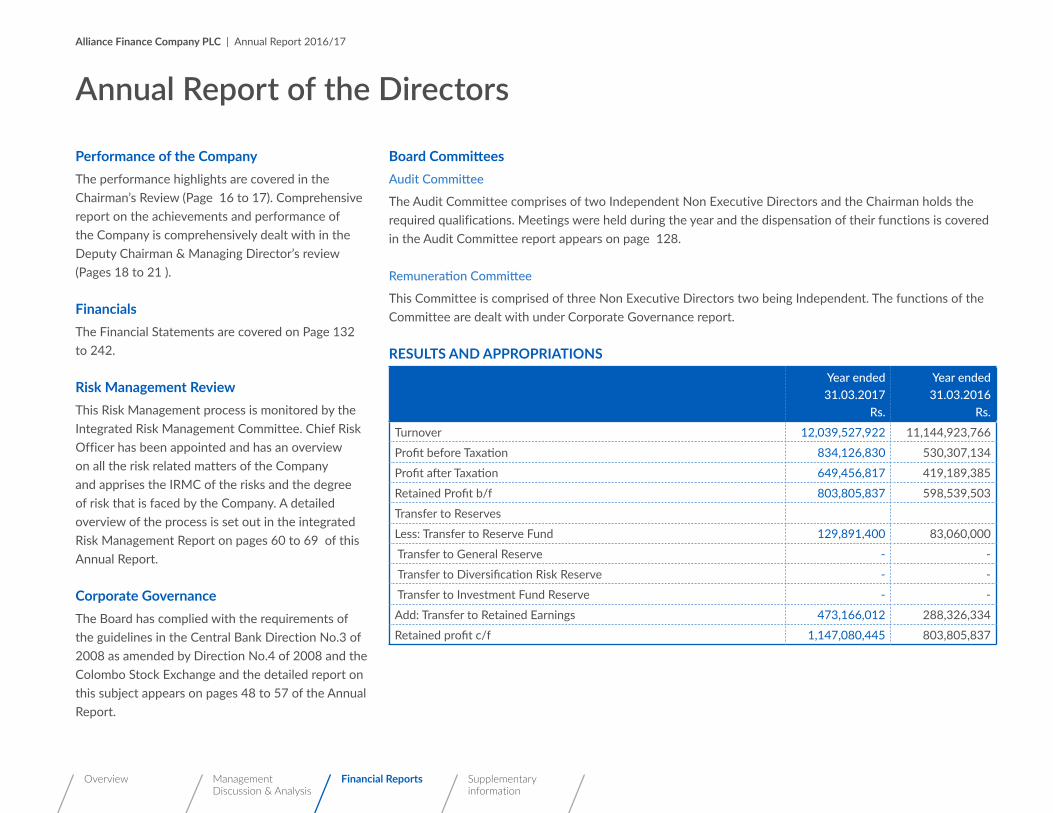
124
Alliance Finance Company PLC | Annual Report 2016/17
Overview Management Discussion & Analysis
Financial Reports Supplementary information
Performance of the CompanyThe performance highlights are covered in the Chairman’s Review (Page 16 to 17). Comprehensive report on the achievements and performance of the Company is comprehensively dealt with in the Deputy Chairman & Managing Director’s review (Pages 18 to 21 ).
FinancialsThe Financial Statements are covered on Page 132 to 242. Risk Management ReviewThis Risk Management process is monitored by the Integrated Risk Management Committee. Chief Risk Officer has been appointed and has an overview on all the risk related matters of the Company and apprises the IRMC of the risks and the degree of risk that is faced by the Company. A detailed overview of the process is set out in the integrated Risk Management Report on pages 60 to 69 of this Annual Report.
Corporate Governance The Board has complied with the requirements of the guidelines in the Central Bank Direction No.3 of 2008 as amended by Direction No.4 of 2008 and the Colombo Stock Exchange and the detailed report on this subject appears on pages 48 to 57 of the Annual Report.
Board CommitteesAudit Committee
The Audit Committee comprises of two Independent Non Executive Directors and the Chairman holds the required qualifications. Meetings were held during the year and the dispensation of their functions is covered in the Audit Committee report appears on page 128.
Remuneration Committee
This Committee is comprised of three Non Executive Directors two being Independent. The functions of the Committee are dealt with under Corporate Governance report.
RESULTS AND APPROPRIATIONS Year ended
31.03.2017Rs.
Year ended 31.03.2016
Rs.Turnover 12,039,527,922 11,144,923,766
Profit before Taxation 834,126,830 530,307,134
Profit after Taxation 649,456,817 419,189,385
Retained Profit b/f 803,805,837 598,539,503
Transfer to Reserves
Less: Transfer to Reserve Fund 129,891,400 83,060,000
Transfer to General Reserve - -
Transfer to Diversification Risk Reserve - -
Transfer to Investment Fund Reserve - -
Add: Transfer to Retained Earnings 473,166,012 288,326,334
Retained profit c/f 1,147,080,445 803,805,837
Annual Report of the Directors

124 125
Alliance Finance Company PLC | Annual Report 2016/17
Overview Management Discussion & Analysis
Financial Reports Supplementary information
DividendsThe Board of Directors has recommended an Interim Dividend of Rs. 3.70 which was paid out in March 2017 and have further recommended a Final Dividend of Rs.2.20 per share. The Directors confirm that the Company satisfies the Solvency Test set out in Section 56 of the Companies Act No. 2007. The Certificates of Confirmation was obtained from the Auditors in respect of the paid and proposed Dividends.
Reserves The Directors have transferred Rs. 130 mn to the Reserve Fund as required by section 3(b) of the Central Bank, Finance Companies (Capital fund) direction No.1 of 2003. The Reserves including Retained Earnings stand Rs. 3,450 mn at the close of the financial year.
RatingOur rating agency Fitch Rating assigned to the Company is BB+ with a stable outlook.
Issue of DebenturesThere were no new Debenture Issue during the year under review.
Stated CapitalDuring the year under review after having considered the strategic positioning and the future direction of the Company the Capital structure was changed as given below.
The Shares were split in the proportion of 1:10 thereby the existing number of shares were increased from 2,430,000 to 24,300,000 after the split. On the increased number of Ordinary Shares upon Capitalization of Rs.518.4 million of the Reserves in the proportion of 1 share for every 3 shares held, 8,100,000 Ordinary Shares were issued, taking the total number of Shares in Issue to 32,400,000 and the Stated Capital to Rs.542.7 million. Thereafter on the base of 32,400,000 shares, a Rights Issue took place where one share was issued for every twenty five shares held and the number of shares in issue increased to 33,696,000 and the Stated Capital increased to Rs.613.98 million.
Shareholders’ InformationThe detailed Shareholders’ information appear on page 252 and 253 of the Annual Report.
Twenty Major ShareholdersThe names and number of shares of the 20 major shareholders appear on page 253.
Public HoldingThe public holding percentage appears on page 253
Share Information Information with regard to Dividend per Share, Dividend Pay Out and Net Asset Value per share and Market Value per appears in the ten year summary on Page 250 to 251.
Directors’ Interest in Contracts Director’s interests in contracts of the Company have been set out in the Notes to the Accounts. These interests have been disclosed at Directors’ Meetings. They have no direct or indirect interest in any other existing or proposed contract with the Company.
Related Party TransactionsThe required disclosures have been made. The details appear on pages 224 to 226.
Re-Election of DirectorsMr. W.P.K. Jayawardna who was appointed during the year retires under Article number 135 and offers himself for re-election with the unanimous support of the Directors.
Directors’ Remuneration The Directors’ remuneration is disclosed under Notes to the Financial Statements on page 224.

126
Alliance Finance Company PLC | Annual Report 2016/17
Overview Management Discussion & Analysis
Financial Reports Supplementary information
Directors’ ShareholdingsDirectors’ shareholdings as at the beginning and end of the financial year are given below
Name 31.03.2017 31.03.2016Mr. S. Karunanayake 1,586 119
Mr. R.K.E.P. de Silva 8,934,075 640,068
Mrs. R.N. Ponnambalam 2,666 200
Mr. A.R. Samarasinghe 1,386 100
Mr. J.M. Gunasekera 1,500 N/A
Dr. L.A.P. Medis (appointed 9th August 2016)
--- N/A
Mr. W.P.K. Jayawardana (appointed on 4th April 2017)
Shareholdings in Associate CompaniesThe Company has no subsidiaries and the holdings in the Associate Companies are given below.
Name of the Company No. of Shares as at 31.03.2017
Percentage
Alfinco Insuarnce Brokers (Pvt) Ltd
159,836 64%
Macbertan (Pvt) Ltd 1,720,000 30%
Alliance Tech Trading (Pvt) Ltd
20,000 40%
Employee Share OwnershipThe Company has not implemented and Employee Share Ownership scheme.
Properties of the Company RestateThe value of freehold properties owned by the Company as at 31st March 2017 is included in the accounts at Rs. 1,706,918,419/- (31st March 2016 – Rs. 922,326,403) based on valuations undertaken by Ms. W.A.T.P. Jayathilka & Company and Ms. K.T. Nihal & Company being independent professional valuers with recent experience in the location category of the property being valued. The Directors are of the opinion that this value is not in excess of the current market value. The details are provided in the page No.196 in the Financial Statements.
DonationsThe Company donated a sum of Rs. 2,735,113 during the year under review.
Annual Report of the Directors
AuditorsThe Auditors M/s. HLB Edirisinghe & Co. Chartered Accountants, of 45, Braybrooke Street, Colombo 2, have audited the accounts as at 31st March, 2017. The re-appointment rests in your hands they have offered their services at an all inclusive fee of Rs. 913,100 for the ensuing year.
By Order of the Board of Directors
(Sgd)ALLIANCE MANAGEMENT SERVICES (PVT) LTDSecretaries
30th May 2017
126 127
Alliance Finance Company PLC | Annual Report 2016/17
Overview Management Discussion & Analysis
Financial Reports Supplementary information
Report by the Board on Internal Control
Internal Control and Responsibility of the BoardInternal control could be broadly defined as a process that is implemented by an entity’s Board of Directors and Management designed to provide reasonable assurance regarding the achievement of objectives in the following categories:
1. Effectiveness and efficiency of operations, systems and controls and the identification and mitigation of risks.
2. Reliability of management information and financial reporting.
3. Compliance with applicable laws and regulations
The first objective deals with the Company’s basic business objectives, including performance and profitability goals and safeguarding of resources by the identification of risks. The second relates to the reliability and management of information and also preparation of reliable published financial statements, including interim and final financial statements. The third aspect deals with complying with those laws and regulations which are applicable to the Company. These three areas although intrinsically different, overlap in certain categories but addresses different needs.
The Board of Directors is responsible for the structuring and effectiveness of the internal control and also the continuous reviewing and revamping of the existing systems and controls.
The Company has a structured, proactive risk management system. A risk and control framework has been developed, based on good governance principles and is dealt with in greater detail in the Annual Report. This framework focuses on material strategic, operational, compliance and financial reporting risks. Using this framework , the business units go through a systematic process of identifying and evaluating risks and controls and, where necessary, improving the way in which risks are managed. The above processes make the risks and the areas requiring improvement in the internal control systems transparent.
Process of EvaluationThe Board has an established process by which the effectiveness of the risk management and internal control systems are reviewed. This process enables the Board and its Committee to consider the systems of risk management and internal control being operated for managing significant risks, including strategic, safety, operational, compliance and control risks, throughout the year.
In considering the systems, the Board noted that such systems are designed to manage, rather than eliminate, the risk of failure to achieve business objectives and can only provide reasonable, and not absolute, assurance against material misstatement or loss.
During the year, the Board through its Committee regularly reviewed the executive management processes whereby risks are identified, evaluated and managed.
External Auditors’ Statement The External Auditors have reviewed the above Directors’ Statement on internal control for the year ended 31st March 2017 and reported to the Board that nothing has come to their attention that causes them to believe that the statement is inconsistent with the understanding of the process adopted by the Board in the review of the design and effectiveness of the internal control system over the financial reporting of the Company.
S. Karunanayake Chairman - Audit Committee
Romani de SilvaDeputy Chairman and Managing Director
30th May 2017.
128
Alliance Finance Company PLC | Annual Report 2016/17
Overview Management Discussion & Analysis
Financial Reports Supplementary information
The following statement sets out the responsibilities of the Directors in relation to the preparation and presentation of the Financial Statements of the Company as per Section 150 (1) of the Companies Act No. 07 of 2007.
Accordingly, the Directors confirm that the Company’s Financial Statements for the year ended 31st March 2017 are prepared in conformity with the requirements of the Sri Lanka Accounting Standards, the regulations and directions of the Central Bank of Sri Lanka, the listing rules of the Colombo Stock Exchange and the Finance Companies Act no.42 of 2011.They believe that the Financial Statements present a true and fair view of the state of affairs of the Company at the end of the financial year.
The Directors also accept responsibility for the integrity and accuracy of the Financial Statements presented and confirm that appropriate accounting policies have been selected and applied consistently and reasonable and prudent judgement has been exercised so as to accurately report transactions.
The Directors have taken reasonable steps to ensure that the Company maintains adequate general supervision, control and administration of the affairs and business of the Company to safeguard the assets of the Company, to prevent, deter and detect fraud , to ensure the integrity, accuracy and safeguarding of operational and financial records.
The Directors confirm that to the best of their knowledge, all statutory payments due in respect of the Company as at the Balance Sheet date have been paid for, or where relevant, provided for.
The External Auditors, Messrs Baker Tilly Edirisinghe & Company , were provided with the opportunity to make appropriate inspections of financial records, minutes of Shareholders’ and Directors’ meetings and other documents and carry out review and sample check on the system of internal controls as they consider appropriate and necessary to enable them to form an opinion of the Financial Statements. The Report of the Auditors is set out on page 130.
By order of the Board
(Sgd)Alliance Management Services (Pvt) LtdSecretaries
30th May 2017
Directors’ Responsibility for Financial Reporting

128 129
Alliance Finance Company PLC | Annual Report 2016/17
Overview Management Discussion & Analysis
Financial Reports Supplementary information
This report is provided by the Audit Committee, in respect of the financial year ended 31st March 2017. The Committee’s operation is guided by a detailed mandate that is approved by the Board which is detailed in the Terms of Reference. The Committee is appointed by the Board and is comprised of two Independent Non-Executive Directors.
Mr. Sunil Karunanayake - ChairmanMr. A.R. Samarasinghe - Member
Executive FunctionsThe Audit Committee has executed its duties and responsibilities during the financial year in accordance with its Terms of Reference and related to the matters of Company’s internal and external audit processes, financial reporting, risk assessment and internal controls over financial reporting and the internal audit process.
External Auditors and auditDuring the year under review the Committee, amongst other matters, considered the following:• Approved the reappointment of Baker Tilly
Edirisinghe & Co., External Auditors for the financial year ended 31 March 2018
• Approved the external auditors’ terms of engagement, the audit plan and budgeted audit fees payable
• Reviewed the audit and evaluated the effectiveness of the audit
• Obtained assurance from the auditors that their independence was not impaired
• It was noted that non-audit services were not provided by the External Auditors
In respect of Financial Statements• Examined and reviewed the interim and
annual financial statements as well as financial information disclosed to the public prior to submission and approval by the Board.
• Reviewed reports on the adequacy of the portfolio and specific impairments and impairment of other assets, and the formulae applied in determining charges for and levels of portfolio impairments.
• Ensured that the annual financial statements fairly present the financial position of the Company and the Group as at the end of the financial year and the results of operations and cash flow for the financial year and considered the basis on which the Company and the Group was determined to be a going concern
• Considered the appropriateness of the accounting policies adopted and changes thereto
• Reviewed and discussed the external auditors’ audit report
• Considered and made recommendations to the Board on the interim and final Dividend payments to Shareholders
• Noted that there were no material reports or complaints received concerning accounting practices, internal audit, internal financial controls, content of annual financial statements, internal controls and related matters
In Respect of Internal Control and Internal Audit • Reviewed and approved the annual internal
audit mandate and audit plan and evaluated the independence, effectiveness and performance of the Internal Audit Department and compliance with its mandate
• Considered reports of the Internal and External Auditors on the Group’s systems of internal control, including internal financial controls and maintenance of effective internal control systems;
• Reviewed significant issues raised by the internal audit processes and the adequacy of corrective action in response to such findings
• Reviewed significant differences of opinion between the internal audit function and management and noted that there were none
• Assessed the adequacy of the performance of the internal audit function and adequacy of the available internal audit resources and found them to be satisfactory
• Received assurance that proper and adequate accounting records were maintained and that the systems that safeguard the assets had been fulfilled
Report of the Audit Committee

130
Alliance Finance Company PLC | Annual Report 2016/17
Overview Management Discussion & Analysis
Financial Reports Supplementary information
Based on the above, the committee formed the opinion that at the date of this report there were no material breakdowns in internal control, including internal financial controls, resulting in any material loss to the Group.
The Internal Audit function is carried out by an Internal Audit Department and is headed by Assistant General Manager Internal Audit who possesses the necessary experience and expertise.
In respect of legal and regulatory requirements, to the extent that they may have an impact on the financial statements:• Monitored compliance with the Companies
Act, Finance Business Act and other relevant enactments;
• In respect of risk management and information technology
• Considered and reviewed reports from management on risk management, including fraud risks and information technology risks as they pertain to financial reporting and the going concern assessment;
• That the controls were adequate to address all significant financial risks facing the business;
• Considered the expertise, resources and experience of the finance function and the senior members of management responsible for this function and concluded that these were appropriate;
• Compliance with the Legal and Statutory Requirements
• Considered the compliance with the legal and statutory requirements and concluded that it had been complied with consistently and a timely manner.
MeetingsThe Audit Committee meets on a regular basis and the meetings are designed to facilitate and encourage communication amongst the Committee and to review the internal audit reports and the replies and carry out the functions aforementioned.
The Chief Operating Officer, Chief Financial Officer, Chief Risk Officer attended the meetings by invitation.
Attendance at MeetingsMeeting Held Meeting Present
Mr. S. Karunanayake 17 17
Lt. Col. Athula R. Samarasinghe 17 17
ConclusionBased upon the functions of the Audit Committee, it is satisfied that the Company is in conformity with the legal and statutory requirements and the implemented systems and controls sufficient to ensure compliance with the best industry practices.
Sunil KarunanayakeChairman - Audit Committee
Report of the Audit Committee

130 131
Alliance Finance Company PLC | Annual Report 2016/17
Overview Management Discussion & Analysis
Financial Reports Supplementary information
Independent Auditors’ Report
TO THE SHAREHOLDERS OF ALLIANCE FINANCE COMPANY PLC Report on the Financial Statements We have audited the accompanying financial statements of Alliance Finance Company PLC, ("the Company"), and the consolidated financial statements of the Company and its subsidiaries ("Group"), which comprise the statement of financial position as at March 31,2017, and the statement of profit or loss and comprehensive income, statement of changes in equity and, statement of cash flows for the year then ended, and a summary of significant accounting policies and other explanatory information.
Board's Responsibility for the Financial Statements The Board of Directors ("Board") is responsible for the preparation of these financial statements that give a true and fair view in accordance with Sri Lanka Accounting Standards, and for such internal control as Board determines is necessary to enable the preparation of financial statements that are free from material misstatement, whether due to fraud or error.
Auditor's Responsibility Our responsibility is to express an opinion on these financial statements based on our audit. We conducted our audit in accordance with Sri Lanka Auditing Standards. Those standards require that we comply with ethical requirements and plan and perform the audit to obtain reasonable assurance about whether the financial statements are free from material misstatement. An audit involves performing procedures to obtain audit evidence about the amounts and disclosures in the financial statements. The procedures selected depend on the auditor's judgment, including the assessment of the risks of material misstatement of the financial statements, whether due to fraud or error. In making those risk assessments, the auditor considers internal control relevant to the Company's preparation of the financial statement that give a true and fair view in order to design audit procedures that are appropriate in the circumstances, but not for the purpose of expressing an opinion on the effectiveness of the Company's internal control. An audit also includes evaluating the appropriateness of accounting policies used and the reasonableness of accounting estimates made by Board, as well as evaluating the overall presentation of the financial statements.
We believe that the audit evidence we have obtained is sufficient and appropriate to provide a basis for our audit opinion.
Opinion In our opinion, the consolidated financial statements give a true and fair view of the financial position of the Group as at March 31,2017 and of its financial performance and cash flows for the year then ended in accordance with Sri Lanka Accounting Standards.
Report on Other Legal and Regulatory Requirements As required by section 163 (2) of the Companies Act No. 07 of 2007, we state the following: a) The basis of opinion and scope and limitations of the audit are as stated above. b) In our opinion: • we have obtained all the information and explanations that were required for the
audit and, as far as appears from our examination, proper accounting records have been kept by the Company,
• the financial statements of the Company give a true and fair view of its financial position as at March 31, 2017, and of its financial performance and cash flows for the year then ended in accordance with Sri Lanka Accounting Standards,
• the financial statements of the Company and the Group comply with the requirements of Sections 151 and 153 of the Companies Act No.07 of 2007.
Edirisinghe & Co.,Chartered Accountants
Colombo 30-May-17

132
Alliance Finance Company PLC | Annual Report 2016/17
Overview Management Discussion & Analysis
Financial Reports Supplementary information
Statement of Profit or Loss
Company GroupFor the Financial Year Ended 31st March 2017 2016 2017 2016 Notes Rs. Rs. Rs. Rs.
Gross Income 5 5,376,833,125 4,575,969,828 5,448,105,866 4,616,615,382
Interest income 4,977,443,849 4,088,411,304 4,985,044,639 4,090,199,942 Interest expenses (2,462,431,850) (1,868,434,772) (2,462,431,850) (1,868,434,772)Net Interest Income 6 2,515,011,999 2,219,976,532 2,522,612,789 2,221,765,170
Fee and commission income 199,609,918 293,843,456 267,813,058 326,083,961 Fee and commission expenses (45,489,412) (102,524,846) (45,496,812) (102,534,576)Net Fee and Commission Income 7 154,120,506 191,318,610 222,316,246 223,549,385
Net gain/(loss) from trading 8 12,309,545 19,100,295 13,818,243 25,118,643
Other operating income (net) 9 187,469,813 174,614,773 181,429,926 175,212,836
Total Operating Income 2,868,911,863 2,605,010,210 2,940,177,204 2,645,646,034
Impairment (charges) / reversal for loans and other losses 10 (73,680,699) (165,552,247) (73,680,699) (165,552,247)Gold loan auction losses (11,768) (168,622,218) (11,768) (168,622,218)Net Operating Income 2,795,219,396 2,270,835,745 2,866,484,737 2,311,471,569
Operating ExpensesPersonnel expenses 11 (774,573,157) (750,965,495) (802,058,435) (758,476,851)Other operating expenses 12 (901,056,784) (815,792,384) (927,378,520) (824,523,377)Depreciation of property & equipment (117,774,125) (99,934,198) (118,323,088) (101,019,509)Total operating expenses (1,793,404,066) (1,666,692,077) (1,847,760,043) (1,684,019,737)Operating Profit before Value Added Tax on Financial Services 1,001,815,330 604,143,668 1,018,724,694 627,451,832 Value Added Tax on Financial Services (178,588,251) (84,125,542) (178,588,251) (84,125,542)Operating Profit after Value Added Tax on Financial Services 823,227,079 520,018,126 840,136,443 543,326,290

132 133
Alliance Finance Company PLC | Annual Report 2016/17
Overview Management Discussion & Analysis
Financial Reports Supplementary information
Company GroupFor the Financial Year Ended 31st March 2017 2016 2017 2016 Notes Rs. Rs. Rs. Rs.
Share of profit from associates 10,899,751 13,442,936 10,899,751 13,442,936 Loss on change of interest in associate - (3,153,928) - (3,153,928)Profit before Taxation from Operations 834,126,830 530,307,134 851,036,194 553,615,298
Provision for income taxation 13 (184,670,013) (111,117,749) (191,534,940) (117,418,769)
Profit for the year 649,456,817 419,189,385 659,501,254 436,196,529 Profit attributable to :Equity holders of the company 649,456,817 419,189,385 653,314,165 430,063,754 Non controlling interest - - 6,187,089 6,132,776 Profit for the year 649,456,817 419,189,385 659,501,254 436,196,529
Basic Earnings Per Share 14 20 13 20 13 Dividend Per Share (Rs.) 15 6 53 6 53
Figures in brackets indicate deductions.Accounting policies and notes to accounts form an integral part of these Financial Statements.

134
Alliance Finance Company PLC | Annual Report 2016/17
Overview Management Discussion & Analysis
Financial Reports Supplementary information
Statement of Comprehensive Income
Company GroupFor the Financial Year Ended 31st March 2017 2016 2017 2016 Rs. Rs. Rs. Rs.
Profit for the year 649,456,817 419,189,385 659,501,254 436,196,529
Other Comprehensive IncomeOther Comprehensive Income to be reclassified to Profit or LossNet gains and losses on available-for-sale financial assets:Sri Lanka government securities 798,159 (1,250,070) 798,159 (1,250,070)Equity securities - unquoted - (14,366,292) - (14,366,292)Net other comprehensive income to reclassified to profit or loss 798,159 (15,616,362) 798,159 (15,616,362)
Other Comprehensive Income not to be Reclassified to Profit or LossActuarial gains /( losses ) on defined benefit plans 9,311,656 16,181,388 9,427,504 16,269,996 Deferred tax effect on above (2,607,264) (4,530,789) (2,607,264) (4,530,789) 6,704,392 11,650,599 6,820,240 11,739,207 Surplus from revaluation of property, plant & equipment 798,388,667 - 798,388,667 -Deferred tax effect on above (889,723) - (889,723) - 797,498,944 - 797,498,944 -
Net Other Comprehensive Income not be Classified to Profit or Loss 804,203,336 11,650,599 804,319,184 11,739,207
Total Comprehensive Income for the Period 1,454,458,312 415,223,623 1,464,618,597 432,319,375
Attributable to:Equity holders of the company 1,454,458,312 415,223,623 1,458,389,733 426,154,647 Non controlling interest - - 6,228,864 6,164,728 Total Comprehensive Income for the year 1,454,458,312 415,223,623 1,464,618,597 432,319,375
Figures in brackets indicate deductions.Accounting policies & notes to accounts form an integral part of these Financial Statements.

134 135
Alliance Finance Company PLC | Annual Report 2016/17
Overview Management Discussion & Analysis
Financial Reports Supplementary information
Company GroupAs at 31st March 31.03.2017 31.03.2016 31.03.2017 31.03.2016 Notes Rs. Rs. Rs. Rs. Restated Restated
AssetsCash and cash equivalents 18 250,196,373 143,982,481 294,565,160 177,180,931Repurchase agreements 175,849,048 735,591,742 175,849,048 735,591,742Placements with banks & financial institutions 1,218,793,508 1,834,356,115 1,273,186,055 1,834,356,115Financial investments - held for trading 19 1,251,615,776 1,081,001,402 1,251,615,776 1,159,449,583Loans and advances 20 7,478,467,024 5,603,981,321 7,478,583,487 5,604,087,836Lease rentals receivable & stock out on hire 21 15,837,430,513 13,283,110,374 15,837,430,513 13,283,110,374Hire purchase rentals receivable & stock out on hire 22 167,597,495 462,569,201 167,597,495 462,569,201Financial investments - available for sale 23 488,324,252 450,254,097 501,824,252 463,754,097Other trading stocks 24 9,775,936 207,857,305 9,775,936 207,857,305Other financial assets 25 255,578,986 181,511,534 291,358,203 178,653,619Other non financial assets 26 118,339,278 113,445,442 118,358,589 118,146,354Investments in associates 27 68,762,442 65,834,956 68,762,442 65,834,956Investments in subsidiaries 28 16,924,038 16,924,038 - -Property, plant & equipment 29 2,122,913,196 1,446,535,945 2,123,236,674 1,447,285,886Intangible assets 30 49,498,623 - 49,498,623 -Deferred tax assets 511,884,241 217,742,273 512,240,973 218,039,294Total Assets 30,021,950,728 25,844,698,227 30,153,883,226 25,955,917,293
LiabilitiesDue to banks 31 11,717,899,355 8,328,978,742 11,749,382,430 8,353,691,241Due to customers 32 10,087,821,914 10,464,149,566 10,087,821,914 10,464,149,566Debt instruments issued and other borrowed funds 33 2,548,225,806 3,062,414,964 2,548,225,806 3,062,414,964Other financial liabilities 34 888,031,755 884,210,568 902,782,091 890,116,107Other non financial liabilities 35 51,661,019 35,880,403 51,661,019 35,880,403Derivative financial liabilities 36 17,736,580 - 17,736,580 -Income tax liability 37 108,212,452 62,954,733 111,659,369 67,590,682Retirement benefit liability 38 80,145,738 91,237,518 81,419,781 92,298,302Deferred tax liabilities 39 457,419,634 192,818,369 457,460,593 192,934,106Total Liabilities 25,957,154,254 23,122,644,863 26,008,149,584 23,159,075,371
Statement of Financial Position
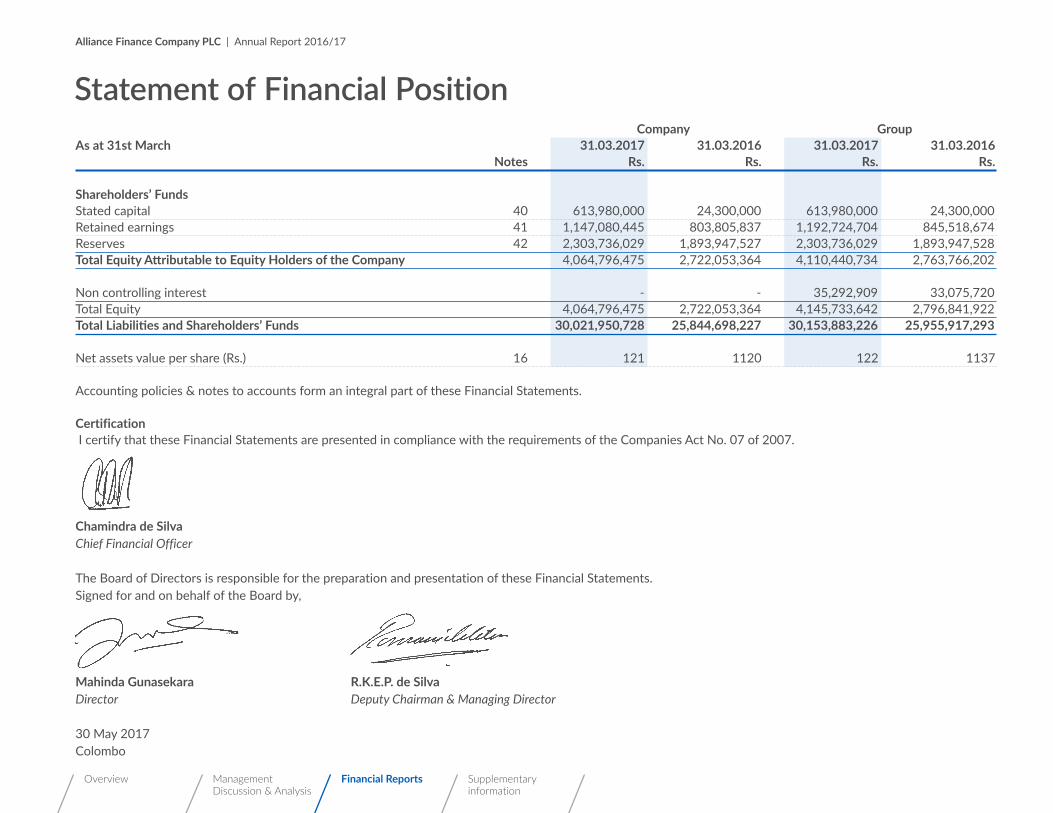
136
Alliance Finance Company PLC | Annual Report 2016/17
Overview Management Discussion & Analysis
Financial Reports Supplementary information
Company GroupAs at 31st March 31.03.2017 31.03.2016 31.03.2017 31.03.2016 Notes Rs. Rs. Rs. Rs.
Shareholders’ FundsStated capital 40 613,980,000 24,300,000 613,980,000 24,300,000Retained earnings 41 1,147,080,445 803,805,837 1,192,724,704 845,518,674Reserves 42 2,303,736,029 1,893,947,527 2,303,736,029 1,893,947,528Total Equity Attributable to Equity Holders of the Company 4,064,796,475 2,722,053,364 4,110,440,734 2,763,766,202
Non controlling interest - - 35,292,909 33,075,720Total Equity 4,064,796,475 2,722,053,364 4,145,733,642 2,796,841,922Total Liabilities and Shareholders’ Funds 30,021,950,728 25,844,698,227 30,153,883,226 25,955,917,293 Net assets value per share (Rs.) 16 121 1120 122 1137
Accounting policies & notes to accounts form an integral part of these Financial Statements.
Certification I certify that these Financial Statements are presented in compliance with the requirements of the Companies Act No. 07 of 2007.
Chamindra de Silva Chief Financial Officer
The Board of Directors is responsible for the preparation and presentation of these Financial Statements.Signed for and on behalf of the Board by,
Mahinda Gunasekara R.K.E.P. de SilvaDirector Deputy Chairman & Managing Director
30 May 2017Colombo
Statement of Financial Position

136 137
Alliance Finance Company PLC | Annual Report 2016/17
Overview Management Discussion & Analysis
Financial Reports Supplementary information
For the Financial Year Ended 31st March 2017 Dividend Non Company Stated Statutory Capital Equalization Diversification General Development Investment Available for Controlling Retained Total Capital Reserve Reserve Reserve Risk Reserve Reserve Reserve Fund Reserve Sale Reserve Interest Earnings Rs. Rs. Rs. Rs. Rs. Rs. Rs. Rs. Rs. Rs. Rs. Rs.
Balance as at 1 April 2015 24,300,000 418,257,400 479,906,644 7,000,000 255,000,000 453,300,000 108,141,275 83,216,780 21,681,789 - 598,539,503 2,449,343,391Profit for the year - Restated - - - - - - - - - - 419,189,385 419,189,385 Other comprehensive income, net of tax - - - - - - - - (15,616,362) - 11,650,599 (3,965,762)Transfer to statutory reserve - 83,060,000 - - - - - - - - (83,060,000) - Transfer to general reserve - - - (7,000,000) (255,000,000) 370,141,275 (108,141,275) - - - - -Restated Associate company prior year profit (Note No. 27 a(ii)) - - - - - - - - - - (2,323,724) (2,323,724)Reassessment of value of fixed assets (Note no. 29.6 ) - - - - - - - - - - (13,829,928) (13,829,928)Dividend paid - - - - - - - - - - (126,360,000) (126,360,000)Balances as at 31st March 2016 - Restated 24,300,000 501,317,400 479,906,644 - - 823,441,275 - 83,216,780 6,065,427 - 803,805,837 2,722,053,364
Balance as at 1 April 2016 - Restated 24,300,000 501,317,400 479,906,644 - - 823,441,275 - 83,216,780 6,065,427 - 803,805,837 2,722,053,362 Profit for the year - - - - - - - - - - 649,456,817 649,456,817 Other comprehensive income, net of tax - - - - - - - - 798,159 - 6,704,392 7,502,551 Revaluation surplus - - 797,498,944 - - - - - - - - - 797,498,944Transfer to statutory reserve - 129,891,400 - - - - - - - - (129,891,400) - Reserves capitalization 518,400,000 - - - - (435,183,220) - (83,216,780) - - - - Right issue 71,280,000 - - - - - - - - - 71,280,000 Dividend paid - - - - - - - - - - (182,995,200) (182,995,200)Balances as at 31st March 2017 613,980,000 631,208,800 1,277,405,588 - - 388,258,055 - - 6,863,586 - 1,147,080,445 4,064,796,475
Statement of Changes in Equity

138
Alliance Finance Company PLC | Annual Report 2016/17
Overview Management Discussion & Analysis
Financial Reports Supplementary information
For the Financial Year Ended 31st March 2017 Dividend Non Group Stated Statutory Capital Equalization Diversification General Development Investment Available for Controlling Retained Total Capital Reserve Reserve Reserve Risk Reserve Reserve Reserve Fund Reserve Sale Reserve Interest Earnings Rs. Rs. Rs. Rs. Rs. Rs. Rs. Rs. Rs. Rs. Rs. Rs.
Balance as at 1st April 2015 24,300,000 418,257,400 479,906,644 7,000,000 255,000,000 453,300,000 108,141,275 83,216,780 21,681,789 26,910,995 629,321,313 2,507,036,196 Profit for the year - Restated - - - - - - - - - 6,132,776 430,063,754 436,196,529 Other comprehensive income, net of tax - - - - - - - - (15,616,362) 31,949 11,707,258 (3,877,154)Restated Associate company prior year profit (Note No. 27 a(ii)) - - - - - - - - - - (2,323,724) (2,323,724)Re-assessment of value of fixed assets (Note no. 29.6 ) - - - - - - - - - - (13,829,928) (13,829,928)Transfer to general reserve - - - (7,000,000) (255,000,000) 370,141,275 (108,141,275) - - - - - Transfer to statutory reserve - 83,060,000 - - - - - - - - (83,060,000) - Dividend paid - - - - - - - - - - (126,360,000) (126,360,000)Balances as at 31st March 2016 - Restated 24,300,000 501,317,400 479,906,644 - - 823,441,275 - 83,216,780 6,065,427 33,075,720 845,518,674 2,796,841,922
Balance as at 1st April 2016 24,300,000 501,317,400 479,906,644 - - 823,441,275 - 83,216,780 6,065,427 33,075,720 845,518,674 2,796,841,919 Profit for the year - - - - - - - - - 6,187,089 653,314,165 659,501,254 Other comprehensive income, net of tax - - - - - - - - 798,160 41,775 6,778,465 7,618,400 Revaluation surplus - - 797,498,944 - - - - - - - - 797,498,944Transfer to statutory reserve - 129,891,400 - - - - - - - - (129,891,400) - Reserves capitalization 518,400,000 - - - - (435,183,220) - (83,216,780) - - - - Right Issue 71,280,000 - - - - - - - - - - 71,280,000 Dividend paid - - - - - - - - - (4,011,675) (182,995,200) (187,006,875)
Balances as at 31st March 2017 613,980,000 631,208,800 1,277,405,588 - - 388,258,055 - - 6,863,586 35,292,909 1,192,724,704 4,145,733,642
Figures in brackets indicate deductions.Accounting policies & notes to accounts form an integral part of these Financial Statements.
Statement of Changes in Equity

138 139
Alliance Finance Company PLC | Annual Report 2016/17
Overview Management Discussion & Analysis
Financial Reports Supplementary information
Statement of Cash Flows
Company GroupFor the Financial Year Ended 31st March 2017 31.03.2017 31.03.2016 31.03.2017 31.03.2016 Rs. Rs. Rs. Rs. Restated Restated
Cash Flow From / (Used in) Operating ActivitiesProfit before Income Tax Expense 834,126,830 530,307,134 851,036,194 553,615,298Adjustments for;Depreciation of property, plant & equipment 110,301,759 99,934,198 110,800,937 101,019,509Amortization of intangible assets 7,472,368 - 7,522,153 -Impairment reversal/provision (24,269,874) (153,371,135) (24,269,874) (153,371,135)Fixed assets valuation loss 3,992,748 - 3,992,748 -Interest on fixed deposits & treasury bills (180,917,550) (177,852,634) (188,518,340) (179,641,272)Profit /(loss) on sale of securities 798,829 (8,235,404) 798,829 (8,235,404)Fair value gain or loss on equity investments (FVTPL) (4,293,334) (261,767) (4,293,334) (261,767)Profit /(loss) on AFS financial assets - (28,155,635) - (27,801,222)Diminution/(appreciation) in value of investments 10,528,127 32,924,518 10,528,127 32,924,518Loss/(profit) on disposal of property & equipment (13,184,186) (19,658,346) (13,329,186) (19,658,346)Provision/(reversal) for defined benefit plans - 31,542,561 32,112,383 31,871,667 32,397,636Dividend received (13,829,352) (8,305,081) (14,725,392) (8,305,081)Loss on change of interest in associates - 3,153,928 - 3,153,928Loss on disposal of associates - 354,413 - 354,413Share of profit from associates (10,899,751) (13,442,936) (10,899,751) (13,442,936)Operating Profit before Working Capital Changes 751,369,175 289,503,634 760,514,778 312,748,138
(Increase)/decrease in trading stock 198,081,369 59,143,229 198,081,369 59,143,229(Increase)/decrease in loans and advances (1,854,369,742) (1,876,466,336) (1,854,379,690) (1,876,432,801)(Increase)/decrease in lease rentals receivable & stock out on hire (2,549,813,411) (3,100,799,005) (2,549,813,411) (3,100,799,005)(Increase)/decrease in hire purchase rentals receivable & stock out on hire 294,618,891 703,915,304 294,618,891 703,915,304(Increase)/decrease in fixed deposits & repurchase agreements 1,175,305,301 (1,576,769,315) 1,120,912,754 (1,576,769,315)(Increase)/decrease in other financial assets (74,067,452) (46,685,568) (112,704,584) (57,334,441)(Increase)/decrease in other non-financial assets (4,893,836) 13,765,526 (212,235) 10,219,639Increase/(decrease) in amounts due to customers (376,327,652) 120,083,633 (376,327,652) 120,083,633Increase/(decrease) in derivative financial liabilities 17,736,580 - 17,736,580 -Increase/(decrease) in other financial liabilities 3,821,165 183,524,338 12,665,970 178,655,881Increase/(decrease) in other non-financial liabilities 15,780,616 (3,709,744) 15,780,616 (5,944,808)
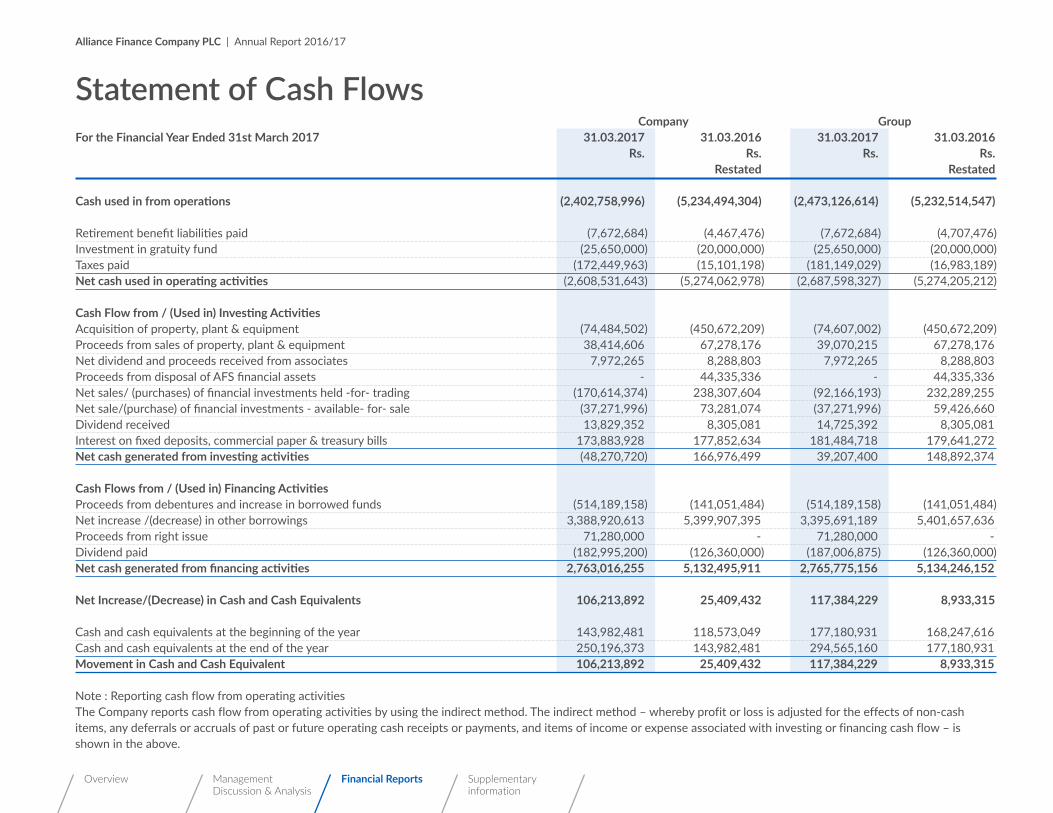
140
Alliance Finance Company PLC | Annual Report 2016/17
Overview Management Discussion & Analysis
Financial Reports Supplementary information
Statement of Cash Flows Company GroupFor the Financial Year Ended 31st March 2017 31.03.2017 31.03.2016 31.03.2017 31.03.2016 Rs. Rs. Rs. Rs. Restated Restated
Cash used in from operations (2,402,758,996) (5,234,494,304) (2,473,126,614) (5,232,514,547)
Retirement benefit liabilities paid (7,672,684) (4,467,476) (7,672,684) (4,707,476)Investment in gratuity fund (25,650,000) (20,000,000) (25,650,000) (20,000,000)Taxes paid (172,449,963) (15,101,198) (181,149,029) (16,983,189)Net cash used in operating activities (2,608,531,643) (5,274,062,978) (2,687,598,327) (5,274,205,212)
Cash Flow from / (Used in) Investing ActivitiesAcquisition of property, plant & equipment (74,484,502) (450,672,209) (74,607,002) (450,672,209)Proceeds from sales of property, plant & equipment 38,414,606 67,278,176 39,070,215 67,278,176Net dividend and proceeds received from associates 7,972,265 8,288,803 7,972,265 8,288,803Proceeds from disposal of AFS financial assets - 44,335,336 - 44,335,336Net sales/ (purchases) of financial investments held -for- trading (170,614,374) 238,307,604 (92,166,193) 232,289,255Net sale/(purchase) of financial investments - available- for- sale (37,271,996) 73,281,074 (37,271,996) 59,426,660Dividend received 13,829,352 8,305,081 14,725,392 8,305,081Interest on fixed deposits, commercial paper & treasury bills 173,883,928 177,852,634 181,484,718 179,641,272Net cash generated from investing activities (48,270,720) 166,976,499 39,207,400 148,892,374
Cash Flows from / (Used in) Financing ActivitiesProceeds from debentures and increase in borrowed funds (514,189,158) (141,051,484) (514,189,158) (141,051,484)Net increase /(decrease) in other borrowings 3,388,920,613 5,399,907,395 3,395,691,189 5,401,657,636Proceeds from right issue 71,280,000 - 71,280,000 -Dividend paid (182,995,200) (126,360,000) (187,006,875) (126,360,000)Net cash generated from financing activities 2,763,016,255 5,132,495,911 2,765,775,156 5,134,246,152
Net Increase/(Decrease) in Cash and Cash Equivalents 106,213,892 25,409,432 117,384,229 8,933,315
Cash and cash equivalents at the beginning of the year 143,982,481 118,573,049 177,180,931 168,247,616Cash and cash equivalents at the end of the year 250,196,373 143,982,481 294,565,160 177,180,931Movement in Cash and Cash Equivalent 106,213,892 25,409,432 117,384,229 8,933,315
Note : Reporting cash flow from operating activities The Company reports cash flow from operating activities by using the indirect method. The indirect method – whereby profit or loss is adjusted for the effects of non-cash items, any deferrals or accruals of past or future operating cash receipts or payments, and items of income or expense associated with investing or financing cash flow – is shown in the above.

140 141
Alliance Finance Company PLC | Annual Report 2016/17
Overview Management Discussion & Analysis
Financial Reports Supplementary information
Significant Accounting Policies
1. CORPORATE INFORMATION1.1 General
Alliance Finance Company PLC (the 'Company') is a public limited liability Company listed on the Colombo Stock Exchange and incorporated on July 18, 1956 under the Companies Ordinance No 51 of 1938 and domiciled in Sri Lanka. It is a Registered Finance Company regulated under the Finance Business Act No.42 of 2011 and amendments thereto. The Company is re-registered under the new Companies Act No 7 of 2007. The registered office of the Company and the principal place of business are both situated at No.84, Ward Place, Colombo 07.
1.2 Consolidated Financial Statements
Consolidated Financial Statements of the Group for the year ended 31st March 2017 comprises the Company (Parent Company) and its Subsidiaries (together referred to as the “Group” and individually as ‘Group entities’).The Subsidiary company of the Group as at 31st March 2017 was Alfinco Insurance Brokers (Pvt) Ltd.
All the Group entities are Limited Liability Companies, incorporated and domiciled in Sri Lanka.
1.3 Principal Activities and Nature of Operations
1.3.1 The CompanyDuring the year under review the Company provides a comprehensive range of financial services encompassing accepting deposits, lease financing, hire purchase financing, mortgage loans, pawning, term loans and other credit facilities, operating leases, vehicle hiring, consumer credit, microfinance activities and other financial services.
1.3.2 SubsidiariesOwnership of Subsidiaries as of 31st March 2017 is given below
Subsidiary Principal Activities Ownership %
Alfinco Insurance Brokers (Pvt.) Ltd Insurance Brokering 63.94
2. BASIS OF PREPARATION2.1 Statement of Compliance
The Financial Statements of the Group and the separate Financial Statements of the Company, have been prepared and presented in accordance with Sri Lanka Accounting Standards comprising of Sri Lanka Financial Reporting Standards (SLFRS s) and Lanka Accounting Standards (LKASs), laid down by the Institute of Chartered Accountants of Sri Lanka (CA Sri Lanka) and in compliance with the requirements of the Companies Act No. 07 of 2007.The presentation of the financial statements is also in compliance with the requirements of the Finance Business Act No. 42 of 2011 and amendments thereto, and provides appropriate disclosures as required by the Listing Rules of the Colombo Stock Exchange (CSE).
Financial Statements comprise of the Statement of Financial Position, Statement of Profit or Loss, Statement of Other Comprehensive Income, Statement of Changes in Equity and Statement of Cash Flows, together with Accounting Policies and Notes.
142
Alliance Finance Company PLC | Annual Report 2016/17
Overview Management Discussion & Analysis
Financial Reports Supplementary information
2.2 Responsibility for Financial Statements
The Board of Directors of the Company is responsible for the preparation and presentation of the Financial Statements of the Group and the Company as per Sri Lanka Accounting Standards (SLFRSs and LKASs) and the provisions of the Companies Act No. 7 of 2007.
The Board of Directors acknowledges their responsibility as set out in the “Annual Report Board of Directors”, “Statement of Directors Responsibility” and the certification on the Statement of Financial Position on page 134 and 135.
2.3 Date of Authorization for Issue
The Financial Statements for the year ended 31st March 2017 were approved and authorized for issue in accordance with a resolution of the Board of Directors on 30th May 2017.
2.4 Basis of Measurement
The Consolidated Financial Statements have been prepared on the historical cost basis, except for the following material items in the Statements of Financial Position.
• Derivatives financial instruments are measured at fair value
• Non-derivative financial instruments at fair value through profit or loss are measured at fair value
• Available for sale financial assets are measured at fair value.
• Net liability for defined benefit obligations are recognized as the present value of the defined benefit obligation, less net total of the plan assets, plus unrecognized actuarial gains, less unrecognized past service cost and unrecognized actuarial losses.
• Land and buildings which are measured at cost at the time of acquisition, subsequently measured at revalued amounts, which are the fair values at the date of revaluation.
2.5 Functional and Presentation Currency
The Financial Statements are presented in Sri Lankan Rupees which is the Group’s functional and presentation currency of the primary economic environment in which Alliance Finance PLC operates. All financial information presented in Sri Lankan Rupees has been rounded to the nearest rupee, unless otherwise stated.
2.6 Presentation of Financial Statements
The Group presents its Statement of Financial Position broadly in order that reflects their relative liquidity and maturity pattern. No adjustments have been made for inflationary factors affecting the Financial Statements. An analysis regarding recovery or settlement within 12 months after the reporting date (current) and more than 12 months after the reporting date (non–current) is presented in note 47 on page No. 222 and 223.
2.7 Materiality & Aggregation
In compliance with LKAS 01 on Presentation of Financial Statements, each material class of similar items is presented separately in the Financial Statements. Items of dissimilar nature or functions are presented separately, unless they are immaterial.
Financial assets and financial liabilities are offset and the net amount reported in the Statement of Financial Position only when there is a legally enforceable right to offset the recognized amounts and there is an intention to settle on a net basis, or to realize the assets and settle the liability simultaneously. Income and expenses are not offset in the Statement of Profit or Loss unless required or permitted by any Accounting Standard or interpretations, and as specifically disclosed in the accounting policies.
2.8 Comparative Information
The comparative information is re-classified wherever necessary to conform to the current year’s presentation.
2.9 Use of significant accounting Judgments,
Estimates and Assumptions
In preparing Financial Statements of the Group in conformity with Sri Lanka Accounting Standards (SLFRSs and LKASs), requires management to make judgments, estimates and assumptions that affect the application of Accounting Policies and the
Significant Accounting Policies

142 143
Alliance Finance Company PLC | Annual Report 2016/17
Overview Management Discussion & Analysis
Financial Reports Supplementary information
reported amounts of assets, liabilities, income and expenses. Due to the inherent uncertainty involved with estimates, actual results may differ from these estimates.
Estimates and underlying assumptions are reviewed on an ongoing basis. Revisions to accounting estimates are recognised in the period in which the estimates are revised and in any future periods affected.
Information about critical judgments, estimates and assumptions in applying Accounting Policies that could have a significant effect on the Financial Statements of the Group are as follows:
2.9.1 Going ConcernThe Directors have made an assessment of its ability to continue as a going concern and are satisfied that it has the resources to continue in business for the foreseeable future. Furthermore, the Directors are not aware of any material uncertainties that may cast significant doubt upon the Group’s ability to continue as a going concern and they do not intend either to liquidate or to cease operations of the Group. Therefore, the Financial Statements continue to be prepared on a going concern basis.
The following notes provide more information on specific accounting judgements, estimates and assumptions used.
2.9.2 Useful life time of the property, plant & equipment2.9.3 Allowance for impairment losses3.9 Retirement benefit obligation3.10 Taxation3.12 Deferred taxation3.18 Commitments and contingencies
2.9.2 Useful Life-time of the Property and EquipmentThe Group review the residual values, useful lives and methods of depreciation of assets at each reporting date. Judgement of the management is exercised in the estimation of these values, rates, methods and hence they are subject to uncertainty.
2.9.3 Impairment Losses on Loans and Advances (Leases, Hire Purchase & Other Loans)The Group review its individually significant loans and advances at each reporting date to assess whether an impairment loss should be provided for in the Statement of Profit or Loss. In particular, management’s judgement is required in the estimation of the amount and timing of future cash flow when determining the impairment loss. These estimates are based on assumptions about a number of factors and actual results may differ, resulting in future changes to the impairment allowance made.
Loans and advances that have been assessed individually and found to be not impaired or not individually significant and all individually
insignificant loans and advances are then assessed collectively, to determine whether provision should be made due to incurred loss events for which there is objective evidence, but the effects of which are not yet evident.
The collective provision for groups of homogeneous loans is established using statistical methods or, a formula approach based on historical loss rate experience, using the statistical analysis of historical data on delinquency to estimate the amount of loss. Management applies judgement to ensure that the estimate of loss arrived at on the basis of historical information is appropriately adjusted to reflect the economic conditions and product mix at the reporting date. The loss rates are regularly benchmarked against actual loss experience.
In assessing the need for collective loss provision, management considers factors such as credit quality ( such as loan to collateral ratio, level of restructured performing loans, level of arrears, credit utilization etc.) portfolio size, judgements on the effect of concentration of risks and economic factors (including levels of unemployment, inflation, interest rates).

144
Alliance Finance Company PLC | Annual Report 2016/17
Overview Management Discussion & Analysis
Financial Reports Supplementary information
2.9.4 Impairment of Available for Sale Financial InvestmentsThe Group reviews its debt securities classified as available for sale investments at each reporting date to assess whether they are impaired. This requires similar judgements as applied on the individual assessment of loans and advances.
The Group also records impairment charges on available for sale equity investments when there has been a significant or prolonged decline in the fair value below their cost. The determination of what is ‘significant’ or ‘prolonged’ requires judgement. In making this judgement, the Group evaluates, among other factors, historical share price movements, duration and extent up to which the fair value of an investment is less than its cost.
2.9.5 Taxation The Group is subject to income taxes and other taxes including VAT on financial services. Significant judgement was required to determine the total provision for current, deferred and other taxes pending the issue of tax guidelines on the treatment of the adoption of SLFRS in the Financial Statements and the taxable profit for the purpose of imposition of taxes. Uncertainties exist, with respect to the interpretation of the applicability of tax laws, at the time of the preparation of these financial statements. The Group recognized assets and liabilities for
current, deferred and other taxes based on estimates of whether additional taxes will be due. Where the final tax outcome of these matters is different from the amounts that were initially recorded, such differences will impact the income, deferred and tax amounts in the period in which the determination is made.
2.9.6 Deferred Tax AssetsDeferred tax assets are recognised in respect of tax losses to the extent that it is probable that future taxable profits will be available against which such tax losses can be set-off. Judgement is required to determine the amount of deferred tax assets that can be recognised, based on the likely timing and level of future taxable profits, together with the future tax-planning strategies.
2.9.7 Defined Benefit PlansThe cost of defined benefit plans are determined using actuarial valuations. An actuarial valuation involves making various assumptions which may differ from actual developments in the future. These include the determination of the discount rate, future salary increases, mortality rates etc. Due to the complexity of the valuation, the underlying assumptions and their long term nature, a defined benefit obligation is highly sensitive to changes in these assumptions. All assumptions are reviewed at each reporting date.
In determining the appropriate discount rate, management considers the interest rates of Sri Lanka Government bonds with extrapolated maturities corresponding to the expected duration of the defined benefit obligation. The mortality rate is based on publicly available mortality tables. Future salary increases are based on expected future inflation rates and expected future salary increase rate of the Group.
2.9.8 Fair Value of Property and EquipmentThe Land and Buildings of the Group are reflected at fair value. The Group engaged independent valuation specialist to determine fair value of land and building. When current market prices of similar assets are available, such evidences are considered in estimating fair values of these assets.
2.9.9 Fair Value of Financial InstrumentsThe determination of fair values of financial assets and financial liabilities recorded on the Statement of Financial Position for which there is no observable market price are determined using a variety of valuation techniques that include the use of mathematical models. The Group measures fair value using the fair value hierarchy that reflects the significant of input used in making measurements.
Significant Accounting Policies

144 145
Alliance Finance Company PLC | Annual Report 2016/17
Overview Management Discussion & Analysis
Financial Reports Supplementary information
2.10 Events after the Reporting Period
Events after the reporting period are those events, favourable and unfavourable, that occur between the reporting date and the date when the Financial Statements are authorized for issue.
3. SUMMARY OF SIGNIFICANT ACCOUNTING POLICIES
The significant accounting policies applied by the Group in preparation of the Financial Statements are included below. The accounting policies set out below have been applied consistently to all periods presented in these Financial Statements of the Group, unless otherwise indicated.
3.1 Basis of Consolidation
The Group’s Financial Statements comprise consolidation of the Financial Statements of the Company and its Subsidiaries in terms of the Sri Lanka Accounting Standard – SLFRS 10 (Consolidation Financial Statements).
3.1.1 Business Combinations and GoodwillBusiness combinations are accounted for using the acquisition method as per the requirements of Sri Lanka Accounting Standard – SLFRS 03 (Business Combinations.)
The Group measures goodwill at the acquisition date as the fair value of the consideration transferred including the recognised amount of any non-
controlling interests in the acquire, less the net recognised amount (generally fair value) of the identifiable assets acquired and liabilities assumed, all measured as at the acquisition date. When the excess is negative, a bargain purchase gain is recognised immediately in profit or loss.
The Group elects on a transaction-by-transaction basis whether to measure non-controlling interest at its fair value, or at its proportionate share of the recognized amount of the identifiable net assets, at the acquisition date.
The consideration transferred does not include amounts related to the settlement of pre-existing relationships. Such amounts are generally recognised in profit or loss.
Transactions costs, other than those associated with the issue of debt or equity securities, that the Group incurs in connection with a business combination are expensed as incurred.
3.1.2 SubsidiariesSubsidiaries are those enterprises controlled by the Company. Control exists when the Company (the Parent) holds more than 50% of the voting rights and/or has the power, directly or indirectly, to govern the financial and operational policies of an enterprise to obtain benefits from its activities.
The Financial Statements of Subsidiaries are fully consolidated from the date on which control is transferred to the Company and continue to be consolidated until the date when such control ceases. The Financial Statements of the Company’s Subsidiaries are same reporting year as per the Company.
The cost of an acquisition is measured at fair value of the consideration, including contingent consideration, given on the date of transfer of title. The acquired identifiable assets, liabilities and contingent liabilities are measured at their fair values at the date of acquisition. Subsequent to the initial measurement the Company continues to recognize the investments in Subsidiaries at cost.
The total assets and liabilities of the Subsidiaries as at the reporting date are included in the Consolidated Statements of Financial Position. The total profit or loss for the year of the Subsidiaries is included in the Consolidated Statements of Profit or Loss.
The non-controlling interest is presented in the Consolidated Statements of Financial Position within equity; separately form the equity attributable to the equity holders of the Company. Non-controlling interest in the profit or loss of the Group is disclosed in the Consolidated Statement of Comprehensive Income. Total Comprehensive income is allocated to

146
Alliance Finance Company PLC | Annual Report 2016/17
Overview Management Discussion & Analysis
Financial Reports Supplementary information
the owners of the parent and to the non-controlling interests even if this results in the non-controlling interests having a deficit balance.
Where subsidiaries have been acquired or sold during the year, their operating results have been included from the date of acquisition or to the date of disposal.
Upon the loss of control, the Group derecognized the assets and liabilities of the Subsidiary, any non-controlling interests and the other components of equity related to the Subsidiary. Any surplus or deficit arising on the loss of control is recognized in the Statement of Changes in Equity. If the Group retains any interest in the previous Subsidiary, then such interest is measured at fair value at the date that control is lost. Subsequently, it is accounted for as an equity-accounted investee or in accordance with the Group’s accounting policy for financial instruments depending on the level of influence retained.
3.1.3 Associates and Jointly Controlled EntitiesAssociates are those entities which the Group has significant influence, but not control or power to govern the financial and operating policies of the entities so as to obtain benefits from their activities.
The Group Financial Statements include the Group’s share of the total recognized gains and losses of
associates on an equity accounted basis, from the date that significant influence commences until the date that significant influence ceases.
Accordingly, under the Equity Method, investment in Associates are carried at cost plus post-acquisition changes. Group’s share of net assets of the Associates are reported as a separate line item in the Statement of Financial Position. The Statement of Profit or Loss reflects the share of current year’s profit or loss of the Associates.
When the Group and Associates’ share of losses exceed the carrying amount of the associate, the carrying amount is reduced to nil and recognition of further losses discontinued except to the extent that the Group has incurred obligations or has made payments on behalf of the Investee.Jointly controlled entities are those entities where the Group has entered into a contractual agreement to share the control over strategic, financial and operating decisions relating to economic activities of the entities through unanimous consent of other parties sharing control.
3.1.4 Transactions Eliminated on ConsolidationIntra-group balances and any income and expenses arising from intra- group transactions are eliminated in preparing the Consolidated Financial Statements. Unrealized losses are eliminated in the same way
as unrealized gains, except that they are only eliminated to the extent that there is no evidence of impairment.
3.2 Foreign Currency Transactions and Balances
Monetary assets and liabilities denominated in foreign currencies have been translated into local currency as per the exchange ruling at the date of the Statement of Financial Position while all non-monetary items are reported at the rate prevailing at the time transactions were affected.
3.3 Cash and Cash Equivalents
Cash and cash equivalents comprise cash in hand, balances with banks, and money at call and short notice.
For the purpose of cash flow statement, cash and cash equivalents consist of cash in hand and deposits in banks net of outstanding bank overdrafts. Investments with short maturities i.e. three months or less from the date of acquisition are also treated as cash equivalents.
They are brought to Financial Statements at their face values or the gross values, where appropriate. Cash and cash equivalents are carried at amortized cost in the Statement of Financial Position.
Significant Accounting Policies
146 147
Alliance Finance Company PLC | Annual Report 2016/17
Overview Management Discussion & Analysis
Financial Reports Supplementary information
3.4 Financial Instruments – Initial Recognition and Subsequent Measurement
Financial assets within the scope of LKAS 39 are classified as loans and advances, financial investments held to maturity, financial investments available-for-sale, financial investments held for trading or financial assets held for trading pledged as collateral as appropriate. The group determines the classification of its financial assets at initial recognition.
3.4.1 Date of RecognitionAll financial assets and liabilities except ‘Regular way traders ‘are initially recognised on the trade date, i.e., the date that the Group becomes a party to the contractual provisions of the instrument. ‘Regular ways trades’ mean purchases or sales of financial assets that require delivery of assets within the time frame generally established by regulation or convention in the market place.
The classification of financial instruments at initial recognition depends on their purpose and characteristics and the management’s intention in acquiring them. All financial instruments are measured initially at their fair value plus transaction costs, except in the case of financial assets and financial liabilities recorded at fair value through profit or loss.
Transaction cost in relation to financial assets and financial liabilities at fair value through profit or loss are dealt with the Statement of Profit or Loss.
3.4.2 Non-Derivative Financial AssetsThe Group recognizes non-derivative financial assets by the following four categories:
• Financial assets at fair value through profit or loss
a) Held for trading; or b) Designated at fair value through profit or loss• Held-to maturity investments
• Loans and receivables
• Available-for-sale financial investments
Subsequent measurement of financial assets depends on their classification.
3.4.2.1 FinancialAssetsatFairValuethroughProfitorLossA financial asset is classified as fair value through profit or loss if it is held for trading or is designated at fair value through profit of loss.
a) Financial Assets Held for Trading
Financial assets are classified as held for trading if they are acquired principally for the purpose of selling or repurchasing in the near term or holds as a part of a portfolio that is managed together for short-term profit or position taking.
Financial assets held for trading are recorded in the Statement of Financial Position at fair value. Changes in fair value are recognized in ‘Net trading income’. Interest income on financial assets held for trading are recognised under ‘Interest Income’ and dividend income is recorded in ‘Other Operating Income’ according to the terms of the contract, or when the right to the payment has been established.
Financial assets held for trading include instruments such as Government and other debt securities and equity instrument that have been acquired principally for the purpose of selling or repurchasing in the near term.
b) Financial Assets Designated at Fair Value through Profit or Loss (FVTPL)
Financial assets may be designated by management at fair value through profit or loss in the following circumstances:
• The designation eliminates or significantly reduces the inconsistent treatment that would otherwise arise from measuring the assets or recognizing gains or losses on them on a different basis or
• The assets are part of a group of financial assets, financial liabilities or both, which are managed and their performance evaluated and reported on a fair value basis.

148
Alliance Finance Company PLC | Annual Report 2016/17
Overview Management Discussion & Analysis
Financial Reports Supplementary information
Financial assets at fair value through profit or loss are recorded in the Statement of Financial Position at fair value. Changes in fair value are recorded in net gain or loss on financial instrument designated at fair value through profit or loss. Interest earned or incurred is accrued in interest income using the effective interest rate (EIR), while dividend income is recorded in other operating income when the right to the payment has been established.
3.4.2.2 Held-To-Maturity Financial InvestmentsHeld-to-maturity financial investments are non–derivative financial assets with fixed or determinable payments and fixed maturities, which the Group has the intention and ability to hold to maturity.
Subsequent to initial recognition, held to maturity financial investments are measured at amortised cost using the Effective Interest Rate (EIR), less impairment. Amortised cost is calculated by taking into account any discount or premium on acquisition and fees that are an integral part of the EIR. The amortisation is included in ‘Interest income’ in the Statement of Profit or Loss. The losses arising from impairment of such investments are recognised in the Statement of Profit or Loss line ‘Impairment gain/ (loss) on financial investment’.
If the Group were to sell or reclassify more than an insignificant amount of held to maturity investments before maturity (other than in certain specific circumstances), the entire category would be tainted
and would have to be reclassified as Available-for-sale. Furthermore, the Group would be prohibited from classifying any financial asset as held to maturity during the following two years. The Group has not designated any financial instrument as Held-to-Maturity Financial Investment.
3.4.2.3 Due from Banks and Loans and Receivables from CustomersDue from banks and loans & receivables from customers include non– derivative financial assets with fixed or determinable payments that are not quoted in an active market.
‘Due from banks and loans and receivables from customers’ include Loans and Advances and Lease Receivables of the Group.
After initial measurement, amounts ‘Due from banks’ and ‘Loans and receivables from customers’ are subsequently measured at amortised cost using the EIR, less provision for impairment. Amortised cost is calculated by taking into account any discount or premium on acquisition and fees and costs that are an integral part of the EIR. The amortisation is included in ‘Interest income’ in the Statement of Profit or Loss. The losses arising from impairment are recognised in the Statement of Profit or Loss in Impairment charges on loans & other losses.
3.4.2.4 Available for Sale Financial InvestmentsAvailable for sale investments include equity and debt securities. Equity investments classified as available for sale are those which are neither classified as held for trading nor designated at fair value through profit or loss. Debt securities in this category are intended to be held for an indefinite period of time and may be sold in response to needs for liquidity or in response to changes in the market conditions. The Group has not designated any loans or receivables as available for sale. After initial measurement, available for sale financial investments are subsequently measured at fair value.
Unrealised gains and losses are recognised directly in equity through Other Comprehensive Income in the ‘Available for Sale Reserve’. When the investment is disposed of, the cumulative gain or loss previously recognised in Equity is recognised in the Statement of Profit or Loss in ‘Other operating income’. Where the Group hold more than one investment in the same security, they are deemed to be disposed of on a first–in first–out basis. Interest earned whilst holding available for sale financial investments is reported as Interest Income using the EIR. Dividends earned whilst holding available for sale financial investments are recognised in the Statement of Profit or Loss as ‘other operating income’ when the right to receive the payment has been established. The losses arising from impairment of such investments are recognised in the Statement of Profit or Loss in ‘Impairment losses on financial investments’ and removed from the Available for Sale Reserve.
Significant Accounting Policies

148 149
Alliance Finance Company PLC | Annual Report 2016/17
Overview Management Discussion & Analysis
Financial Reports Supplementary information
3.4.3 Derivative Financial InstrumentsDerivatives are financial instruments that derive their value in response to changes in interest rates, financial instrument prices, commodity prices, foreign exchange rate, credit risk and indices. Derivatives are categorized as trading unless they are designated as hedging instruments.
All derivatives are initially recognized and subsequently measured at fair value, with all revaluation gains recognized in the Statement of Profit or Loss (except where cash flow or net investment hedging has been achieved, in which case the effective portion of changes in fair value is recognized within other comprehensive income). Fair values may be obtained from quoted market prices in active markets, recent market transactions, and valuation techniques, including discounted cash flow models and option pricing models, as appropriate. Where the initially recognized fair value of a derivative contract is based on a valuation model that uses inputs that are not observable in the market, it follows the same initial recognition accounting policy as for other financial assets and liabilities. All derivatives are carried as assets when fair value is positive and as liabilities when fair value is negative.
Certain derivatives embedded in other financial instruments, such as the conversion option in a convertible bond held, are valued as separate derivatives when their economic characteristics and risks are not closely related to those of the
host contract and the host contract is not carried at fair value through profit or loss. These embedded derivatives are measured at fair value, with changes in fair value recognized in the Statement of Profit or Loss. Embedded derivatives continue to be presented with the host contract and are not separately disclosed or included within derivatives. The Group did not have separated embedded derivatives as at 31st March 2017.
3.4.4 ‘Day 1’ Profit or LossWhen the transaction price differs from the fair value of other observable current market transactions in the same instrument, or based on a valuation technique whose variables include only data from observable markets, the Group immediately recognises the difference between the transaction price and fair value (a ‘Day 1’ profit or loss) in ‘Net trading income’.
3.4.5 Reclassification of Financial InstrumentsThe Group may reclassify financial assets (other than those designated at FVTPL upon initial recognition), in certain circumstances:
• out of the ‘held for trading’ category and into the ‘available for sale ‘or ‘loans and receivables’, or ’held to maturity’ categories.
• out of the ‘available for sale’ category and into the ’loans and receivables’, ‘held for trading category’ or ‘held- to-maturity’.
Reclassifications are recorded at fair value at the date of reclassification, which becomes the new amortised cost. For a financial asset with a fixed maturity reclassified out of the ’available for sale’ category, any previous gain or loss on that asset has been recognised in Equity is amortised to profit or loss over the remaining life of the asset using the EIR.In the case of a financial asset does not have a fixed maturity, the gain or loss is recognised in the profit or loss when the financial asset sold or disposed off. Any difference between the new amortised cost and the expected cash flow is also amortised over the remaining life of the asset using the EIR. If the asset is subsequently determined to be impaired, then the amount recorded in equity is recycled to the Statement of Profit or Loss.
Out of the ‘held for trading’ category and into the ‘loans and receivables’ category, if it meets the definition of loans and receivables and the Group has the intention and ability to hold the financial asset for the foreseeable future or until maturity. If a financial asset is reclassified, and if the Group subsequently increases its estimates of future cash receipts as a result of increased recoverability of those cash receipts, the effect of that increase is recognised as an adjustment to the EIR from the date of the change in estimate.
Reclassification is at the election of management, and is determined on an instrument by instrument basis.

150
Alliance Finance Company PLC | Annual Report 2016/17
Overview Management Discussion & Analysis
Financial Reports Supplementary information
3.4.6 De-recognition of Financial AssetsA financial asset (or, where applicable a part of a financial asset or part of a group of similar financial assets) is de-recognised when:
• The rights to receive cash flow from the asset Which has expired
• The Group has transferred its rights to receive cash flow from the asset or has assumed an obligation to pay the received cash flow in full without material delay to a third party under a ‘pass–through’ arrangement; and either:
• The Group has transferred substantially all the risks and rewards of the asset; or
• The Group has neither transferred nor retained substantially all the risks and rewards of the asset, but has transferred control of the asset.
3.4.7 De-recognition of Financial AssetsOn de-recognition of a financial asset, the difference between the carrying amount of the asset, and consideration received and any cumulative gain or loss that had been recognised in the Other Comprehensive Income is recognised in the profit or loss.
When the Group has transferred its rights to receive cash flow from an asset or has entered into a pass–through arrangement, and has neither transferred nor retained substantially all of the risks and rewards of the asset nor transferred control of the asset,
the asset is recognised to the extent of the Group’s continuing involvement in the asset. In that case, the Group also recognises an associated liability.
The transferred asset and the associated liability are measured on a basis that reflects the rights and obligations that the Group has retained. Continuing involvement that takes the form of a guarantee over the transferred asset is measured at the lower of the original carrying amount of the asset and the maximum amount of consideration that the Group could be required to repay.
3.4.8 Impairment of Financial AssetsThe Group assesses at each reporting date, whether there is any objective evidence that a financial asset or a group of financial assets is impaired. A financial asset or a group of financial assets is deemed to be impaired if, and only if, there is objective evidence of impairment as a result of one or more events that have occurred after the initial recognition of the asset (an ‘incurred loss event’) and that loss event (or events) has an impact on the estimated future cash flow of the financial asset or the group of financial assets that can be reliably estimated.
3.4.8.1 Loans, Advances to customers, Leases and Hire PurchaseLosses for impaired loans are recognised promptly when there is objective evidence that impairment of a loan or portfolio of loans has occurred. Impairment allowances are calculated on individual loans and for
groups of loans, this is done collectively. Impairment losses are recorded as charges to the Statement of Profit or Loss. The carrying amount of impaired loans on the reporting date is reduced through the use of impairment allowance accounts. Losses expected from future events are not recognised.
Individually Assessed Loans & Advances, Leases and Hire purchasesFor all loans that are considered individually significant, the Group assesses on a case-by-case basis at each end of the reporting date whether there is any objective evidence that a loan is impaired. The criteria used to determine that there is such objective evidence includes:
• Known cash flow difficulties experienced by the borrower
• Past due contractual payments of either principal or interest
• Breach of loan covenants or conditions
• The probability that the borrower will enter bankruptcy or other financial realisation
• A significant downgrading in credit rating by an external credit rating agency.
Significant Accounting Policies

150 151
Alliance Finance Company PLC | Annual Report 2016/17
Overview Management Discussion & Analysis
Financial Reports Supplementary information
For those loans where objective evidence of impairment exists, impairment losses are determined considering the following factors:
• Group’s aggregate exposure to the customer
• The viability of the customer’s business model and their capacity to trade successfully out of financial difficulties and generate sufficient cash flow to service debt obligations
• The amount and timing of expected receipts and recoveries
• The complexity of determining the aggregate amount and ranking of all creditor claims and the extent to which legal and insurance uncertainties are evident
• The realisable value of security and likelihood of successful repossession
• The likely deduction of any costs involved in recovery of amounts outstanding
Impairment losses are calculated by discounting the expected future cash flow of a loan at its original effective interest rate and comparing the present value with the loan’s current carrying amount. The impairment allowances on individually significant accounts are reviewed more regularly when circumstances require. This normally encompasses re-assessment of the enforceability of any collateral held and the timing and amount of actual and anticipated receipts. Individually assessed
impairment allowances are only released when there is reasonable and objective evidence of a reduction in the established loss estimate.
Collectively assessed loans, advances, leases and hire purchase
Impairment is assessed on a collective basis in two circumstances:
• To cover losses which have been incurred but have not yet been identified on loans subject to individual assessment
• For homogeneous groups of loans that are not considered individually significant.
Incurred but not yet Identified Impairment
Individually assessed loans for which no evidence of loss has been specifically identified on an individual basis are grouped together according to their credit risk characteristics for the purpose of calculating an estimated collective loss. This reflects impairment losses that the Group has incurred as a result of events occurring before the reporting date, which the Group is not able to identify on an individual loan basis, and that can be reliably estimated. These losses will only be individually identified in the future. As soon as information becomes available which identifies losses on individual loans within the group, those loans are removed from the group and assessed on an individual basis for impairment.
The collective impairment allowance is determined after taking into account:
• Historical loss experience in portfolios of similar credit risk
• Management’s experienced judgement as to whether current economic and credit conditions are such that the actual level of inherent losses at the end of the reporting date is likely to be greater or less than that suggested by historical experience.
Homogeneous groups of loans, advances, leases and hire purchaseStatistical methods are used to determine impairment losses on a collective basis for homogeneous groups of loans. Losses in these groups of loans are recorded on an individual basis when individual loans are written off, at which point they are removed from the group.
Following method is used to calculate historical loss experience on a collective basis:
Net flow rate methodUnder this methodology the movement in the outstanding balance of customers in to bad categories over the periods are used to estimate the amount of loans that will eventually be written off as a result of the events occurring before the end of the reporting date which the Group is not able to identify on an individual loan basis, and that can be reliably estimated.

152
Alliance Finance Company PLC | Annual Report 2016/17
Overview Management Discussion & Analysis
Financial Reports Supplementary information
Under above methodology, loans are grouped into ranges according to the number of days in arrears and statistical analysis is used to estimate the likelihood that loans in each range will progress through the various stages of delinquency, and ultimately prove irrecoverable.
Current economic conditions and portfolio risk factors are also evaluated when calculating the appropriate level of allowance required covering inherent loss.
These additional macro and portfolio risk factors may include:
• Recent loan portfolio growth and product mix,
• Unemployment rates, Gross Domestic Production (GDP) growth, inflation
• Exchange rates, interest rates
• Changes in government laws and regulations
Write-off of Loans, Advances, Leases and Hire Purchase
Loans, advances, leases and hire purchase (and the related impairment allowance accounts) are normally written off, either partially or in full, when there are no realistic prospects of recovery. Where such balances are secured, these are generally after receipt of any proceeds from the realisation of security.
Reversals of Impairment
If the amount of an impairment loss decreases in a subsequent period, and the decrease can be related objectively to an event occurring after the impairment was recognised, the excess is written back by reducing the impairment allowance account accordingly. The write-back is recognised in the Statement of Profit or Loss.
3.4.8.2 AvailableforsalefinancialinvestmentsFor available for sale financial investments, the Group assesses at each reporting date whether there is an objective evidence that an investment is impaired. In the case of debt instruments classified as available for sale, the Group assesses individually whether there is objective evidence of impairment.
However, the amount recorded for impairment is the cumulative loss measured as the difference between the amortised cost and the current fair value, less any impairment loss on that investment previously recognised in the Statement of Profit or loss. Future interest income is based on the reduced carrying amount and is accrued using the rate of interest used to discount the future cash flow for the purpose of measuring the impairment loss.
The interest income is recorded as part of ‘Interest and similar income. If, in a subsequent period, the fair value of a debt instrument increases and the increase can be objectively related to a credit event occurring
after the impairment loss was recognised in the Statement of Profit or Loss, the impairment loss is reversed through the Statement of Profit or Loss.
In the case of equity investments classified as available for sale, objective evidence would also include a ‘significant’ or ‘prolonged’ decline in the fair value of the investment below its cost. Where there is an evidence of impairment, the cumulative loss measured as the difference between the acquisition cost and the current fair value, less any impairment loss on that investment previously recognised in the Statement of Profit or Loss is removed from equity and recognised in the Statement of Profit or Loss. Impairment losses on equity investments are not reversed through the Statement of Profit or Loss; increases in the fair value after impairment are recognised in Other Comprehensive Income.
3.4.8.3 Held-to-maturityfinancialassetsAn impairment loss in respect of held-to-maturity financial assets measured at amortised cost is calculated as the difference between its carrying amount and the present value of estimated future cash flows discounted at the asset’s original EIR and is recognized in profit or loss. Interest on impaired assets continues to be recognized through the unwinding of discount. When a subsequent event caused the amount of impairment loss to decrease, the decrease in impairment loss is reversed through profit or loss.
Significant Accounting Policies
152 153
Alliance Finance Company PLC | Annual Report 2016/17
Overview Management Discussion & Analysis
Financial Reports Supplementary information
3.4.9 Collateral ValuationThe Group seeks to use collateral, where possible, to mitigate its risks on financial assets. The collateral comes in various forms such as cash, securities, letters of credit/guarantees, gold, real estate, receivables, and other non-financial assets. The fair value of collateral is generally assessed, at a minimum, at inception and based on the guidelines issued by the Central Bank of Sri Lanka.
Non-financial collateral, such as real estate, is valued based on data provided by third parties such as independent valuers and other independent sources.
3.4.10 Collateral RepossessedThe Group’s policy is to determine whether a repossessed asset is best used for its internal operations or should be sold. Assets determined to be useful for the internal operations are transferred to their relevant asset category at the lower of their repossessed value or the carrying value of the original secured asset.
3.4.11 Repurchase AgreementSecurities purchased under agreements to resell at a specified future date are not recognised in the Statement of Financial Position. The consideration paid, including accrued interest, is recorded in the Statement of Financial Position, within ‘Other Financial Assets, reflecting the transaction’s economic substance as a loan by the Group. The difference between the purchase and resale prices is
recorded in Net Interest Income and is accrued over the life of the agreement using the EIR.
If securities purchased under agreement to resell are subsequently sold to third parties, the obligation to return the securities is recorded as a short sale within ‘Financial liabilities held for trading’ and measured at fair value with any gains or losses included in Net Trading Income.
3.5 Non – Financial Asset
3.5.1 Property, Plant and EquipmentProperty, Plant & Equipment are recognised if it is probable that future economic benefits associated with the asset will flow to the entity and the cost of the asset can be measured reliably in accordance with LKAS 16 on Property, Plant &Equipment. Initially Property, Plant & Equipment are measured at its cost.
Recognition and Measurement
Cost Model
Property, Plant and Equipment is stated at cost except land and building, excluding the costs of day–to–day servicing, less accumulated depreciation and accumulated impairment in value.Such cost includes the cost of replacing part of the equipment when that cost is incurred, if the recognition criteria are met.
Revaluation Model
Land and buildings are measured at fair value, less depreciation on buildings and impairment charged subsequent to the date of the revaluation. Valuations are performed every 3 to 5 years to ensure that the fair value of revalued asset does not differ materially from its carrying amount.
Any revaluation surplus is credited to the Revaluation Reserve included in the Equity of the Statement of Financial Position, except to the extent that it reverses a revaluation decrease of the same asset previously recognised in Statement of Profit or Loss, in which case the increase is recognised in Statement of Profit or Loss. A revaluation deficit is recognised in the Statement of Profit or Loss, except that a deficit directly offsetting a previous surplus on the same asset is directly offset against the surplus in the asset Revaluation Reserve.
Subsequent Cost
These are costs that are recognised in the carrying amount of an asset if it is probable that the future economic benefits embodied within that part of the cost will flow to the Group and it can be reliably measured. The costs of the day-to-day servicing of property and equipment are recognised in profit or loss as incurred.

154
Alliance Finance Company PLC | Annual Report 2016/17
Overview Management Discussion & Analysis
Financial Reports Supplementary information
Depreciation
The Company has reassessed useful life time and changed the method of depreciation policy, reducing balance to the straight-line method from 1st April 2016, further company has apply this changes accordance with LKAS 8 – “Accounting Policies and changes in Accounting estimates and errors”.
The Group provides depreciation from the date the assets are available for use up to the date of disposal, at the following rates on straight line basis over the periods appropriate to the estimated useful lives based on the pattern in which the asset’s future economic benefits are expected to be consumed by the Group.
Category of Asset New Rate of Depreciation per annum %
Previous Rate of
Depreciation per annum %
Building 5 5
Office Equipment 20 12.5-15
Plant & Machinery 20 15
Furniture & Fittings 12.5 10
Cutlery & Crockery 20 50
Motor Vehicles 20 15-25
Computers 33.33 33.33
Detail analysis of the policy change and change of accounting estimation have given in Note No 29.5 and 29.7 accordingly.
Freehold lands are not depreciated. Depreciation of an asset ceases at the earlier of the date that the asset is classified as held for sale or the date that the asset is derecognized
Depreciation does not cease when the asset becomes idle or is retired from active use unless me asset is fully depreciated.
De-Recognition
Property, Plant and Equipment is derecognised on disposal or when no future economic benefits are expected from its use. Any gain or loss arising on derecognition of the asset (calculated as the difference between the net disposal proceeds and the carrying amount of the asset) is recognised in ‘Other Operating Income’ in the Statement of Profit or Loss in the year the asset is derecognised.
3.5.2 Intangible AssetsThe Group’s intangible assets include the value of computer software.
Basis of Recognition
All intangible asset is recognised if it is probable that future economic benefits associated with the asset will flow to the entity and the cost of the asset
can be measured reliably in accordance with the Sri Lanka Accounting Standards LKAS 38 on ‘Intangible Assets’.
Intangible assets acquired separately are measured on initial recognition at cost. Intangible assets are stated in the Statement of Financial Position at cost, less accumulated amortisation and accumulated impairment losses, if any.
Expenditure of internally developed software is recognised as an asset when the Group is able to demonstrate its intention and ability to complete the development and use the software in a manner that will generate future economic benefits, and can reliably measure the costs to complete the development.
Subsequent Expenditure
Subsequent expenditure on intangible assets is capitalised only when it increases the future economic benefits embodied in the specific asset to which it relates. All other expenditure is expensed as incurred.
Amortisation
Group owned intangible assets are amortised over the period of 10 years unless otherwise stated.
Significant Accounting Policies

154 155
Alliance Finance Company PLC | Annual Report 2016/17
Overview Management Discussion & Analysis
Financial Reports Supplementary information
De-recognition of Intangible Assets
The carrying amount of an item of intangible asset is derecognized on disposal or when no future economic benefits are expected from its use. The gain or loss arising from de-recognition of an item of intangible asset is included in the Statement of Profit or Loss when the item is derecognised.
There were no restrictions on the title of the intangible assets as at the reporting date. Further, there were no items pledged as securities for liabilities.
Intangible assets reported Note No. 30 only include computer software and cost of licenses.
3.5.3 Impairment of Non–Financial AssetsThe Group assesses at each reporting date whether there is an indication that an asset may be impaired. If any indication exists, or when annual impairment testing for an asset is required, the Group estimates the asset’s recoverable amount. An asset’s recoverable amount is the higher of an asset’s or CGU’s fair value less costs to sell and its value in use. Where the carrying amount of an asset or CGU exceeds its recoverable amount, the asset is considered impaired and is written down to its recoverable amount. In assessing value in use, the estimated future cash flows are discounted to their present value using a pre–tax discount rate that reflects current market assessments of
the time value of money and the risks specific to the asset. In determining fair value less costs to sell, an appropriate valuation model is used. These calculations are corroborated by valuation multiples, quoted share prices for publicly traded subsidiaries or other available fair value indicators.
For assets, an assessment is made at each reporting date as to whether there is any indication that previously recognised impairment losses may no longer exist or may have decreased. If such indication exists, the Group estimates the asset’s or CGU’s recoverable amount. A previously recognised impairment loss is reversed only if there has been a change in the assumptions used to determine the asset’s recoverable amount since the last impairment loss was recognised. The reversal is limited so that the carrying amount of the asset does not exceed its recoverable amount, nor exceeds the carrying amount that would have been determined, net of depreciation, had no impairment loss been recognised for the asset in prior years. Such reversal is recognised in the Statement of Profit or Loss.
3.6 Finance and Operating Leases
The determination of whether an arrangement is a lease or it contains a lease, is based on the substance of the arrangement and requires an assessment of whether the fulfilment of the arrangement is dependent on the use of a specific asset or assets and the arrangement conveys a right to use the asset.
3.6.1 Finance LeaseAgreements which transfer to counter parties substantially all the risks and rewards incidental to the ownership of assets, but not necessarily legal title, are classified as finance leases. When the Group is a lessor under finance leases the amounts due under the leases, after deduction of unearned charges, are included in ‘Loans and advances to Group’s or ‘Loans and advances to customers’, as appropriate. The finance income receivable is recognised in ‘Net Interest Income’ over the periods of the leases so as to give a constant rate of return on the net investment in the leases.
When the Group is a lessee under finance leases, the leased assets are capitalised and included in ‘Property, Plant and Equipment’ and the corresponding liability to the lessor is included in ‘Other Liabilities’. A finance lease and its corresponding liability are recognised initially at the fair value of the asset or, if lower, the present value of the minimum lease payments. Finance charges payable are recognised in ‘Net Interest Income’ over the period of the lease based on the interest rate implicit in the lease so as to give a constant rate of interest on the remaining balance of the liability.
3.6.2 Operating LeaseAll other leases are classified as operating leases. When acting as lessor, the Group includes the assets subject to operating leases in ‘Property, Plant and Equipment’ and accounts for them accordingly.

156
Alliance Finance Company PLC | Annual Report 2016/17
Overview Management Discussion & Analysis
Financial Reports Supplementary information
Impairment losses are recognised to the extent that residual values are not fully recoverable and the carrying value of the assets is thereby impaired. When the Group is the lessee, leased assets are not recognised on the Statement of Financial Position. Rentals payable and receivable under operating leases are accounted for on a straight-line basis over the periods of the leases and are included in ‘General and administrative expenses’ and ‘Other Operating Income’, respectively.
3.7 Financial Liabilities
3.7.1 Initial recognition and measurementFinancial liabilities within the scope of LKAS 39 are classified as due to customers (Deposits), due to banks, debt issued and other borrowed funds and other financial liabilities as appropriate. The Group determines the classification of its financial liabilities at initial recognition.
The Group classifies financial liabilities as other financial liabilities in accordance with the substance of the contractual arrangement and the definitions of financial liabilities.
The Group recognizes financial liabilities in the Statement of Financial Position when the Group becomes a party to the contractual provisions of the financial liability.
3.7.2 Financial Liabilities at Fair Value through Profit or Loss (FVTPL)Financial liabilities at FVTPL include financial liabilities held-for-trading and financial liabilities designated as such upon initial recognitions at fair value through profit or loss. Subsequent to initial recognition, financial liabilities at FVTPL are measured at fair value, and changes there in recognized in the Statement of Profit or Loss.
Upon initial recognition, transaction cost are directly attributable to the acquisition are recognized in Statement of Profit or Loss as incurred. The criteria for designation of financial liabilities at FVTPL upon initial recognition are the same as those of financial assets at FVTPL. The Group has not designated any financial liabilities upon initial recognition as at fair value through profit or loss.
3.7.3 Other Financial LiabilitiesOther financial liabilities including Due to Customers (Deposits), Due to Banks, Debt issued and Other Borrowed Funds. Other financial liabilities are initially measured at fair value less transaction cost that are directly attributable to the acquisition and subsequently measured at amortised cost using the EIR method.
Amortised cost is calculated by taking into account any discount or premium on the issue and costs that are an integral part of the EIR. The EIR amortisation is included in ‘Interest Expenses’ in the Statement of Profit or Loss.
3.7.4 De-recognition of Financial LiabilitiesA financial liability is derecognised when the obligation under the liability is discharged or cancelled or expired. Where an existing financial liability is replaced by another from the same lender on substantially different terms, or the terms of an existing liability are substantially modified, such an exchange or modification is treated as a derecognition of the original liability and the recognition of a new liability. The difference between the carrying value of the original financial liability and the consideration paid is recognised in Statement of Profit or Loss.
3.8 Provisions
Provisions are recognised when the Group has a present obligation (legal or constructive) as a result of a past event, and it is probable that an outflow of resources embodying economic benefits will be required to settle the obligation and a reliable estimate can be made of the amount of the obligation. The amount recognised is the best estimate of the consideration required to settle the present obligation at the reporting date, taking in to account the risks and uncertainties surrounding the obligation at that date. The expense relating to any provision is presented in the Statement of Profit or Lossnet of any reimbursement.
Significant Accounting Policies
156 157
Alliance Finance Company PLC | Annual Report 2016/17
Overview Management Discussion & Analysis
Financial Reports Supplementary information
3.9 Retirement Benefit Obligations
(i) Gratuity
All the employees of the Group are eligible for gratuity under the Payment of Gratuity Act No. 12 of 1983.
Employees those who have resigned or whose services are terminated other than by retirement are eligible to receive the terminal gratuity under the Payment of Gratuity Act No. 12 of 1983 at the rate of one half of the gross salary applicable to the last month of the financial year in which the employment is terminated or resigned, for each year of completed service, for those who have served in excess of 5 years.
The Group operates an approved non-contributory Gratuity Fund to facilitate the Gratuity payments to the retiring employees of the Group. The Group determines the adequacy of gratuity liability in terms of Payment of Gratuity Act No.12 of 1983. In order to meet this liability, the Group carry forward a provision in the Statement of Financial Position, based on:
• Half a month’s salary of the last month’s salary of the financial year for each completed year of service for all permanent employees who complete service 5 to 10 years,
• One month’s salary of the last month’s salary of the financial year for each completed year of service for all permanent employees who complete service over 10 years but not exceeding 15 years,
• One and half month’s salary of the last month’s salary of the financial year for each completed year of service for all permanent employees who complete service over 15 years but not exceeding 25 years.
• Two months’ salary of the last month’s salary of the financial year for each completed year of service for all permanent employees who complete service over 25 years.
An actuarial valuation is carried out as every year end to ascertain the full liability under gratuity. The valuation was carried out as at 31st March 2017 by M/s Actuarial& Management Consultants (Pvt) Limited, a firm of professional actuaries based on the Projected Unit Credit Method recommended by the actuarial present value of the defined benefit obligation (PV-DBO) under the PUC method.
The Subsidiary company provision has been made for retirement gratuity in conformity with LKAS 19 “Employee Benefits” and applied “Gratuity Formula” method ( i.e Projected unit credit method) to measure the post employee benefit obligation.
Recognition of Actuarial Losses / GainsThe Group recognised the total actuarial gain and losses that arise in calculating the Group’s obligation in respect of gratuity in other comprehensive income during the period which it occurs.
Recognition of Past Service Cost (Applicable only when a plan has been changed)Past Service Cost are recognized as an expense on a straight line basis over the average period until the benefits become vested. If the benefits have already been vested, immediately following the instruction of, or changes to the plan, past service costs are recognized immediately.
Management of the Fund’s AssetsThe assets of the Gratuity Fund and the Employees’ Provident Fund are held separately from those of the Group and are independently administered by a separate management team appointed by the Group. As at 31st March 2017 fair value of plan assets is Rs.154, 218,388/-(2016 - Rs.117, 058,229/-)
158
Alliance Finance Company PLC | Annual Report 2016/17
Overview Management Discussion & Analysis
Financial Reports Supplementary information
(ii) Defined contribution planThe Group also operates a defined contribution plan. The contribution payable to a defined contribution plan is in proportion to the services rendered to the Group by the employees and is recorded as an expense under Personnel Expenses. Unpaid contributions are recorded as a liability.
The Group contributes to the following Schemes:
Employees’ Provident FundThe Parent company and employees contribute 20% and 10% respectively of the employee’s monthly gross salary to the Employees’ Provident Fund.
The subsidiary company’s and employee’s contribute 12% and 8% respectively of the employee’s monthly gross salary to the Employees’ Provident Fund.
Employees’ Trust FundThe Group contributes 3% of the employee’s monthly gross salary excluding overtime to the Employees’ Trust Fund maintained by the Employees Trust Fund Board.
3.10 Taxation
As per the Sri Lanka Accounting Standard –LKAS 12 on ‘Income Taxes’ tax expense (Tax income) is the aggregate amount included in determination of profit or loss for the period in respect of current and
deferred taxes. Income tax expense is recognised in the Statement of Profit or Loss except to the extent it relates to items recognised directly in Equity or in Other Comprehensive Income (OCI), in which case it is recognised in Equity or in OCI.
3.11 Current Taxation
Current tax assets and liabilities consist of amounts expected to be recovered from or paid to the Commissioner General of Inland Revenue in respect of the current year and any adjustment to tax payable in respect of prior years. The tax rates and tax laws used to compute the amount are those that are enacted or substantially enacted by the end of the reporting period. Accordingly, provision for taxation is made on the basis of the accounting profit for the year as adjusted for the taxation purpose in accordance with the provisions of the Inland Revenue Act No. 10 of 2006 and the amendments thereto.
3.12 Deferred Tax
Deferred tax is provided using the liability method on temporary differences at the reporting date between the tax bases of assets and liabilities and their carrying amounts for financial reporting purpose.
Deferred tax assets are recognised for all deductible differences, carried forward of unused tax credits and unused tax losses, to the extent that it is probable that taxable profits will be available against
which the deductible temporary differences and the carry forward of unused tax credits and unused tax losses can be utilised.
The carrying amount of a deferred tax asset is reviewed at end of the reporting period and reduced to the extent it is no longer probable that sufficient taxable profit will be available to allow all or part of the deferred tax asset to be utilised. Unrecognised deferred tax asset are reassessed at end of the reporting period and are recognise to the extent that is probable that future taxable profit will allow the deferred tax asset to be recovered.
Deferred tax assets and liabilities are measured at the tax rate that are expected to apply in the year when the assets are realised or the liabilities are settled, based on tax rates and tax laws that have been enacted or subsequently enacted at end of the reporting period.
Deferred tax assets and deferred tax liabilities are offset if a legally enforceable right exists to set off current tax assets against current tax liabilities and the deferred taxes relate to the same taxable entity and the same taxation authority.
3.13 Value Added Tax on Financial Services (FVAT)
VAT on Financial Services is calculated in accordance with VAT Act No. 14 of 2002 and subsequent amendment thereto. The value base for the
Significant Accounting Policies

158 159
Alliance Finance Company PLC | Annual Report 2016/17
Overview Management Discussion & Analysis
Financial Reports Supplementary information
computation of value added tax on financial services is calculated by adjusting the depreciation computed on rates prescribed by the department of Inland Revenue to the accounting profit before Income Tax and emoluments payable.
3.14 Crop Insurance Levy (CIL)
As per the provisions of the Section 14 of the Finance Act No.12 of 2013, the CIL was introduced with effect from April 01, 2013 and is payable to the National Insurance Trust Fund. Currently CIL is payable at 1% of the profit after tax.
3.15 Withholding Tax on Dividends
Withholding tax that arises from the distribution of dividends by the Group is recognised at the time the liability to pay the related dividend is recognised.
3.16 Nations Building Tax (NBT) on Financial Services
With effect from January 01, 2014, NBT of 2% was introduced on supply of financial services via an amendment to the NBT Act No. 09 of 2009. NBT is chargeable on the same base used for calculation of VAT on Financial Services.
3.17 Economic Service Charge (ESC)
As per provisions of the Economic Service Charge (ESC) Act No. 13 of 2006 and amendments thereto. Currently the ESC was payable on aggregate turnover of the Company at 0.5 % and is deductible from income tax payable
3.18 Commitment and Contingencies
Contingent liabilities are possible obligations whose existence will be confirmed only by uncertain future events or present obligations where the transfer of economic benefit is not probable or cannot be reliably measured. Contingent Liabilities are not recognized in the Statement of Financial Position but are disclosed unless its occurrence is remote. All discernible risks are accounted for in determining the amount of all known liabilities. Details of commitments and contingencies are given in Note 46.
3.19 Recognition of Income and Expenses
Revenue is recognised to the extent that it is probable that the economic benefits will flow to the Group and the revenue can be reliably measured. The following specific recognition criteria must also be met before revenue is recognised.
3.20 Interest Income and Expense
For all financial assets measured at amortised cost, interest bearing financial assets classified as available for sale and financial instruments designated at fair value through profit or loss, interest income or expense is recorded using the EIR method. The EIR is the rate that exactly discounts estimated future cash payments or receipts through the expected life of the financial instrument or a shorter period, where appropriate, to the net carrying amount of the financial asset or financial liability.
The calculation takes into account all contractual terms of the financial instrument and includes any fees or incremental costs that are directly attributable to the instrument and are an integral part of the EIR, but not future credit losses. The carrying amount of the financial asset or financial liability is adjusted if the Group revises its estimates of payments or receipts. The adjusted carrying amount is calculated based on the original EIR and the change in carrying amount is recorded as ’Interest Income’ for financial assets and ’Interest Expense’ for financial liabilities.
However, for a reclassified financial asset for which the Group subsequently increases its estimates of future cash receipts as a result of increased recoverability of those cash receipts, the effect of that increase is recognised as an adjustment to the EIR from the date of the change in estimate.
Once the recorded value of a financial asset or a group of similar financial assets has been reduced due to an impairment loss, interest income continues to be recognised using the rate of interest used to discount the future cash flows for the purpose of measuring the impairment loss.

160
Alliance Finance Company PLC | Annual Report 2016/17
Overview Management Discussion & Analysis
Financial Reports Supplementary information
3.21 Fee and Commission Income
The Group earns fee and commission income from a diverse range of services it provides to its customers. Fee income can be divided into the following two categories:
a) Fee income earned from services that areprovided over a certain period of timeFees earned from services that are provided over a period of time are accrued over that period. These fees include commission income from asset management, custody and other management and advisory fees.
b) Fee income from providing transaction servicesFees arising from negotiating or participating in the negotiation of a transaction for a third party, such as the purchase or sale of business is recognized on completion of the underlying transaction. Fees or components of fees that are linked to a certain performance are recognized after fulfilling the corresponding criteria.
3.22 Dividend Income
Dividend income is recognised when the right to receive the payment is established. Usually, this is the ex-dividend date for equity securities. Dividends are presented in the ‘Other Operating Income’ in Statement of Profit or Loss.
3.23 Net Trading Income
Net trading income includes all gains and losses from changes in fair value and related dividends for financial assets and financial liabilities ‘held for trading’ other than interest income.
3.24 Service Income
Revenue from rendering of services is recognized in the accounting period in which the services are rendered or performed.
3.25 Dividends on Ordinary Shares
Dividends on ordinary shares are recognised as a liability and deducted from equity when they are approved by the Group’s shareholders. Interim dividends are deducted from equity when they are declared and no longer at the discretion of the Group. Dividends for the year that are approved after the reporting date are disclosed as an event after the reporting date.
3.26 Other Income
The recognition of other income is accounted based on accrual basis.
3.27 Statement of Cash Flow
Statement of Cash Flow has been prepared using the ‘Indirect Method’, as stipulated in Sri Lanka Accounting Standard - LKAS 7 ‘Statement of Cash Flows’. Cash and Cash Equivalents comprise short term, highly liquid investments that are readily
convertible to known amounts of cash and are subject to an insignificant risk of changes in value. The Cash and Cash Equivalent include cash in hand and balance in banks.
3.28 Earnings per Share
The Group presents basic earnings per share (EPS) data for its ordinary shares. Basic EPS is calculated by dividing the profit or loss attributable to ordinary shareholders of the Group by the weighted average number of ordinary shares outstanding during the period.
3.29 Operating Segments
A business segment is a distinguishable component of the Group, engaged in providing products or services subject to risks and returns that are different from those of other business segments. Operating results of those segments are reviewed regularly by the Board of Directors to make decisions about resources allocated to each segment and assess its performance, and for which discrete financial information is available.
The primary business format is based on the core business activities of the Group, namely, Lease, Hire Purchase & Consumer Durable, Loans, Pawning, Hiring of Vehicles, Investing in Shares, Investing in Government Securities, Collaboration Finance & Others.
Significant Accounting Policies

160 161
Alliance Finance Company PLC | Annual Report 2016/17
Overview Management Discussion & Analysis
Financial Reports Supplementary information
The management uses its judgement in determining the compositions of these core business activities taking into account the objective of reporting financial information by segment as set forth in Sri Lanka Accounting Standard, SLFRS 8 “Operating Segments”, Segment Reporting and qualitative characteristics of financial statements as identified in the Framework for the Preparation and Presentation of Financial Statements.
The Group’s business activities are carried out in Sri Lanka. Consequently, the economic environment in which the Group operates in is not subject to risk and returns that are significantly deferent on a geographical basis. Hence, disclosure by geographical region has not been provided.
For the purpose of segment reporting disclosures, the information presented in respect of the Group’s business segments is based on the Group’s management and internal reporting structure.
Income recognised in Segments is income which is directly identified and reported in those Segments and expenses directly identified to a particular Segment are charged accordingly, and, expenses that cannot be directly identified to a particular Segment are allocated on bases decided by the management and applied consistently throughout the period. Unallocated items mainly comprise of Head Office expenses.
Measurement of segments assets, liabilities, segment revenue and results are based on the accounting policies set out below. Segments revenue, results, assets and liabilities include items directly attributable to a segment as well as those that can be allocated on a reasonable basis. Segment capital expenditure is the total cost incurred during the period to acquire segments assets that are expected to be used for more than one accounting period.
4. NEW ACCOUNTING STANDARDS 4.1 Issued but not yet Applicable as at 31St March 2017Standard issued but not yet effective up to the date of Group’s financial statements are listed below. This listing is of standards issued, which the Group reasonably expects to be applicable at a future date. The Group intends to adopt those standards when they become effective.
(i) SLFRS 9 - Financial Instruments: Classification and MeasurementThe objective of this Accounting Standard is to establish principles for the financial reporting of financial assets and financial liabilities that will present relevant and useful information to users of financial statements for their assessment of the amounts, timing and uncertainty of an entity’s future cash flow.
The improvements introduced by SLFRS 9 includes a logical model for classification and measurement, a single, forward-looking ‘expected loss’ impairment model and a substantially-reformed approach to hedge accounting.
An entity shall apply this SLFRS to all items within the scope of LKAS 39 ‘Financial Instruments: Recognition and Measurement’.
SLFRS 9 is Applicable from annual reporting periods beginning on or after 1st April 2018, with early adoption permitted.
(ii) SLFRS 15 ‘Revenue from Contracts with Customers’This Accounting Standard establishes a comprehensive framework for determining whether, how much and when revenue is recognized. It replaces existing revenue recognition guidance, including LKAS 18-Revenue, LKAS 11-Construction Contracts and IFRIC 13-Customer Loyalty Programs.
This SLFRS will become Applicable from 1st April 2018 and shall be applied prospectively as of the beginning of the annual period in which it is initially applied. The disclosure requirements of this SLFRS need not to be applied comparative information provided for periods before initial application of this SLFRS.

162
Alliance Finance Company PLC | Annual Report 2016/17
Overview Management Discussion & Analysis
Financial Reports Supplementary information
(iii) SLFRS 16 - LeasesSLFRS 16 sets out the principles for the recognition, measurement, presentation and disclosure of leases for both parties to a contract, i.e. the customer (‘lessee’) and the supplier (‘lessor’). SLFRS 16 will replace Sri Lanka Accounting Standard - LKAS 17 (Leases) and related interpretations. SLFRS 16 introduces a single accounting model for the lessee, eliminating the present classification of leases in LKAS 17 as either operating leases or finance leases.
The new Standard requires a lessee to:• Recognise assets and liabilities for all leases
with a term of more than 12 months, unless the underlying asset is of low value.
• Present depreciation of lease assets separately, from interest on lease liabilities in the income statement.
SLFRS - 16 substantially carry forward the lessor accounting requirement in LKAS-17. Accordingly, a lessor continues to classify its leases as operating leases or finance leases, and to account for those two types of leases differently.
SLFRS 16 will become Applicable from 1st April 2019. The impact on the implementation of the above Standard has not been quantified yet.
The Company is currently in the process of evaluating the potential effect of these standards on its financial statements and the impacts of the adoption of these standards have not been quantified as at the reporting date. Pending the completion of the detailed impact analysis, possible impact for SLFRS 9, SLFRS 15 and SLFRS 16 is not reasonably estimable as at the reporting date.
4.2 New Accounting Standards / Amendments to Existing Accounting Standards Applicable from 1st April 2017
New standards not applicable to the current period and to the Company
SLFRS 14 - Regulatory Deferral Accounts
The objective of this Standard is to specify the financial reporting requirements for regulatory deferral account balances that arise when an entity provides goods or services to Customers at a price or rate that is Subject to rate regulation.
SLFRS 14 is Applicable from 01st April 2016. This Standard did not have any impact on the Consolidated/ Separate Financial Statements of the Group or the Company.
Amendments to Existing Accounting Standards Applicable From 1st April 2016Amendments to existing Accounting Standards with Applicable from 1st April 2016 as published by the Institute of Chartered Accountants of Sri Lanka did not have any impact on the Consolidated/Separate Financial Statements of the Group/Company.
Significant Accounting Policies
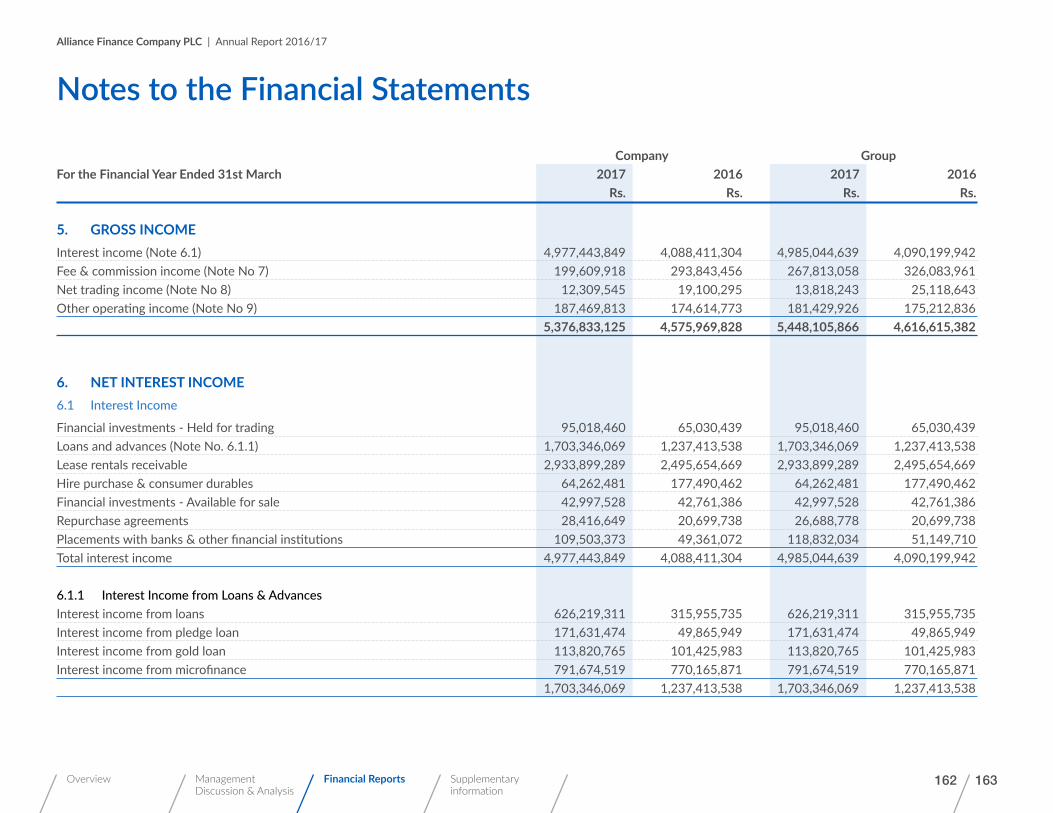
162 163
Alliance Finance Company PLC | Annual Report 2016/17
Overview Management Discussion & Analysis
Financial Reports Supplementary information
Company GroupFor the Financial Year Ended 31st March 2017 2016 2017 2016 Rs. Rs. Rs. Rs.
5. GROSS INCOME Interest income (Note 6.1) 4,977,443,849 4,088,411,304 4,985,044,639 4,090,199,942 Fee & commission income (Note No 7) 199,609,918 293,843,456 267,813,058 326,083,961 Net trading income (Note No 8) 12,309,545 19,100,295 13,818,243 25,118,643 Other operating income (Note No 9) 187,469,813 174,614,773 181,429,926 175,212,836 5,376,833,125 4,575,969,828 5,448,105,866 4,616,615,382
6. NET INTEREST INCOME6.1 Interest Income
Financial investments - Held for trading 95,018,460 65,030,439 95,018,460 65,030,439 Loans and advances (Note No. 6.1.1) 1,703,346,069 1,237,413,538 1,703,346,069 1,237,413,538 Lease rentals receivable 2,933,899,289 2,495,654,669 2,933,899,289 2,495,654,669 Hire purchase & consumer durables 64,262,481 177,490,462 64,262,481 177,490,462 Financial investments - Available for sale 42,997,528 42,761,386 42,997,528 42,761,386 Repurchase agreements 28,416,649 20,699,738 26,688,778 20,699,738 Placements with banks & other financial institutions 109,503,373 49,361,072 118,832,034 51,149,710 Total interest income 4,977,443,849 4,088,411,304 4,985,044,639 4,090,199,942
6.1.1 Interest Income from Loans & AdvancesInterest income from loans 626,219,311 315,955,735 626,219,311 315,955,735 Interest income from pledge loan 171,631,474 49,865,949 171,631,474 49,865,949 Interest income from gold loan 113,820,765 101,425,983 113,820,765 101,425,983 Interest income from microfinance 791,674,519 770,165,871 791,674,519 770,165,871 1,703,346,069 1,237,413,538 1,703,346,069 1,237,413,538
Notes to the Financial Statements
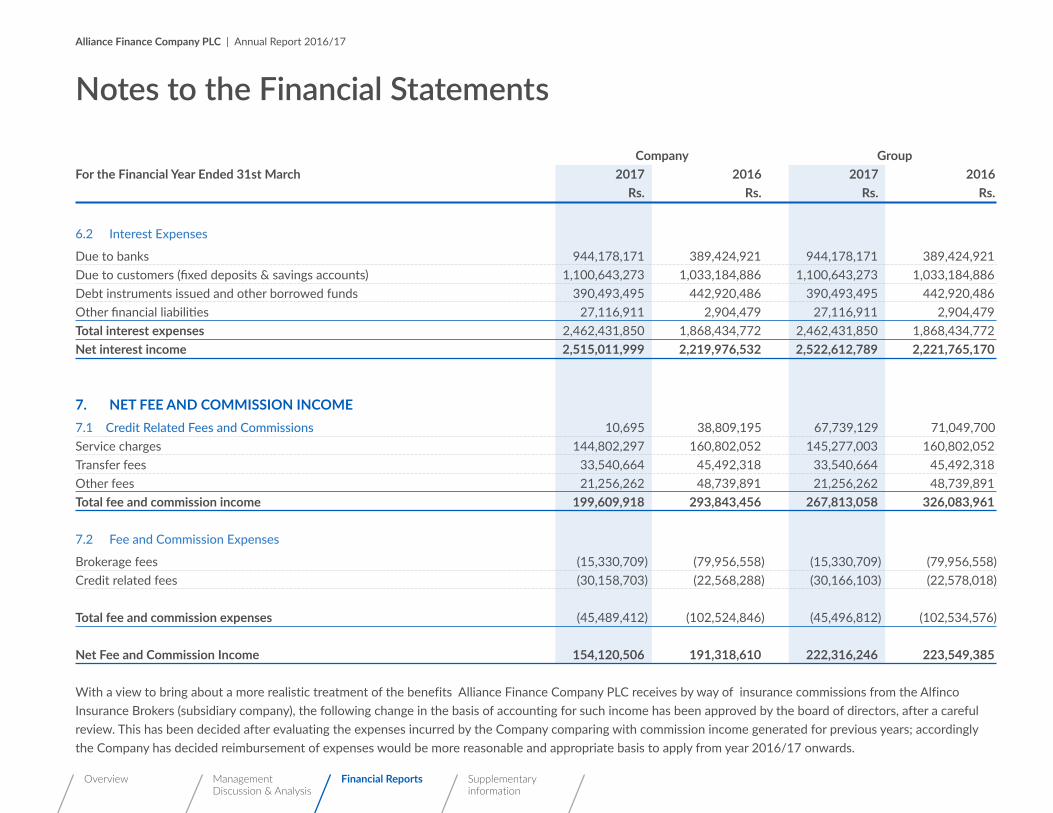
164
Alliance Finance Company PLC | Annual Report 2016/17
Overview Management Discussion & Analysis
Financial Reports Supplementary information
Company GroupFor the Financial Year Ended 31st March 2017 2016 2017 2016 Rs. Rs. Rs. Rs.
6.2 Interest Expenses
Due to banks 944,178,171 389,424,921 944,178,171 389,424,921 Due to customers (fixed deposits & savings accounts) 1,100,643,273 1,033,184,886 1,100,643,273 1,033,184,886 Debt instruments issued and other borrowed funds 390,493,495 442,920,486 390,493,495 442,920,486 Other financial liabilities 27,116,911 2,904,479 27,116,911 2,904,479 Total interest expenses 2,462,431,850 1,868,434,772 2,462,431,850 1,868,434,772 Net interest income 2,515,011,999 2,219,976,532 2,522,612,789 2,221,765,170
7. NET FEE AND COMMISSION INCOME7.1 Credit Related Fees and Commissions 10,695 38,809,195 67,739,129 71,049,700 Service charges 144,802,297 160,802,052 145,277,003 160,802,052 Transfer fees 33,540,664 45,492,318 33,540,664 45,492,318 Other fees 21,256,262 48,739,891 21,256,262 48,739,891 Total fee and commission income 199,609,918 293,843,456 267,813,058 326,083,961
7.2 Fee and Commission Expenses
Brokerage fees (15,330,709) (79,956,558) (15,330,709) (79,956,558)Credit related fees (30,158,703) (22,568,288) (30,166,103) (22,578,018)
Total fee and commission expenses (45,489,412) (102,524,846) (45,496,812) (102,534,576)
Net Fee and Commission Income 154,120,506 191,318,610 222,316,246 223,549,385
With a view to bring about a more realistic treatment of the benefits Alliance Finance Company PLC receives by way of insurance commissions from the Alfinco Insurance Brokers (subsidiary company), the following change in the basis of accounting for such income has been approved by the board of directors, after a careful review. This has been decided after evaluating the expenses incurred by the Company comparing with commission income generated for previous years; accordingly the Company has decided reimbursement of expenses would be more reasonable and appropriate basis to apply from year 2016/17 onwards.
Notes to the Financial Statements

164 165
Alliance Finance Company PLC | Annual Report 2016/17
Overview Management Discussion & Analysis
Financial Reports Supplementary information
Company GroupFor the Financial Year Ended 31st March 2017 2016 2017 2016 Rs. Rs. Rs. Rs.
8. NET GAINS /(LOSSES) FROM TRADINGProfit /(loss) on sale of financial investments held for trading (798,829) 8,235,404 (798,829) 8,235,404 Profit /(loss) on sale of foreign currencies 3,655,211 (227,108) 3,655,211 (227,108)Income from trust investment 15,687,956 43,754,750 17,196,654 49,773,098 Fair value gain / (loss) on financial investments held for trading (6,234,793) (32,662,751) (6,234,793) (32,662,751) 12,309,545 19,100,295 13,818,243 25,118,643
9. OTHER OPERATING INCOMEIncome from investment securities - other investments 13,829,352 8,305,081 7,561,667 8,305,081Profit/(loss) on disposal of property & equipment 13,184,186 19,658,346 13,184,186 19,658,346Profit on sale of vehicles 13,920,181 20,232,478 13,920,181 20,232,478Rental income from hiring vehicles 41,322,633 44,696,882 41,322,633 44,696,882Income from sale of tiles & furniture 2,932,936 290,831 2,932,936 290,831Bad debt recoveries 53,459,244 28,062,262 53,459,244 28,062,262Income from disposal of AFS investments (Note No. 9.1) - 28,155,635 - 27,801,222Loss on liquidation of associates - (354,413) - -Others 48,821,281 25,567,671 49,049,079 26,165,734Total Other Operating Income 187,469,813 174,614,773 181,429,926 175,212,836
9.1 Net Gain /(Loss) from Disposal of Available for Sale Financial Assets
Proceeds from disposal of available for sale financial assets - 44,335,336 - 43,980,923Carrying value of available for sale financial assets disposed - (30,549,631) - (30,549,631)Transfer from available for sale financial assets reserve - 14,369,930 - 14,369,930 - 28,155,635 - 27,801,222
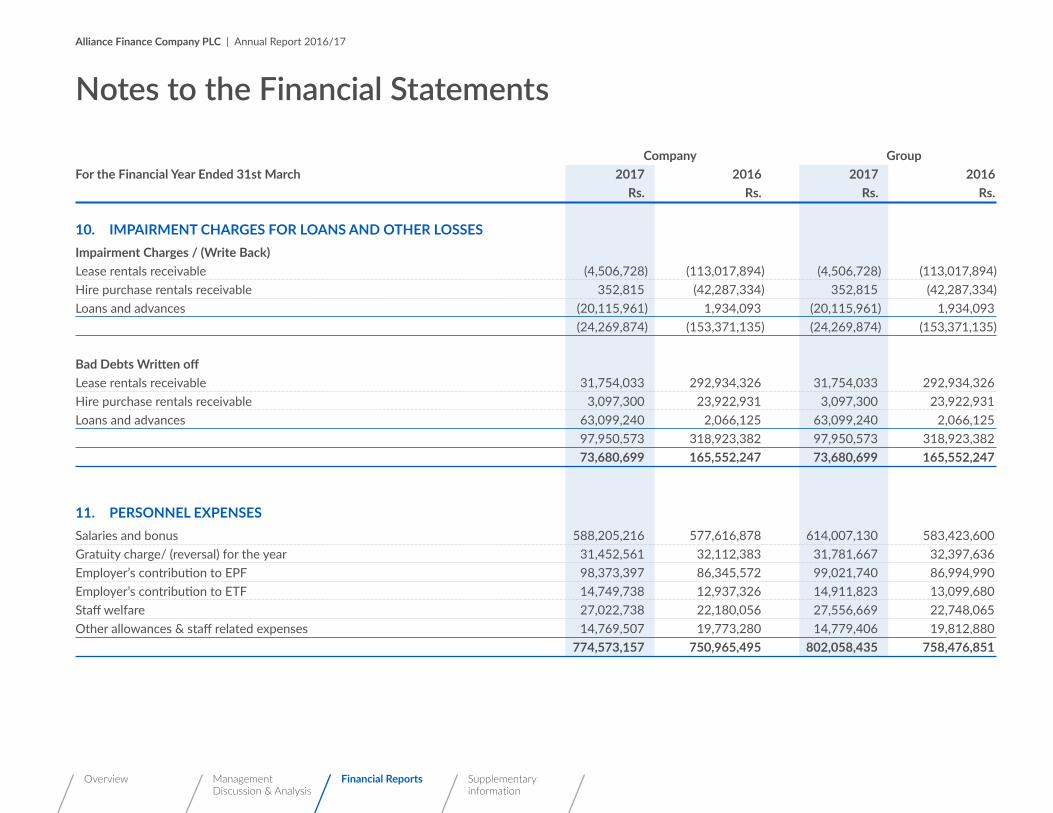
166
Alliance Finance Company PLC | Annual Report 2016/17
Overview Management Discussion & Analysis
Financial Reports Supplementary information
Company GroupFor the Financial Year Ended 31st March 2017 2016 2017 2016 Rs. Rs. Rs. Rs.
10. IMPAIRMENT CHARGES FOR LOANS AND OTHER LOSSESImpairment Charges / (Write Back)Lease rentals receivable (4,506,728) (113,017,894) (4,506,728) (113,017,894)Hire purchase rentals receivable 352,815 (42,287,334) 352,815 (42,287,334)Loans and advances (20,115,961) 1,934,093 (20,115,961) 1,934,093 (24,269,874) (153,371,135) (24,269,874) (153,371,135)
Bad Debts Written offLease rentals receivable 31,754,033 292,934,326 31,754,033 292,934,326Hire purchase rentals receivable 3,097,300 23,922,931 3,097,300 23,922,931Loans and advances 63,099,240 2,066,125 63,099,240 2,066,125 97,950,573 318,923,382 97,950,573 318,923,382 73,680,699 165,552,247 73,680,699 165,552,247
11. PERSONNEL EXPENSESSalaries and bonus 588,205,216 577,616,878 614,007,130 583,423,600Gratuity charge/ (reversal) for the year 31,452,561 32,112,383 31,781,667 32,397,636Employer’s contribution to EPF 98,373,397 86,345,572 99,021,740 86,994,990Employer’s contribution to ETF 14,749,738 12,937,326 14,911,823 13,099,680Staff welfare 27,022,738 22,180,056 27,556,669 22,748,065Other allowances & staff related expenses 14,769,507 19,773,280 14,779,406 19,812,880 774,573,157 750,965,495 802,058,435 758,476,851
Notes to the Financial Statements

166 167
Alliance Finance Company PLC | Annual Report 2016/17
Overview Management Discussion & Analysis
Financial Reports Supplementary information
Company Group 2017 2016 2017 2016 Rs. Rs. Rs. Rs.
12. OTHER OPERATING EXPENSES12.1 Auditor’s fees and expenses Auditor,s fees 794,000 716,000 895,000 822,150 Non audit fees and expenses 610,000 1,148,517 657,000 1,200,317 Professional fees 7,425,182 8,085,877 7,425,182 8,698,677 Office administration & establishment expenses 322,137,322 345,306,860 330,470,849 346,904,871 Advertising & business promotion expenses 52,647,919 62,428,752 63,674,900 62,428,752 Motor vehicle running & maintenance 395,466,509 315,722,661 397,966,917 318,033,148 Impairment loss on unquoted securities 4,284,655 1,173,733 4,284,655 1,173,733 Others 117,711,197 81,209,984 122,004,016 85,261,729 901,056,784 815,792,384 927,378,520 824,523,377
12.2 Depreciation and amortisation
Depreciation / amortisation of property, plant and equipment 110,301,757 99,934,198 110,800,935 101,019,509 Amortization of intangible assets 7,472,368 - 7,522,153 - 117,774,125 99,934,198 118,323,088 101,019,509

168
Alliance Finance Company PLC | Annual Report 2016/17
Overview Management Discussion & Analysis
Financial Reports Supplementary information
Company Group 2017 2016 2017 2016 Rs. Rs. Rs. Rs. Restated Restated
13. TAXATION13.1 The Major Components of Income Tax ExpenseCurrent Income Tax ExpensesCurrent tax on profit for the year ( Note No. 13.2) 214,222,340 128,404,723 219,206,530 134,173,937 Under/ (over) provision of current taxes in respect of prior years - 1,227,399 24,621 1,976,125 Share of income tax expenses for associates 3,485,362 3,362,476 3,485,362 3,362,476 217,707,702 132,994,598 222,716,513 139,512,538
Deferred Tax ExpensesDeferred taxation charge/ (reversal) (Note No. 13.5) (33,037,689) (21,876,849) (33,172,180) (22,093,769) 184,670,014 111,117,749 189,544,344 117,418,769
Current Tax on Profit for the Year - SubsidiaryAlfinco Insurance Brokers (Pvt) Ltd 6,864,927 6,301,020 6,864,927 6,301,020
Notes to the Financial Statements

168 169
Alliance Finance Company PLC | Annual Report 2016/17
Overview Management Discussion & Analysis
Financial Reports Supplementary information
13.2 Reconciliation of Accounting Profit and Taxable Income
A reconciliation between the tax expense and the accounting profit multiplied by government of Sri Lanka’s tax rate for the years ended 31 March 2017 and 2016 is as follows. Company Group 2017 2016 2017 2016 Rs. Rs. Rs. Rs.
Accounting profit before income taxation 834,126,830 530,307,134 851,036,194 553,615,298
Tax effect of non deductible expenses 10,654,291,035 8,706,890,276 10,657,963,585 8,729,732,696 Tax effect of other allowable credits (10,741,040,230) (8,773,943,479) (10,743,821,466) (8,774,404,947)Tax effect of exempt income 17,702,150 (4,460,280) 17,702,150 (10,478,628)Tax effect of tax losses claimed - (205,355) - (205,355) 765,079,785 458,588,296 782,880,463 498,259,064 Tax rate at 28% 28% 28% 28% 28%Income tax for the year 214,222,340 128,404,723 219,206,530 134,173,937
13.3 Applicable Income Tax Rates
Alliance Finance Company PLC 28%Alfinco Insurance Brokers (Pvt) Ltd 28%
13.4 Notional Tax Credit for Withholding Tax on Government Securities on Secondary Market Transactions
The Inland Revenue Act No.10 of 2006, provided that a company which derives interest income from the secondary market transactions in Government Securities ( on or after April 1, 2002 ) would be entitled to a notional tax credit ( being one ninth of the net interest income ) provided such interest income forms part of the statutory income of the Company for that year of assessment.
Accordingly the net interest income earned from the secondary market transactions in Government Securities for the year, has been grossed up in the Financial Statements & the resulting notional tax credit amounts to Rs.13.60 Mn /- (2016 - Rs.11.9 Mn /-)

170
Alliance Finance Company PLC | Annual Report 2016/17
Overview Management Discussion & Analysis
Financial Reports Supplementary information
13.5 Deferred tax expense/(income )
The following table shows deferred tax expense recorded in the profit or loss due to changes in the deferred tax assets and liabilities.
Company Group 2017 2016 2017 2016 Rs. Rs. Rs. Rs. Restated Restated
Deferred Tax LiabilitiesDefined benefit obligation- Profit or Loss 3,105,698 2,390,215 3,030,919 2,194,756Other temporary differences 8,214,555 - 8,214,555 -Accelerated depreciation - Leased assets - 3,157,106 - 3,157,106Accelerated depreciation - Own assets - - (59,712) (21,461)Lease rentals 277,279,325 90,877,487 277,279,325 90,877,487 288,599,579 96,424,808 288,465,088 96,207,888
Deferred Tax AssetsAccelerated depreciation - own assets 22,113,526 99,424,399 22,113,526 99,424,399Accelerated depreciation - Leased assets 12,678,059 - 12,678,059 -Other temporary differences 283,348,696 14,346,470 283,348,696 14,346,470 318,140,281 113,770,869 318,140,281 113,770,869Total Deferred tax expense / Reversal (29,540,702) (17,346,061) (29,675,193) (17,562,981)Defined benefit obligation - Other Comprehensive Income (3,496,987) (4,530,789) (3,496,987) (4,530,789)Deferred tax expense adjusted through Profit or Loss (33,037,689) (21,876,849) (33,172,180) (22,093,769)
14. EARNINGS PER ORDINARY SHAREBasic earnings per share is calculated by dividing the net profit for the year attributable to ordinary shareholders by weighted average number of ordinary shares outstanding during the year, as per LKAS 33- Earnings Per Share.
Notes to the Financial Statements

170 171
Alliance Finance Company PLC | Annual Report 2016/17
Overview Management Discussion & Analysis
Financial Reports Supplementary information
Company GroupFor the year ended 31 st March 2017 2016 2017 2016 Rs. Rs. Rs. Rs. Restated Restated
Amounts Used as the Numerators:Net profit/ (loss) attributable to ordinary shareholders for basic Earnings Per Share 649,456,817 419,189,385 653,314,168 430,063,754
Number of Ordinary Shares Used as Denominators for Basic Earnings per shareWeighted average number of ordinary shares in issue (Note No. 38) 32,724,000 32,400,000 32,724,000 32,400,000Basic earnings per ordinary share (Rs.) 20 13 20 13
The company diluted EPS is equal to the Basic Earning per Ordinary Share since the Company does not have any convertible securities as at the reporting date.
14.1 Weighted Average Number of Ordinary Shares for Basic Earnings per Share
Outstanding No. of Shares Weighted average No. of Shares 2017 2016 2017 2016Number of shares in issue as at April 01 st, 2,430,000 2,430,000 2,430,000 2,430,000Add: Number of shares increased as a Share Split 21,870,000 - 21,870,000 21,870,000 24,300,000 2,430,000 24,300,000 24,300,000
Add: No of shares satisfied in the form of issue and allotment of new shares by using General Reserves 8,100,000 - 8,100,000 8,100,000 32,400,000 2,430,000 32,400,000 32,400,000Add: No of shares issue and satisfied in the form of issue and allotment of new shares in right issue scheme 1,296,000 - 324,000 -Weighted average number of ordinary shares for basic earnings per ordinary share calculation 33,696,000 2,430,000 32,724,000 32,400,000
Due to the bonus share issue/capitalisation of general reserve and share split, number of ordinary shares outstanding before the event is adjusted as if the event had occurred at the beginning of the earliest period. This change in the number of shares does not need a weighted average calculation. As required by LKAS-33 “ Earning per Share”; the weighted average number of ordinary shares outstanding during the year and previous year were adjusted on account events that have changed the number of ordinary shares outstanding, without a corresponding change in the resources, such as bonus share issue/capitalisation of general reserve and share split.

172
Alliance Finance Company PLC | Annual Report 2016/17
Overview Management Discussion & Analysis
Financial Reports Supplementary information
Company GroupFor the Financial Year Ended 31st March 2017 2016 2017 2016 Rs. Rs. Rs. Rs.
15. DIVIDENDS15.1 Declared and Paid During the Year
Dividends on Ordinary Shares:Interim Dividends Rs.3.70 per share, (2016 , Rs.29) 124,675,200 70,470,000 124,675,200 70,470,000 Final dividend proposed for 2017 - Rs. 2.20 per share (2016 - Rs.24 per share) 74,131,200 58,320,000 74,131,200 58,320,000 198,806,400 128,790,000 198,806,400 128,790,000 Dividend Per Share (Rs.) 5.90 53.00 5.90 53.00
The Board of Directors of the Company has recommended the payment of a final dividend of Rs. 2.20 per share to the ordinary shareholders of the Company for the year ended 31st March 2017. (Company declared Rs. 24 per share in 2016). Final dividend recommended by the Board is to be approved at the forthcoming Annual General Meeting to be held on 30th June 2017. The Company paid interim dividend of Rs. 3.70 in year 2016/17 and Rs. 29 per share in 2015/2016. In accordance with LKAS 10 on ‘Events After the Reporting Period’, above proposed final dividend have not been recognised as a liability as at the year end.
Company GroupFor the Financial Year Ended 31st March 2017 2016 2017 2016 Rs. Rs. Rs. Rs.
16. NET ASSET VALUE PER ORDINARY SHAREAmount used as the numeratorTotal equity attributable to equity holders of the Company 4,064,796,478 2,722,053,364 4,110,440,737 2,763,766,202
Number of ordinary shares used as the denominatorTotal number of ordinary shares 33,696,000 2,430,000 33,696,000 2,430,000
Net assets value per ordinary share 121 1,120 122 1,137
Notes to the Financial Statements

172 173
Alliance Finance Company PLC | Annual Report 2016/17
Overview Management Discussion & Analysis
Financial Reports Supplementary information
17. ANALYSIS OF FINANCIAL INSTRUMENTS BY MEASUREMENT BASISFinancial instruments are measured on an ongoing basis either at fair value or at amortised cost. The summary of Significant Accounting Policies describes how the classes of financial instruments are measured, and how income and expenses, including fair value gains and losses, are recognized. The following table analyses the carrying amounts of the financial instruments by category as defined in LKAS 39 on ‘Financial Instrument Recognition & Measurement’ under the headings of the Statement of Financial Position.
As at 31st March 2017 Fair Value Through L & R at AFS at Fair Total Profit or Loss Amortised Cost Value Financial Assets Rs. Rs. Rs. Rs.
17.1 CompanyCash and cash equivalents - 250,196,373 - 250,196,373 Repurchase agreements - 175,849,048 - 175,849,048 Placements with banks & financial institutions - 1,218,793,508 - 1,218,793,508 Financial investments - Held for trading 1,251,615,776 - - 1,251,615,776 Loans and advances - 7,478,467,024 - 7,478,467,024 Lease rentals receivable & stock out on hire - 15,837,430,513 - 15,837,430,513 Hire purchase rentals receivable & stock out on hire - 167,597,495 - 167,597,495 Financial investments - Available for sale - - 488,324,251 488,324,252 Other financial assets - 255,578,986 - 255,578,986 Total Financial Assets 1,251,615,776 25,383,912,946 488,324,252 27,123,852,974
Other Financial Total Liabilities at Amortised cost Financial Liabilities Rs. Rs.
Due to banks 11,717,899,355 11,717,899,355 Due to customers 10,087,821,914 10,087,821,914 Debt Instruments issued and other borrowed funds 2,548,225,806 2,548,225,806 Other financial liabilities 888,031,755 888,031,755 Total Financial Liabilities 25,241,978,830 25,241,978,830

174
Alliance Finance Company PLC | Annual Report 2016/17
Overview Management Discussion & Analysis
Financial Reports Supplementary information
As at 31st March 2016 Fair Value Through L & R at AFS at Total Profit or Loss Amortised Cost Fair Value Financial Assets Rs. Rs. Rs. Rs.
17.2 Company
Cash and cash equivalents - 143,982,481 - 143,982,481 Repurchase agreements - 735,591,742 - 735,591,742 Placements with banks & financial institutions - 1,834,356,115 - 1,834,356,115 Financial investments - Held for trading 1,081,001,402 - - 1,081,001,402 Loans and advances - 5,603,981,321 - 5,603,981,321 Lease rentals receivable & stock out on hire - 13,283,110,374 - 13,283,110,374 Hire purchase rentals receivable & stock out on hire - 462,569,201 - 462,569,201 Financial investments - Available for sale - - 450,254,097 450,254,097 Other financial assets - 181,511,534 - 181,511,534 Total Financial Assets 1,081,001,402 22,245,102,768 450,254,097 23,776,358,268
Other Financial Total Liabilities at Amortised Cost Rs. Rs.
Financial LiabilitiesDue to banks 8,328,978,742 8,328,978,742 Due to customers 10,464,149,566 10,464,149,566 Debt Instruments issued and other borrowed funds 3,062,414,964 3,062,414,964 Other financial liabilities 884,210,568 884,210,568 Total Financial Liabilities 22,739,753,841 22,739,753,841
Notes to the Financial Statements

174 175
Alliance Finance Company PLC | Annual Report 2016/17
Overview Management Discussion & Analysis
Financial Reports Supplementary information
As at 31st March 2017 Fair Value Through L & R at AFS at Total Profit or Loss Amortised Cost Fair Value Rs. Rs. Rs. Rs.
17.3 Group
Financial AssetsCash and cash equivalents - 294,565,160 - 294,565,160 Repurchase agreements - 175,849,048 - 175,849,048 Placements with banks & financial institutions - 1,273,186,055 - 1,273,186,055 Financial investments - Held for trading 1,251,615,776 - - 1,251,615,776 Loans and advances - 7,478,583,487 - 7,478,583,487 Lease rentals receivable & stock out on hire - 15,837,430,513 - 15,837,430,513 Hire purchase rentals receivable & stock out on hire - 167,597,495 - 167,597,495 Financial investments - Available for sale - - 501,824,252 501,824,252 Other financial assets - 291,358,203 - 291,358,203 Total Financial Assets 1,251,615,776 25,518,569,961 501,824,252 27,272,009,988
Other Financial Total Liabilities at Amortised Cost Rs. Rs.
Financial LiabilitiesDue to banks 11,749,382,430 11,749,382,430Due to customers 10,087,821,914 10,087,821,914 Debt instruments issued and other borrowed funds 2,548,225,806 2,548,225,806 Other financial liabilities 902,782,091 902,782,091 Total Financial Liabilities 25,288,212,241 25,288,212,241
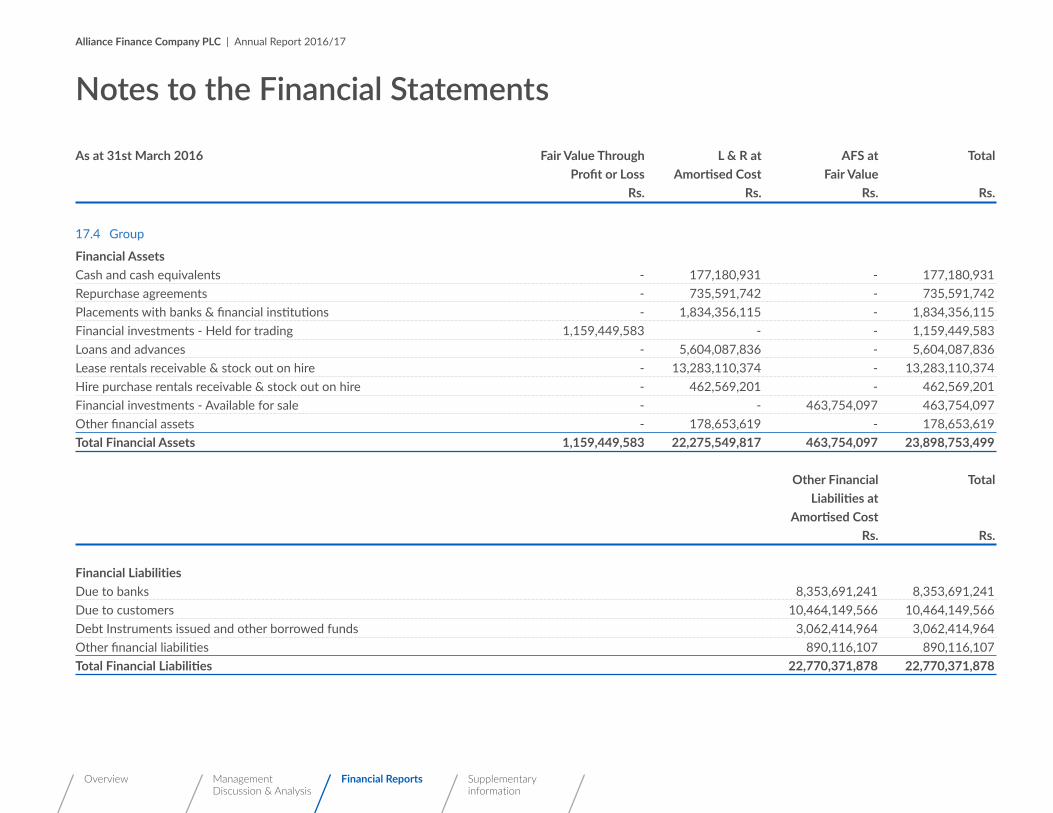
176
Alliance Finance Company PLC | Annual Report 2016/17
Overview Management Discussion & Analysis
Financial Reports Supplementary information
As at 31st March 2016 Fair Value Through L & R at AFS at Total Profit or Loss Amortised Cost Fair Value Rs. Rs. Rs. Rs.
17.4 Group
Financial AssetsCash and cash equivalents - 177,180,931 - 177,180,931 Repurchase agreements - 735,591,742 - 735,591,742 Placements with banks & financial institutions - 1,834,356,115 - 1,834,356,115 Financial investments - Held for trading 1,159,449,583 - - 1,159,449,583 Loans and advances - 5,604,087,836 - 5,604,087,836 Lease rentals receivable & stock out on hire - 13,283,110,374 - 13,283,110,374 Hire purchase rentals receivable & stock out on hire - 462,569,201 - 462,569,201 Financial investments - Available for sale - - 463,754,097 463,754,097 Other financial assets - 178,653,619 - 178,653,619 Total Financial Assets 1,159,449,583 22,275,549,817 463,754,097 23,898,753,499
Other Financial Total Liabilities at Amortised Cost Rs. Rs.
Financial LiabilitiesDue to banks 8,353,691,241 8,353,691,241 Due to customers 10,464,149,566 10,464,149,566 Debt Instruments issued and other borrowed funds 3,062,414,964 3,062,414,964 Other financial liabilities 890,116,107 890,116,107 Total Financial Liabilities 22,770,371,878 22,770,371,878
Notes to the Financial Statements

176 177
Alliance Finance Company PLC | Annual Report 2016/17
Overview Management Discussion & Analysis
Financial Reports Supplementary information
Company GroupFor the Financial Year Ended 31st March 2017 2016 2017 2016 Rs. Rs. Rs. Rs.
18. CASH AND CASH EQUIVALENTSCash in hand 34,700,630 39,907,651 34,706,630 39,909,609 Balances with banks 215,495,743 104,074,830 259,858,530 137,271,322 250,196,373 143,982,481 294,565,160 177,180,931
19. FINANCIAL INVESTMENTS - HELD FOR TRADINGGovernment of Sri Lanka treasury bills 1,053,340,388 583,697,462 1,053,340,388 583,697,462 Quoted equity securities (Note 19.1) 198,275,389 198,773,769 198,275,389 198,773,769 Investments in unit trusts (Note 19.2) - 298,530,171 - 376,978,352 1,251,615,777 1,081,001,402 1,251,615,777 1,159,449,583
2017 2016 Company & Group Company & Group No of Shares Cost of Investment Fair Value No of Shares Cost of Investment Fair Value Rs. Rs. Rs. Rs.
19.1 Quoted EquitiesBanks, Finance & InsuranceSeylan Bank PLC 131,525 14,462,307 11,442,675 136,525 15,020,785 11,741,150 Seylan Bank PLC non voting 49,000 3,468,416 2,680,300 49,000 3,468,416 3,087,000 People’s Leasing Company PLC 529,800 12,043,920 8,264,880 529,800 12,043,920 8,476,800 Ceylinco Insurance PLC - non voting 1,500 602,749 1,230,000 1,500 602,749 1,173,000 Sinhaputhra Finance PLC -preference 50,000 125,000 405,000 50,000 125,000 450,000 Commercial Bank - non voting 78 9,093 8,042 77 8,954 8,701 Central Finance Co PLC 31,000 4,084,490 2,672,200 15,000 4,084,490 3,150,000 Hatton National Bank PLC 25,000 5,591,699 5,632,500 30,071 6,904,933 5,993,150 LB Finance PLC 40,000 5,079,990 4,736,000 - - - Union Bank PLC 91,764 2,366,190 1,303,049 91,764 2,366,190 1,523,282 Merchant Bank of Sri Lanka PLC 385 718,750 4,158 385 718,750 3,927 Sanasa Development Bank 40,867 6,162,667 4,045,833 35,500 5,522,999 4,852,850 54,715,271 42,424,637 50,867,186 40,459,860

178
Alliance Finance Company PLC | Annual Report 2016/17
Overview Management Discussion & Analysis
Financial Reports Supplementary information
2017 2016 Company & Group Company & Group No of Shares Cost of Investment Fair Value No of Shares Cost of Investment Fair Value Rs. Rs. Rs. Rs.
19.1 Quoted Equities (Continued)Land & PropertyEast West Properties PLC 1,867,153 28,371,773 26,326,857 1,867,153 28,371,773 25,206,566 28,371,773 26,326,857 28,371,773 25,206,566
Hotels & TravelsSigiriya Village Hotels PLC 64,902 6,779,287 3,861,669 64,902 6,779,287 3,822,728 Ceylon Hotels Corporation PLC 50,900 2,139,964 977,280 50,900 2,139,964 1,221,600 Mahaweli Reach Hotels PLC 71,928 2,970,734 1,366,632 71,928 2,970,734 1,625,573 Taj Lanka Hotels PLC 17,800 997,893 373,800 17,800 997,893 416,520 Serendib Hotels PLC -non voting 14,510 334,376 290,200 14,510 334,376 253,925 Nuwara Eliya Hotels Company PLC 300 455,040 434,910 300 455,040 412,470 Browns Beach Hotels PLC 100,000 2,231,637 2,130,000 100,000 2,231,637 3,260,000 Stafford Hotels PLC 129,038 7,012,700 4,064,697 129,038 7,012,700 5,419,596 Tangerine Beach Hotels PLC 7,516 630,813 447,202 7,516 630,813 501,317 Crescat- Asian Hotels PLC 30,000 2,120,486 1,590,000 MTD Walkers PLC 45,000 2,803,621 1,575,000 45,000 2,803,621 1,498,500 Hotel Sigiriya PLC 35,000 3,539,200 3,405,500 35,000 3,539,200 3,360,000 29,895,265 18,926,890 32,015,751 23,382,229
ManufacturingCentral Industries PLC 200,000 11,764,452 8,800,000 100,000 11,764,452 8,580,000 Tokyo Cement PLC - non voting 22,000 498,319 1,166,000 22,000 498,319 710,600 Singer Sri Lanka PLC 30,405 3,675,127 4,253,807 30,405 3,675,127 3,578,669Regnis Lanka PLC 100,000 12,317,694 13,490,000 100,000 12,317,694 14,620,000 Lanka Aluminium Industries PLC 10,000 1,152,728 678,000 10,000 1,152,728 700,000 Alumex PLC 250,000 4,550,400 4,750,000 250,000 4,550,400 3,850,000 ACL Plastic PLC - - - 2,120 372,999 328,600 33,958,720 33,127,807 34,331,719 32,367,869
Notes to the Financial Statements
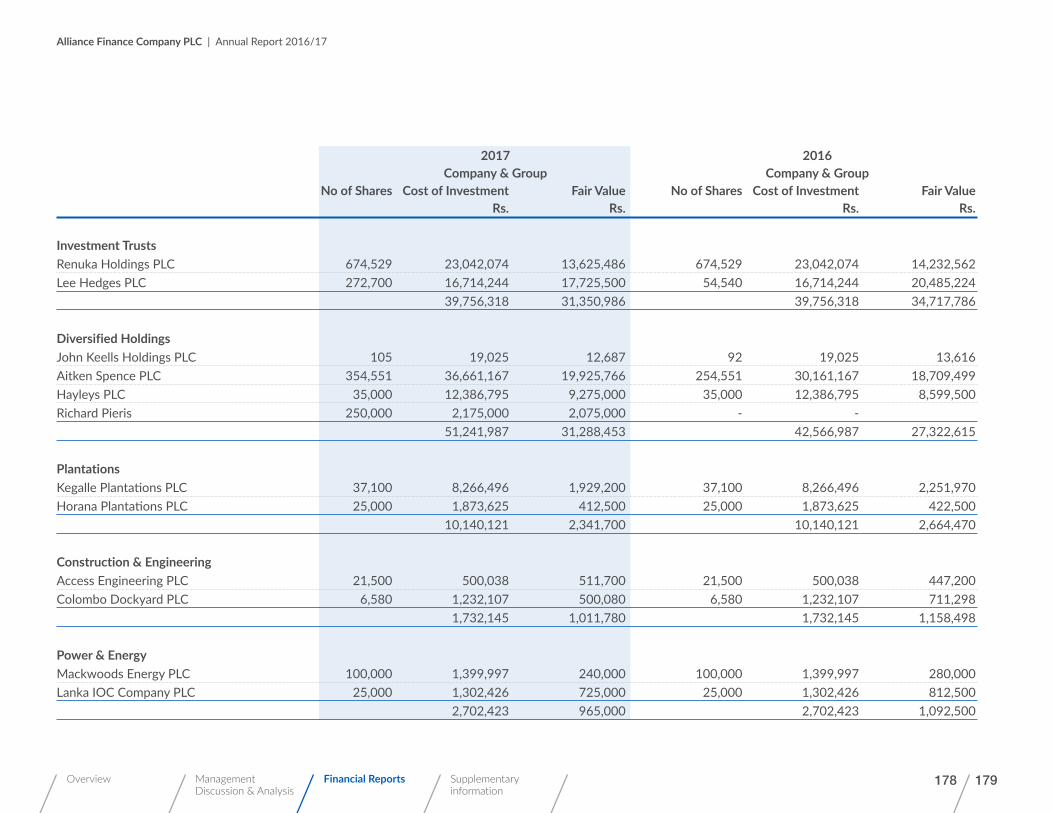
178 179
Alliance Finance Company PLC | Annual Report 2016/17
Overview Management Discussion & Analysis
Financial Reports Supplementary information
2017 2016 Company & Group Company & Group No of Shares Cost of Investment Fair Value No of Shares Cost of Investment Fair Value Rs. Rs. Rs. Rs.
Investment TrustsRenuka Holdings PLC 674,529 23,042,074 13,625,486 674,529 23,042,074 14,232,562 Lee Hedges PLC 272,700 16,714,244 17,725,500 54,540 16,714,244 20,485,224 39,756,318 31,350,986 39,756,318 34,717,786
Diversified HoldingsJohn Keells Holdings PLC 105 19,025 12,687 92 19,025 13,616 Aitken Spence PLC 354,551 36,661,167 19,925,766 254,551 30,161,167 18,709,499 Hayleys PLC 35,000 12,386,795 9,275,000 35,000 12,386,795 8,599,500 Richard Pieris 250,000 2,175,000 2,075,000 - - 51,241,987 31,288,453 42,566,987 27,322,615
PlantationsKegalle Plantations PLC 37,100 8,266,496 1,929,200 37,100 8,266,496 2,251,970 Horana Plantations PLC 25,000 1,873,625 412,500 25,000 1,873,625 422,500 10,140,121 2,341,700 10,140,121 2,664,470
Construction & EngineeringAccess Engineering PLC 21,500 500,038 511,700 21,500 500,038 447,200 Colombo Dockyard PLC 6,580 1,232,107 500,080 6,580 1,232,107 711,298 1,732,145 1,011,780 1,732,145 1,158,498
Power & EnergyMackwoods Energy PLC 100,000 1,399,997 240,000 100,000 1,399,997 280,000 Lanka IOC Company PLC 25,000 1,302,426 725,000 25,000 1,302,426 812,500 2,702,423 965,000 2,702,423 1,092,500

180
Alliance Finance Company PLC | Annual Report 2016/17
Overview Management Discussion & Analysis
Financial Reports Supplementary information
2017 2016 Company & Group Company & Group No of Shares Cost of Investment Fair Value No of Shares Cost of Investment Fair Value Rs. Rs. Rs. Rs.
19.1 Quoted Equities (Continued)
MotorsDiesel & Motor Engineering PLC 17,500 19,143,781 9,798,250 17,500 19,143,781 9,619,750 Colonial Motors PLC 2,285 800,794 171,147 2,285 800,794 205,650 United Motors PLC 6,819 668,851 531,882 6,819 668,851 565,977 20,613,426 10,501,279 20,613,426 10,391,377
Total Investment 273,127,447 198,275,389 263,097,848 198,773,770
2017 2016 No of Units Cost (Initial Fair Value No of Units Cost (Initial Fair Value Investment) Investment) Rs. Rs. Rs. Rs.
19.2 Investments in Unit Trusts
CompanyArrangerCapital Alliance Pvt. Ltd - Corporate treasury fund - - - 19,554,720 292,537,167 298,530,171 - - - 292,537,167 298,530,171
SubsidiaryArrangerCapital Alliance Pvt. Ltd - Corporate treasury fund - - - 5,138,617 70,649,816 78,448,181 - - - - 70,649,816 78,448,181 - - - - 363,186,983 376,978,352
Notes to the Financial Statements

180 181
Alliance Finance Company PLC | Annual Report 2016/17
Overview Management Discussion & Analysis
Financial Reports Supplementary information
Company Group 2017 2016 2017 2016 Rs. Rs. Rs. Rs.
20. LOANS AND ADVANCESTerm loan receivable 3,703,425,411 2,597,028,565 3,703,425,411 2,597,028,565 Gold loans 467,625,639 367,909,866 467,625,639 367,909,866 Pledge loans 1,554,678,053 668,563,924 1,554,678,053 668,563,924 Micro finance loans 1,789,242,332 2,011,667,242 1,789,242,332 2,011,667,242 Loans against fixed deposits 69,187,156 80,958,989 69,187,156 80,958,989 Staff loans (Note 20.3) 8,385,380 12,087,643 8,501,843 12,194,158 Operating lease debtors 1,216,740 1,174,740 1,216,740 1,174,740 7,593,760,711 5,739,390,969 7,593,877,174 5,739,497,484 Less : Allowance for impairment losses (Note 20.1 & 20.2) (115,293,687) (135,409,648) (115,293,687) (135,409,648)Net loans and advances 7,478,467,024 5,603,981,321 7,478,583,487 5,604,087,836
20.1 Allowances for Impairment Losses
As at 01st April 135,409,648 133,475,555 135,409,648 133,475,555 Charge / (Reversal) for the year (20,115,961) 1,934,093 (20,115,961) 1,934,093 As at 31st March 115,293,687 135,409,648 115,293,687 135,409,648

182
Alliance Finance Company PLC | Annual Report 2016/17
Overview Management Discussion & Analysis
Financial Reports Supplementary information
Company Group 2017 2016 2017 2016 Rs. Rs. Rs. Rs.
20.2 Loan Category wise Allowances for Impairment Losses
Term loan receivable 19,839,527 14,077,610 19,839,527 14,077,610 Gold loans 17,127,518 15,074,937 17,127,518 15,074,937 Pledge loans 4,000,535 1,928,031 4,000,535 1,928,031 Micro finance loans 74,326,107 104,329,070 74,326,107 104,329,070 115,293,687 135,409,648 115,293,687 135,409,648
20.3 Staff Loans Include Loans Granted to Company Officers, the Movement of which is as follows :
As at the beginning of the year 12,087,643 14,317,135 12,194,158 14,317,135 Loans granted during the year 17,042,477 16,604,524 17,158,940 16,604,524 Repayments during the year (20,744,740) (18,834,016) (20,851,255) (18,727,501)As at the end of the year 8,385,380 12,087,643 8,501,843 12,194,158
21. LEASE RENTALS RECEIVABLE & STOCK OUT ON HIREGross rentals receivables- Lease rentals 20,760,052,332 17,227,500,643 20,760,052,332 17,227,500,643- Amounts receivable from hirers 628,529,065 417,995,854 628,529,065 417,995,854 21,388,581,397 17,645,496,497 21,388,581,397 17,645,496,497Less: Unearned income (5,355,785,690) (4,162,514,201) (5,355,785,690) (4,162,514,201)Net rentals receivables 16,032,795,707 13,482,982,296 16,032,795,707 13,482,982,296
Less : Allowance for impairment losses (Note 21.1) (195,365,194) (199,871,922) (195,365,194) (199,871,922)Total net rentals receivable (Note 21.2 & 21.3 ) 15,837,430,513 13,283,110,374 15,837,430,513 13,283,110,374
Notes to the Financial Statements

182 183
Alliance Finance Company PLC | Annual Report 2016/17
Overview Management Discussion & Analysis
Financial Reports Supplementary information
Company Group 2017 2016 2017 2016 Rs. Rs. Rs. Rs.
21.1 Allowances for Impairment LossesAs at 01st April 199,871,922 312,889,816 199,871,922 312,889,816Charge / (Reversal) for the year (4,506,728) (113,017,894) (4,506,728) (113,017,894)As at 31st March 195,365,194 199,871,922 195,365,194 199,871,922
As at 31st March 2017 Within one year 1 - 5 years Over 5 years Total Rs. Rs. Rs. Rs.
21.2 Company & GroupGross rentals receivables- Lease rentals 8,087,004,947 12,659,561,924 13,485,461 20,760,052,332- Amounts receivable from hirers 616,802,215 11,726,850 - 628,529,065 8,703,807,162 12,671,288,774 13,485,461 21,388,581,397Less: Unearned income (2,826,836,890) (2,528,948,800) - (5,355,785,690)Net rentals receivables 5,876,970,272 10,142,339,974 13,485,461 16,032,795,707
Less : Allowance for impairment losses (195,365,194)Total net rentals receivable 15,837,430,513
21.3 Company & GroupAs at 31st March 2016Gross rentals receivables- Lease rentals 6,746,859,752 10,456,294,259 24,346,632 17,227,500,643- Amounts receivable from hirers 400,275,796 17,714,387 5,671 417,995,854 7,147,135,548 10,474,008,646 24,352,303 17,645,496,497Less: Unearned income (2,173,449,885) (1,988,212,266) (852,050) (4,162,514,201)Net rentals receivables 4,973,685,663 8,485,796,380 23,500,253 13,482,982,296
Less : Allowance for impairment losses (199,871,922)Total net rentals receivable 13,283,110,374
Lease rentals receivables include receivables amounting to Rs. 6,753,377,016 that have been assigned under a securitisation funding arrangement.

184
Alliance Finance Company PLC | Annual Report 2016/17
Overview Management Discussion & Analysis
Financial Reports Supplementary information
Company Group 2017 2016 2017 2016 Rs. Rs. Rs. Rs.
22. HIRE PURCHASE RENTALS RECEIVABLE & STOCK OUT ON HIREGross rentals receivables- Hire purchase rentals 132,270,625 532,742,659 132,270,625 532,742,659- Amounts receivable from hirers 70,609,450 35,935,139 70,609,450 35,935,139 202,880,075 568,677,798 202,880,075 568,677,798Less: Unearned income (22,759,328) (93,938,160) (22,759,328) (93,938,160)Net rentals receivables 180,120,747 474,739,638 180,120,747 474,739,638
Less : Allowance for impairment losses (Note 22.1) (12,523,252) (12,170,437) (12,523,252) (12,170,437)Total net rentals receivable (Note 22.2 & 22.3) 167,597,495 462,569,201 167,597,495 462,569,201
22.1 Allowance for impairment lossesAs at 01st April 12,170,437 54,457,771 12,170,437 54,457,771Charge / (Reversal) for the year 352,815 (42,287,334) 352,815 (42,287,334)As at 31st March 12,523,252 12,170,437 12,523,252 12,170,437
Within one year 1 - 5 years Over 5 years Total As at 31st March 2017 Rs. Rs. Rs. Rs.
22.2 Company & GroupGross rentals receivables- Hire purchase rentals 83,636,099 48,634,526 - 132,270,625- Amounts receivable from hirers 70,141,740 467,710 - 70,609,450 153,777,839 49,102,236 - 202,880,075Less: Unearned income (18,602,572) (4,156,756) - (22,759,328)Net rentals receivables 135,175,267 44,945,480 - 180,120,747
Less : Allowance for impairment losses (12,523,252)Total net rentals receivable 167,597,494
Notes to the Financial Statements

184 185
Alliance Finance Company PLC | Annual Report 2016/17
Overview Management Discussion & Analysis
Financial Reports Supplementary information
Within one year 1 - 5 years Over 5 years Total As at 31st March 2016 Rs. Rs. Rs. Rs.
22.3 Company & Group
Gross rentals receivables- Hire purchase rentals 307,628,625 225,114,034 - 532,742,659- Amounts receivable from hirers 33,189,849 2,745,290 - 35,935,139 340,818,474 227,859,324 - 568,677,798Less: Unearned income (64,207,595) (29,730,565) - (93,938,160)Net rentals receivables 276,610,879 198,128,759 - 474,739,638
Less : Allowance for impairment losses (12,170,437)Total net rentals receivable 462,569,201
Hire purchase receivables include receivables amounting to Rs.56,861,017 that have been assigned under a securitization funding arrangement.
Company Group 2017 2016 2017 2016 Rs. Rs. Rs. Rs.
23. FINANCIAL INVESTMENTS - AVAILABLE FOR SALEGovernment of Sri Lanka treasury bonds 480,606,721 438,251,912 480,606,721 438,251,912 Unquoted equities (Note 23.1) 7,717,531 12,002,185 21,217,531 25,502,185 488,324,252 450,254,097 501,824,252 463,754,097

186
Alliance Finance Company PLC | Annual Report 2016/17
Overview Management Discussion & Analysis
Financial Reports Supplementary information
2017 2016 Cost of Fair Cost of Fair Investment Value Investment Value Company & Group Rs. Rs. Rs. Rs.
23.1 Unquoted equities
Comptrust Equity Fund 200,500 200,500 200,500 200,500 Commercial Fund Management 1,500 1,500 1,500 1,500 Shaw Wallace Distributors Ltd 11,544 11,544 11,544 11,544 Alliance Agencies Ltd 75,300 75,300 75,300 75,300 Ceylon Japan Industries Ltd 1 1 1 1 Orient Food Processing (Lanka) Ltd 1 1 1 1 Trigem Knitwear Ltd 1 1 1 1 Credit Information Bureau of Sri Lanka 25,400 25,400 25,400 25,400 Finance House Consortium (Pvt) Ltd 200,000 200,000 200,000 200,000 Alliance Tech Trading (Pvt) Ltd 200,000 200,000 200,000 200,000 Orient Hotels Ltd 1 1 1 1 Ranweli Holiday Resorts Ltd 65,001 65,001 65,001 65,001 Jetwing Symphony Ltd 8,250,000 6,494,795 8,250,000 10,061,884 Nation Lanka Equities (Pvt) Ltd 8,785,740 443,487 8,785,740 1,161,052 Total 17,814,989 7,717,531 17,814,989 12,002,185
Unquoted equities of associatesMacbertan (Pvt) Ltd 13,500,000 13,500,000 13,500,000 13,500,000 Total 31,314,989 21,217,531 31,314,989 25,502,185
Notes to the Financial Statements

186 187
Alliance Finance Company PLC | Annual Report 2016/17
Overview Management Discussion & Analysis
Financial Reports Supplementary information
Company Group 2017 2016 2017 2016 Rs. Rs. Rs. Rs.
24. OTHER TRADING STOCKSOther trading stocks 9,775,936 207,857,305 9,775,936 207,857,305 9,775,936 207,857,305 9,775,936 207,857,305
25. OTHER FINANCIAL ASSETSCollaboration debtors 6,039,880 1,793,477 6,039,880 1,793,477 Other receivables 249,539,106 179,718,057 285,318,323 176,860,142 255,578,986 181,511,534 291,358,203 178,653,619
26. OTHER NON FINANCIAL ASSETSPre-paid expenses 110,457,074 104,987,803 110,457,074 104,987,803 Stationery stock account 5,226,639 5,087,147 5,226,639 5,087,147 VAT payables/recoverable 2,655,565 3,370,492 2,674,876 8,071,404 118,339,278 113,445,442 118,358,589 118,146,354

188
Alliance Finance Company PLC | Annual Report 2016/17
Overview Management Discussion & Analysis
Financial Reports Supplementary information
Deemed Cost Carrying Value % Holding Carrying Value Profit Dividend Changes of Adjustment on Adjustment on 01.04.2016 Share Received interest Liquidation Revaluation 31.03.2017 Restated Rs. Rs. Rs. Rs. Rs. Rs. Rs.
27. INVESTMENT IN ASSOCIATESEquity MethodMacbertan (Pvt) Ltd 24.70% 65,834,956 7,414,389 (4,486,903) - - - 68,762,442 65,834,956 7,414,389 (4,486,903) - - - 68,762,442
Equity Method Deemed Cost Carrying Value % Holding Carrying Value Profit Dividend Changes of Adjustment on Adjustment on 01.04.2015 Share Received interest liquidation Revaluation 31.03.2016 Rs. Rs. Rs. Rs. Rs. Rs. Rs. Restated Macbertan (Pvt) Ltd Note - a (i) 24.70% 63,271,188 10,080,460 (2,039,040) (3,153,928) - (2,323,724) 65,834,956 Xesol (Pvt) Ltd 39.62% 6,604,176 - - - (6,604,176) - - 69,875,364 10,080,460 (2,039,040) (3,153,928) (6,604,176) (2,323,724) 65,834,956
Note - a (i)Alliance Finance Company PLC shareholding of Macbertan (Pvt) Ltd has changed from 30% to 24.71% in year 2016, consequent to a new issue of shares. Accordingly loss of Rs.3,153,928/- has been charged to the Profit & Loss.
Note - a (ii)In measuring the differed tax liability on temporary differences relating to the buildings, the company has not considered the amount relating to revaluation surplus. This error has been retrospectively restated in accordance with LKAS 08 ‘Accounting policies, estimates changes and errors”. The error adjusted through statement of Changes in Equity, in the year 2015/16.
Notes to the Financial Statements

188 189
Alliance Finance Company PLC | Annual Report 2016/17
Overview Management Discussion & Analysis
Financial Reports Supplementary information
b) Cost Method 2017 2016 Rs. Rs. No. of Cost of Cost of Ordinary Shares Investment Investment Rs. Rs.
Macbertan (Pvt) Ltd 1,720,000 17,200,000 17,200,000 17,200,000 17,200,000
c) Summary Financial information of the Investment in Associates 2017 2016 Rs. Rs.
Total assets 746,712,867 638,494,788 Total liabilities 468,149,932 371,784,024 Net assets 278,562,935 266,710,764 Revenue 936,555,178 974,735,405 Profits 30,017,771 36,579,748

190
Alliance Finance Company PLC | Annual Report 2016/17
Overview Management Discussion & Analysis
Financial Reports Supplementary information
Principal % Holding Cost of Activity Investment Rs.
28. INVESTMENT IN SUBSIDIARIESAlfinco Insurance Brokers (Pvt) Ltd Insurance Brokering 63.94% 16,924,038
Alfinco Insurance Brokers (Pvt) Ltd not quoted in Colombo Stock Exchange.
As at 31st March 2017 2016 Alfinco Insurance Brokers (Pvt) Ltd Rs. Rs.
28.1 Summarised Financial Information of Subsidiary
Net Operating income 41,683,839 40,645,551 Less: Operating expenses (17,606,769) (17,337,388)Profit before taxes 24,077,070 23,308,163 Less: Taxes (6,866,041) (6,301,020)Profit after tax 17,211,029 17,007,143
Assets 157,971,398 168,556,666 Liabilities 60,110,193 76,844,071 Equity 97,914,472 91,712,595
Notes to the Financial Statements

190 191
Alliance Finance Company PLC | Annual Report 2016/17
Overview Management Discussion & Analysis
Financial Reports Supplementary information
Balance Transfers/ Additions Revaluation Disposals Balance As at Written off As at Gross Carrying Amounts 01.04.2016 31.03.2017 Restated Rs. Rs. Rs. Rs. Rs. Rs.
29. PROPERTY, PLANT AND EQUIPMENT29.1 Company
Cost / Valuation Freehold Assets Land 784,845,627 - - 781,414,436 - 1,566,260,063 Buildings 137,480,776 - - 3,177,580 - 140,658,356 Furniture & fittings 94,470,259 (38,585,713) 8,846,505 - (320,740) 64,410,311 Equipment 267,666,747 (137,750,393) 35,035,929 - (88,169) 164,864,114 Motor vehicles & accessories 274,912,236 76,866,071 377,273 - (47,887,495) 304,268,085 Computers 240,998,213 (156,333,951) 20,582,703 - (549,240) 104,697,725 Antiques 25,580 - - - - 25,580 1,800,399,438 (255,803,985) 64,842,410 784,592,016 (48,845,644) 2,345,184,234
Assets on Finance Lease Motor vehicles 76,866,071 (76,866,071) - - - - Computers 26,251,500 (26,251,500) - - - - 103,117,571 (103,117,571) - - - - 1,903,517,009 (358,921,556) 64,842,410 784,592,016 (48,845,644) 2,345,184,234

192
Alliance Finance Company PLC | Annual Report 2016/17
Overview Management Discussion & Analysis
Financial Reports Supplementary information
Balance Transfers/ Additions Revaluation Disposals Balance As at Written off As at Gross Carrying Amounts 01.04.2016 31.03.2017 Restated Rs. Rs. Rs. Rs. Rs. Rs.
29.1 Property, plant and equipment (Continued)
Depreciation Freehold Assets Land - - - - - - Buildings 11,037,957 - 6,874,039 (13,796,650) - 4,115,346 Furniture & fittings 33,530,329 (30,246,442) 8,586,869 - - 11,870,756 Equipment 124,570,402 (115,985,309) 29,628,155 - (51,562) 38,161,686 Motor vehicles & accessories 107,918,498 16,556,585 33,633,025 - (23,434,886) 134,673,222 Computers 161,179,668 (159,180,535) 31,579,671 - (128,776) 33,450,028 Antiques - - - - - - 438,236,854 (288,855,701) 110,301,759 (13,796,650) (23,615,224) 222,271,038
Assets on Finance Lease Motor vehicles 16,556,585 (16,556,585) - - - - Computers 2,187,625 (2,187,625) - - - - 18,744,210 (18,744,210) - - - - 456,981,064 (307,599,910) 110,301,759 (13,796,650) (23,615,224) 222,271,038
Notes to the Financial Statements

192 193
Alliance Finance Company PLC | Annual Report 2016/17
Overview Management Discussion & Analysis
Financial Reports Supplementary information
Balance Transfers/ Additions Revaluation Disposals Balance As at Written off As at Gross Carrying Amounts 01.04.2016 31.03.2017 Restated Rs. Rs. Rs. Rs. Rs. Rs.
Net Book Value Land 784,845,627 1,566,260,063 Buildings 126,442,819 136,543,010 Furniture & fittings 60,939,930 52,539,555 Equipment 143,096,345 126,702,428 Motor vehicles & accessories 166,993,738 169,594,863 Computers 79,818,545 71,247,697 Antiques 25,580 25,580 1,362,162,584 2,122,913,196 Assets on Finance Lease Motor vehicles 60,309,486 - Computers 24,063,875 - 84,373,361 - Total Value of Depreciable Assets 1,446,535,945 2,122,913,196

194
Alliance Finance Company PLC | Annual Report 2016/17
Overview Management Discussion & Analysis
Financial Reports Supplementary information
Balance Transfers/ Additions Revaluation Disposals Balance As at Written off As at Gross Carrying Amounts 01.04.2016 31.03.2017 Restated Rs. Rs. Rs. Rs. Rs. Rs.
29.2 Group
Cost / ValuationFreehold AssetsLand 784,845,627 - - 781,414,436 - 1,566,260,063Buildings 137,480,776 - - 3,177,580 - 140,658,357Furniture & fittings 95,459,412 (38,585,713) 8,846,505 - (320,740) 65,399,465Equipment 269,958,821 (137,750,393) 35,140,929 - (88,169) 167,261,187Motor vehicles & accessories 275,422,845 76,866,071 377,273 - (48,398,104) 304,268,085Computers 243,445,393 (157,886,951) 20,600,203 - (549,240) 105,609,405Antiques 25,580 - - - - 25,580 1,806,638,453 (257,356,986) 64,964,910 784,592,016 (49,356,253) 2,349,482,142
Assets on Finance LeaseMotor vehicles 76,866,071 (76,866,071) - - - -Computers 26,251,500 (26,251,500) - - - - 103,117,571 (103,117,571) - - - - 1,909,756,024 (360,474,557) 64,964,910 784,592,016 (49,356,253) 2,349,482,142
DepreciationFreehold AssetsLand - - - - - -Buildings 11,037,957 - 6,874,039 (13,796,650) - 4,115,346Furniture & fittings 34,370,532 (30,246,442) 8,640,927 - - 12,765,017Equipment 126,633,641 (115,985,309) 29,772,131 - (51,562) 40,368,901Motor Vehicles & accessories 108,429,107 16,556,585 33,633,025 - (23,945,495) 134,673,222Computers 163,254,692 (160,683,750) 31,880,815 - (128,776) 34,322,981 443,725,929 (290,358,916) 110,800,937 (13,796,650) (24,125,833) 226,245,467
Notes to the Financial Statements

194 195
Alliance Finance Company PLC | Annual Report 2016/17
Overview Management Discussion & Analysis
Financial Reports Supplementary information
Balance Transfers/ Additions Revaluation Disposals Balance As at Written off As at Gross Carrying Amounts 01.04.2016 31.03.2017 Restated Rs. Rs. Rs. Rs. Rs. Rs.
Assets on Finance LeaseMotor vehicles 16,556,585 (16,556,585) - - - -Computers 2,187,625 (2,187,625) - - - - 18,744,210 (18,744,210) - - - - 462,470,139 (309,103,126) 110,800,937 (13,796,650) (24,125,833) 226,245,467
Net book valueLand 784,845,627 1,566,260,063Buildings 126,442,819 136,543,011Furniture & fittings 61,088,880 52,634,448Equipment 143,325,180 126,892,286Motor vehicles & accessories 166,993,738 169,594,863Computers 80,190,701 71,286,424Antiques 25,580 25,580 1,362,912,525 2,123,236,674
Assets on Finance LeaseMotor vehicles 60,309,486 -Computers 24,063,875 - 84,373,361 -Total Value of Depreciable Assets 1,447,285,886 2,123,236,674

196
Alliance Finance Company PLC | Annual Report 2016/17
Overview Management Discussion & Analysis
Financial Reports Supplementary information
29.3 Revaluation of Fixed Assets
The Company revalued its land and buildings as at 31st March 2017, adopting an open market comparable basis of valuation by Ms W.A.T.I.P.Jayathilake & Company and Ms K.T.Nihal & Company being Independent, professional valuers with recent experience in the location category of the property being valued.
29.3.1 Details of Company’s Land Stated at Valuation
Location Valuer Date of Valuation Method of Valuation Net Book Value Before Valuation
Rs.
RevaluationAmount
Rs.
Revaluation Gain/(Loss) Recognised in OCI
Rs.
No.84, Ward Place, Colombo 7
W.A.T.I.P. Jayathilake & Company
15.02.2017 Market Comparable Method
275,000,000 708,500,000 433,500,000
No.199/11, Rajagiriya Road, Rajagiriya
W.A.T.I.P. Jayathilake & Company
31.03.2017 Market Comparable Method
206,250,000 412,500,000 206,250,000
No.98, Ward Place, Colombo 7
K.T. Nihal 01.04.2017 Market Comparable Method
83,105,564 224,770,000 141,664,436
564,355,564 1,345,770,000 781,414,436
29.3.2 Details of Company’s Buildings Stated at Valuation
Location Valuer Date of Valuation Method of Valuation Net Book Value Before Valuation
Rs.
RevaluationAmount
Rs.
Revaluation Gain/(Loss) Recognised in OCI
Rs.
No.84, Ward Place, Colombo 7
W.A.T.I.P. Jayathilake & Company
15.02.2017 Market Comparable Method
18,132,452 8,187,200 (9,945,252)
No.199/11, Rajagiriya Road, Rajagiriya
W.A.T.I.P. Jayathilake & Company
31.03.2017 Market Comparable Method
9,865,504 19,148,250 9,282,746
No.98, Ward Place, Colombo 7
K.T.Nihal 01.04.2017 Market Comparable Method
13,835,963 31,472,700 17,636,737
41,833,919 58,808,150 16,974,231
Notes to the Financial Statements

196 197
Alliance Finance Company PLC | Annual Report 2016/17
Overview Management Discussion & Analysis
Financial Reports Supplementary information
29.3.3 Valuation Technique and Significant Unobservable Inputs
The following table shows the valuation technique used in measuring the fair value of property, as well as the significant unobservable inputs used:
Valuation Technique Significant Unobservable Inputs Interrelationship between Key Unobservable Inputs and Fair Value Measurements
Land value is based on the market prices of each land respectively.
Market value of Land (Price per Perch) The estimated fair value would increase/ (decrease) if - Market value per perch was higher (Lower)
29.4 Measurement of Fair Values
29.4.1 Fair Value HierarchyThe fair value measurement for freehold lands have been categorized as a Level 3 fair value based on the input to the valuation technique used.
29.4.2 The carrying amount of Company’s revalued assets that would have been included in the Financial Statements had the assets been carried at cost less depreciation are as follows;
Cost Accumulated Net Book Carrying Value at Cost As At Depreciation Value As At 31.03.2017 As At 31.03.2017 31.03.2017 Rs. Rs. Rs.
Land 65,330,093 - 65,330,093Building 145,605,564 6,892,056 138,713,508 210,935,657 6,892,056 204,043,601

198
Alliance Finance Company PLC | Annual Report 2016/17
Overview Management Discussion & Analysis
Financial Reports Supplementary information
Revalued Amount Accumulated Net Book Carrying value at Revaluation As At Depreciation Value As At 31.03.2017 As At 31.03.2017 31.03.2017 Rs. Rs. Rs.
29.4.2 Measurement of fair Values (continued)
Land 1,345,770,000 - 564,980,564Building 58,808,150 - 58,808,150 1,404,578,150 - 623,788,714
29.4.3 Details of Freehold Land and Buildings as at 31st March 2017
Extent Cost or Building Cost or Total ValueLocation (Perches) Revaluation of (Square Feet) Revaluation of Land Building Rs. Rs. Rs.
No 84 Ward Place Colombo - 7 37.33 P 708,500,000 6,967 8,187,200 716,687,200No. 199/11, Obesekara Crescent, Rajagiriya Road, Rajagiriya 165 P 412,500,000 16,508 19,148,250 431,648,250No.98, Ward Place, Colombo - 7 19.41 P 224,770,000 8,460 31,472,700 256,242,700No.152, Batapadura Watta Road, Siyambalagoda 28 P 732,470 - - 732,470No.720, Kotte Road, Rajagiriya 33.85 P 130,253,800 - - 130,253,800No.722, Kotte Road, Rajagiriya 23.26 P 89,503,793 16,660 81,850,207 171,354,000Freehold Land and Building 1,566,260,063 140,658,357 1,706,918,420
Notes to the Financial Statements

198 199
Alliance Finance Company PLC | Annual Report 2016/17
Overview Management Discussion & Analysis
Financial Reports Supplementary information
29.5 Impact on Accounting Policy Change
The Company has changed its existing depreciation policy from ‘reducing balance’ method to ‘straight line’ method with effect from 01.04.2016. Due to this change, accumulated depreciation increased by 13,829,928 as well as did result in a deferred tax impact of Rs. 3,872,380. Further in accordance with LKAS 8 -Accounting Policies changes in accounting estimates and errors changes, the relevant variables were adjusted retrospectively. Asset class wise impact is given below.
Class of assets Rs.Building 3,261,456 Furniture 2,988,445 Machinery 1,206,039 Office equipment 6,373,988 13,829,928 29.6 Reclassification and Reassessment of Company Fixed Assets
The company carried out a physical verification as at 01.04.2016 and written off done to the relevant classes of assets are as follows.
Rs.Computers 26,111,607 Furniture & Fittings (8,339,271)Office Equipment (21,765,084) (3,992,748)
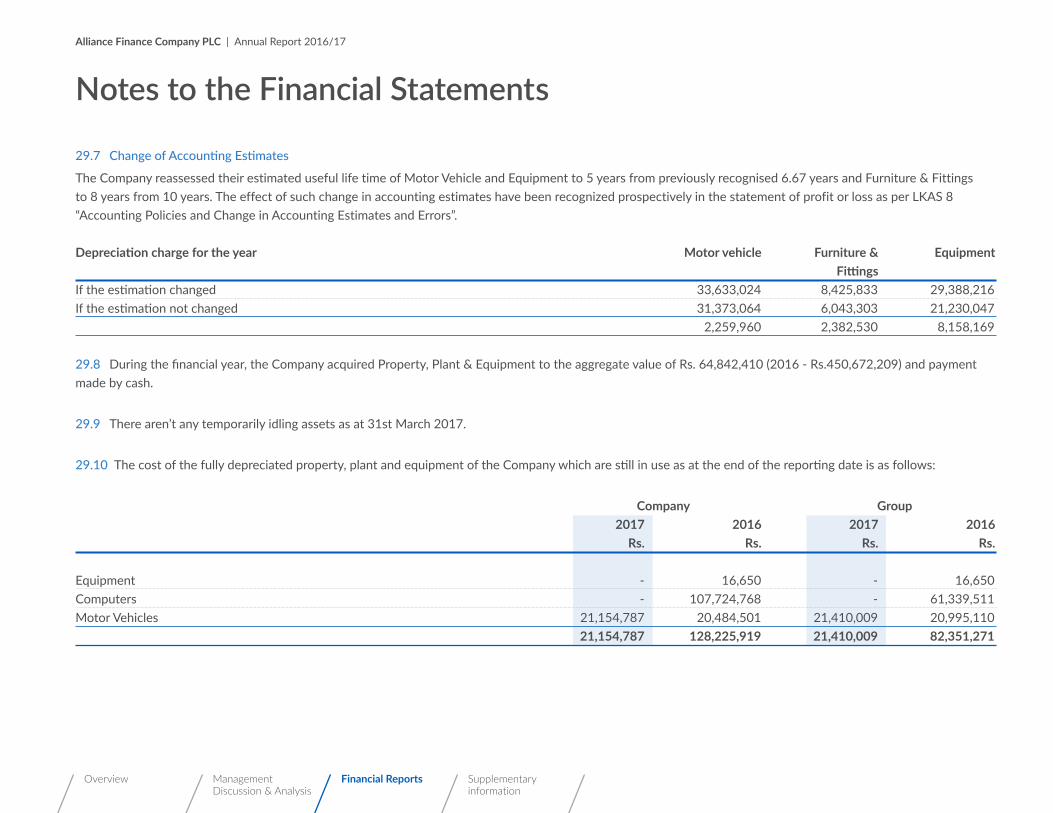
200
Alliance Finance Company PLC | Annual Report 2016/17
Overview Management Discussion & Analysis
Financial Reports Supplementary information
29.7 Change of Accounting Estimates
The Company reassessed their estimated useful life time of Motor Vehicle and Equipment to 5 years from previously recognised 6.67 years and Furniture & Fittings to 8 years from 10 years. The effect of such change in accounting estimates have been recognized prospectively in the statement of profit or loss as per LKAS 8 “Accounting Policies and Change in Accounting Estimates and Errors”.
Depreciation charge for the year Motor vehicle Furniture & Equipment Fittings If the estimation changed 33,633,024 8,425,833 29,388,216If the estimation not changed 31,373,064 6,043,303 21,230,047 2,259,960 2,382,530 8,158,169 29.8 During the financial year, the Company acquired Property, Plant & Equipment to the aggregate value of Rs. 64,842,410 (2016 - Rs.450,672,209) and payment made by cash.
29.9 There aren’t any temporarily idling assets as at 31st March 2017.
29.10 The cost of the fully depreciated property, plant and equipment of the Company which are still in use as at the end of the reporting date is as follows:
Company Group 2017 2016 2017 2016 Rs. Rs. Rs. Rs.
Equipment - 16,650 - 16,650Computers - 107,724,768 - 61,339,511Motor Vehicles 21,154,787 20,484,501 21,410,009 20,995,110 21,154,787 128,225,919 21,410,009 82,351,271
Notes to the Financial Statements

200 201
Alliance Finance Company PLC | Annual Report 2016/17
Overview Management Discussion & Analysis
Financial Reports Supplementary information
Balance Additions Transfers Balance As at As at 01.04.2016 31.03.2017 Rs. Rs. Rs. Rs.
30. INTANGIBLE ASSETS30.1 Company
Gross Carrying AmountsCost / ValuationComputer Software - Freehold - 9,642,092 37,587,118 47,229,210 Computer Software - Leasehold - - 26,251,500 26,251,500 - 9,642,092 63,838,618 73,480,710
AmortizationFreehold AssetsComputer Software - Freehold - 7,472,368 14,322,094 21,794,462 Computer Software - Leasehold - - 2,187,625 2,187,625 - 7,472,368 16,509,719 23,982,087
Net Book ValueComputer Software - Freehold - - - 25,434,748 Computer Software - Leasehold - - - 24,063,875 - - - 49,498,623

202
Alliance Finance Company PLC | Annual Report 2016/17
Overview Management Discussion & Analysis
Financial Reports Supplementary information
Balance Additions Transfers Balance As at As at 01.04.2016 31.03.2017 Rs. Rs. Rs. Rs.
30.2 Group
Cost / ValuationComputer Software - Freehold - 9,642,092 39,140,118 48,782,210 Computer Software - Leasehold - - 26,251,500 26,251,500 - 9,642,092 65,391,618 75,033,710
AmortizationFreehold AssetsComputer Software - Freehold - 7,522,153 15,825,309 23,347,462 Computer Software - Leasehold - - 2,187,625 2,187,625 - 7,522,153 18,012,934 25,535,087
Net Book ValueComputer Software - Freehold - - - 25,434,748 Computer Software - Leasehold - - - 24,063,875 - - - 49,498,623
During the year the Company reclassified Computer hardware and software accounted for as fixed assets, and investments in software were separately disclosed as an Intangible Asset. Accordingly Rs 39,140,118 worth of investments in software were transferred from Property, Plant and Equipment (PPE), as intangible assets and such assets are accounted for at cost less accumulated amortization and any accumulated impairment losses.
Notes to the Financial Statements

202 203
Alliance Finance Company PLC | Annual Report 2016/17
Overview Management Discussion & Analysis
Financial Reports Supplementary information
Company Group 2017 2016 2017 2016 Rs. Rs. Rs. Rs.
31. DUE TO BANKSBank overdrafts 441,798,937 234,247,782 473,282,013 258,960,281Securitised borrowings and other bank facilities (Note 31.1 , 31.2 & 31.3 ) 11,260,316,698 8,063,318,111 11,260,316,698 8,063,318,111Finance lease (31.4) 15,783,720 31,412,849 15,783,719 31,412,849Total 11,717,889,355 8,328,978,742 11,749,382,430 8,353,691,241
Company and Group As at Loans Interest Repayments As at Period Security 31.03.2016 Obtained Recognized 31.03.2017 Securitised Borrowings Rs. Rs. Rs. Rs. Rs.
31.1 Securitised Borrowings, Syndicated Loans and Other Bank Facilities
Deutsche Bank Trust - 26 12,071,239 - 118,299 (12,189,538) - 36 Months Lease receivablesDeutsche Bank Trust - 27 119,356,421 - 7,500,991 (126,857,412) - 36 Months Lease receivablesDeutsche Bank Trust - 28 935,179,528 - 79,571,023 (273,012,908) 741,737,642 48 Months Lease/HP receivablesDeutsche Bank Trust - 29 293,502,323 - 19,297,958 (172,742,311) 140,057,970 36 Months Lease/HP receivablesDeutsche Bank Trust - 30 607,428,848 - 66,880,408 - 674,309,257 48 Months Lease receivablesBOC Trust 01 Agora - 479,649,537 56,288,719 (65,384,615) 470,553,641 30 Months Lease receivables 1,967,538,359 479,649,537 229,657,398 (650,186,784) 2,026,658,510

204
Alliance Finance Company PLC | Annual Report 2016/17
Overview Management Discussion & Analysis
Financial Reports Supplementary information
Company and Group As at Loans Interest Repayments As at Period Security 31.03.2016 Obtained Recognized 31.03.2017 Securitised Borrowings Rs. Rs. Rs. Rs. Rs.
31.2 Direct Bank Borrowings
Term LoansBOC Loan 1,397,361,233 400,000,000 114,048,933 (823,751,829) 1,087,658,337 12 Months USD -Fixed depositsCargills Bank 100,000,000 100,000,000 19,500,044 (33,157,451) 186,342,594 48 Months Lease receivablesCommercial Bank 143,058,001 100,000,000 13,871,763 (162,485,317) 94,444,447 36 Months Land & buildingDFCC Bank 54,642,848 - 5,719,138 (60,361,986) - 96 Months Land & buildingDFCC Bank - PCI Loan 116,170,312 - 7,732,024 (23,240,979) 100,661,357 180 Months NilHatton National Bank 155,030,000 - 13,634,867 (64,574,867) 104,090,000 48 Months Lease/HP receivablesNDB Bank 302,002,740 750,000,000 18,629,726 (618,652,466) 451,980,000 03 Months Lease/HP receivablesPublic Bank 94,588,197 320,000,000 27,142,104 (65,453,459) 376,276,842 60 Months Lease receivablesNations Trust Bank - 300,000,000 9,210,280 (159,210,280) 150,000,000 6 Months Lease receivablesReverse repo on treasury bills 185,735,001 485,000,000 11,050,620 (681,785,620) - 7 Days Treasury bondsSampath Bank Loan 584,568,653 1,950,000,000 122,283,001 (799,485,005) 1,857,366,649 36 Months Lease/HP receivablesSeylan Bank 445,899,758 - 47,668,470 (178,175,716) 315,392,512 48 Months Lease receivablesUnion Bank 344,999,993 1,045,000,007 34,824,906 (1,124,854,921) 299,969,985 03 Months Lease/HP receivablesUnion Bank 412,500,000 1,502,178,346 11,910,188 (1,019,788,547) 906,799,986 60 Months Micro finance 5,795,533,177 9,294,858,028 599,090,377 (6,696,143,942) 8,993,337,640
31.3 Foreign Currency Borrowings
Foreign currency Loan capital - Tridos 735,551,441 189,475,000 51,975,025 (49,762,260) 927,239,206 36 Months Micro finance receivableForeign currency Loan capital - Commercial Bank 723,425,000 58,854,676 46,442,788 (828,722,464) - 12 Months NilSymbiotics Index - 743,550,000 27,602,431 - 771,152,431 36 Months NilSymbiotics USD - 744,000,000 13,163,293 - 757,163,293 36 Months NilTriodos Loan-SUB - 606,800,000 2,680,775 (2,680,775) 606,800,000 72 Months Nil 1,458,976,441 2,342,679,676 141,864,314 (881,165,499) 3,062,354,931
Syndication loan 300,246,575 - 27,838,356 (87,764,384) 240,320,548 48 Months Lease/HP receivables 8,063,318,111 9,774,507,565 856,586,132 (7,434,095,110) 11,260,316,698
Notes to the Financial Statements

204 205
Alliance Finance Company PLC | Annual Report 2016/17
Overview Management Discussion & Analysis
Financial Reports Supplementary information
As at New Facilities Repayments As at 01.04.2016 31.03.2017 Rs. Rs. Rs. Rs.
31.4 Finance Lease
31.4.1 Company and groupFinance leases 31,412,849 - (15,629,130) 15,783,720 31,412,849 - (15,629,130) 15,783,720
2017 2016 Rs. Rs.
31.4.2 Finance LeaseGross liability 17,475,039 35,130,889 Less: Finance charges allocated for future periods (1,691,319) (3,718,040)Net liability 15,783,720 31,412,849
Repayable within one yearGross liability 7,766,684 15,702,261 Less: Finance charges allocated for future periods (1,138,713) (2,034,873)Net liability 6,627,971 13,667,388
Repayable within one to five yearsGross liability 9,708,355 19,428,628 Less: Finance charges allocated for future periods (552,606) (1,683,167)Net liability 9,155,749 17,745,461

206
Alliance Finance Company PLC | Annual Report 2016/17
Overview Management Discussion & Analysis
Financial Reports Supplementary information
Company Group 2017 2016 2017 2016 Rs. Rs. Rs. Rs.
32. DUE TO CUSTOMERSFixed deposits 9,501,784,496 9,786,480,092 9,501,784,496 9,786,480,092 Certificates of deposits 100,000 100,000 100,000 100,000 Savings deposits 585,937,418 677,569,474 585,937,418 677,569,474 10,087,821,914 10,464,149,566 10,087,821,914 10,464,149,566
Company Group 2017 2016 2017 2016 Rs. Rs. Rs. Rs.
33. DEBT INSTRUMENTS ISSUED AND OTHER BORROWED FUNDSCommercial papers - 126,630,566 - 126,630,566 Unsecured debentures ( Note No 33.1 ) 2,548,225,806 2,935,784,398 2,548,225,806 2,935,784,398 2,548,225,806 3,062,414,964 2,548,225,806 3,062,414,964
33.1 Unsecured Debentures
Face value 2,400,840,488 2,804,450,488 2,400,840,488 2,804,450,488 Accrued interest 147,385,318 131,333,910 147,385,318 131,333,910 2,548,225,806 2,935,784,398 2,548,225,806 2,935,784,398
Notes to the Financial Statements

206 207
Alliance Finance Company PLC | Annual Report 2016/17
Overview Management Discussion & Analysis
Financial Reports Supplementary information
33.2 Quoted - Debentures
Company and Groupa) The debentures include 10,000,000 Unsecured Redeemable Subordinated Listed Rated Debentures of Rs. 100/- each issued by the company in 2012. The
Debentures are quoted on the Colombo Stock Exchange in November 2013. Debenture type D of 10,000 were redeemed during the financial year. Remaining debentures break up are given below.
Category Period No of Debentures Face Value Rs. Interest payable Rate of Interest
Type ‘A‘ 05 Years 7,524,700 752,470,000 Monthly Fixed - 20% per annum 7,524,700 752,470,000
b) The debentures include 12,000,000 Unsecured Redeemable Listed Rated Subordinated Debentures of Rs. 100/- each issued by the Company in September 2013. The Debentures are quoted on the Colombo Stock Exchange. Debenture Type ‘A’ of rupees 403,600,000 were redeemed during the financial year. Remaining debenture breakup are given below. Debenture Type ‘D’ issued at discount basis.
Category Period No of Debentures Face Value Rs. Interest payable Rate of Interest
Type ‘B‘ 04 Years 1,682,000 168,200,000 Semi-annually Fixed rate of 16% per annumType ‘C‘ 05 Years 3,510,000 351,000,000 Semi-annually Fixed rate of 16.5% per annumType ‘D‘ 05 Years 2,772,000 129,170,488 Annually Zero coupon Debentures with an annually compounding AER of 16.5% 7,964,000 648,370,488
c) The debentures include 10,000,000 Unsecured Redeemable Listed Rated Debentures of Rs. 100/- each issued by the Company in December 2014. The Debentures are quoted on the Colombo Stock Exchange. Details are given below.
Category Period No of Debentures Face Value Rs. Interest payable Rate of Interest
Type ‘A‘ 04 Years 2,000,000 200,000,000 Annually 9% per annumType ‘B‘ 05 Years 8,000,000 800,000,000 Annually 9.35% per annum 10,000,000 1,000,000,000

208
Alliance Finance Company PLC | Annual Report 2016/17
Overview Management Discussion & Analysis
Financial Reports Supplementary information
Company GroupFor the Financial Year Ended 31st March 2017 2016 2017 2016 Rs. Rs. Rs. Rs.
34. OTHER FINANCIAL LIABILITIES Accrued expenses 90,028,937 118,516,728 90,028,937 118,516,728 Others 798,002,818 765,693,840 812,753,154 771,599,379 888,031,755 884,210,568 902,782,091 890,116,107
35. OTHER NON FINANCIAL LIABILITIESVAT payables 42,697,891 22,092,978 42,697,891 22,092,978 Other taxes payables 8,963,128 13,787,425 8,963,128 13,787,425 51,661,019 35,880,403 51,661,019 35,880,403
36. DERIVATIVE FINANCIAL LIABILITIESForeign currency swaps 17,736,580 - 17,736,580 - 17,736,580 - 17,736,580 -
37. INCOME TAX LIABILITYReceivable from Inland Revenue Department (21,950,768) (65,449,990) (21,950,768) (65,449,990)ESC paid (41,449,994) - (41,449,994) -Current tax liabilities 171,613,214 128,404,723 175,060,131 133,040,672 108,212,452 62,954,733 111,659,369 67,590,682
Notes to the Financial Statements

208 209
Alliance Finance Company PLC | Annual Report 2016/17
Overview Management Discussion & Analysis
Financial Reports Supplementary information
Company GroupFor the Financial Year Ended 31st March 2017 2016 2017 2016 Rs. Rs. Rs. Rs.
37.1 Movement of Current Tax Liability
Balance as at 01st April 62,954,733 (49,124,070) 67,590,682 (46,889,005)Current tax Based on profit for the year 214,222,340 128,404,723 221,197,146 134,173,937Over/under Provision in respect of previous years - - 24,612 748,726Payment of tax (168,964,621) (16,325,920) (177,153,071) (20,442,976) 108,212,452 62,954,733 111,659,369 67,590,682
38. RETIREMENT BENEFIT OBLIGATIONSRetirement Benefit Obligations - Gratuity38.1 Liability Recognized in the Balance sheet
Balance at the beginning of the year 91,237,518 99,773,999 92,298,302 100,758,137 Amount charged/(reversed) for the year (Note - 38.2) 22,230,905 15,930,995 22,444,163 16,127,641 Transfer to gratuity trust fund (25,650,000) (20,000,000) (25,650,000) (20,000,000)Payments made during the year (7,672,684) (4,467,476) (7,672,684) (4,587,476)Balance at the end of the year 80,145,738 91,237,518 81,419,781 92,298,302
38.2 Amount Recognised in Profit or Loss
Current service cost for the year 21,514,684 22,055,492 21,726,262 22,247,891 Interest cost for the year 22,904,282 19,208,727 23,021,810 19,301,582 Expected return on plan assets (12,876,405) (9,151,836) (12,876,405) (9,151,836) 31,542,561 32,112,383 31,781,667 32,397,637
Amount Recognised in Other Comprehensive IncomeNet actuarial (gain)/ loss (9,311,656) (16,181,388) (9,427,504) (16,269,996)
Amount Charged/(Reversed) for the year 22,230,905 15,930,995 22,444,163 16,127,641

210
Alliance Finance Company PLC | Annual Report 2016/17
Overview Management Discussion & Analysis
Financial Reports Supplementary information
Company GroupFor the Financial Year Ended 31st March 2017 2016 2017 2016 Rs. Rs. Rs. Rs.
38.3 Changes in the Present Value of Obligation
Present value obligation as at 01st April 208,220,747 192,087,265 208,220,747 192,087,265Interest cost 22,904,282 19,208,727 22,904,282 19,208,727Current service cost 22,424,684 21,123,584 22,424,684 21,123,584Benefits paid / payable (7,597,684) (4,405,476) (7,597,684) (4,405,476)Actuarial (Gain) / Loss (10,677,902) (19,793,353) (10,677,902) (19,793,353)Present value obligation as at 31st March 235,274,127 208,220,747 235,274,127 208,220,747
38.4 Movement in the Present Value of Plan Assets
Value of plan assets as at 01st April 117,058,229 91,518,358 117,058,229 91,518,358Expected return on the plan assets for the period 12,876,405 9,151,836 12,876,405 9,151,836Contribution paid to the plan 25,650,000 20,000,000 - 20,000,000Gratuity paid by the plan assets - - - -Actuarial Gain/(Loss) on Plan Assets (1,366,246) (3,611,965) (1,366,246) (3,611,965)Value of Plan Assets as at 31st March 154,218,388 117,058,229 128,568,388 117,058,229
38.5 Assumptions
Discount rate 12% 11% 12% 11%Salary scale 10% 10% 10% 10%Mortality table A 67/70 A 67/70 A 67/70 A 67/70Staff turnover 17% 15% 15% 15%
Retirement age Normal retirement age, or age on valuation date, if greater.
An actuarial valuation of the gratuity was carried out as at 31st March 2017 by Actuarial & Management Consultants (Pvt) Limited, a firm of professional actuaries. The valuation method used by the actuary to value the Fund is the “Projected Unit Credit Method”, recommended by LKAS 19
Notes to the Financial Statements

210 211
Alliance Finance Company PLC | Annual Report 2016/17
Overview Management Discussion & Analysis
Financial Reports Supplementary information
Company Group 2017 2016 2017 2016 Rs. Rs. Rs. Rs.
39. DEFERRED INCOME TAX ASSETS AND LIABILITIESDeferred tax liabilitiesBalance at 01st April 192,818,349 143,545,449 192,934,086 143,856,645 Recognised in profit & loss 264,601,285 49,272,900 264,526,507 49,077,441 Balance as at 31st March 457,419,634 192,818,349 457,460,593 192,934,086
Deferred tax assetsBalance at 01st April 217,742,273 151,123,290 218,039,294 151,398,849 Recognised in profit & loss 297,638,954 67,277,392 297,698,666 67,298,854 Recognised in other comprehensive income (3,496,987) (4,530,789) (3,496,987) (4,530,789)Reassessment on value of fixed assets - 3,872,380 - 3,872,380 Balance as at 31st March 511,884,241 217,742,273 512,240,973 218,039,294 Net Deferred tax (assets)/ liabilities (54,464,606) (24,923,924) (54,780,380) (25,105,208)
39.1 Recognised Deferred Tax Assets and Liabilities
LiabilitiesAccelerated depreciation - Own assets - 40,959 115,737 - Leased assets 1,109,832 13,787,891 1,109,832 13,787,872 Lease rentals 456,309,802 179,030,477 456,309,802 179,030,477 457,419,634 192,818,349 457,460,593 192,934,086
AssetsDefined benefit obligation 22,440,807 25,546,505 22,797,539 25,843,526 Own assets 76,776,252 54,662,726 76,776,252 54,662,726 Others 7,022,317 15,236,873 7,022,317 15,236,873 Tax loss carried forward 405,644,865 122,296,169 405,644,865 122,296,169 511,884,241 217,742,273 512,240,973 218,039,294

212
Alliance Finance Company PLC | Annual Report 2016/17
Overview Management Discussion & Analysis
Financial Reports Supplementary information
40. STATED CAPITAL Company Group 2017 2016 2017 2016 Rs. Rs. Rs. Rs.
40.1 Issued and Fully Paid-Ordinary shares
Rs. 1/- each 24,300,000 ordinary shares (2016, Rs.10/- each 2,430,000 Ordinary shares) 24,300,000 24,300,000 24,300,000 24,300,000 Capitalization of reserves by issuing 8100,000 shares 518,400,000 - 518,400,000 - Right Issue 1,296,000 ordinary shares 71,280,000 - 71,280,000 - 613,980,000 24,300,000 613,980,000 24,300,000
40.2 Movement in Number of Shares
Balance as at 01st April 2,430,000 2,430,000 2,430,000 2,430,000Share split by issue 1:10 21,870,000 - 21,870,000 -Capitalisation of reserves on the basis 1:3 8,100,000 - 8,100,000 -Right issue basis 1: 25 1,296,000 - 1,296,000 - 33,696,000 2,430,000 33,696,000 2,430,000
On 16 November 2016, ordinary shares of the company were subdivided on the basis 1:10, increasing the Shares in Issue to 24,300,000, and the Stated Capital remained unchanged. Thereafter on 21 November 2016, a capitalization of 1:3 was effected at Rs.64per share through utilization of the General Reserve. Thus the Shares in issue increased to 32,400,000 together with an increase in the Stated Capital to Rs.542,700,000.00. Further, the company effected a Rights Issue on the basis of 1:25, thereby increasing the shares in Issue to 33,696,000 and the Stated Capital to Rs.613,980,000.00, resulting from the inflow on the Rights Issue that amounted to Rs.71,280,000.00.This strengthened the working capital base of company resulting in improvements in its growth capability.
40.3 Rights of Shareholders
The holders of ordinary shares confer their right to receive dividends as declared from time to time and are entitled to one vote per share at the meeting. All shares rank equally with regard to the Company’s residual assets.
Shares in the Alliance Finance Company are quoted on the Colombo Stock Exchange.
Notes to the Financial Statements

212 213
Alliance Finance Company PLC | Annual Report 2016/17
Overview Management Discussion & Analysis
Financial Reports Supplementary information
Company GroupAs at 31st March 2017 2016 2017 2016 Rs. Rs. Rs. Rs.
41. RETAINED EARNINGSAs at 01st April 803,805,837 598,539,503 845,518,674 629,321,313 Dividend paid (182,995,200) (126,360,000) (182,995,200) (126,360,000)Profit for the year 649,456,817 419,189,385 653,314,165 430,063,754 Reassessment of value of fixed assets - (13,829,928) - (13,829,928)Associate Company prior year adjustment - (2,323,724) - (2,323,724)Adjustment on actuarial gain / (losses) on defined benefit plan 6,704,392 11,650,599 6,778,465 11,707,258 Transfers to statutory reserve fund (129,891,400) (83,060,000) (129,891,400) (83,060,000)As at 31st March 1,147,080,445 803,805,837 1,192,724,704 845,518,674
Retained Earnings represents the undistributed earnings held by the Company to be used in the Company’s operations. This could be used to absorb future possible losses or dividends payable.
Company GroupAs at 31st March 2016 Transfers 31.03.2017 2016 Transfers 31.03.2017 Rs. Rs. Rs. Rs. Rs. Rs.
42. RESERVESAvailable for sale reserve (Note 42.1) 6,065,427 798,159 6,863,586 6,065,427 798,159 6,863,586 Capital reserve (Note 42.2) 479,906,644 797,498,944 1,277,405,588 479,906,644 797,498,944 1,277,405,588General reserve 823,441,275 (435,183,220) 388,258,055 823,441,275 (435,183,220) 388,258,055 Investment fund reserve (Note 42.3) 83,216,780 (83,216,780) - 83,216,780 (83,216,780) - Statutory reserve fund (Note 42.4) 501,317,400 129,891,400 631,208,800 501,317,400 129,891,400 631,208,800 1,893,947,527 409,788,503 2,303,736,029 1,893,947,528 409,788,503 2,303,736,029
The Board decided to consolidate the reserves, thereby Investment fund reserve of Rs. 83.2mn transferred to the General reserve. In year 2016 Dividend Equalization Reserve of Rs. 7mn, Diversification Risk Reserve Rs. 255Mn, Development Reserve Rs.108.14Mn were transferred to the General Reserve increasing the Reserve from Rs. 453.3Mn to 823.44 Mn. The Company maintains the General Reserve to retain funds for future expansion.

214
Alliance Finance Company PLC | Annual Report 2016/17
Overview Management Discussion & Analysis
Financial Reports Supplementary information
Company Group 2017 2016 2017 2016 Rs. Rs. Rs. Rs.
42.1 Available for Sale Reserve
Balance as at 01st April 6,065,427 21,681,789 6,065,427 21,681,789 Sri Lanka government securities 798,159 (1,250,070) 798,159 (1,250,070)Equity securities - unquoted - (14,366,292) - (14,366,292)Transfer of realized gain/(loss) on available for sale financial assets - - 6,863,586 6,065,427 6,863,586 6,065,427
42.2 Capital Reserve - Revaluation Reserve
The Capital Reserves represents the increase in the fair value of the land & buildings at the date of revaluation. The Company revalues its freehold lands and buildings in every three to five years, unless significant changes in fair values indicate it may be necessary to revalue freehold lands and buildings on an earlier date, to ensure that the carrying amounts do not differ materially from the fair values at the end of the reporting date.
The Company treats 50% of the revaluation surplus as supplementary capital in the Tier II Capital Base in the computation of the Risk Weighted Capital Adequacy Ratio in accordance with the Central Bank of Sri Lanka, Finance Companies (Risk Weighted Capital Adequacy Ratio) Direction No.2 of 2006.
42.3 Investment Fund Reserve
Investment fund reserve is a free reserve and has been added to the core capital of the company.
42.4 Reserve Fund
20% of profits after tax of 2016 is transferred to the Reserve Fund to full-fill the minimum requirement of the Section 3 (b) of Finance Companies (Capital Funds) Direction No.1 of 2003. This balance in the Statutory Reserve Fund will be used only for the purposes specified in the Finance Business Act, No.42 of 2011.
Notes to the Financial Statements
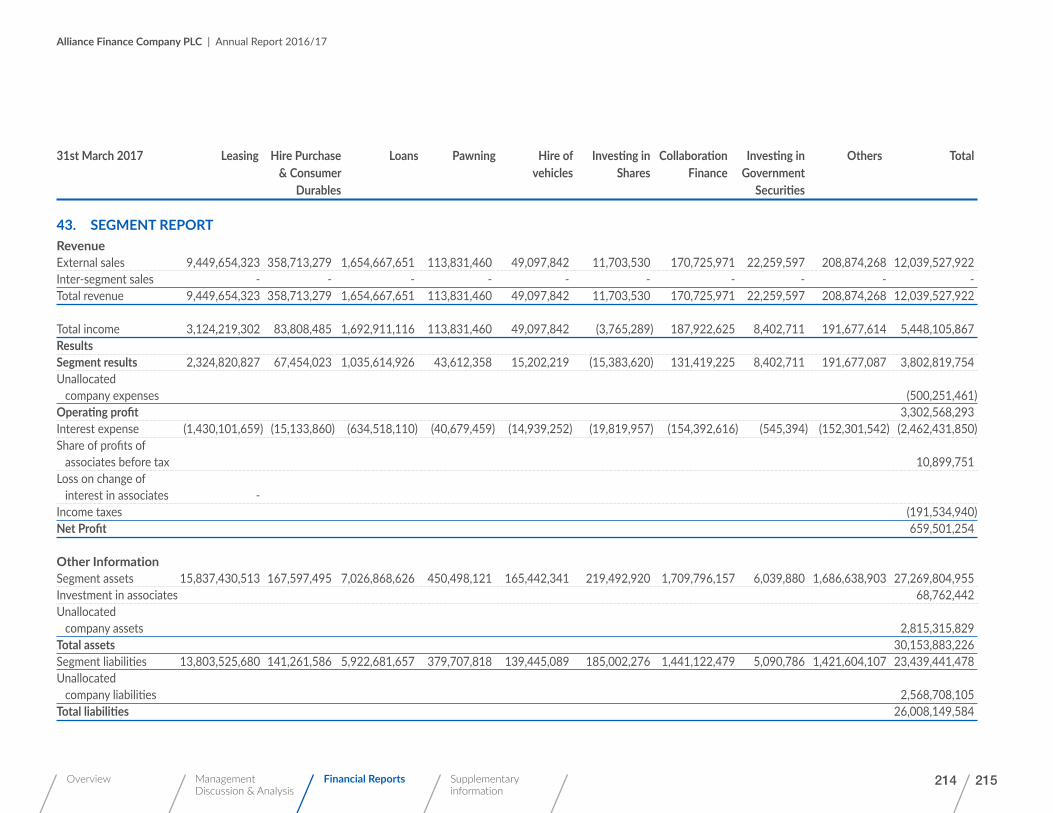
214 215
Alliance Finance Company PLC | Annual Report 2016/17
Overview Management Discussion & Analysis
Financial Reports Supplementary information
31st March 2017 Leasing Hire Purchase Loans Pawning Hire of Investing in Collaboration Investing in Others Total & Consumer vehicles Shares Finance Government Durables Securities
43. SEGMENT REPORTRevenueExternal sales 9,449,654,323 358,713,279 1,654,667,651 113,831,460 49,097,842 11,703,530 170,725,971 22,259,597 208,874,268 12,039,527,922 Inter-segment sales - - - - - - - - - - Total revenue 9,449,654,323 358,713,279 1,654,667,651 113,831,460 49,097,842 11,703,530 170,725,971 22,259,597 208,874,268 12,039,527,922
Total income 3,124,219,302 83,808,485 1,692,911,116 113,831,460 49,097,842 (3,765,289) 187,922,625 8,402,711 191,677,614 5,448,105,867 ResultsSegment results 2,324,820,827 67,454,023 1,035,614,926 43,612,358 15,202,219 (15,383,620) 131,419,225 8,402,711 191,677,087 3,802,819,754 Unallocated company expenses (500,251,461)Operating profit 3,302,568,293 Interest expense (1,430,101,659) (15,133,860) (634,518,110) (40,679,459) (14,939,252) (19,819,957) (154,392,616) (545,394) (152,301,542) (2,462,431,850)Share of profits of associates before tax 10,899,751 Loss on change of interest in associates - Income taxes (191,534,940)Net Profit 659,501,254
Other InformationSegment assets 15,837,430,513 167,597,495 7,026,868,626 450,498,121 165,442,341 219,492,920 1,709,796,157 6,039,880 1,686,638,903 27,269,804,955 Investment in associates 68,762,442 Unallocated company assets 2,815,315,829 Total assets 30,153,883,226 Segment liabilities 13,803,525,680 141,261,586 5,922,681,657 379,707,818 139,445,089 185,002,276 1,441,122,479 5,090,786 1,421,604,107 23,439,441,478 Unallocated company liabilities 2,568,708,105 Total liabilities 26,008,149,584

216
Alliance Finance Company PLC | Annual Report 2016/17
Overview Management Discussion & Analysis
Financial Reports Supplementary information
31st March 2016 Leasing Hire Purchase Loans Pawning Hire of Investing in Collaboration Investing in Others Total & Consumer vehicles Shares Finance Government Durables Securities
43. Segment report (continued)
RevenueExternal sales 8,559,446,796 814,852,166 1,208,541,818 101,533,619 47,698,979 44,341,707 130,481,201 33,396,878 204,630,602 11,144,923,766 Inter-segment sales - - - - - - - - - - Total revenue 8,559,446,796 814,852,166 1,208,541,818 101,533,619 47,698,979 44,341,707 130,481,201 33,396,878 204,630,602 11,144,923,766
Total income 2,689,946,108 197,586,713 1,233,935,002 101,533,619 47,698,979 11,417,189 180,254,299 19,044,494 135,198,979 4,616,615,382 ResultsSegment results 1,751,831,888 177,818,037 707,061,903 (201,497,766) 22,017,489 (21,981,048) 141,931,366 19,044,494 134,943,521 2,731,169,884 Unallocated company expenses (319,408,822)Operating profit 2,411,761,062 Interest expense (1,025,026,977) (35,695,398) (405,136,418) (27,293,350) (12,763,563) (17,306,858) (135,625,392) (138,398) (209,448,417) (1,868,434,772)Share of profits of associates before tax 13,442,936 Loss on change of interest in associate (3,153,928)Income taxes (117,418,769)Net Profit 436,196,530
Other InformationSegment assets 13,283,110,374 462,569,201 5,250,078,167 353,688,820 165,400,341 224,275,954 1,757,541,117 1,793,477 2,714,198,269 24,212,655,720 Investment in associates 65,834,956 Unallocated company assets 1,677,426,617 Total assets 25,955,917,293 Segment liabilities 11,908,323,665 407,301,385 4,622,798,278 311,430,043 145,638,291 197,479,440 1,547,549,920 1,579,192 2,389,905,576 21,532,005,790 Unallocated company liabilities 1,627,069,581 Total liabilities 23,159,075,371
Notes to the Financial Statements
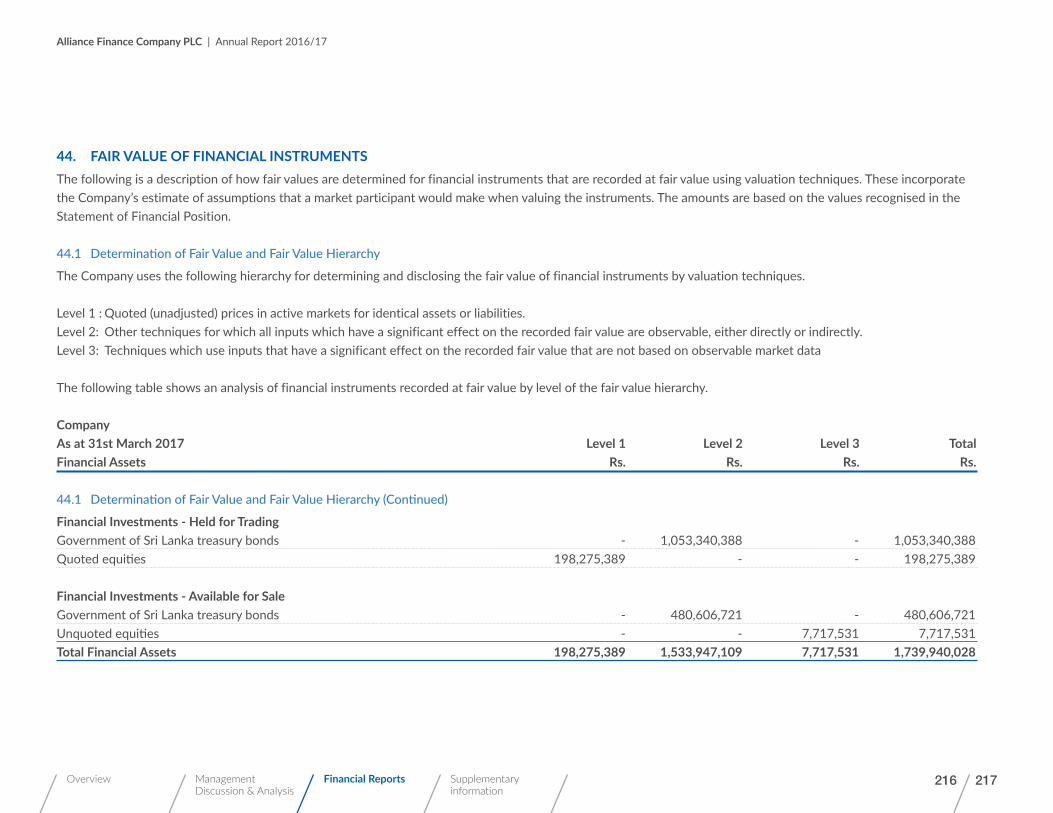
216 217
Alliance Finance Company PLC | Annual Report 2016/17
Overview Management Discussion & Analysis
Financial Reports Supplementary information
44. FAIR VALUE OF FINANCIAL INSTRUMENTSThe following is a description of how fair values are determined for financial instruments that are recorded at fair value using valuation techniques. These incorporate the Company’s estimate of assumptions that a market participant would make when valuing the instruments. The amounts are based on the values recognised in the Statement of Financial Position.
44.1 Determination of Fair Value and Fair Value Hierarchy
The Company uses the following hierarchy for determining and disclosing the fair value of financial instruments by valuation techniques.
Level 1 : Quoted (unadjusted) prices in active markets for identical assets or liabilities.Level 2: Other techniques for which all inputs which have a significant effect on the recorded fair value are observable, either directly or indirectly.Level 3: Techniques which use inputs that have a significant effect on the recorded fair value that are not based on observable market data
The following table shows an analysis of financial instruments recorded at fair value by level of the fair value hierarchy.
CompanyAs at 31st March 2017 Level 1 Level 2 Level 3 Total Financial Assets Rs. Rs. Rs. Rs.
44.1 Determination of Fair Value and Fair Value Hierarchy (Continued)
Financial Investments - Held for TradingGovernment of Sri Lanka treasury bonds - 1,053,340,388 - 1,053,340,388 Quoted equities 198,275,389 - - 198,275,389
Financial Investments - Available for SaleGovernment of Sri Lanka treasury bonds - 480,606,721 - 480,606,721 Unquoted equities - - 7,717,531 7,717,531 Total Financial Assets 198,275,389 1,533,947,109 7,717,531 1,739,940,028

218
Alliance Finance Company PLC | Annual Report 2016/17
Overview Management Discussion & Analysis
Financial Reports Supplementary information
As at 31st March 2016 Level 1 Level 2 Level 3 Total Rs. Rs. Rs. Rs.
Financial AssetsFinancial Investments - Held for TradingGovernment of Sri Lanka treasury bonds - 583,697,462 - 583,697,462 Quoted equities 198,773,769 - - 198,773,769
Financial Investments - Available for Sale - Government of Sri Lanka treasury bonds - 438,251,912 - 438,251,912 Unquoted equities - - 12,002,185 12,002,185 Investments in unit trusts - 298,530,171 - 298,530,171 Total Financial Assets 198,773,769 1,320,479,546 12,002,185 1,531,255,500
GroupAs at 31st March 2017 Level 1 Level 2 Level 3 Total Financial Assets Rs. Rs. Rs. Rs.
Financial Investments - Held for TradingGovernment of Sri Lanka treasury bills - 1,053,340,388 - 1,053,340,388 Quoted equities 198,275,389 - - 198,275,389
Financial Investments - Available for SaleGovernment of Sri Lanka treasury bills - 480,606,721 - 480,606,721 Unquoted equities - - 21,217,531 21,217,531 Total Financial Assets 198,275,389 1,533,947,109 21,217,531 1,753,440,028
Notes to the Financial Statements

218 219
Alliance Finance Company PLC | Annual Report 2016/17
Overview Management Discussion & Analysis
Financial Reports Supplementary information
As at 31st March 2016 Level 1 Level 2 Level 3 Total Financial Assets Rs. Rs. Rs. Rs.
Financial Investments - Held for TradingGovernment of Sri Lanka treasury bills - 583,697,462 - 583,697,462 Quoted equities 198,773,769 - - 198,773,769
Financial Investments - Available for SaleGovernment of Sri Lanka treasury bills - 438,251,912 - 438,251,912 Unquoted equities - - 25,502,185 25,502,185 Investments in unit trusts - 376,978,352 - 376,978,352 Total Financial Assets 198,773,769 1,398,927,727 25,502,185 1,623,203,681
44.2 Determination of Fair Value and Fair Value Hierarchy
Set out below is the comparison, by classes, of the carrying amounts of fair values of the Company’s financial instruments that are not carried at fair value in the Financial Statements. This table does not include the fair values of non- financial assets and non- financial liabilities.
Company 2017 2016 Carrying Fair Carrying Fair Amount Value Amount Value Rs. Rs. Rs. Rs.
Financial AssetsCash and cash equivalents 250,196,373 250,196,373 143,982,481 143,982,481 Repurchase agreement 175,849,048 175,849,048 735,591,742 735,591,742 Placement with banks & other financial institutions 1,218,793,508 1,218,793,508 1,834,356,115 1,834,356,115 Loans and advances 7,478,467,024 7,949,379,104 5,603,981,321 5,552,831,650 Lease rentals receivable 15,837,430,513 16,308,898,758 13,283,110,374 11,452,250,737 Hire purchase receivable 167,597,495 167,597,495 462,569,201 418,162,462 Other financial assets 255,578,986 255,578,986 181,511,534 181,511,534 Total Financial Assets 25,383,912,946 26,326,293,272 22,245,102,768 20,318,686,721

220
Alliance Finance Company PLC | Annual Report 2016/17
Overview Management Discussion & Analysis
Financial Reports Supplementary information
Company 2017 2016 Carrying Fair Carrying Fair Amount Value Amount Value Rs. Rs. Rs. Rs.
44.2 Determination of Fair Value and Fair Value Hierarchy (continued)
Financial LiabilitiesDue to banks 11,717,889,355 11,717,889,355 8,328,978,742 8,328,978,742 Due to customers 10,087,821,914 10,092,101,864 10,464,149,566 10,468,429,515 Debt instruments issued and other borrowed funds 2,548,225,806 2,548,225,806 3,062,414,964 3,062,414,964 Financial liabilities 888,031,755 888,031,755 884,210,568 884,210,568 Total Financial Liabilities 25,241,978,830 25,246,258,779 22,739,753,840 22,744,033,789
Group 2017 2016 Carrying Fair Carrying Fair Amount Value Amount Value Rs. Rs. Rs. Rs.
Financial AssetsCash and cash equivalents 294,565,160 294,565,160 177,180,931 177,180,931 Repurchase agreement 175,849,048 175,849,048 735,591,742 735,591,742 Placement with banks & other financial institutions 1,273,186,055 1,273,186,055 1,834,356,115 1,834,356,115 Loans and advances 7,478,583,487 8,064,672,791 5,604,087,836 5,552,831,650 Lease rentals receivable 15,837,430,513 16,308,898,758 13,283,110,374 11,452,250,737 Hire purchase receivables 167,597,495 167,597,495 462,569,201 418,162,462 Other financial assets 291,358,203 291,358,203 178,653,619 178,653,619 Total Financial Assets 25,518,569,961 26,576,127,510 22,275,549,818 20,349,027,255
Financial LiabilitiesDue to banks 11,749,382,430 11,749,382,430 8,353,691,241 8,353,691,241 Due to customers 10,087,821,914 10,092,101,863 10,464,149,566 10,468,429,515 Debt instruments issued and other borrowed funds 2,548,225,806 2,548,225,806 3,062,414,964 3,062,414,964 Financial liabilities 902,782,091 902,782,091 890,116,107 890,116,107 Total Financial Liabilities 25,288,212,241 25,292,492,191 22,770,371,878 22,774,651,827
Notes to the Financial Statements

220 221
Alliance Finance Company PLC | Annual Report 2016/17
Overview Management Discussion & Analysis
Financial Reports Supplementary information
Fair Value of Financial Assets and Liabilities not Carried at Fair ValueThe following describes the methodologies and assumptions used to determine the fair values for those financial instruments which are not already recorded at fair value in the Financial Statements.
Assets for which Fair Value Approximates Carrying Value“For financial assets and financial liabilities that have a short term maturity (original maturities less than a year), it is assumed that the carrying amounts approximate their fair values. This assumption is also applied to fixed deposits, certificate of deposits and savings deposits without a specific maturity.“
Long term deposits accepted from customers for which periodical interest is paid and loans and advances granted to customers with a variable rate are also considered to be carried at fair value in the books.
Fixed Rate Financial Instruments“Carrying amounts are considered as fair values for short term credit facilities. Loans and Advances with fixed interest rates were fair valued using market rates at which fresh loans were granted during the fourth quarter of the reporting year. Conversely, fixed deposits with original tenors above one year and interest paid at maturity were discounted using current market rates offered to customers during the fourth quarter of the reporting year. For quoted debt issued the fair value are determined based on quoted market prices.“
45. COMMITMENTS AND CONTINGENCIESIn the normal course of the business, the Company makes various commitments and incurs certain contingent liabilities. No material losses are anticipated as a result of these transactions.
There were no capital commitments or contingent liabilities as at the end of the reporting date which requires separate disclosure to these Financial Statements.
45.1 Litigations Against the Company
Litigation is a common occurrence in the Finance Industry due to the nature of the business undertaken. The Company has formal controls and policies for managing legal claims. No material losses are anticipated as a result of there transactions
46. EVENTS AFTER THE REPORTING PERIODSubsequent to the reporting date, no circumstances have arisen which would required adjustment to or disclosure in the Financial Statements.
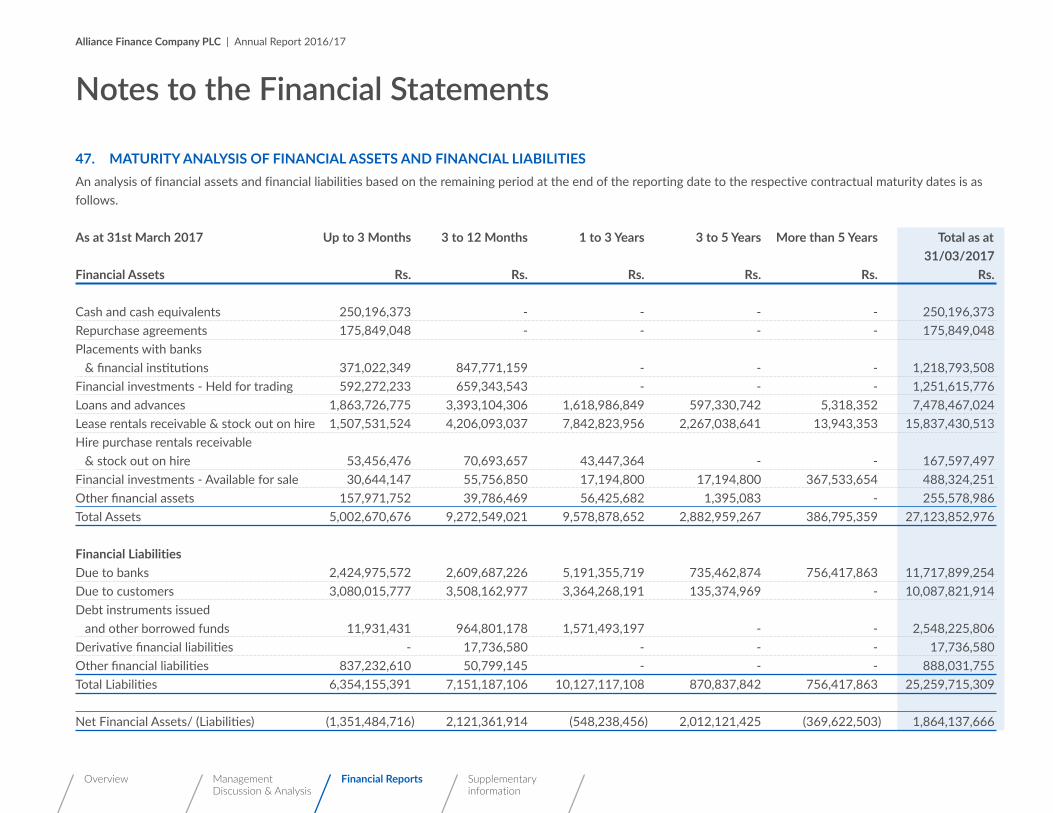
222
Alliance Finance Company PLC | Annual Report 2016/17
Overview Management Discussion & Analysis
Financial Reports Supplementary information
47. MATURITY ANALYSIS OF FINANCIAL ASSETS AND FINANCIAL LIABILITIESAn analysis of financial assets and financial liabilities based on the remaining period at the end of the reporting date to the respective contractual maturity dates is as follows.
As at 31st March 2017 Up to 3 Months 3 to 12 Months 1 to 3 Years 3 to 5 Years More than 5 Years Total as at 31/03/2017Financial Assets Rs. Rs. Rs. Rs. Rs. Rs.
Cash and cash equivalents 250,196,373 - - - - 250,196,373Repurchase agreements 175,849,048 - - - - 175,849,048Placements with banks & financial institutions 371,022,349 847,771,159 - - - 1,218,793,508Financial investments - Held for trading 592,272,233 659,343,543 - - - 1,251,615,776Loans and advances 1,863,726,775 3,393,104,306 1,618,986,849 597,330,742 5,318,352 7,478,467,024Lease rentals receivable & stock out on hire 1,507,531,524 4,206,093,037 7,842,823,956 2,267,038,641 13,943,353 15,837,430,513Hire purchase rentals receivable & stock out on hire 53,456,476 70,693,657 43,447,364 - - 167,597,497Financial investments - Available for sale 30,644,147 55,756,850 17,194,800 17,194,800 367,533,654 488,324,251Other financial assets 157,971,752 39,786,469 56,425,682 1,395,083 - 255,578,986Total Assets 5,002,670,676 9,272,549,021 9,578,878,652 2,882,959,267 386,795,359 27,123,852,976
Financial LiabilitiesDue to banks 2,424,975,572 2,609,687,226 5,191,355,719 735,462,874 756,417,863 11,717,899,254Due to customers 3,080,015,777 3,508,162,977 3,364,268,191 135,374,969 - 10,087,821,914Debt instruments issued and other borrowed funds 11,931,431 964,801,178 1,571,493,197 - - 2,548,225,806Derivative financial liabilities - 17,736,580 - - - 17,736,580Other financial liabilities 837,232,610 50,799,145 - - - 888,031,755Total Liabilities 6,354,155,391 7,151,187,106 10,127,117,108 870,837,842 756,417,863 25,259,715,309
Net Financial Assets/ (Liabilities) (1,351,484,716) 2,121,361,914 (548,238,456) 2,012,121,425 (369,622,503) 1,864,137,666
Notes to the Financial Statements

222 223
Alliance Finance Company PLC | Annual Report 2016/17
Overview Management Discussion & Analysis
Financial Reports Supplementary information
As at 31st March 2016 Up to 3 Months 3 to 12 Months 1 to 3 Years 3 to 5 Years More than 5 Years Total as at 31/03/2016Financial Assets Rs. Rs. Rs. Rs. Rs. Rs.
Cash and cash equivalents 143,982,481 - - - - 143,982,481Repurchase agreements 735,591,742 - - - - 735,591,742Placements with banks & financial institutions 345,084,626 1,489,271,488 - - - 1,834,356,115Financial investments - Held for trading 957,904,524 123,096,879 - - - 1,081,001,402Loans and advances 1,838,064,766 2,613,773,060 799,377,494 348,230,004 4,535,995 5,603,981,321Lease rentals receivable & stock out on hire 1,450,896,617 3,391,120,548 6,119,837,765 2,297,760,863 23,494,582 13,283,110,375Hire purchase rentals receivable & stock out on hire 92,477,556 152,905,790 206,830,105 10,355,751 - 462,569,202Financial investments - Available for sale 11,819,558 15,975,100 16,622,400 16,622,400 389,214,639 450,254,097Other financial assets 84,693,620 36,063,459 51,011,124 9,743,330 - 181,511,533Total Assets 5,660,515,489 7,822,206,326 7,193,678,888 2,682,712,349 417,245,216 23,776,358,266
Financial LiabilitiesDue to banks 1,519,940,922 3,189,079,785 2,924,050,724 644,977,586 50,929,726 8,328,978,743Due to customers 2,800,364,836 4,666,977,340 2,830,503,448 166,303,942 - 10,464,149,566Debt instruments issued and other borrowed funds 137,391,342 464,089,076 1,600,840,488 860,094,060 - 3,062,414,966Other financial liabilities 785,909,653 98,300,915 - - - 884,210,568Total Liabilities 5,243,606,753 8,418,447,116 7,355,394,660 1,671,375,588 50,929,726 22,739,753,843
Net Financial Assets / (Liabilities) 416,908,737 (596,240,791) (161,715,772) 1,011,336,761 366,315,490 1,036,604,423

224
Alliance Finance Company PLC | Annual Report 2016/17
Overview Management Discussion & Analysis
Financial Reports Supplementary information
48. RELATED PARTY TRANSACTIONSThe Company carried out transactions in the ordinary course of business on an arm’s length basis at commercial rates with parties who are defined as Related Parties as per the Sri Lanka Accounting Standard - LKAS 24 ‘Related Party Disclosures’, except for the transactions that Key Management Personnel (KMPs) have availed under schemes uniformly applicable to all staff at concessionary rates.
Details of related party transactions which the company had during the year are as follows,
48.1 Transactions with Key Managerial Personnel (KMPs)
Related party includes KMPs defined as those persons having authority and responsibility for planning directing and controlling the activities for the Company. Such KMPs include the Board of Directors of the Company (include Executive and Non-Executive Directors ), Executives who directly report to Board sub committees and other key executives who meet the criteria described above. 2017 2016 Rs. Rs.
48.1.1 Key Management Personnel CompensationKMP’s Emoluments Short Term 79,377,030 84,371,090 Long Term 15,894,378 13,112,120 95,271,408 97,483,210Directors Emoluments Short Term 29,192,831 26,435,032 Long Term & Post employment benefits 9,672,484 25,950,390 38,865,315 52,385,422
48.2 Transactions, Arrangements and Agreements Involving KMPs, and their Close Family Members (CFMs)
CFMs of a KMPs are those family members who may be expected to influence, or be influenced by, that KMP in their dealing with the entity. They may include KMPs domestic partner and children, children of the KMPs domestic partner and dependents of the KMP or the KMPs domestic partner.
Notes to the Financial Statements

224 225
Alliance Finance Company PLC | Annual Report 2016/17
Overview Management Discussion & Analysis
Financial Reports Supplementary information
48.3 Deposits and investments from key managerial personnel and their close family members are detailed below.
Company and Group 2017 2016 Rs. Rs.
Fixed DepositsFixed Deposits accepted during the year 31,051,748 16,599,946Fixed Deposits held at the end of the year 85,926,729 27,374,579Interest payable on Fixed Deposits 2,067,791 852,778Interest paid on Fixed Deposits 13,402,219 1,271,058
Debt Instruments Issued and Other Borrowed Funds 2,017 2,016 Rs. Rs.
Debentures 3,520,000 3,520,000

226
Alliance Finance Company PLC | Annual Report 2016/17
Overview Management Discussion & Analysis
Financial Reports Supplementary information
48.4 Transaction, arrangements and agreements involving with entities which are controlled, and /or jointly controlled by the KMP’s and their CFMs or shareholders
Company 2017 2016 Rs. Rs.
Nature of Transaction Nature of Transaction / FacilityM/S.Alfinco Insurance Brokers (Pvt) Ltd. Fixed deposits 54,780,430 -Reimbursement of expenses 36,756,608 35,694,720
M/S.Alliance Management Services (Private) Limited Fixed deposits 3,186,084 2,917,916Management fees 1,098,891 608,000
M/S.Alliance Travel Services Ltd Fixed deposits 3,115,242 5,835,135
M/S Xesol (Pvt) Ltd Liquidation fees - 6,249,763
M/S. Macbertan (Private) Limited Lease rentals receivable & stock out on hire 178,471 865,397Loan rentals receivable 501,984 1,223,478
M/S.Alliance Tech Trading (PVT) Ltd. Fixed deposits 10,143,631 9,008,082
Virtusa Pvt. Ltd Software development fees - 4,146,980Alliance Ventures Pvt Ltd Fixed deposits 1,114,936 1,160,815
48.5 Parent and Ultimate Controlling Party
The Company does not have an identifiable parent of its own.
Notes to the Financial Statements

226 227
Alliance Finance Company PLC | Annual Report 2016/17
Overview Management Discussion & Analysis
Financial Reports Supplementary information
49. RISK MANAGEMENT49.1 Introduction
Constantly assessing and being cognizant of the concept of risk is fundamental to the managerial philosophy of Alliance Finance Company PLC.
Consequent to the global, economic and financial crises, companies are placing greater emphasis on risk management by adopting comprehensive risk management framework to increasingly safeguard stakeholder interest. Due to diversified and geographic spread of the portfolio of businesses, Alliance Finance maintains a holistic risk management system that continuously monitors primary risk factors. Risk mitigation actions are also built in to the day to day operations of the Company. The Company’s business divisions are closely monitored through a comprehensive computerized information system and employees, ranging from managerial credit and other officers, have been appraised and trained to adopt risk management practices as an integral part of their decision making.
Risk CoverageThe Company’s Comprehensive risk management framework covers three major areas that comprise credit risk, liquidity risk, and market risk management.Risk is inherent in the company’s activities but it is managed through a process of ongoing identification, measurement, and monitoring, subject to the risk limits and their controls.
49.2 Credit Risk
49.2.1 Credit Quality by Class of Financial AssetsCredit risk is the risk that the company will incur a loss because its customers or counterparties fail to discharge their contractual obligations. The Company manages and controls credit risk by setting limits on the amount of risk it is willing to accept for individual counterparties and industry concentrations, and by monitoring exposures in relation to such limits.
The Company has established a credit quality review process to provide early identification of possible changes in the credit worthiness of counter parties, including regular collateral revisions. Counter party limits are established by the use of a credit risk classification system, which assigns each counterparty a risk rating. Risk ratings are subject to regular revision. The credit quality review process aims to allow the Company to assess the potential loss as a result of the risks to which it is exposed and take corrective action.

228
Alliance Finance Company PLC | Annual Report 2016/17
Overview Management Discussion & Analysis
Financial Reports Supplementary information
49.2.1 Credit Quality by Class of Financial Assets (continued)
Impairment assessmentFor accounting purposes, the Company use an incurred loss model for the recognition of losses on impaired financial assets. This means that losses can only be recognised when objective evidence of a specific loss event has been observed. Triggering events include the following:
• Significant financial difficulty of the customer
• A breach of contract such as a default of payment
• Where the Company grants the customer a concession due to the customer experiencing financial difficulty
• It becomes probable that the customer will enter bankruptcy or other financial reorganisation
• Observable data that suggests that there is a decrease in the estimated future cash flow from the loans
Collectively assessed allowancesAllowances are assessed collectively for losses on loans and advances that are not individually significant (including hire purchase, lease receivables, other loans and advances and consumer lending) and for individually significant loans and advances that have been assessed individually and found not to be impaired.
The Company generally bases its analyses on historical experience. However, when there are significant market changes the company would include macroeconomic factors within its assessments. These factors include, depending on the characteristics of the individual or collective assessment: unemployment rates, current levels of bad debts, changes in laws, changes in regulations, bankruptcy trends, and other consumer data. The company may use the aforementioned factors as appropriate to adjust the impairment allowances.
Allowances are evaluated separately at each reporting date with each portfolio. The collective assessment is made for groups of assets with similar risk characteristics, in order to determine whether provision should be made due to incurred loss events for which there is objective evidence, but the effects of which are not yet evident in the individual loans assessments. The collective assessment takes account of data from the loan portfolio (such as historical losses on the portfolio, levels of arrears, credit utilisation, loan to collateral ratios and expected receipts and recoveries once impaired) or economic data (such as current economic conditions, unemployment levels and local or industry–specific problems). The approximate delay between the time a loss is likely to have been incurred and the time it will be identified as requiring an individually assessed impairment allowance is also taken into consideration. Company’s management is responsible for deciding the length of this period, which can extend for as long as one year. The impairment allowance is then reviewed by credit management to ensure alignment with the company’s overall policy.
Notes to the Financial Statements
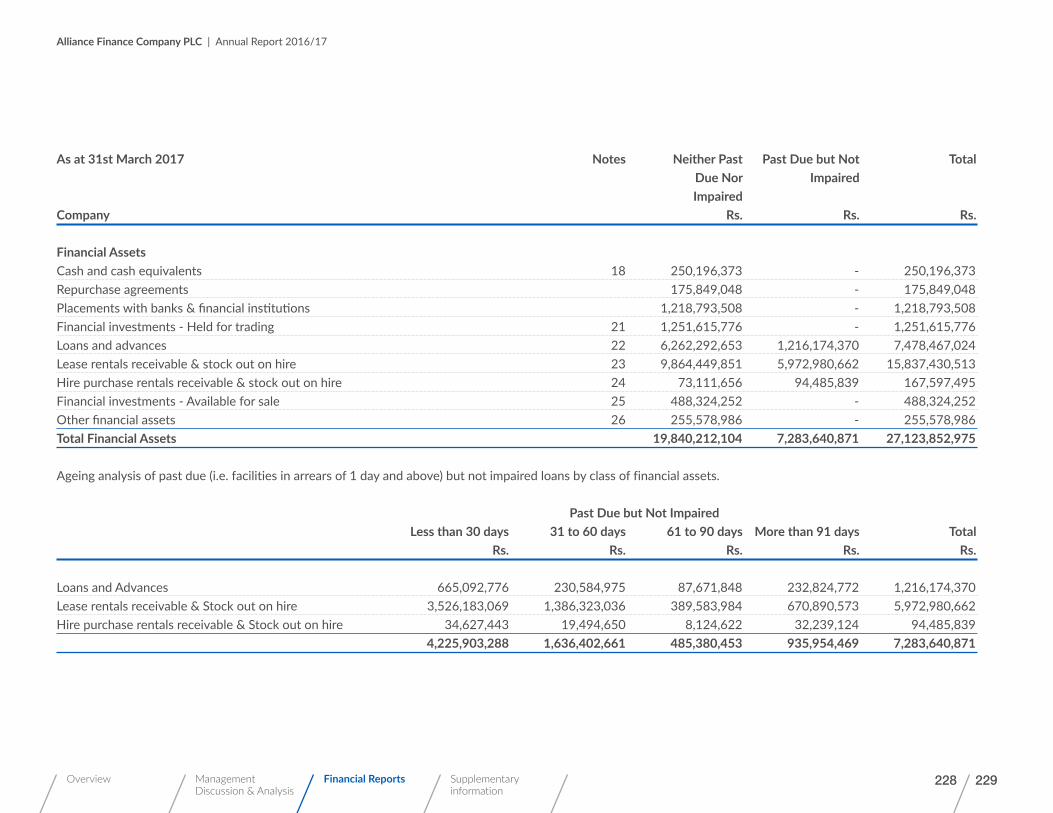
228 229
Alliance Finance Company PLC | Annual Report 2016/17
Overview Management Discussion & Analysis
Financial Reports Supplementary information
As at 31st March 2017 Notes Neither Past Past Due but Not Total Due Nor Impaired Impaired Company Rs. Rs. Rs.
Financial AssetsCash and cash equivalents 18 250,196,373 - 250,196,373Repurchase agreements 175,849,048 - 175,849,048Placements with banks & financial institutions 1,218,793,508 - 1,218,793,508Financial investments - Held for trading 21 1,251,615,776 - 1,251,615,776Loans and advances 22 6,262,292,653 1,216,174,370 7,478,467,024Lease rentals receivable & stock out on hire 23 9,864,449,851 5,972,980,662 15,837,430,513Hire purchase rentals receivable & stock out on hire 24 73,111,656 94,485,839 167,597,495Financial investments - Available for sale 25 488,324,252 - 488,324,252Other financial assets 26 255,578,986 - 255,578,986Total Financial Assets 19,840,212,104 7,283,640,871 27,123,852,975
Ageing analysis of past due (i.e. facilities in arrears of 1 day and above) but not impaired loans by class of financial assets.
Past Due but Not Impaired Less than 30 days 31 to 60 days 61 to 90 days More than 91 days Total Rs. Rs. Rs. Rs. Rs.
Loans and Advances 665,092,776 230,584,975 87,671,848 232,824,772 1,216,174,370Lease rentals receivable & Stock out on hire 3,526,183,069 1,386,323,036 389,583,984 670,890,573 5,972,980,662Hire purchase rentals receivable & Stock out on hire 34,627,443 19,494,650 8,124,622 32,239,124 94,485,839 4,225,903,288 1,636,402,661 485,380,453 935,954,469 7,283,640,871

230
Alliance Finance Company PLC | Annual Report 2016/17
Overview Management Discussion & Analysis
Financial Reports Supplementary information
As at 31st March 2017 Notes Neither Past Past Due but Not Total Due nor Impaired Impaired Group Rs. Rs. Rs.
49.2.1 Credit Quality By Class Of Financial Assets (continued)
AssetsCash and cash equivalents 18 294,565,160 - 294,565,160Repurchase agreements 175,849,048 - 175,849,048Placements with banks & financial institutions 1,273,186,055 - 1,273,186,055Financial investments - Held for trading 19 1,251,615,776 - 1,251,615,776Loans and advances 20 6,262,292,653 1,216,290,833 7,478,583,487Lease rentals receivable & stock out on hire 21 9,864,449,851 5,972,980,661 15,837,430,512Hire purchase rentals receivable & stock out on hire 22 73,111,656 94,485,838 167,597,494Financial investments - Available for sale 23 501,824,252 - 501,824,252Other financial assets 25 291,358,203 - 291,358,203Total Financial Assets 19,988,252,655 7,283,757,332 27,272,009,986
Ageing analysis of past due (i.e. facilities in arrears of 1 day and above ) but not impaired loans by class of financial assets
Past Due but Not Impaired Less than 30 days 31 to 60 days 61 to 90 days More than 91 days Total Rs. Rs. Rs. Rs. Rs.
Loans and advances 665,092,776 230,584,975 87,671,848 232,824,772 1,216,174,370Lease rentals receivable & Stock out on hire 3,526,183,069 1,386,323,036 389,583,984 670,890,573 5,972,980,662Hire purchase rentals receivable & Stock out on hire 34,627,443 19,494,650 8,124,622 32,239,124 94,485,839 4,225,903,288 1,636,402,661 485,380,453 935,954,469 7,283,757,332
Notes to the Financial Statements

230 231
Alliance Finance Company PLC | Annual Report 2016/17
Overview Management Discussion & Analysis
Financial Reports Supplementary information
Credit risk - Credit Quality by Class of Financial Assets
As at 31st March 2016 Notes Neither Past Past Due but Not Total Due nor Impaired Impaired Company Rs. Rs. Rs.
Cash and cash equivalents 18 143,982,481 - 143,982,481Repurchase agreements 735,591,742 - 735,591,742Placements with banks & financial institutions 1,834,356,115 - 1,834,356,115Financial investments - Held for trading 19 1,081,001,402 - 1,081,001,402Loans and advances 20 4,590,510,686 1,013,470,635 5,603,981,320Lease rentals receivable & stock out on hire 21 7,134,074,132 6,149,036,242 13,283,110,374Hire purchase rentals receivable & stock out on hire 22 166,186,750 296,382,451 462,569,201Financial investments - Available for sale 23 450,254,097 - 450,254,097Other financial assets 25 181,511,534 - 181,511,534Total Financial Assets 16,317,468,938 7,458,889,327 23,776,358,266

232
Alliance Finance Company PLC | Annual Report 2016/17
Overview Management Discussion & Analysis
Financial Reports Supplementary information
Ageing Analysis of past due (i.e. facilities in arrears of 1 day and above) but not impaired loans by class of financial assets. Past Due but Not Impaired Less than 30 days 31 to 60 days 61 to 90 days More than 91 days Total Rs. Rs. Rs. Rs. Rs.
49.2.1 Credit Quality by Class of Financial Assets (continued)
Loans and Advances 623,100,616 186,977,101 48,012,594 155,380,324 1,013,470,635Lease rentals receivable & Stock out on hire 3,366,449,306 1,808,280,026 358,773,543 615,533,367 6,149,036,242Hire purchase rentals receivable & Stock out on hire 136,384,548 65,717,272 19,594,595 74,686,036 296,382,451 4,125,934,470 2,060,974,399 426,380,732 845,599,727 7,458,889,327
As at 31st March 2016 Notes Neither Past Past Due but Not Total Due nor Impaired Impaired Group Rs. Rs. Rs.
AssetsCash and cash equivalents 18 177,180,931 - 177,180,931Repurchase agreements 735,591,742 - 735,591,742Placements with banks & financial institutions 1,834,356,115 - 1,834,356,115Financial investments - Held for trading 19 1,159,449,583 - 1,159,449,583Loans and advances 20 4,590,510,686 1,013,577,147 5,604,087,833Lease rentals receivable & stock out on hire 21 7,134,074,132 6,149,036,242 13,283,110,374Hire purchase rentals receivable & stock out on hire 22 166,186,750 296,382,451 462,569,201Financial investments - Available for sale 23 463,754,097 - 463,754,097Other financial assets 25 178,653,619 - 178,653,619Total Financial Assets 16,439,757,654 7,458,995,840 23,898,753,494
Ageing analysis of past due (i.e. facilities in arrears of 1 day and above ) but not impaired loans by class of financial assets
Notes to the Financial Statements

232 233
Alliance Finance Company PLC | Annual Report 2016/17
Overview Management Discussion & Analysis
Financial Reports Supplementary information
Past Due but Not Impaired Less than 30 days 31 to 60 days 61 to 90 days More than 91 days Total Rs. Rs. Rs. Rs. Rs.
Loans and advances 623,100,616 187,962,612 48,012,594 155,380,324 1,014,456,146Lease rentals receivable & Stock out on hire 3,366,449,306 1,808,280,026 358,773,543 615,533,367 6,149,036,242Hire purchase rentals receivable & Stock out on hire 136,384,548 65,717,272 19,594,595 74,686,036 296,382,451 4,125,934,470 2,061,959,910 426,380,732 845,599,727 7,459,874,839
49.2.2 Analysis of Risk ConcentrationIndustry AnalysisThe following table shows the risk concentration by industry for the components of the Statement of Financial Position.
Sector wise Breakdown
Cash and Bank Balances
Financial Investments - Held for Trading
Loans and Advances Financial Investments - Available for Sale
Other Financial Assets Total Financial Assets
Rs. Rs. Rs. Rs. Rs. Rs.Agriculture & Fishing - - 3,214,414,767 - - 3,214,414,767Construction - - 481,054,417 - - 481,054,417Food, Beverages & Tobacco
- - 3,150,324,091 - - 3,150,324,091
Financial Services 294,565,160 - 222,711,569 - 1,273,186,055 1,790,462,784Industry - - 213,680,794 - - 213,680,794Tourism - - 87,833,644 - - 87,833,644Government - 1,053,340,388 169,245,571 480,606,721 175,849,048 1,879,041,728Transport - - 6,024,386,361 - - 6,024,386,361Services - - 5,763,811,164 - 291,358,203 6,055,169,367Consumption - - 503,899,548 - - 503,899,548Other - 198,275,389 3,652,249,569 21,217,531 - 3,871,742,488Total 294,565,160 1,251,615,776 23,483,611,496 501,824,252 1,740,393,306 27,272,009,990

234
Alliance Finance Company PLC | Annual Report 2016/17
Overview Management Discussion & Analysis
Financial Reports Supplementary information
49.2.3 Risk Limit Control and Mitigation PoliciesThe Company manages, limits and controls concentrations of credit risk wherever they are identified − in particular, to individual counter parties and groups, and to industries and countries.
The Company structures the levels of credit risk it undertakes by placing limits on the amount of risk accepted in relation to one borrower, or groups of borrowers, and to geographical and industry segments. Such risks are monitored on a revolving basis and subject to an annual or more frequent review, when considered necessary. Limits on the level of credit risk by product and industry sector are approved monthly by the Risk Committee.
Lending limits are reviewed in the light of changing market and economic conditions and periodic credit reviews and assessments of probability of default.
Some other specific control and mitigation measures are outlined below:
CollateralThe Company employs a range of policies and practices to mitigate credit risk. The most traditional of these is the taking of security for funds advances, which is common practice. The Company implements guidelines on the acceptability of specific classes of collateral or credit risk mitigation. The principal collateral types for loans and advances are:
• Mortgages over residential properties.
• Charges over business assets such as premises, inventory and accounts receivable.
• Charges over financial instruments such as debt securities and equities.
Longer-term finance and lending to corporate entities are generally secured; revolving individual credit facilities are generally unsecured. In addition, in order to minimise the credit loss the Company will seek additional collateral from the counter party as soon as impairment indicators are identified for the relevant individual loans and advances.
Collateral held as security for financial assets other than loans and advances depends on the nature of the instrument. Debt securities, treasury and other eligible bills are generally unsecured, with the exception of asset-backed securities and similar instruments, which are secured by portfolios of financial instruments.
Notes to the Financial Statements

234 235
Alliance Finance Company PLC | Annual Report 2016/17
Overview Management Discussion & Analysis
Financial Reports Supplementary information
49.3 Liquidity Risk & Funding Management
“Liquidity risk refers to the availability of sufficient cash balances to meet new lending targets as well as provide a flow of net liquid assets to meet contractual borrowings and other commitments. Liquidity risk is financial risk due to uncertain liquidity. An institution might lose liquidity if its credit rating falls, it experiences sudden unexpected cash outflows, or some other event causes counter parties to avoid trading with or lending to the institution. A firm is also exposed to liquidity risk if markets on which it depends are subject to loss of liquidity.
The Company maintains a portfolio of highly marketable and diverse assets that are assumed to be easily liquidated in the event of an unforeseen interruption of cash flow. The Company also has committed lines of credit that it can access to meet liquidity needs. In addition, the Company maintains the liquidity ratio prescribed by Central Bank of Sri Lanka.
Liquidity risk management processThe Company’s liquidity management process, as carried out within the Company and monitored by a separate team in Company Treasury, includes:
Day-to-day funding, managed by monitoring future cash flows to ensure that requirements can be met. This includes replenishment of funds as they mature or are borrowed by customers.
Maintaining a portfolio of highly marketable assets that can easily be liquidated as protection against any unforeseen interruption to cash flow;
Monitoring the liquidity ratios of the Statement of Financial Position against internal and regulatory requirements
Managing the concentration and profile of debt maturities.
Monitoring and reporting take the form of cash flow measurement and projections for the next day, week and month respectively, as these are key periods for liquidity management. The starting point for those projections is an analysis of the contractual maturity of the financial liabilities and the expected collection date of the financial assets.
Company Treasury also monitors unmatched medium-term assets, the level and type of undrawn lending commitments, the usage of overdraft facilities and the impact of contingent liabilities such as standby letters of credit and guarantees.

236
Alliance Finance Company PLC | Annual Report 2016/17
Overview Management Discussion & Analysis
Financial Reports Supplementary information
49.3.1 Statutory Liquid Asset RatioAs per the requirements of Finance Companies (Liquid Assets) Direction No. 01 of 2009,
(i) Company has to maintain minimum liquid assets, not less than the total of, 10% (a) The outstanding value of the time deposits received by the finance company at the close of the business on such day, and (b) The face value of certificate of deposits issued by the finance company; as appearing on the books of the finance company at the close of the business of such day
and(ii) 15% of the outstanding value of savings deposits accepted by such company, at the close of the business on such day.
As at 31st March 2017, the Company maintained Statutory Liquid Asset ratio at 12.11%.
49.3.2 Analysis of Financial Assets and Liabilities by Remaining Contractual MaturitiesThe table below summarises the maturity profile of the un-discounted cash flow of the Company’s financial assets and liabilities as at 31 March 2017.
On Demand Less than 03 3-12Months 12-60 Months Over 60 Months Total Months Rs. Rs. Rs. Rs. Rs. Rs.
Financial AssetsCash and cash equivalents 250,196,373 - - - - 250,196,373Repurchase agreement 175,849,048 - - - - 175,849,048Placement with banks & other financial institution 198,275,388 172,746,961 847,771,159 - - 1,218,793,508Financial investments - held for trading - 592,272,233 659,343,543 - - 1,251,615,776Loans and advances - 1,863,726,775 3,393,104,306 2,216,317,591 5,318,352 7,478,467,024Lease rentals receivable & stock out on hire - 1,507,531,524 4,206,093,037 10,109,862,598 13,943,353 15,837,430,512Hire purchase rentals receivable & stock out on hire - 53,456,476 70,693,657 43,447,364 - 167,597,496Financial investments - available for sale - 30,644,147 55,756,850 34,389,600 367,533,654 488,324,251Other financial assets - 157,971,752 39,786,469 57,820,766 - 255,578,986Total Financial Assets 624,320,808 4,378,349,868 9,272,549,021 12,461,837,919 386,795,359 27,123,852,974
Notes to the Financial Statements

236 237
Alliance Finance Company PLC | Annual Report 2016/17
Overview Management Discussion & Analysis
Financial Reports Supplementary information
On Demand Less than 03 3-12Months 12-60 Months Over 60 Months Total Months Rs. Rs. Rs. Rs. Rs. Rs.
Financial LiabilitiesDue to banks 441,798,837 1,983,176,735 2,609,687,226 5,926,818,593 756,417,863 11,717,899,254Due to customers 628,916,282 2,451,099,495 3,508,162,977 3,499,643,160 - 10,087,821,914Debt instruments issued and other borrowed funds 11,501,431 430,000 964,801,178 1,571,493,197 - 2,548,225,806Other financial liabilities 736,056,580 101,176,030 50,799,145 - - 888,031,755Total Financial Liabilities 1,818,273,130 4,535,882,260 7,133,450,526 10,997,954,950 756,417,863 25,241,978,729
Total Net Financial Assets/(Liabilities) (1,193,952,322) (157,532,392) 2,139,098,495 1,463,882,969 (369,622,503) 1,881,874,245
Assets held for managing liquidity riskThe Company holds a diversified portfolio of cash and high-quality highly-liquid securities to support payment obligations and contingent funding in a stressed market environment. The Company’s assets held for managing liquidity risk comprise:• Cash and balances with central banks
• Certificates of deposit
• Government bonds and other securities that are readily acceptable in repurchase agreements with central banks
• Secondary sources of liquidity in the form of highly liquid instruments in the Company’s trading portfolios.
49.4 Market Risk
Market risk is the risk that the fair value or future cash flows of financial instruments will fluctuate due to changes in market variables such as interest rates, foreign exchange rates, commodity prices and equity prices. The Company classifies exposures to market risk into either trading or non–trading portfolios and manages each of those portfolios separately.

238
Alliance Finance Company PLC | Annual Report 2016/17
Overview Management Discussion & Analysis
Financial Reports Supplementary information
49.4.1 Interest Rate RiskInterest rate risk arises from the possibility that changes in interest rates will affect future cash flows or the fair values of financial instruments. The Board has established limits on the non–trading interest rate gaps for stipulated periods. The Company’s policy is to monitor positions on a daily basis and hedging strategies are used to ensure positions are maintained within the established limits.
Interest Rate SensitivityThe following table demonstrates the sensitivity to a reasonably possible change in interest rates, with all other variables held constant, of the company’s Income Statement & Equity.
Currency of Borrowings/ Advance Increase (Decrease) in basis points Sensitivity of Profit or Loss Sensitivity of Profit or Loss
2017 2017 2017
Rs. Rs.
Long term loans linked to AWPLR +100/ (-100) (352,432.5)/352,432.53 (352,432.5)/352,432.53
49.4.2 Interest Rate Risk Exposure on Non Trading Financial Assets & LiabilitiesThe table below analyses the company’s interest rate risk exposure on financial assets & liabilities. The company’s assets & liabilities are included at carrying amount and categorized by the earlier of contractual repricing or maturity dates.
Up to 03 Months 03-12 Months 01-05 Years Over 05 Years Non interest Total as at bearing 31/03/2017 Rs. Rs. Rs. Rs. Rs. Rs.
AssetsCash and cash equivalents - - - 250,196,373 250,196,373Loans and advances 1,863,726,775 3,393,104,306 2,216,317,591 5,318,352 - 7,478,467,024Lease rentals receivable & stock out on hire 1,507,531,524 4,206,093,037 10,109,862,598 13,943,353 - 15,837,430,513Hire purchase rentals receivable & stock out on hire 53,456,476 70,693,657 43,447,364 - - 167,597,496Financial investments - available for sale - - - - 488,324,252 488,324,252Other financial assets - - - - 255,578,986 255,578,986Total Financial Assets 3,424,714,775 7,669,891,000 12,369,627,553 19,261,705 994,099,611 24,477,594,644
Notes to the Financial Statements

238 239
Alliance Finance Company PLC | Annual Report 2016/17
Overview Management Discussion & Analysis
Financial Reports Supplementary information
Up to 03 Months 03-12 Months 01-05 Years Over 05 Years Non interest Total as at bearing 31/03/2017 Rs. Rs. Rs. Rs. Rs. Rs.
Financial LiabilitiesDue to banks 2,424,975,572 2,609,687,226 5,926,818,593 756,417,863 - 11,717,899,254Due to customers 3,080,015,777 3,508,162,977 3,499,643,160 - - 10,087,821,914Debt instruments issued and other borrowed funds 11,931,431 964,801,178 1,571,493,197 - - 2,548,225,806Derivative financial liabilities - 17,736,580 - - - 17,736,580Other financial liabilities - - - - 888,031,755 888,031,755Total Financial Liabilities 5,516,922,780 7,100,387,961 10,997,954,950 756,417,863 888,031,755 25,259,715,309
Interest Sensitivity Gap (2,092,208,005) 569,503,039 1,371,672,603 (737,156,157) 106,067,856 (782,120,666)
49.4.3 Exposure To Foreign Currency RiskForeign Currency SensitivityAn estimation of the impact of the currency risk with respect of financial instruments with a 5% change in US Dollar exchange rate is given below. In calculation of risk it is assumed that all other variable factors are held constant. The calculation of sensitivity has been performed only on the assets and liabilities denominated in foreign currency of the Company as at 31st March 2017..The following significant exchange rates were applied during the year
Average Rate2017
Reporting date spot rate2017 2016
USD/ LKR 135.36 142.88 131.50
The Company’s exposure to foreign currency risk is as follows;
As at 31st December 2017 Rs. USD Converted to Rs. Total
Trade & Other Receivables - - -Cash & Cash Equivalents - - -Trade & Other Payables 1,449,401 144.69 1,449,545Amounts due to Related Parties - - -
1,449,401 144.69 1,449,545

240
Alliance Finance Company PLC | Annual Report 2016/17
Overview Management Discussion & Analysis
Financial Reports Supplementary information
49.4.3 Exposure to foreign currency risk (continued)Foreign Currency SensitivityAn estimation of the impact of the currency risk with respect of financial instruments with a 5% change in US Dollar exchange rate is given below. In calculation of risk it is assumed that all other variable factors are held constant. The calculation of sensitivity has been performed only on the assets and liabilities denominated in foreign currency of the Company as at 31st March 2017.
Effect on profit or loss (Rs.) Effect on equity (Rs.)
USD depreciated against LKR by 5% 72,470 72,470USD appreciated against LKR by 5% (72,470) (72,470)
49.5 OPERATIONAL RISK
An operational risk is the risk arising from execution of a company’s business functions. The concept of operational risk is broad and focuses on the risks arising from the people, systems and processes through which a company operates. It also includes other categories such as fraud risks, regulatory and compliance risks, reputation and physical or environmental risks.
49.6 CAPITAL
The Company maintains an activity managed capital basis to cover risks inherent in the business and meet the capital adequacy requirements of Central Bank of Sri Lanka . The adequacy of the company’s capital is monitored based on the measures, rules and ratios adopted by Central Bank of Sri Lanka.
Capital ManagementThe primary objective of Company’s capital management policy are to ensure that the company complies with externally imposed capital requirements and healthy capital ratios in order to support its business and to maximize shareholders’ value.
The Company’s objectives when managing capital, which is a broader concept than the ‘equity’ on the face of the consolidated statement of financial position, are:
• To comply with the capital requirements set by the regulators of the financing markets where the entities within the Company operate
• To safeguard the Company’s ability to continue as a Going Concern so that it can continue to provide returns for shareholders and benefits for other stakeholders
• To maintain a strong capital base to support the development of its business.
Capital adequacy and the use of regulatory capital are monitored daily by the Company’s management, employing techniques based on the guidelines developed by the Central Bank of Sri Lanka, for supervisory purposes. The required information is filed with the Authority on a quarterly basis.
The Company maintains a ratio of total regulatory capital to its risk-weighted assets above a minimum level agreed with the Authority which takes into account the risk profile of the Company.
Notes to the Financial Statements

240 241
Alliance Finance Company PLC | Annual Report 2016/17
Overview Management Discussion & Analysis
Financial Reports Supplementary information
The regulatory capital requirements are strictly observed when managing economic capital. The Company’s regulatory capital is managed by each month by board of directors and comprises two tiers:
• Tier 1 capital
Tire 1 Capital is capital which is permanently and freely available to absorb losses without a finance company being obliged to cease trading. An example of Tier 1 Capital is the paid up ordinary share capital of a finance company. Tier 1 Capital is important because it safeguards both the survival of a finance company and stability of the financial system.
• Tier 2 capital:
Tier 2 Capital is capital which generally absorbs losses only in the event of a winding up of a finance company, and so provides a lower level of protection for depositors and other creditors. Tier - 2 Capital includes revaluation reserve, general provisions and hybrid capital instruments and approved subordinated term debts.
Equity Investments in Unconsolidated Financial and Banking subsidiaries are deducted from Tier 1 and Tier 2 capital to arrive at the Capital Base.
The risk weighted assets are measured using the Risk Weight % and Principal Amount of on Balance Sheet Items.
The table below summarises the composition of regulatory capital and the ratios of the Company for the years ended 31 March 2017 and 2016. During those two years, the Company has complied with all of the externally imposed capital requirements to which they are subject.

242242
Alliance Finance Company PLC | Annual Report 2016/17
Overview Management Discussion & Analysis
Financial Reports Supplementary information
50. CAPITAL ADEQUACY RATIO
Capital Base 31.03.2017 31.03.2016 Rs. Rs.
Tier 1: Core CapitalIssued and Paid up Share Capital 590,030,000 350,000
Statutory Reserve Fund 631,208,800 501,317,400General Reserves 388,258,055 906,658,055Published Retained Profit 1,147,080,445 816,087,109Total Tier 1: Capital 2,756,577,300 2,224,412,564
Tire 1: Supplementary CapitalCapital Reserves (Revaluation ) 239,953,322 239,953,322Shares issued against Approved Reserves 11,975,000 11,975,000General Provisions -Eligible Approved Unsecured Subordinated Term Debt 256,921,646 503,449,744Total Tier 2: Capital 508,849,968 755,378,066DeductionsEquity Investments in Unconsolidated Banking and Financial Subsidiaries 54,715,271 50,867,186Capital Base 3,210,711,998 2,928,923,444
Capital Adequacy Ratio 31.03.2017 31.03.2016
Core Capital Ratio (Minimum 5%) Tier 1 Capital x 100 10.38% 10.22% Risk Weighted Assets
Total Risk Weighted Capital Base x100 12.09% 13.45%Capital Ratio (Minimum 10%) Risk Weighted Assets
Total Risk Weighted
Capital Ratio
Ratio %
11.00%
16/1
7
15/1
6
11.50%
12.50%
12.00%
13.00%
13.50%
14.00%
Core Capital Ratio %
10.10%
16/1
7
15/1
6
10.15%
10.25%
10.20%
10.30%
10.35%
10.40%
Notes to the Financial Statements

Alliance Finance Company PLC | Annual Report 2016/17
Overview Management Discussion & Analysis
Financial Reports Supplementary information
242 243242
Sources and Utilisation of Income - CompanyFor the year ended 31st March 2017 % 2016 % Rs. Rs.
Sources of IncomeLoans and Advances 1,703,346,069 31.96% 1,237,413,538 27.67%Lease, Hire purchases and Consumer Durables 2,998,161,770 56.24% 2,673,145,131 59.77%Government Securities 138,015,988 2.59% 107,791,825 2.40%Placements with Banks & Financial Institutions 109,503,373 2.05% 49,361,072 1.10%Other Investments 28,416,649 0.53% 20,699,738 0.46%Net Fee and Commission Income 154,120,506 2.89% 191,318,610 4.28%Other Income 199,779,358 3.74% 193,715,068 4.32%Total Income 5,331,343,714 100.00% 4,473,444,981 100.00%
To EmployeesPersonnel Expenses 774,573,157 14.53% 750,965,495 16.79%
To suppliersInterest paid 2,462,431,850 46.19% 1,868,434,772 41.77%Other Expenses 901,056,784 16.90% 815,792,384 18.24%Depreciation 117,774,125 2.21% 99,934,198 2.23%Impairment for loans and other losses 73,692,467 1.38% 334,174,465 7.47% 3,554,955,226 66.68% 3,118,335,818 69.71%
Contribution to National Economy

Alliance Finance Company PLC | Annual Report 2016/17
Overview Management Discussion & Analysis
Financial Reports Supplementary information
244
Sources of Income - 2016/17Loans and Advances 32%Lease, Hire purchases and Consumer Durables 56%Government Securities 3%Placements with Banks & Financial Institutions 2%Other Investments 1%Net Fee and Commission Income 3%Other Income 4%
Utilization of Income - 2016/17To Employees 15%To Suppliers 67%To Government 7%To Shareholders 12%
Sources and Utilisation of Income - CompanyFor the year ended 31st March 2017 % 2016 % Rs. Rs.
To GovernmentValue Added Tax & Other Taxes 178,588,251 3.35% 84,125,542 1.88%Income Tax 184,670,010 3.46% 111,117,749 2.48% 363,258,261 6.81% 195,243,291 4.35%
To ShareholdersDividends 182,995,200 3.43% 126,360,000 2.82%Invested in the business 455,561,868 8.54% 282,540,377 6.32% 638,557,068 11.98% 408,900,377 9.14% 5,331,343,713 100.00% 4,473,444,981 100.00%
Contribution to National Economy
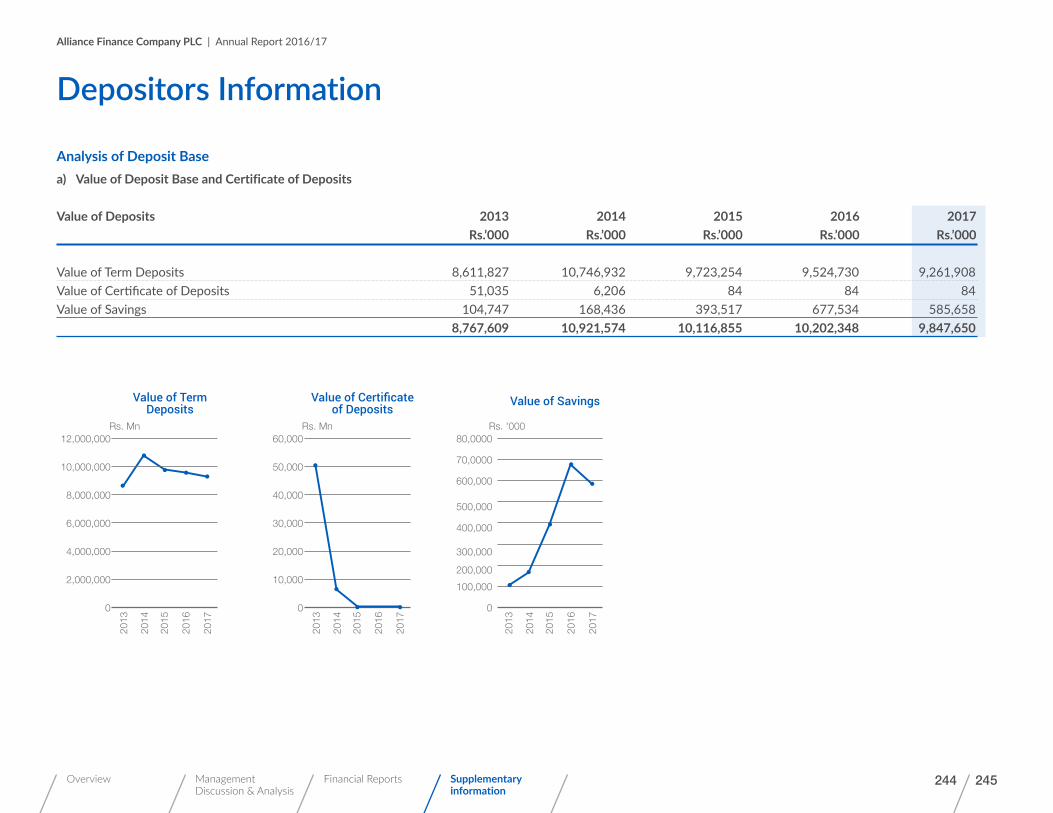
Alliance Finance Company PLC | Annual Report 2016/17
Overview Management Discussion & Analysis
Financial Reports Supplementary information
244 245
Analysis of Deposit Basea) Value of Deposit Base and Certificate of Deposits
Value of Deposits 2013 2014 2015 2016 2017 Rs.’000 Rs.’000 Rs.’000 Rs.’000 Rs.’000
Value of Term Deposits 8,611,827 10,746,932 9,723,254 9,524,730 9,261,908Value of Certificate of Deposits 51,035 6,206 84 84 84Value of Savings 104,747 168,436 393,517 677,534 585,658 8,767,609 10,921,574 10,116,855 10,202,348 9,847,650
Depositors Information
Value of Term Deposits
0
2013
2014
2015
2016
2017
2,000,000
4,000,000
6,000,000
8,000,000
10,000,000
12,000,000Rs. Mn
Value of Certificate of Deposits
0
2013
2014
2015
2016
2017
10,000
20,000
30,000
40,000
50,000
60,000Rs. Mn
Value of Savings
0
2013
2014
2015
2016
2017
100,000
200,000
300,000
400,000
500,000
600,000
70,0000
80,0000Rs. '000
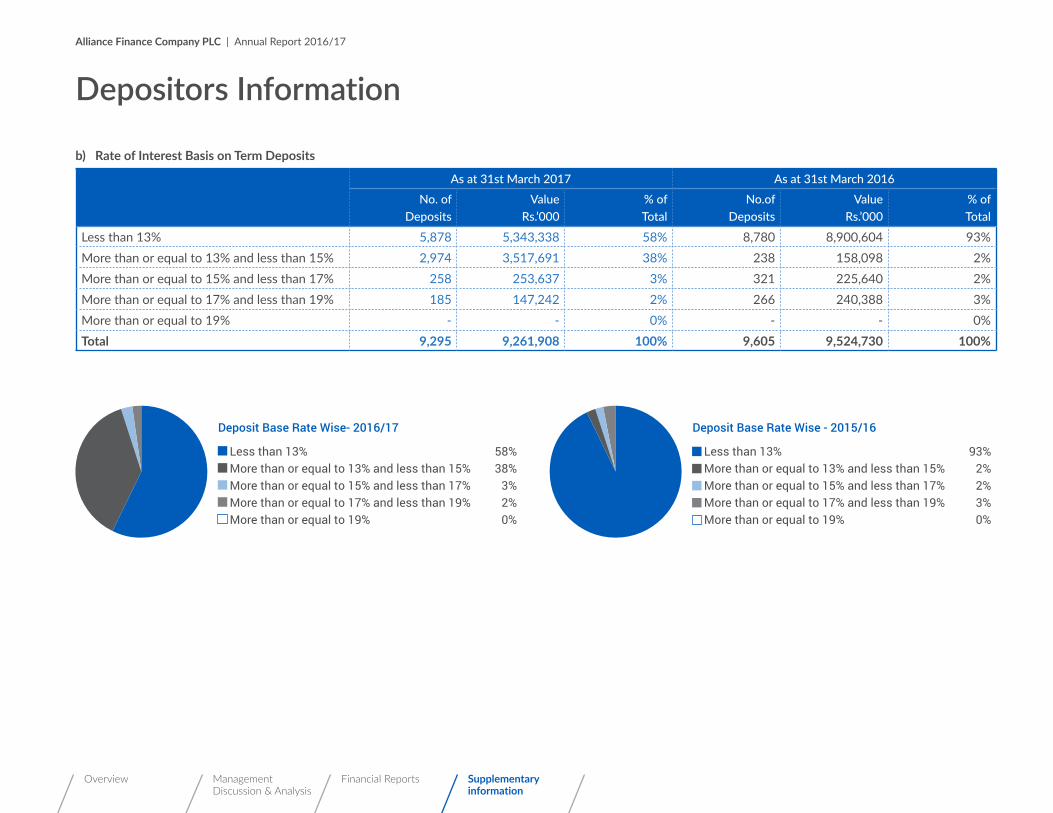
Alliance Finance Company PLC | Annual Report 2016/17
Overview Management Discussion & Analysis
Financial Reports Supplementary information
246
b) Rate of Interest Basis on Term Deposits
As at 31st March 2017 As at 31st March 2016No. of
DepositsValue
Rs.’000% ofTotal
No.ofDeposits
ValueRs.’000
% ofTotal
Less than 13% 5,878 5,343,338 58% 8,780 8,900,604 93%More than or equal to 13% and less than 15% 2,974 3,517,691 38% 238 158,098 2%More than or equal to 15% and less than 17% 258 253,637 3% 321 225,640 2%More than or equal to 17% and less than 19% 185 147,242 2% 266 240,388 3%More than or equal to 19% - - 0% - - 0%Total 9,295 9,261,908 100% 9,605 9,524,730 100%
Deposit Base Rate Wise- 2016/17
Less than 13% 58%More than or equal to 13% and less than 15% 38%More than or equal to 15% and less than 17% 3%More than or equal to 17% and less than 19% 2%More than or equal to 19% 0%
Deposit Base Rate Wise - 2015/16
Less than 13% 93%More than or equal to 13% and less than 15% 2%More than or equal to 15% and less than 17% 2%More than or equal to 17% and less than 19% 3%More than or equal to 19% 0%
Depositors Information

Alliance Finance Company PLC | Annual Report 2016/17
Overview Management Discussion & Analysis
Financial Reports Supplementary information
246 247
c) Capital Range on Term Deposits
As at 31st March 2017 As at 31st March 2016No. of Total % No. of Total %
Deposits Deposits Deposits Deposits
1 - 100,000 2,576 141,099 2% 2,669 144,434 2%100,000 - 250,000 1,670 298,805 3% 1,807 319,541 3%250,001 - 500,000 1,682 682,888 7% 1,798 729,630 8%500,001 - 750,000 547 342,327 4% 581 366,295 4%750,001 - 1,000,000 917 870,378 9% 913 866,107 9%Over 1,000,000 1,903 6,926,411 75% 1,837 7,098,723 75%
9,295 9,261,908 100% 9,605 9,524,730 100%
Capital Range of Term Deposits- 2016/17
1 - 100,000 2% 100,000 - 250,000 3% 250,001 - 500,000 7% 500,001 - 750,000 4% 750,001 - 1,000,000 9% Over 1,000,000 75%
Capital Range of Term Deposits- 2015/16 1 - 100,000 2% 100,000 - 250,000 3% 250,001 - 500,000 8% 500,001 - 750,000 4% 750,001 - 1,000,000 9% Over 1,000,000 75%

Alliance Finance Company PLC | Annual Report 2016/17
Overview Management Discussion & Analysis
Financial Reports Supplementary information
248
d) Deposits Analysis
As at 31st March 2017 As at 31st March 2016Rs.’000 % Rs.’000 %
Individuals 8,315,589 84% 8,596,407 84%Shareholders 359,206 4% 558,643 5%Subsidiaries / Associate Companies 90,304 1% 39,592 0%Other Companies 420,781 4% 250,509 2%Pensions, Provident Funds, Clubs etc. 76,027 1% 79,579 1%Certificate of Deposits 84 0% 84 0%Savings 585,658 6% 677,534 7%
9,847,650 100% 10,202,348 100%
Deposit Analysis - 2016/17Individuals 84%Shareholders 4%Subsidiaries / Associate Companies 1%Other Companies 4%Pensions, Provident Funds, Clubs etc. 1%Certificate of Deposits 0%Savings 6%
Individuals 84%Shareholders 5%Subsidiaries / Associate Companies 0%Other Companies 2%Pensions, Provident Funds, Clubs etc. 1%Certificate of Deposits 0%Savings 7%
Deposit Analysis - 2015/16
Depositors Information
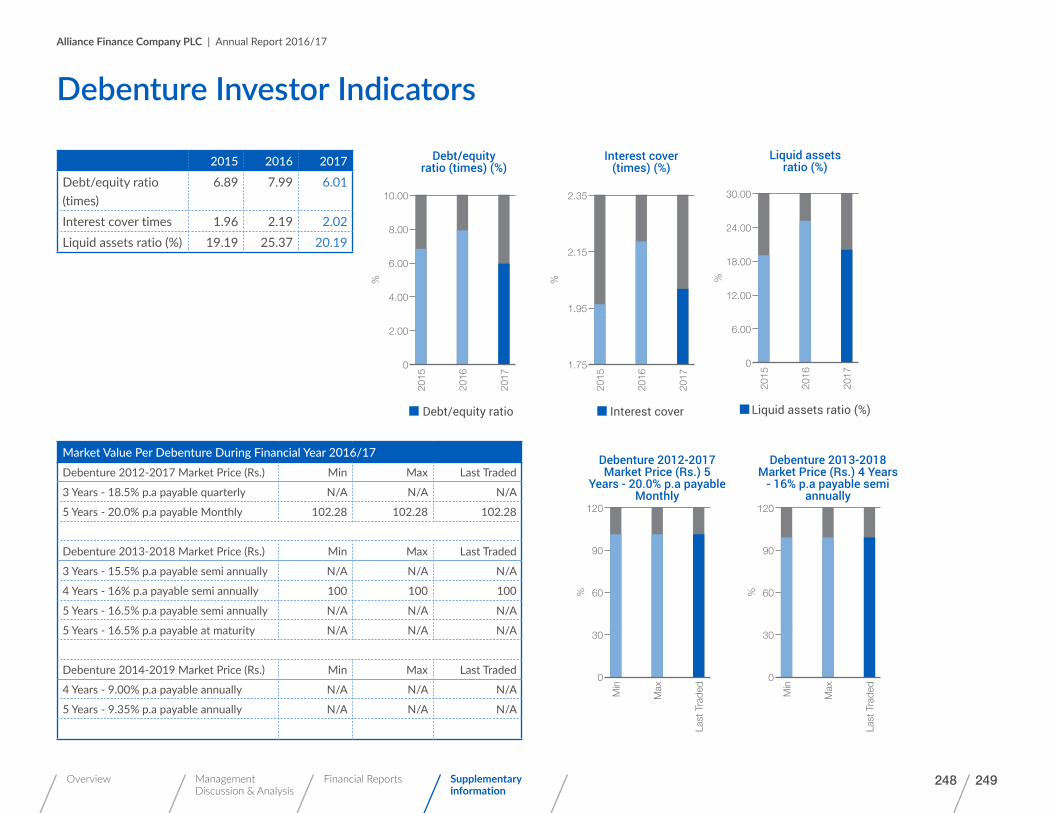
Alliance Finance Company PLC | Annual Report 2016/17
Overview Management Discussion & Analysis
Financial Reports Supplementary information
248 249
Market Value Per Debenture During Financial Year 2016/17Debenture 2012-2017 Market Price (Rs.) Min Max Last Traded
3 Years - 18.5% p.a payable quarterly N/A N/A N/A
5 Years - 20.0% p.a payable Monthly 102.28 102.28 102.28
Debenture 2013-2018 Market Price (Rs.) Min Max Last Traded
3 Years - 15.5% p.a payable semi annually N/A N/A N/A
4 Years - 16% p.a payable semi annually 100 100 100
5 Years - 16.5% p.a payable semi annually N/A N/A N/A
5 Years - 16.5% p.a payable at maturity N/A N/A N/A
Debenture 2014-2019 Market Price (Rs.) Min Max Last Traded
4 Years - 9.00% p.a payable annually N/A N/A N/A
5 Years - 9.35% p.a payable annually N/A N/A N/A
Debenture Investor Indicators
Liquid assets ratio (%)
Liquid assets ratio (%)
0
2015
2016
2017
6.00
30.00
18.00
24.00
12.00
%
Debenture 2012-2017 Market Price (Rs.) 5
Years - 20.0% p.a payable Monthly
Min
Max
Last
Tra
ded
30
60
90
120
0
%
Debenture 2013-2018 Market Price (Rs.) 4 Years
- 16% p.a payable semi annually
Min
Max
Last
Tra
ded
30
60
90
120
0
%
Debt/equity ratio
Debt/equity ratio (times) (%)
0
2015
2016
2017
2.00
10.00
6.00
8.00
4.00
%
Interest cover
Interest cover (times) (%)
2015
2016
2017
1.95
2.15
2.35
1.75
%
2015 2016 2017
Debt/equity ratio (times)
6.89 7.99 6.01
Interest cover times 1.96 2.19 2.02 Liquid assets ratio (%) 19.19 25.37 20.19

Alliance Finance Company PLC | Annual Report 2016/17
Overview Management Discussion & Analysis
Financial Reports Supplementary information
250
(In Rupees Million)For Year Ended 31 March 2008 2009 2010 2011 2012 2013 2014 2015 2016 2017
OPERATING RESULTSIncome 973.07 1,346.86 1,527.78 1,869.41 2,270.91 3,487.97 3,837.89 4,175.93 4,473.44 5,331.34Profit before Tax 73.92 70.65 78.68 234.79 492.72 586.18 261.27 277.45 530.31 834.13Income Tax (11.53) 9.08 10.83 50.00 36.98 75.06 (35.22) 74.54 111.12 184.67Profit after Tax 85.45 61.57 67.85 184.79 455.74 511.11 296.49 202.90 419.19 649.46
BALANCE SHEETAssetsCash,Cash Equivalent & Deposits 73.03 79.51 237.16 467.29 527.37 1,043.08 1,248.20 1,111.75 2,713.93 1,644.84Receivables 397.94 845.99 947.59 705.37 1,220.85 1,126.05 1,350.21 1,101.92 595.04 1,306.76Stocks 3,315.36 3,492.58 3,628.76 5,775.25 9,366.68 13,477.41 12,997.64 14,440.63 19,293.67 22,866.23Investments 601.52 730.79 846.01 1,035.80 785.08 770.74 2,010.06 2,122.07 1,795.53 2,081.21Property,Plant & Equipment 665.81 679.32 654.63 623.25 754.01 1,074.24 1,120.35 1,133.33 1,446.54 2,122.91 5,053.66 5,828.19 6,314.14 8,606.97 12,653.99 17,491.52 18,726.47 19,909.69 25,844.70 30,021.95
LiabilitiesTerm Deposit 2,590.06 3,355.68 4,176.99 5,001.75 6,732.81 9,001.88 11,201.59 10,344.07 10,464.15 10,087.82Bank Overdraft/Loans 1,473.48 1,283.73 919.42 2,269.00 4,213.29 6,013.19 4,945.87 6,833.37 12,275.60 15,154.16Provisions & Other Liabilities 344.75 488.32 455.10 171.76 240.20 357.37 187.70 282.91 382.89 715.18 4,408.29 5,127.73 5,551.51 7,442.51 11,186.30 15,372.44 16,335.16 17,460.35 23,122.64 25,957.15Shareholders’ Funds 645.37 700.47 762.64 1,164.45 1,467.69 2,119.08 2,391.31 2,449.34 2,722.05 4,064.80
CHANGES IN FINANCIAL POSITIONSources of FundsOperations 104.49 250.46 90.71 635.37 717.93 820.61 (904.12) 541.03 876.95 802.96Sale of Fixed Assets 26.27 15.64 57.56 69.87 59.98 36.01 21.44 8.06 47.62 25.23Term Deposits 455.60 765.62 821.31 830.05 1,731.06 2,269.07 2,199.71 (857.52) 120.08 (376.33)Bank Overdraft/Loans 334.39 (191.54) (180.26) 715.26 2,168.21 1,812.02 (1,103.21) 1,547.45 5,258.86 2,874.73Others (53.38) (95.29) (66.04) (44.93) (50.95) (105.27) (165.36) (108.48) (153.38) (101.67) 867.37 744.89 723.28 2,205.61 4,626.22 4,832.44 48.45 1,130.54 6,150.13 3,224.93
Ten Year Summary - Company

Alliance Finance Company PLC | Annual Report 2016/17
Overview Management Discussion & Analysis
Financial Reports Supplementary information
250 251
(In Rupees Million)For Year Ended 31 March 2008 2009 2010 2011 2012 2013 2014 2015 2016 2017
Application of FundsCapital Expenditure 137.93 97.75 82.82 84.86 237.85 158.35 137.36 106.74 450.67 70.49Portfolio Disbursements 939.73 683.78 301.11 2,190.98 4,169.62 4,654.30 20.34 1,071.33 5,952.84 2,832.38Deposits (36.75) 28.59 (1.35) 3.72 (110.79) 10.17 66.37 400.92 (73.28) 37.27Income Tax 24.40 32.98 32.28 64.63 42.56 1.89 1.14 0.93 19.57 180.12Dividends 5.67 6.48 5.67 5.67 105.30 109.35 36.45 48.60 126.36 183.00Other (58.53) (80.80) (40.30) (16.81) 164.93 (130.93) (199.30) (479.01) (351.44) (184.54)Changes in available resources (145.08) (23.89) 343.05 (127.43) 16.75 29.31 (13.93) (18.96) 25.41 106.21 867.37 744.89 723.28 2,205.61 4,626.22 4,832.44 48.45 1,130.54 6,150.13 3,224.93NO. OF SHARES 1,620,000 1,620,000 1,620,000 1,620,000 2,430,000 2,430,000 2,430,000 2,430,000 2,430,000 33,696,000
INDICATORS OF PERFORMANCEReturn on Shareholders Funds %(After Tax) 14.11 9.15 9.27 21.68 34.63 28.50 13.15 8.38 16.21 19.14Return on Total Assets %(After Tax) 1.88 1.13 1.12 2.52 4.29 3.39 1.64 1.05 1.83 2.33Earnings per Share Rs. 52.75 38.01 41.88 76.05 187.55 210.33 122.01 83.50 172.51 19.85Market Value per Share (Rs.) 175.00 175.00 419.00 850.10 630.00 800.10 769.80 770.00 740.00 55.00Price Earning Ratio 3.32 4.60 10.00 11.18 3.36 3.80 6.31 9.22 4.29 2.77Rate of Dividend % 40.00 35.00 35.00 275.00 450.00 400.00 200.00 230.00 530.00 32.38Dividend per Share (Rs.) 4.00 3.50 3.50 27.50 45.00 40.00 20.00 23.00 53.00 5.90Gross Dividend 6.48 5.67 5.67 44.55 109.35 97.2 48.60 55.89 128.79 198.81Dividend cover (times) 13.19 10.86 11.97 4.42 4.17 5.26 6.10 3.63 3.25 3.27Net Assets per share (Rs.) 398.37 432.39 470.77 581.34 603.99 872.05 984.08 1,007.96 1,120.19 120.63
MARKET VALUE PER SHARE DURING THE YEAR ENDEDHighest Value Recorded During the Year (Rs.) 235.00 220.00 485.00 1,100.00 824.90 702.00 820.00 929.00 1,000.00 1,600.00Lowest Value Recorded During the Year (Rs.) 168.00 175.00 185.00 700.00 516.00 849.00 730.00 810.00 732.00 23.00Market Value as at 31st March (Rs.) 175.00 175.00 419.00 850.10 630.00 800.10 769.80 770.00 740.00 55.00
FINANCIAL HIGHLIGHTSYear 2008 2009 2010 2011 2012 2013 2014 2015 2016 2017
Assets 5,054 5,828 6,314 8,607 12,654 17,492 18,726 19,910 25,845 30,022Liabilities 4,408 5,128 5,552 7,443 11,186 15,372 16,335 17,460 23,123 25,957Shareholders Funds 645 700 763 1,164 1,468 2,119 2,391 2,449 2,722 4,065

Alliance Finance Company PLC | Annual Report 2016/17
Overview Management Discussion & Analysis
Financial Reports Supplementary information
252
Shareholder Information
20 MAJOR SHAREHOLDERS31.3.2017 31.3.2016
No. Name of Shareholder No. of Shares
% Name of Shareholder No. of Shares
%
1 Mr. R.K.E.P. de Silva 8,934,075 26.51 Mr. R.K.E.P. de Silva 644,068 26.50
2 Motor Service Station (Pvt) Ltd., 4,542,220 13.48 Motor Service Station (Pvt) Ltd., 327,564 13.48
3 Miss D.M.E.P. Perera 2,501,443 7.42 Miss D.M.E.P. Perera 182,181 7.50
4 Mr. R.K.E.P. de Silva & Mr.J.E.P.A. de Silva 2,101,216 6.24 Mr. R.K.E.P. de Silva & Mr.J.E.P.A. de Silva 151,530 6.24
5 Mr. D.F.W.S.K. Perera & Mr. D.F.W. Perera 1,381,536 4.10 Mr. D.F.W.S.K. Perera & Mr.D.F.W. Perera 99,630 4.10
6 Orient Hotels Ltd., 1,358,323 4.03 Orient Hotels Ltd., 97,956 4.03
7 Mr. N. Amarasinghe 889,360 2.64 Mr. N. Amarasinghe 74,340 3.06
8 Mrs. S.E. Canekeratne 612,268 1.82 Janashakthi PLC A/c No. 1 50,551 2.08
9 Mr. D.L.S.R. Perera 553,556 1.64 Mrs.S.E. Canekeratne 44,154 1.82
10 Janashakthi PLC A/c No. 1 504,663 1.50 Mr. D.L.S.R. Perera 39,920 1.64
11 Mrs. S.R.L. Marcelline 492,480 1.46 Mrs. S.R.L. Marcelline 36,936 1.52
12 Trading Partners (Pvt) Ltd. 422,475 1.25 Trading Partners (Pvt) Ltd. 30,020 1.24
13 Mrs. C.R. de Silva 374,400 1.11 Seylan Bank PLC/Janashakthi Ltd., 27,287 1.12
14 Mr. D.F.W. Perera 310,560 0.92 Mrs. C.R. Cooray 27,000 1.11
15 Ms. D.D.P.T. Perera 309,384 0.92 Mr. D.F.W. Perera 23,292 0.96
16 Mrs. P. Weththasinghe 299,975 0.89 Ms. D.D.P.T. Perera 21,460 0.88
17 Seylan Bank PLC/Janashakthi Ltd., 276,742 0.82 Mrs. P. Weththasinghe 21,397 0.88
18 Mrs. A.S. Wijewardena 259,200 0.77 Mrs. A.S. Wijewardena 19,440 0.80
19 Mrs. L.S. Semage 249,016 0.74 Mrs. L.S. Semage 17,958 0.74
20 Ms. D.C.M.A. Perera 236,632 0.70 Ms. D.C.M.A. Perera 17,000 0.70
26,609,524 78.97 1,953,684 80.40

Alliance Finance Company PLC | Annual Report 2016/17
Overview Management Discussion & Analysis
Financial Reports Supplementary information
252 253
31st March 2017 31st March 2016Holdings No. of Total % No. of Total %
Holders Holders
1 - 1,000 621 160,921 0.48 550 78,440 3.23 1,001 - 10,000 317 1,017,041 3.02 90 298,971 12.30 10,001 - 100,000 126 3,825,934 11.35 26 793,246 32.64 100,001 - 1,000,000 28 7,873,291 23.37 4 1,259,343 51.82 Over 1,000,000 6 20,818,813 61.78 - - -
1,098 33,696,000 100.00 670 2,430,000 100.00
The shares in the hands of the public 31.3.2017 were 18,100,071 representing 53.72% of the Issued Share Capital of the Company and as at 31.3.2016 were 1,305,573 representing 59.96% of the Issued Share Capital of the Company.
31.3.2017 31.3.2016
Institution 27 728,711 21.63 18 508,779 20.94 Individuals 643 2,640,889 78.37 652 1,921,221 79.06
670 3,369,600 100.00 670 2,430,000 100 .00

Alliance Finance Company PLC | Annual Report 2016/17
Overview Management Discussion & Analysis
Financial Reports Supplementary information
254
General Standard Disclosures - G4Number Description Reference/Comments PageStrategy and AnalysisG4-1 Statement from the most senior decision maker of the Organisation about the relevance of
sustainability to the organization and the organization’s strategy for addressing sustainability.Chairman’s Message 16 - 17
Organisational ProfileG4-3 Name of the organization Alliance Finance PLC 4
G4-4 Primary brands, products, and services About our Company-Organisational structure
7
G4-5 The location of the organization’s headquarters Colombo, Sri Lanka 268
G4-6 Number of countries where the organization operates, and names of countries where either the organization has significant operations or that are specifically relevant to the sustainability topics covered in the report.
The Company operates only within Sri Lanka
268
G4-7 The nature of ownership and legal form Corporate Information 268
G4-8 The markets served (geographic breakdown, sectors served, and types of customers/beneficiaries) Social and Relationship Capital 104-113
G4-9 The scale of the organization, including: • Total number of employees
• Total number of operations
• Net sales (for private sector organizations) or net revenues (for public sector organizations)
• Total capitalization broken down in terms of debt and equity (for private sector organizations)
• Quantity of products or services provided
About our CompanyOrganisational structurePerformance highlights
7,9
G4-10 a. The total number of employees by employment contract and gender.
b. The total number of permanent employees by employment type and gender.
c. The total workforce by employees and supervised workers and by gender.
d. The total workforce by region and gender.
e. Report whether a substantial portion of the organization’s work is performed by workers who are legally recognized as self-employed, or by individuals other than employees or supervised workers, including employees and supervised employees of contractors.
f. Report any significant variations in employment numbers (such as seasonal variations in employment in the tourism or agricultural industries).
Human Capital 96-103
GRI G4 Index Table

Alliance Finance Company PLC | Annual Report 2016/17
Overview Management Discussion & Analysis
Financial Reports Supplementary information
254 255
General Standard Disclosures - G4Number Description Reference/Comments Page
G4-11 The percentage of total employees covered by collective bargaining agreements. N/A
G4-12 Describe the organization’s supply chain. Value Creation ModelSocial and relationship capital- Our Business Partners
24104-113
G4-13 Any significant changes during the reporting period regarding the organization’s size, structure, ownership, or its supply chain, including: Changes in the location of, or changes in, operations, including facility openings, closings, and expansions Changes in the share capital structure and other capital formation, maintenance, and alteration operations (for private sector organizations) Changes in the location of suppliers, the structure of the supply chain, or in relationships with suppliers, including selection and termination
About this Report 4,5
G4-14 Whether and how the precautionary approach or principle is addressed by the organization. Natural Capital 115-119
G4-15 List externally developed economic, environmental and social charters, principles, or other initiatives to which the organization subscribes or which it endorses.
About this Report 4-5
G4-16 List memberships of associations (such as industry associations) and national or international advocacy organizations in which the organization is a member.
Social and Relationship Capital-Industry networks
104-113
Identified Material Aspects and BoundariesG4-17 a. List all entities included in the organization’s consolidated financial statements or equivalent
documents.b. Report whether any entity included in the organization’s consolidated financial statements or equivalent documents is not covered by the report.
About this Report 4,5
G4-18 a. Explain the process for defining the report content and the Aspect Boundaries. b. Explain how the organization has implemented the Reporting Principles for Defining Report Content.
Strategic Report-Defining what is material
28-29
G4-19 List all the material Aspects identified in the process for defining report content. Strategic Report-Defining what is material
28-29
G4-20 For each material Aspect, the Aspect Boundary within the organization Strategic Report-Defining what is material
28-29

Alliance Finance Company PLC | Annual Report 2016/17
Overview Management Discussion & Analysis
Financial Reports Supplementary information
256
General Standard Disclosures - G4Number Description Reference/Comments Page
G4-21 For each material Aspect, report the Aspect Boundary outside the organization Strategic Report-Defining what is material
28-29
G4-22 The effect of any restatements of information provided in previous reports, and the reasons for such restatements.
Notes to the Financial Statements 163-242
G4-23 Significant changes from previous reporting periods in the Scope and Aspect Boundaries. Strategic Report-Defining what is material
28-29
Stakeholder EngagementG4-24 List of stakeholder groups engaged by the organization. Stakeholder engagement 25-27
G4-25 The basis for identification and selection of stakeholders with whom to engage. Stakeholder engagement 25-27
G4-26 The organization’s approach to stakeholder engagement Stakeholder engagement 25-27
G4-27 Key topics and concerns that have been raised through stakeholder engagement Stakeholder engagement 25-27
Report ProfileG4-28 Reporting period (such as fiscal or calendar year) for information provided. About this Report 4,5
G4-29 Date of most recent previous report (if any). About this Report 4,5
G4-30 Reporting cycle (such as annual, biennial) Annual 4,5
G4-31 The contact point for questions regarding the report or its contents. About this Report 4,5
G4-32 a. Report the ‘in accordance’ option the organization has chosen. b. Report the GRI Content Index for the chosen option c. Report the reference to the External Assurance Report, if the report has been externally assured.
Core 4,5
G4-33 a. Report the organization’s policy and current practice with regard to seeking external assurance for the report. b. If not included in the assurance report accompanying the sustainability report, report the scope and basis of any external assurance provided.c. Report the relationship between the organization and the assurance providers. d. Report whether the highest governance body or senior executives are involved in seeking assurance for the organization’s sustainability report.
External assurance has not been obtained
4,5
GRI G4 Index Table

Alliance Finance Company PLC | Annual Report 2016/17
Overview Management Discussion & Analysis
Financial Reports Supplementary information
256 257
General Standard Disclosures - G4Number Description Reference/Comments Page
GovernanceG4-34 The governance structure of the organization, including committees of the highest governing body. Corporate Governance 47-58
Ethics and Integrity
G4-56 The organization’s values, principles, standards and norms of behaviour such as codes of conduct and codes of ethics.
Corporate Governance 47-58
Specific Standard DisclosuresMaterial Aspect DMA/Indicators Reference/comments/Reasons for omission Page
Economic PerformanceG4-EC1 Direct economic value generated Performance highlights 9
G4-EC2 Financial implications and other risks and opportunities for the Organisation’s activities due to climate change
Natural Capital 115-119
G4-EC3 Coverage of defined benefit plan obligations Financial Statements 209
EnvironmentalEnergyG4-EN3 Energy consumption within the organization Natural Capital 117-119
G4-EN6 Reduction of energy consumption Natural Capital 117-119
Effluents and wasteG4-EN23 Total weight of waste by type and disposal method Natural Capital 116
ComplianceG4-EN29 Monetary value of significant fines and total
number of non-monetary sanctions for non-compliance with environmental laws and regulations
None 119

Alliance Finance Company PLC | Annual Report 2016/17
Overview Management Discussion & Analysis
Financial Reports Supplementary information
258
Specific Standard DisclosuresMaterial Aspect DMA/Indicators Reference/comments/Reasons for omission Page
SOCIALEmployment: Labour practices and Decent WorkG4-LA1 Total number and rates of new employee hires
and employee turnover by age group, gender, and region
Human Capital 102
G4-LA2 Benefits provided to full-time employees that are not provided to temporary or part-time employees, by significant locations of operation
Human Capital 98
Employment: Occupational health and safetyG4-LA6 Type of injury and rates of injury, occupational
diseases, lost days, and absenteeism, and total number of work-related fatalities, by region and by gender
Human Capital 103
Employment: Training and EducationG4-LA9 Average hours of training per year per employee
by gender, and by employee category Human Capital 102
G4-LA10 Programs for skills management and lifelong learning that support the continued employability of employees and assist them in managing career endings
Human Capital 102
G4-LA11 Percentage of employees receiving regular performance and career development reviews, by gender and by employee category
Human Capital 102
GRI G4 Index Table

Alliance Finance Company PLC | Annual Report 2016/17
Overview Management Discussion & Analysis
Financial Reports Supplementary information
258 259
Specific Standard DisclosuresMaterial Aspect DMA/Indicators Reference/comments/Reasons for omission Page
Society: Local CommunitiesG4-SO2 Operations with significant actual or potential
negative impacts on local communities Community Engagement 110
Product Responsibility: Product and service labelling G4-PR3 Type of product and service information
required by the organization’s procedures for product and service information and labeling, and percentage of significant product and service categories subject to such information requirements
Social and relationship capital 110-113
G4-PR4 Total number of incidents of non-compliance with regulations and voluntary codes concerning product and service information and labeling, by type of outcomes
Social and relationship capital 110-113
G4-PR5 Results of surveys measuring customer satisfaction Social and relationship capital 107
Product Responsibility: Marketing CommunicationsG4-PR6 Sale of banned or disputed products None 107
G4-PR7 Total number of incidents of non-compliance with regulations and voluntary codes concerning marketing communications, including advertising, promotion, and sponsorship, by type of outcomes
Social and relationship capital 107

Alliance Finance Company PLC | Annual Report 2016/17
Overview Management Discussion & Analysis
Financial Reports Supplementary information
260
Specific Standard DisclosuresMaterial Aspect DMA/Indicators Reference/comments/Reasons for omission Page
Product Responsibility: Customer privacyG4-PR8 Total number of substantiated complaints
regarding breaches of customer privacy and losses
of customer data
Social and relationship capital 108
Product Responsibility: ComplianceG4-PR9 Monetary value of significant fines Social and relationship capital 108
Product Responsibility: Product PortfolioG4-FS6 Percentage of the portfolio for business lines by
specific region, size (e.g. micro/sme/large) and by sector
Social and relationship capital 105
GRI G4 Index Table

Alliance Finance Company PLC | Annual Report 2016/17
Overview Management Discussion & Analysis
Financial Reports Supplementary information
260 261
Glossary
AAccounting PoliciesThe specific principles, bases, conventions, rules and practices adopted by a company in preparing and presenting Financial Statements
AccountingThe profit or loss for a period before deducting tax expense
Accrual Basis of AccountingThe effects of transactions and other events are recognised when they are occurred (and not as cash or its equivalent is received or paid) and they are recorded in the accounting records and reported in the financial statements of the periods to which they relate.
Amortisation (Depreciation)The systematic allocation of the depreciable amount of an asset over its useful life
CCarrying AmountThe amount at which an asset is recognized in balance sheet after deducting any accumulated depreciation (amortisation)and accumulated impairment losses
Cash EquivalentsShort-term, highly-liquid investments that is readily convertible to known amounts of cash and which are subject to an insignificant risk of changes in value
ContingenciesConditions or situation at the balance sheet date and the financial effects of which are to be determined by the future events that may or may not occur
Corporate GovernanceThe process by which corporate entities are governed. It is concerned with the way in which power is exercised over the management and direction of entity, the supervision of executive actions and accountability of owners and others.
Cost to Income RatioPersonal and Other Non-Interest Expenses divided by the Net Interest Income & Non-Interest Income
Current TaxThe amount of tax payable in respect of taxable income for the period
DDealing SecuritiesMarketable securities that are acquired and held with the intention of reselling them in the short-term
Deferred tax liabilitiesThe amounts of income tax payable in future periods in respect of taxable temporary differences
Defined Benefit PlansRetirement benefit plans under which amounts to be paid as retirement benefits are determined by reference to a formula usually based on employees’ remuneration and completed years of service
DisbursementsAnother term for investments
Discretionary ProvisionThis includes provision for bonuses and incentives
DividendsDistribution of profits to holders of equity investments, in proportion to their holdings of a particular class of capital
Dividend CoverProfit after tax divided by gross dividend. The ratio measures the number of times dividend is covered by current years’ distributable profits
Dividend per share (DPS)Gross dividend divided by the number of shares in issues
Alliance Finance Company PLC | Annual Report 2016/17
Overview Management Discussion & Analysis
Financial Reports Supplementary information
262
Glossary
EEarnings per Share (EPS)Profit for the period attributable to ordinary shareholders(the numerator) divided by the weighted average number of ordinary shares in issue during the period (the denominator)
Efficiency RatioThe Non-Interest Expenses divided by total income
GGeneral ReservesReserves set aside for future
Gross NPA (NPL) RatioTotal non-performing accommodations (loans) after deducting for initial rentals received, unearned income, and interest in suspense, divided by gross accommodations (loans) after deducting for initial rentals received, unearned income and interest in suspense.
Gross DividendThe portion of profits distributed to the shareholders including the tax withheld
IImpairmentThis occurs when recoverable amount of asset declines below its carrying amount
InvestmentsValue of facilities granted during a specific period
Investments SecuritiesSecurities acquired and held for yield or capital growth purposes; usually held to maturity
LLiquidityThe availability of sufficient funds to meet deposit withdrawals and other financial commitments as they fall due
Liquid AssetsCash and cash equivalents, repurchase agreements,placements in banks and other financial institutions and treasury bills
Liquid Assets RatioLiquid assets as a percentage of total deposits
MMaterialityInformation is material if its non-disclosure could influence the economic decisions of users taken on the Financial Statements
Market Value per ShareMarket capitalization divided by the number of ordinary shares in issue
NNon-Performing Accommodations (Advances/ Loans)-NPAAccommodations which are 180 days or more in arrears of due principal and/or interest payments
Net Assets Value per ShareShareholders’ funds excluding preference shares if any,divided by the weighted average number of ordinary shares in issue
Net NPA RatioTotal non-performing accommodations excluding initial rentals received, unearned income, interest in suspense and provision for loan losses, divided by gross loans after deducting for initial rentals received, unearned income,interest in suspense and provision for loan losses
Net Interest IncomeThe difference between income earned from interest bearing assets and cost incurred on financial instrument/ facilities used for funding the interest bearing assets
Net Interest MarginNet interest income divided by total average assets

Alliance Finance Company PLC | Annual Report 2016/17
Overview Management Discussion & Analysis
Financial Reports Supplementary information
262 263
OOff Balance Sheet TransactionsTransactions that are not recognized as assets or liabilities in the balance sheet but which may give rise to contingencies and commitments
PPortfolioTotal rentals and other receivables on loans and advances after deducting for unearned interest in suspense and initial rentals paid
Price Earning (P/E) RatioThe market price of an ordinary share divided by the Earnings per Share
Provision for loan lossesAmounts set aside against possible losses on net receivable of facilities granted to customer as a result of them becoming party or wholly uncollectible
RReturn on Assets (ROA)Profit before tax expressed as a percentage of average total assets; used along with ROE as a measure of profitability and as a basis of intra-industry performance comparison
Return on Shareholders’ Fund/Equity (ROE)Profit before tax expressed as a percentage of average total assets; used as a measure of profitability and as a basis of intra-industry performance comparison
RevaluationRestatement of assets and liabilities
Rate of DividendGross dividend as a percentage of total par value of shares
SSBUStrategic Business Unit
Segment RevenueRevenue reported in the Company’s income statement that is directly attributable to a segment and the relevant portion of the Company’s revenue that can be allocated on a reasonable basis to a segment
Shareholders’ FundsShareholders’ Funds consist of issued and fully-paid ordinary share capital plus capital and revenue reserves
TTaxable Profit/(Tax Loss)The profit (loss) for a period, determined in accordance with the rules established by the taxation authorities, upon which the income tax is payable/(recoverable)
‘Tier 1’ CapitalCore capital representing permanent shareholders’ equity and reserves created or increased by appropriation of retained earnings or other surplus
‘Tier 2’ CapitalSupplementary capital representing revaluation reserve,general provisions and other capital instruments which combine certain characteristics of equity debt such as hybrid capital instruments and subordinated term debts
VValue AddedValue Added is the wealth created by providing services less cost of providing such services. The value added is allocated amongst the employees, the providers of capital and to the Government by way of taxes and retained for expansion and growth
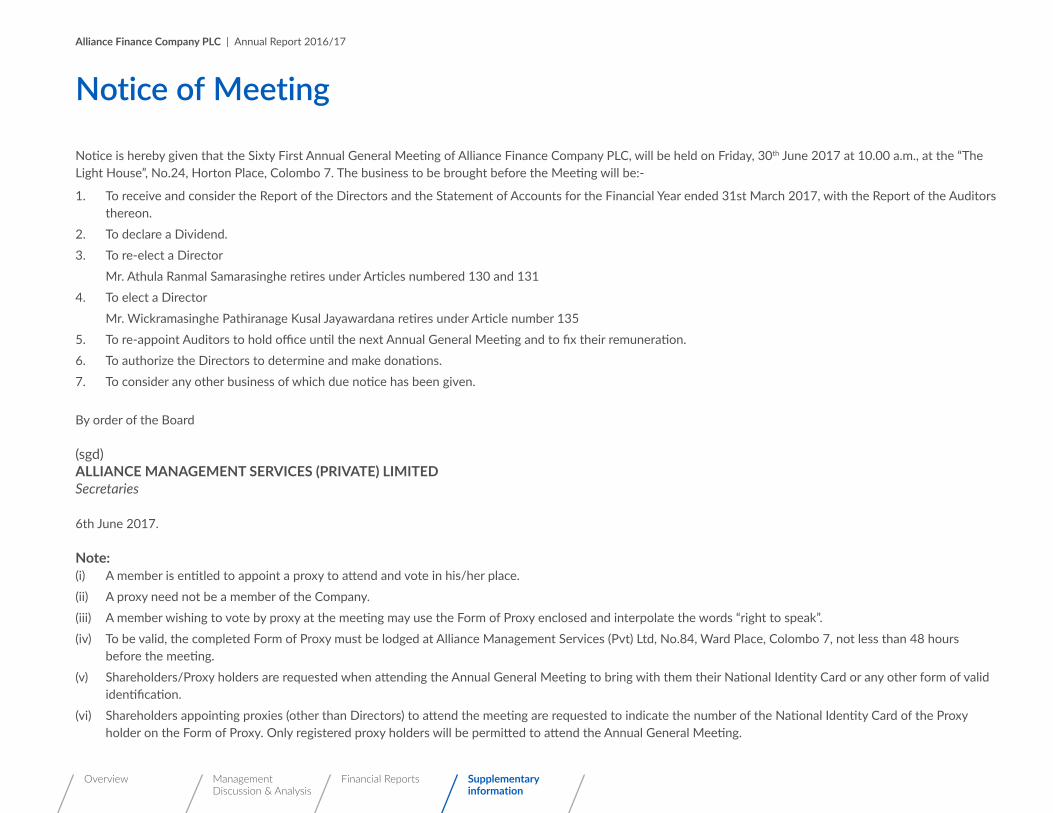
Alliance Finance Company PLC | Annual Report 2016/17
Overview Management Discussion & Analysis
Financial Reports Supplementary information
264
Notice is hereby given that the Sixty First Annual General Meeting of Alliance Finance Company PLC, will be held on Friday, 30th June 2017 at 10.00 a.m., at the “The Light House”, No.24, Horton Place, Colombo 7. The business to be brought before the Meeting will be:-
1. To receive and consider the Report of the Directors and the Statement of Accounts for the Financial Year ended 31st March 2017, with the Report of the Auditors thereon.
2. To declare a Dividend.3. To re-elect a Director Mr. Athula Ranmal Samarasinghe retires under Articles numbered 130 and 1314. To elect a Director Mr. Wickramasinghe Pathiranage Kusal Jayawardana retires under Article number 1355. To re-appoint Auditors to hold office until the next Annual General Meeting and to fix their remuneration.6. To authorize the Directors to determine and make donations.7. To consider any other business of which due notice has been given.
By order of the Board
(sgd)ALLIANCE MANAGEMENT SERVICES (PRIVATE) LIMITEDSecretaries
6th June 2017.
Note:(i) A member is entitled to appoint a proxy to attend and vote in his/her place.(ii) A proxy need not be a member of the Company.(iii) A member wishing to vote by proxy at the meeting may use the Form of Proxy enclosed and interpolate the words “right to speak”.(iv) To be valid, the completed Form of Proxy must be lodged at Alliance Management Services (Pvt) Ltd, No.84, Ward Place, Colombo 7, not less than 48 hours
before the meeting.(v) Shareholders/Proxy holders are requested when attending the Annual General Meeting to bring with them their National Identity Card or any other form of valid
identification.(vi) Shareholders appointing proxies (other than Directors) to attend the meeting are requested to indicate the number of the National Identity Card of the Proxy
holder on the Form of Proxy. Only registered proxy holders will be permitted to attend the Annual General Meeting.
Notice of Meeting

Alliance Finance Company PLC | Annual Report 2016/17
Overview Management Discussion & Analysis
Financial Reports Supplementary information
264 265
I/We......................................................................................................................................................................................................................................................................................................of
.....................................................................................................................................................................................................................................................................................................................
being a member/members of the above named Company hereby appoint Sunil Karunanayake or failing him Romani Kumar Eardley Partick de Silva or failing him
Jalathge Mahinda Gunasekera or failing him Ramani Nelun Ponnambalam or failing her Athula Ranmal Samarasinghe or failing him Lansage Ajith Prasanna Medis or
failing him Wickramasinghe Pathiranage Kusal Jayawardana or failing him ……………………….…............................................................................................................................................
of .........………………………………………………………………………………………………………...........................................................................................................................................................................
NIC No……………………………………………………………………………………………………..............................................................................................................................................................................
as my/our proxy to represent me/us and to *vote for me/us on my/our behalf at the 61st Annual General Meeting of the Company to be held on 30th June 2017 and at
any adjournment thereof and at every poll which may be taken in consequence thereof.
1. Resolution No.1The Ordinary Resolution No.1 set out in the Notice convening the aforesaid Meeting.2. Resolution No.2The Ordinary Resolution No.2 set out in the Notice convening the aforesaid Meeting.3. Resolution No.3The Ordinary Resolution No.3 set out in the Notice convening the aforesaid Meeting.4. Resolution No.4The Ordinary Resolution No.4 set out in the Notice convening the aforesaid Meeting.5. Resolution No.5The Ordinary Resolution No.5 set out in the Notice convening the aforesaid Meeting.6. Resolution No.6The Ordinary Resolution No.6 set out in the Notice convening the aforesaid Meeting.
Signed this ........................................... day of ........................................2017
............................................ Signature
Instruction as to completion of Form of Proxy given overleaf.
Form of Proxy

Alliance Finance Company PLC | Annual Report 2016/17
Overview Management Discussion & Analysis
Financial Reports Supplementary information
266
Instructions as to completion of the Form of Proxy1. A proxy holder need not be a member of the Company.
2. The full name and address of the proxy and of the shareholder appointing the proxy should be entered legibly in the Form of Proxy.
3. The completed Form of Proxy should be deposited at the office of the Secretaries, Alliance Management Services (Pvt) Ltd., 84, Ward Place, Colombo 7, 48 hours before the time appointed for the holding of the Meeting.
4. In the case of a Company or a Corporate Body, the Form of Proxy should be executed under its Common Seal in accordance with its Articles of Association.
Note: If you wish your proxy to speak and vote at the Meeting you should interpolate the words “to speak and” in the space indicated with an asterisk and initial such interpolation.
Form of Proxy

Alliance Finance Company PLC | Annual Report 2016/17
Overview Management Discussion & Analysis
Financial Reports Supplementary information
266 267
Notes

Alliance Finance Company PLC | Annual Report 2016/17
Overview Management Discussion & Analysis
Financial Reports Supplementary information
268
Corporate Information
Name of the CompanyAlliance Finance Company PLC
Statutory StatusQuoted Public Limited Liability Company, incorporate under the Companies Ordinance No.51 of 1938
Approved and registered under the • Finance Business Act No. 42 of 2011 • Finance Leasing Act No. 56 of 2000
An approved Credit Agency under the • Mortgage Act No.6 of 1949 • Trust Receipt Ordinance No.12 of 1947
Company Registration No.PQ 93
Registered OfficeAlliance House No.84, Ward Place, Colombo 7,Sri Lanka.Tel: (+94) 11 2673673 Fax: (+94) 11 2697205 E-mail: [email protected]
Board of DirectorsMr. Sunil Karunanayake - ChairmanMr. Romani de Silva - Deputy Chairman & Managing Director Mr. J.M. Gunasekera - Director SustainabilityLt. Col. (Retd) A.R. Samarasinghe - Independent Non-Executive Director Mrs. R.N. Ponnambalam - Non-Executive Director Dr. L.A.P. Medis – Consultant Director MarketingMr. W.K.P. Jayawardana – Consultant Director Finance and Operations
Advisory CouncilMr. Pratapkumar de Silva FICM (SL), FICM (Eng.), JP Mr. B. Ponnambalam Mrs. K.S.K. de Silva Mr. Abbas Akbarally (Chairman - Akbar Brothers Group of Companies) Mr. K. Kanaglsvaran LLB (London) of Lincoln’s Inn Barrister - (President’s Counsel) Mr. S.P. Morawake (Former Registrar of Companies)
Audit Committee Mr. Sunil Karunanayake - Chairman Lt. Col. (Retd) A.R. Samarasinghe
Remuneration Committee Lt. Col. (Retd) A.R. Samarasinghe – ChairmanMr. Sunil Karunanayake Mrs. R.N. Ponnambalam
Related Party Transactions Committee Lt. Col. (Retd) A.R. Samarasinghe – ChairmanMr. Sunil Karunanayake Mrs. R.N. Ponnambalam
Subsidiaries Alfinco Insurance Brokers (Pvt) Ltd.
Auditors M/s. Baker Tilly Edirisinghe & Co. Chartered Accountants No.45, 2nd Floor ,Braybrooke Street, Colombo 2.
Legal Consultants Gunawardena & Ranasinghe Associates Sudath Perera Associates
Secretaries Alliance Management Services (Pvt) LtdNo. 84 Ward Place, Colombo 7.
Bankers Sampath Bank PLCSeylan Bank PLCPublic Bank Berhad People’s BankHatton National Bank PLCCommercial Bank PLC Bank of Ceylon Nations Trust Bank PLCNDB Bank PLC DFCC Bank PLC
Prod
uced
by
Copy
line
(Pvt
) Ltd
Prin
ted
by G
unar
atne
Off
set (
Pvt)
Ltd


270
Alliance Finance Company PLC | Annual Report 2016/17
Overview Management Discussion & Analysis
Financial Reports Supplementary information
www.alliancefinance.lk