pension reform and labor market policies in central europe elaine fultz senior specialist in social...
TRANSCRIPT

Pension Reform and Labor Market Policies In Central Europe
Elaine Fultz
Senior Specialist in Social SecurityInternational Labor Organization
Budapest

2
Older population in Europe is growing rapidly
• Over the past 50 years, average life expectancy increase from 63 to 73.
• Is expected to rise to 80 by 2050.

3
Proportion of European population 60+ years
Source: United Nations projections (2003), as cited in Managing transitions: Governance for decent work, Report of the Director-General, Volume II, ILO: Geneva, 2005.
0
5
10
15
20
25
30
35
40
1950
1955
1960
1965
1970
1975
1980
1985
1990
1995
2000
2005
2010
2015
2020
2025
2030
2035
2040
2045
2050
EU 15 + Iceland, Switzerland, Norway New EU member States
South Eastern Europe and Mediterranean Commonwealth of Independent States

4
Proportion of European population 80+ years
0
2
4
6
8
10
12
1950
1955
1960
1965
1970
1975
1980
1985
1990
1995
2000
2005
2010
2015
2020
2025
2030
2035
2040
2045
2050
EU 15 + Iceland, Switzerland, Norway New EU member States
South Eastern Europe and Mediterranean Commonwealth of Independent States
Source: United Nationas projections (2003), as cited in Managing transitions: Governance for decent work, Report of the Director-General, Volume II, ILO: Geneva, 2005.

5
Labor Market Participation
No commensurate increase
6
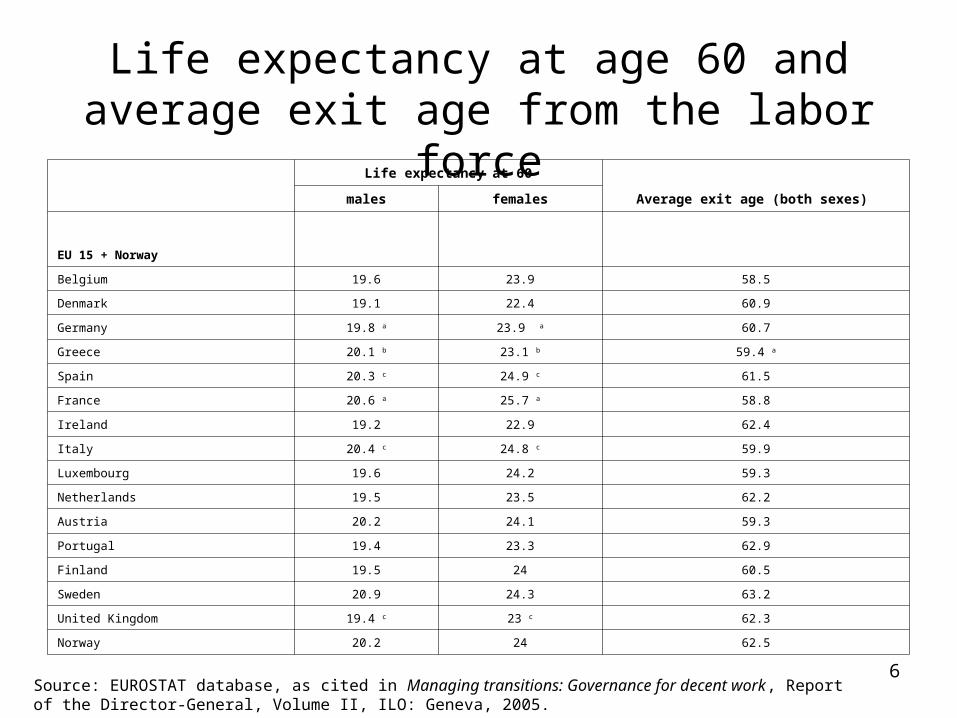
Life expectancy at age 60 and average exit age from the labor force
Life expectancy at 60
Average exit age (both sexes) males females
EU 15 + Norway
Belgium 19.6 23.9 58.5
Denmark 19.1 22.4 60.9
Germany 19.8 a 23.9 a 60.7
Greece 20.1 b 23.1 b 59.4 a
Spain 20.3 c 24.9 c 61.5
France 20.6 a 25.7 a 58.8
Ireland 19.2 22.9 62.4
Italy 20.4 c 24.8 c 59.9
Luxembourg 19.6 24.2 59.3
Netherlands 19.5 23.5 62.2
Austria 20.2 24.1 59.3
Portugal 19.4 23.3 62.9
Finland 19.5 24 60.5
Sweden 20.9 24.3 63.2
United Kingdom 19.4 c 23 c 62.3
Norway 20.2 24 62.5
Source: EUROSTAT database, as cited in Managing transitions: Governance for decent work, Report of the Director-General, Volume II, ILO: Geneva, 2005.

7
Life expectancy at age 60 and average exit age from the labor force
Life expectancy at 60
Average exit age (both sexes) males females
New EU Member States
Czech Republic 17.3 21.5 60.2
Estonia 15.4 21.3 61.6
Cyprus 19.5 d 22.7 d 61.4
Latvia 15.2 20.8 62.4 a
Lithuania 16.1 21.7 58.9 a
Hungary 16.1 20.9 59.2
Poland 17.1 22 56.9
Slovenia 18 23.1 61.5 a
Slovakia 16.4 21 57.5
SEE & Mediterranean
Bulgaria 16.1 19.7 58.6
Romania 16.1 19.7 59.8 a
Source: EUROSTAT database, as cited in Managing transitions: Governance for decent work, Report of the Director-General, Volume II, ILO: Geneva, 2005.

8
Total and older workers employment rates, 2002
0
10
20
30
40
50
60
70
80
Denmark
Netherl
ands
Sweden UK
Austria
Portug
al
Finland
Irelan
d
German
y Lux
France
Belgium Spa
in
Greece Ita
ly
Cyprus
Czech
R.
Sloven
iaEsto
niaLa
tvia
Lithu
ania
Roman
ia
Slovaki
a
Hunga
ry Malta
Poland
Bulgari
a
Turkey
EU 15
New EU 10
Total Older workers
Source: Eurostat (2004), as cited in Managing transitions: Governance for decent work, Report of the Director-General, Volume II, ILO: Geneva, 2005.

9
Pension reforms in the later 1990s
• Increase retirement age
• Privatization – “Averting the Old Age Crisis”

10
Retirement Ages – New EU States Current law Men Women
Czech Rep.
1995, 2003 increasing to 63 by 2013 by 2 months/year
Increasing to 59-63 (depending on no. of children raised) by 4 mos/yr in 2013
Estonia 1998, in force 2000
63 Increasing to 63 in 2016 by 6 months/year
Hungary 1996 increasing to 62 in 2001 by 1 year every second year
Increasing to 62 in 2009 by 1 year every second year
Latvia 1998 increasing to 62 in 2003 by 6 months/year
Increasing to 62 in 2008 by 6 months/year
Lithuania 1994, 2000 increasing to 62.5 in 2003 by 6 months/year
Increasing to 60 in 2006 by 6 months/year
Poland 1998
(in force, 1999)
65, with early retirement eliminated beginning in 2007
60, with early retirement eliminated beginning in 2007
Slovak Rep.
2003 Gradual rise to age 62 Same as for men
Slovenia 1999 63 61

11
Mixed labor market response
• Due to –– Early retirement options– Difficult labor market situation– Social/cultural factors

12
Pension privatization in the new EU member states
Countries with mandatory, commercially managed individual savings accounts
Countries without such scheme
Hungary (1998) Czech Republic
Poland (1999) Lithuania
Latvia (2001) Slovenia
Estonia (2002)
Slovak Repub. (2003)

13
Early difficulties with privatization
• Small and undeveloped financial markets – the resulting high investment in government bonds
prevents risk diversification
• High administrative costs – negative real returns on worker savings
• Transitional financing costs– weakened the capacity of pension systems to meet
new demands from demographic aging

14
Transitional financing costs - Poland -
0.0%
0.5%
1.0%
1.5%
2.0%
2.5%
2000 2005 2010 2015 2020 2025 2030 2035 2040 2045 2050
year
% GDP
privatization revenues credit public pillar savings
Chlon, Agnieszka, "The Polish Pension Reform of 1999," in Fultz, E., Ed., Pension Reform in Central and Eastern Europe, Vol. 1, ILO: Budapest, 2002.

15
More recent perspective on how to deal with aging:
(1) Raise employment rates– EU target: 70 percent for 2010
• 60 percent for women• 50 percent for older workers

16
Employment rates in 2002
0
1020
3040
5060
70
Esto
nia
Latvi
a
Hung
ary
Polan
d
Bulg
aria
Kaza
khsta
n
Croa
tia
Mac
edon
ia
Employment rate(15-64) Employment rate (55-64)
EU average (15-64)
EU average (55-64)
Chlon, Agnieszka, "Funded pensions in the transition economies of Europe and Central Asia: Design and Experience", FIAP, 2004.

17
2. Extend working life
• European Council (Barcelona) set target for progressive increase of about 5 years by 2010.– Must take account of needs and rights of
older people, especially those with poor working conditions, long working lives, and health problems.

18
3. Pension reforms
• Needed to complement effort to increase employment
• Eliminate or reduce incentives for early retirement• Incentives to save more for own retirement• Options for gradual retirement
– Other– Address large, sustained transitional deficits from
privatization– Reestablish minimum benefits

19
In Conclusion
• Challenges ahead are great
• No recipes or standard solutions
• Multidisciplinary approach required