pension plan returns and the firm’s cost of debt€¦2 pension plan returns and the firm’s cost...
TRANSCRIPT

Pension Plan Returns and the Firm’s Cost of Debt
Mahendra Gujarathi
1
Atul Gupta2
Kartik Raman3
Bentley University
January 2010
1 Department of Accountancy, Bentley University, 175 Forest Street, Waltham, MA 02452. Phone: 781-891-3408;
Fax: 781-891-2896; Email: [email protected] 2 Department of Finance, Bentley University, 175 Forest Street, Waltham, MA 02452. Phone: 781-891-2772; Fax:
781-891-2896; Email: [email protected] 3 Department of Finance, Bentley University, 175 Forest Street, Waltham, MA 02452. Phone: 781-891-2781; Fax:
781-891-2896; Email: [email protected]
We thank Rani Hoitash, Jay Thibodeau, and workshop participants at the Bentley University Accounting workshop
for helpful comments and suggestions. We gratefully acknowledge Yan Wu, Li Li and Shubin Liang for providing
excellent research assistance.
1
Pension Plan Returns and the Firm’s Cost of Debt
Abstract
We examine firms with defined benefit pension plans and find a positive and statistically
significant relation between assumed rates of return on pension assets and stock return volatility,
the probability of default, and particularly the firm‟s cost of debt. In contrast, the actual return on
pension assets is only weakly related to the cost of debt. The findings are generally stronger for
firms with underfunded pension plans, and indicate that a one percent increase in the assumed
rate of return is associated with a 32 basis point higher cost of debt. Evaluated at the mean, our
findings suggest that every dollar increase in reported earnings achieved by assuming a higher
rate of return on pension assets is associated with an additional $1.87 in the cost of debt, thereby
highlighting an important economic consequence of off-balance-sheet activities.
Keywords: Defined benefit pension plan, assumed rate of return, actual return, cost of capital,
bond yield, default risk.
JEL Classification: G32

2
Pension Plan Returns and the Firm’s Cost of Debt
1. Introduction
“Companies may be forced to follow the lead of Detroit-based General Motors Corp., which in
2003 sold $13.5 billion of bonds to help close its pension deficit. To entice buyers, the world's
largest automaker offered yields about half a percentage point more than those on existing
debt……..Among the issues that have driven down GM's bonds and its credit ratings since the
2003 bond sale are concerns about GM's obligations to its retirees”
- Bloomberg.com, May 16, 2006.
Off-balance sheet assets play a crucial role in corporate risk-taking. Of particular interest
are the assets and liabilities of defined benefit pension plans, which constitute one of the largest
types of off-balance sheet items (Jin, Merton, and Bodie, 2006; Rauh, 2006, 2009; Shivdasani
and Stefanescu, 2009). Not surprisingly, pension plans have been instrumental in affecting the
financial health of prominent companies.4 Although the liabilities of such plans (net of plan
assets) are liabilities of the firm (Petersen, 1994), there is scant evidence on how rates of return
on pension plan assets affect the rates of return required by the firm‟s debt holders. Our study
attempts to fill this gap in the literature by examining the relation between pension plan returns
and the firm‟s cost of debt.
Under existing pension accounting rules, the reported income from pension assets is
derived from an assumed return on pension assets rather than the actual return on such assets.
The assumed return is under the discretion of corporate management and is oftentimes used as an
earnings management tool. Bergstresser, Desai and Rauh (2006) provide evidence that firms use
4 Scores of companies including Caterpillar, Goodyear, Kroger, Lockheed Martin, NCR, Nortel Networks, have
alluded to the adverse effect of pensions in their 2008 earnings reports. According to Credit Suisse, 128 of the S&P
500 companies could face a pension-related hit to earnings in 2009 (Wall Street Journal, 12/14/2008). Numerous
articles in the business press (Katz 2009, for instance) have noted the effect of pension deficits on jobs elimination,
salary cuts, loan covenant violation, slashing of capital expenditures and possible bankruptcy. For instance, General
Motors had to spend most of the $3.5 billion in cash generated in its auto business to fund its severely underfunded
pension plan. Furthermore, GM issued additional debt and convertible securities to raise $13.5 billion needed to
make up for the pension funding deficit, thereby compounding the likelihood of financial distress (Muller, 2003). In
a recent survey, about twenty five percent of senior finance executives interviewed agreed that “pension plans might
make it difficult to meet cash requirements, raise capital, or fund strategic investments” (CFO Publishing, 2007).

3
the assumed return on pension assets to opportunistically manage earnings, particularly in
periods preceding acquisitions, option exercises, and when they are near critical earnings
thresholds. While a higher assumed return boosts reported earnings, it can also have negative
implications for the firm‟s financial health, with associated higher costs of debt.
The expectation of a positive relation between the assumed return on pension assets and
the firm‟s cost of debt follows from the link between cash flow uncertainty, default risk, and the
cost of debt (Merton, 1974). A higher assumed return signals an increase in the risk of the
pension portfolio, and thereby raises the risk of large pension deficits. As firms are mandated to
cover such deficits with additional contributions, the assumed return on plan assets impacts the
likelihood that internal funds will be diverted to cover pension shortfalls, particularly when plans
are underfunded.5 Thus, pension plans aiming for higher returns are likely to face higher costs of
debt as riskier investments required to attain the high assumed returns increase the uncertainty of
cash flows available to pay creditors.6 Using a large sample of firms with defined benefit
pension plans between 1991 and 2006, we find empirical support for our hypotheses.
Our key findings are as follows. First, we find a positive and significant relation between
the assumed rate of return and stock return volatility during the year, confirming that higher
assumed rates of return on pension assets are associated with greater uncertainty about expected
future cash flows. Second, we find a significant positive relation between assumed rates of
return and the probability of default. The estimates suggest that all else equal, the probability of
default increases by 2.43 percent for every one percent increase in the assumed rate of return.
This result is more pronounced for firms with underfunded plans. Given that the unconditional
5 A plan is said to be underfunded if the amount of pension liabilities exceeds the amount of plan assets.
6 Bergstresser, Desai and Rauh (2006) provide evidence of a positive relation between the assumed return on
pension assets and portfolio risk; they find that a 25 basis point increase in the assumed return on pension assets is
associated with a 5 percent increase in equity allocations. See also Amir and Benartzi, 1998.

4
probability of default in our sample is 10.95 percent, pension plan returns appear to play a
substantial role in predicting the incremental probability of default.
Third, as shown in Figure 1, we find a strong positive relation between the assumed rate
of return on pension assets and the cost of debt; controlling for other factors, a one percent
increase in the assumed rate of return is associated with a 32 basis point increase in the cost of
debt. This result is significant in a sub-sample of firms with underfunded pension plans, but not
for firms whose plans are not underfunded. These findings are consistent with Carroll and
Niehaus (1998), in that underfunded pension plans are found to impact a firm‟s potential
liabilities more than overfunded plans affect the firm‟s assets.
Fourth, we examine whether the cost of debt reflects actual returns on pension assets
(disclosed in footnotes to the financial statements), or the assumed rate of return (which reduces
pension costs reported in the income statement but does not represent the actual performance of
pension assets). Using a smaller sample of S&P 500 firms (4,000 firm-year observations) with
hand-collected data on the actual return on pension assets, we find that the coefficient on lagged
actual return (with cost of debt as the dependent variable) is positive and significant at
conventional levels.7 However, the economic strength of this relation is weak. Firms reporting a
one percent higher (lagged) actual return are associated with only a 0.7 basis point incremental
increase in the cost of debt.
These findings suggest that although investors do not ignore cash flow relevant
information in the actual return, they appear to place less weight on such information. Overall,
the results are consistent with the view that debt holders demand a premium from firms with
higher assumed returns on pension assets, as these returns reflect higher levels of risk, higher
7 We use the lagged (rather than contemporaneous) actual return because the actual return in a given fiscal year may
not be known for a few months after the fiscal year ends. Our inferences regarding the effects of actual return and
the assumed rate of return are unchanged if we use contemporaneous instead of lagged actual return.

5
cash flow volatility, a greater likelihood of pension deficits and a higher likelihood of the firm
having to divert future cash flows to cover pension deficits.
The results are robust to a number of diagnostic checks. We examine whether annual
changes in the cost of debt are related to annual changes in the assumed rate of return, and find
that our conclusions are robust with respect to this specification. We also examine a sample of
new debt issues and find a significant positive relation between the assumed rate of return and
the yield to maturity at the new issue. Our findings indicate that firms with a one percent higher
assumed rate of return offer yields that are 28 basis points higher.
Furthermore, we examine the robustness of our results to the inclusion of variables that
control for differences in governance across firms and years by including board characteristics.
We also include a measure of accounting quality to control for the impact of earnings
management (through working capital accruals) on the cost of debt. The coefficient on the
assumed rate of return is positive and significant in each of these alternative specifications.
Finally, we verify that the results are similar using both cross-sectional regressions as well as the
Fama and Macbeth (1973) regression approach.
Our study contributes to the literature on several dimensions. First, market efficiency in
the context of pension-related issues has been almost exclusively focused on equity markets
(e.g., Barth, 1991; Barth et al., 1992; Brown, 2002; Coronado and Sharpe, 2003; Picconi, 2006;
Jin, Merton, and Bodie, 2006). In particular, some prior studies suggest that stock market
participants may not incorporate pension accounting information into earnings forecasts and
stock prices (e.g., Coronado and Sharpe, 2003; Picconi, 2006; Franzoni and Marin, 2006). Our
study provides evidence from a bond market perspective and finds that investors in the bond

6
market appear to price the information contained in pension plan returns.8 A potential
explanation for our findings is that trading in the corporate bond market is predominated by
large, institutional investors (Edwards, Harris, and Piwowar, 2006; Biais and Green, 2007), and,
securities owned and traded by institutional investors generally tend to exhibit greater
informational efficiency than other securities (Boehmer and Kelley, 2009). Moreover, as
bondholders receive fixed claims, the detrimental effect of uncertain future cash flows on bond
prices makes the cost of debt particularly sensitive to assumed rates of return on pension assets.
Second, by documenting a link between pension plan returns and the cost of debt, our
study adds to a growing body of research on defined benefit pension plans and their influence on
the firm‟s financial policies (e.g., Petersen, 1994; Rauh, 2006, 2009; Jin, Merton, and Bodie,
2006; Shivdasani and Stefanescu, 2009; Franzoni, 2009). In particular, Rauh (2006) suggests
that the negative relation between mandatory pension contributions and firms‟ capital
expenditures is primarily driven by the “inability of firms to raise funds for desired investments.”
Our finding that firms with higher assumed returns face higher costs of debt (particularly when
pension plans are underfunded), extends the work of Rauh (2006) and Franzoni (2009) by
suggesting that a higher cost of debt could be a potential reason why capital expenditures decline
for firms with mandatory pension contributions.
Third, prior research suggests that managers use the assumed return on pension assets to
boost reported earnings (Bergstresser, Desai, and Rauh, 2006), and that firms with higher
assumed returns are generally associated with riskier pension assets (Amir and Benartzi, 1998).
Our findings extend this line of work and support the theory in Kedia and Phillipon (2009) by
confirming that firms with higher assumed returns are associated with more uncertain future cash
8 The conceptual frameworks of both FASB and IASB state that financial reporting should provide information that
is decision-useful not only to equity investors, but also to creditors.

7
flows (arising from risky investments needed to justify the higher reported earnings), and thereby
incur a higher cost of debt. Indeed, our findings indicate that for every $1 increase in earnings
arising from the use of the assumed rate of return, firms incur additional debt costs of $1.87.
Thus, our study adds to the growing literature on economic consequences of earnings
management. In a broader vein, our study highlights how off-balance sheet activities influence a
firm‟s cost of capital.
Our findings also have implications for accounting standard-setters concerned about
whether investors are well served by firms reporting the assumed rate of return (rather than the
actual return) as it could mask information about the firm‟s net future liabilities arising from the
performance of pension plans. In particular, advocates of SFAS 87 (modified by SFAS 158)
argue that the actual return on pension assets includes transitory items in the form of unrealized
gains and losses and can exacerbate the volatility of reported earnings. Critics of SFAS 87 and
SFAS 158 however, are concerned that using the assumed rate of return to determine pension
costs has the effect of masking information about the true economic condition of pension assets.9
Our analysis contributes to this debate by providing evidence that from a credit market
perspective, investors appear to incorporate information contained in the assumed rate of return
into the firm‟s cost of debt. In addition, our finding that the actual return is only weakly related
to the cost of debt complements the evidence in Hann, Heflin, and Subramanyam (2007) who
find that fair-value pension accounting may impair the relevance of financial statements to the
market‟s assessment of firms‟ credit risk.
9 For example, prominent investors, practitioners, and members of congress have been vocal in their opposition to
the use of the assumed rate of return particularly because fair value accounting could result in the firm experiencing
a decline in the fair value of its net pension assets while at the same time reporting pension income from those assets
(see, e.g., Loomis, 2001; Barlas, 2005; Ryan and Fabozzi, 2002; and comment letters to the FASB from members of
congress at www.fasb.org).

8
The rest of the paper proceeds as follows. In the next section, we discuss the hypotheses
and related literature. The sample formation and description are presented in Section 3. We
discuss empirical results and robustness tests in Section 4, and conclude the paper in Section 5.
2. Hypotheses and related literature
In this section, we discuss factors affecting the relation between the firm‟s cost of debt
and the returns on defined-benefit pension plans. Companies use an assumed rate of return on
pension assets to compute periodic net pension costs, which impact their reported earnings. As
the assumed rate of return is supposed to reflect long-term expectations of the return on pension
assets rather than the true performance of such assets, the assumed return is likely to differ from
the actual return during any given period.
Bergstresser, Desai, and Rauh (2006) argue that one motive for the use of high assumed
rates of return is to lower the net pension cost, and thereby boost the reported earnings per
share.10
However, theory suggests that in order to credibly justify higher earnings arising from
the high assumed rates of return, firms would have to allocate pension assets into riskier
investments (e.g., Kedia and Phillipon, 2009). As a result, higher assumed rates of return on
pension assets are generally associated with riskier pension allocations such as LBOs, venture
capital and private placements (Amir and Benartzi, 1998; Bergstresser, Desai and Rauh, 2006).
The use of high assumed rates of return has potentially adverse consequences for the
firm‟s debtholders. First, riskier pension allocations increase the likelihood that firms would
have to rely on operating cash flow to cover pension shortfalls. This possibility arises because
10
A second, and mutually exclusive, motivation for using high assumed rates of return is to engage in risk-shifting,
i.e., transfer of wealth from employees and debt holders to shareholders. However, Rauh (2009) finds that risk-
shifting is not a primary motive for firms allocating assets in defined-benefit plans.

9
poor pension plan performance and pension deficits are more likely to occur when pension assets
are invested in risky securities (Rauh, 2006).11
As a result, the uncertainty about future cash
flows available for payments to creditors is expected to increase as the assumed rate of return
increases.12
Second, if high assumed rates of return increase the uncertainty about cash flows,
the risk of financial distress also increases.13
Thus, we hypothesize that:
H1: Firms with high assumed rates of return on pension assets are associated with more
volatile expected future cash flows.
H2: Firms with high assumed rates of return on pension assets are associated with a
higher probability of default.
It follows from the above arguments that bondholders would require higher premiums from firms
with high assumed returns because the claims of existing bondholders are diluted if high
assumed rates of return make cash flows more volatile than that implied by the terms of the
original bond contract (Fama and Miller, 1972; Jensen and Meckling, 1976; Smith and Warner,
1979). Moreover, the possibility of future debt issues with the same (or higher) level of seniority
increases the risk of claims dilution for existing bondholders, and thereby increases borrowing
11 When a defined-benefit pension plan is underfunded, the Employee Retirement Income Security Act (ERISA) of
1974, and more recently, the Pension Protection Act of 2006, mandate the sponsoring firm to make additional
contributions with the aim of restoring the pension plan to a fully funded status.
12
This view is corroborated by practitioners. In the context of pension shortfalls, Jonathan Nus, a director in S&P's
financial disclosure group notes that ``to the extent a company will have to contribute greater levels of cash flow it
will put increased pressure on the company's cash flow and liquidity'' (Richard, 2006).
13
For evidence on the link between cash flow volatility and distress risk, see e.g., Minton and Schrand, 1999;
Damodaran, 2002; Molina, 2005.

10
costs (Collin-Dufresne and Goldstein, 2001; Muller, 2003; Richard, 2006).14
Thus, firms with
high assumed rates of return on pension assets are expected to face higher borrowing costs.15
Collectively, the above arguments lead to our third hypothesis:
H3: Firms with high assumed rates of return on pension assets are associated with
higher costs of debt.
3. Sample and descriptive statistics
In this section, we describe the types of samples used in this study and the criteria used to
construct each sample. We also describe the key statistics associated with the variables used in
the study.
3.1 Sample formation
We examine three types of samples. First, we examine all Compustat firms with defined
benefit pension plans (hereafter referred to as the full sample). As our hypotheses examine the
relation between pension plan returns and the cost of debt, we require that sample firms have
non-missing data on pension assets and on the assumed rate of return on pension assets. This full
sample consists of 30,077 firm-year observations (represented by 4,194 firms) between 1991 and
2006. The sample period begins in 1991 because this is the first year with Compustat data
14
Brick and Fisher (1987) find that before 1950, most bond indentures prevented firms from issuing additional debt
of the same or higher seniority. However, such covenants were rare after 1976. See also, Malitz, 1994.
15
For instance, when GM issued additional debt in 2003 to cover its pension deficit, the company was forced to
offer yields that were 50 basis points higher than those of its existing debt (Richard, 2006).

11
available on the assumed rate of return on pension plans; prior research examining pension cost
issues also uses sample periods beginning in 1991 (e.g., Shivdasani and Stefanescu, 2009). 16
An advantage of using Compustat is that it enables us to draw inferences based on large
samples and makes replication easy. However, a drawback of this approach is that it does not
permit examination of the relation between actual returns and cost of debt. The actual return on
pension assets is miscoded in Compustat from 1997 onwards.17
Therefore, to examine the
relative importance of the assumed return versus the actual return on pension assets, we examine
a second (smaller) sample using hand-collected data on the actual return on pension assets from
10-K reports for the period beginning 1991 and ending 2006 for a sample of firms belonging to
the S&P 500 Index (hereafter referred to as the S&P sample). The S&P sample includes 4,000
firm-year observations.18
The third sample comprises of new debt issues between 1991 and 2006 made by firms
with defined benefit pension plans (hereafter referred to as the new issues sample). In this
sample we relate the assumed rate of return on the pension plan in the fiscal year preceding the
announcement of the new debt issue to the yield-to-maturity offered at the issue. For firms with
16
Prior studies such as Shivdasani and Stefanescu (2009) exclude financial companies because the interest expense
for such firms includes interest on deposits. In our study, we use two distinct types of samples. One sample is based
on pooled data, using the interest expense as a proxy for the cost of debt. The other sample is based on new debt
issues, where the cost of debt is measured as the yield to maturity for new debt offerings. As there is no reason to
exclude financials from the new debt issue sample, we include financials in both samples, rather than including them
in one sample and excluding them from the other. However, we verify and find that the exclusion of financials from
the pooled sample does not alter our conclusions.
17
Disclosure of actual return on pension plan assets was not required until SFAS 132 (applicable for fiscal years
ending after December 15, 1997) came into effect. As a result, actual returns are available only from 1997 for
almost all (2,584 out of 2,591) the observations.
18 We use membership in the S&P 500 Index as a criterion to form the smaller sample because over two-thirds of
these large firms have defined-benefit plans. Moreover, roughly 90 percent of these firms had underfunded pension
plans (with an aggregate of about $1.1 trillion in assets and $1.4 trillion in projected pension obligations (present
value) at the end of 2008 (Graves, 2009)

12
multiple debt issues in a given year, we retain the largest debt issue in that year. This sample
includes of 2,120 announcements of new debt issues by firms with defined benefit pension plans.
3.2 Descriptive statistics
The distribution of observations by year, reported in Panel A of Table 1, indicates that the
observations are distributed fairly evenly throughout the sample period, ranging from 5.65
percent to 7 percent in any given year. Panel B of Table 1 presents descriptive statistics for the
full sample. The variables are defined in the Appendix, and the reported statistics and results are
based on winsorizing all variables at the one and ninety-nine percent levels.
Following Francis, LaFond, Olsson, and Schipper (2005), we estimate the cost of debt as
the interest expense during the year scaled by the average total debt over the last two years; the
average cost of debt for firms in our sample is 8.37 percent, with a median of 7.60 percent. The
assumed rate of return is reasonably well distributed, with a mean of 8.44 percent and a median
of 8.50 percent. Pension assets are 14.18 percent of the firm‟s total assets on average, which is
similar to the mean value of 16.4 percent reported by Shivdasani and Stefanescu, 2009.
Moreover, about 63 percent of the firm-year observations are associated with underfunded
pension plans. The relatively high percentage of underfunded pension plans in our sample
reflects the low interest rate environment for much of the sample period, and is consistent with
anecdotal evidence suggesting that large percentages of S&P 500 firms had underfunded plans
over this time period.19
The sample firms are large, with total assets of about $12 billion on average, although the
median is much smaller at $1.2 billion. The mean leverage is 30.82 percent of assets, and the
19
For example, Kwan (2003) notes that about 90 percent of S&P 500 firms with defined benefit plans had
underfunded pension plans as of 2002. See also Graves, 2009.

13
sample firms are relatively profitable with a mean ROA of 2.37 percent. In addition, the mean
interest coverage ratio indicates that the operating income for firms in the sample is 13 times the
interest expense, on average, and the volatility of annual earnings during the prior ten years
(divided by average total assets during the same period) is around 4 percent, on average.
About 51 percent of the firm-year observations have debt ratings, and the volatility of
daily stock returns is about 2.51 percent on average. The average book-to-market ratio is 0.58.
Consistent with the sample firms having relatively low levels of uncertainty, the average beta for
the sample firms during a given fiscal year is 0.71. Furthermore, the probability of default (over
the next five years) for the average firm in our sample is around 10.95 percent and the mean
value of our measure of distance to default is 4.45. Interestingly, the characteristics of firms are
similar across sub-samples categorized by the funding status of the pension plan. The results in
the last two columns in Panel B of Table 1 suggest that firms with underfunded plans appear to
be slightly smaller, have pension assets that are a smaller proportion of total assets, are less
profitable on average and have slightly higher betas compared to firms without underfunded
plans. Finally, our proxy for the term structure, estimated as the difference between the 10-year
and the six-month Treasury yield, is 1.46 percent on average.
Panel C of Table 1 presents key characteristics of firms without defined benefit plans
(and hence not in our sample). A comparison of these characteristics with those of the sample
firms in Panel A indicates that firms with defined benefit pension plans are larger, more
profitable, have less uncertainty, higher interest coverage ratios and a lower cost of debt. This
pattern of results for defined benefit plan sponsors and non-sponsors is largely similar to those
reported by Shivdasani and Stefanescu (2009) for their sample period of 1991 to 2003.

14
4. Empirical results
In this section, we describe findings from multivariate regressions exploring the relation
between pension plan returns and the volatility of stock returns, the likelihood of default, and the
firm‟s cost of debt. As our sample comprises of panel data on variables (such as cost of debt and
the assumed rate of return on pension assets) that are likely to be correlated across time for a
given firm, or across firms each year, we follow Petersen (2009) and include firm and year fixed
effects to minimize the bias in the coefficient estimates and in the significance levels.20
Moreover, the firm fixed effects specification helps mitigate the endogeneity bias in the
coefficient estimates due to the omission of potentially correlated variables. Following Petersen
(2009), the t-statistics reported in the study are based on standard errors that are robust with
respect to heteroskedasticity and adjusted for firm-level clustering.
4.1. Assumed rate of return and stock return volatility
A higher level of cash flow uncertainty implies more volatile stock returns. Thus, if
higher assumed returns increase cash flow uncertainty by increasing the uncertainty about
pension shortfalls, we should expect a positive relation between assumed rates of return and
stock return volatility. In this section, we examine the relation between stock return volatility
and assumed rates of return using the following regression specification:
𝑆𝑡𝑎𝑛𝑑𝑎𝑟𝑑 𝑑𝑒𝑣𝑖𝑎𝑡𝑖𝑜𝑛 𝑜𝑓 𝑟𝑒𝑡𝑢𝑟𝑛𝑠𝑖 ,𝑡 =
∝ + 𝛽1 𝐴𝑠𝑠𝑢𝑚𝑒𝑑 𝑟𝑎𝑡𝑒 𝑜𝑓 𝑟𝑒𝑡𝑢𝑟𝑛 𝑖,𝑡 + 𝛽2 𝐿𝑜𝑔 𝑡𝑜𝑡𝑎𝑙 𝑎𝑠𝑠𝑒𝑡𝑠 𝑖 ,𝑡
+ 𝛽3 𝐿𝑒𝑣𝑒𝑟𝑎𝑔𝑒 𝑖 ,𝑡 + 𝛽4 𝑅𝑂𝐴 𝑖 ,𝑡 + 𝛽5 𝐼𝑛𝑐𝑜𝑚𝑒 𝑣𝑜𝑙𝑎𝑡𝑖𝑙𝑖𝑡𝑦 𝑖,𝑡 + 𝛽6 𝑅𝑎𝑡𝑒𝑑 𝑖,𝑡
+ 𝛽7 𝐵𝑒𝑡𝑎 𝑖 ,𝑡 + 𝛽8 𝐵𝑜𝑜𝑘 𝑡𝑜 𝑚𝑎𝑟𝑘𝑒𝑡 𝑖 ,𝑡 + ∈𝑖 ,𝑡 (1)
20
We verify the robustness of our findings using alternative regression specifications including cross-sectional
regressions and the Fama-Macbeth specification. Findings from these additional tests are presented and discussed in
section 4.8 of the paper.

15
The rationale for our choice of explanatory variables is as follows. We include firm size
as small firms are likely to be associated with greater information asymmetries and hence, higher
stock return volatility. We also include leverage as firms with higher leverage are likely to face
more volatile stock returns. In addition, we control for measures of firm profitability and income
volatility as we expect less profitable firms and those with more volatile earnings to be
associated with higher stock return volatility. We also expect firms with higher betas and firms
that are not rated to be associated with more volatile stock returns. Additionally, we include the
book to market equity ratio as an independent variable to control for the possibility that firms
with high ratios may be distressed (and hence, associated with higher stock return volatility), or
that firms with low ratios may be characterized by growth options (leading to more uncertainty
about future cash flows, and hence, greater stock return volatility).
Findings from this regression are reported in Table 2. In Model 1 of Table 2, with no
control variables, the coefficient on Assumed rate of return is 0.16 with a t-statistic of 8.80,
confirming the presence of a significant positive relation between assumed rates of return and
stock return volatility. Including the entire set of explanatory variables yields the findings
reported in Model 2; in this specification the coefficient on Assumed rate of return is 0.25 with a
t-statistic of 10.27. These results suggest that firms reporting a one percent higher assumed rate
of return are associated with a 25 basis point higher volatility in daily stock returns. This finding
indicates that pension returns have an economically significant impact on return volatility,
considering that the mean daily stock return volatility for the sample is 2.55 percent.
Analysis of sub-samples reveals that the association between assumed rate of return and
stock return volatility is stable across firms with underfunded plans as well as those with plans
that are not underfunded. The coefficients for the assumed rate of return in both sub-samples are

16
similar to those for the full sample, suggesting that the incremental increase in stock return
volatility that is attributable to the assumed rate of return on pension assets is independent of the
funding status of the pension plan.
The control variables have signs that are intuitive and consistent with expectations. We
find that firms that are smaller, more levered, less profitable, having more volatile income, and
higher betas are associated with higher levels of stock return volatility. Overall, the results in
this section are consistent with hypothesis H1, indicating that investors attach higher levels of
uncertainty to firms with higher assumed returns, regardless of whether or not the pension plan is
underfunded.
4.2. Assumed rate of return and default risk
Given the importance of default risk to the cost of debt, we examine whether investors
expect higher probabilities of default for firms reporting higher assumed rates of return.
4.2.1. Choice of model and measure of default risk
One challenge in the estimation of default probabilities is the choice of an appropriate
model. As noted by Vassalou and Xing (2004), accounting based models of default risk rely on
financial statement information, which is inherently backward looking and hence less suited to
estimating the future probability of default. Moreover, although the volatility of asset values is
an important indicator of default risk (Merton, 1974), accounting based models do not take into
account the impact of asset volatilities on the probability of default.
Following prior research such as Vassalou and Xing (2004) and Bharath and Shumway
(2008), we use the option pricing framework, which incorporates forward-looking information

17
about investors‟ expectations of future firm performance into the estimates of default
probabilities.21
According to the option pricing framework used in Merton (1974), the value of a
firm‟s equity at time t can be viewed as a call option on the firm‟s assets, with the value of
liabilities as the strike price. We follow the KMV-Merton approach suggested in Duffie and
Singleton (2003) and estimate distance to default as:
𝐷𝐷𝑡 = 𝑙𝑛
𝑉𝑎 ,𝑡
𝑋𝑡 + 𝜇 −
12𝜎𝑎
2 𝑇
𝜎𝑎 𝑇 (2)
where, DD refers to the distance to default, taV , is the value of the underlying assets, tX is the
value of the firm‟s liabilities, represents the expected asset returns, a is the volatility of the
firm‟s assets, and T represents the time remaining until expiration of the call option. Given that
the effects of pension plan returns on pension deficits and the firm‟s liabilities are unlikely to
manifest in the short term (within a year), we use five years as the time till expiration and assess
the likelihood of default over the next five years.
Intuitively, given that default occurs if the ratio of the value of assets to debt is less than
one (or log of this ratio is negative), the distance to default indicates approximately by how many
standard deviations the log of this ratio has to deviate from its mean for default to occur. Thus,
our first measure of default risk is the distance to default. Based on our hypothesis H2, we
expect firms reporting higher assumed rates of return on pension assets to be associated with a
smaller distance to default, reflecting greater credit risk.
Our second measure of default risk is the probability of default, which is based on the
distance to default. The probability of default is estimated as:
21
In addition, this framework incorporates the volatility of assets into the estimation of default probabilities. As a
result, even if firms have similar levels of equity and debt, their default probabilities could differ if their asset
volatilities are different.

18
𝑃𝑟𝑜𝑏𝑎𝑏𝑖𝑙𝑖𝑡𝑦 𝑜𝑓 𝑑𝑒𝑓𝑎𝑢𝑙𝑡 = 𝜑 −𝐷𝐷𝑡 (3)
where 𝜑() represents the cumulative normal distribution function. As it is unclear how much of
the long-term debt should be used to estimate default risk over the next five years, we follow the
approach used in prior research (e.g., Crosbie, 1999; Vassalou and Xing, 2004; Das and
Hanouna, 2009) and include one half the long-term debt in our calculation of total debt.22
We
estimate the market value of the firm‟s assets as the market value of common equity plus book
value of total assets minus the book value of common equity. Further, we estimate expected
asset returns as the average daily stock return during the 240 days preceding the fiscal year end,
and the volatility of the firm‟s asset values as the daily stock return standard deviation during the
240 days preceding the fiscal year end, both measures annualized using 240 trading days.
4.2.2. Assumed rate of return and default risk: Empirical results
We examine the relation between pension returns and the probability of default using the
following multivariate regression specification.
𝐷𝑒𝑓𝑎𝑢𝑙𝑡 𝑟𝑖𝑠𝑘𝑖,𝑡 =
∝ + 𝛽1 𝐴𝑠𝑠𝑢𝑚𝑒𝑑 𝑟𝑎𝑡𝑒 𝑜𝑓 𝑟𝑒𝑡𝑢𝑟𝑛 𝑖,𝑡 + 𝛽2 𝐿𝑜𝑔 𝑡𝑜𝑡𝑎𝑙 𝑎𝑠𝑠𝑒𝑡𝑠 𝑖 ,𝑡
+ 𝛽3 𝐿𝑒𝑣𝑒𝑟𝑎𝑔𝑒 𝑖 ,𝑡 + 𝛽4 𝑅𝑂𝐴 𝑖 ,𝑡 + 𝛽5 𝐼𝑛𝑐𝑜𝑚𝑒 𝑣𝑜𝑙𝑎𝑡𝑖𝑙𝑖𝑡𝑦 𝑖,𝑡 + 𝛽6 𝑅𝑎𝑡𝑒𝑑 𝑖,𝑡
+ 𝛽7 𝐵𝑒𝑡𝑎 𝑖 ,𝑡 + 𝛽8 𝐵𝑜𝑜𝑘 𝑡𝑜 𝑚𝑎𝑟𝑘𝑒𝑡 𝑖 ,𝑡 + 𝛽9 𝑇𝑒𝑟𝑚 𝑠𝑡𝑟𝑢𝑐𝑡𝑢𝑟𝑒 𝑖 ,𝑡
+ ∈𝑖 ,𝑡 (4)
We model default risk using variables that are likely to affect the likelihood of financial
distress. In addition to the control variables in Table 2, we include the term structure of Treasury
22
We verify and find that including all the long-term debt as part of the firm‟s total debt does not change our
conclusions with regard to the relation between assumed rate of return on pension assets, distance to default and the
probability of default.

19
yields as an independent variable to control for the effects of macroeconomic factors on distress
risk. Table 3 presents results from the above regression. In the first column of Table 3, the
dependent variable, Default risk, is measured using Distance to default. The coefficient on
Assumed rate of return is -0.78 and is highly significant with a t-statistic of -10.86, indicating
that firms reporting higher assumed returns are closer to default than other firms.
In the second column of Table 3, with Default risk measured as the probability of default
over the next five years, we find that the coefficient on Assumed rate of return is positive and
significant at conventional levels. The coefficient implies that every one percent increase in the
assumed rate of return is associated with a 2.43 percent increase in the probability of default.
This finding appears to be economically significant, given that the unconditional probability of
default for the full sample is 10.95 percent.
In the last two columns, we report the regression coefficients for probability of default by
categorizing the sample based on pension funding status. The results indicate that the link
between the assumed rate of return on pension assets and the probability of default is more
pronounced in the sub-sample of firms with underfunded plans. The probability of default
associated with a one percent increase in the assumed rate of return is 2.76 percent in the
underfunded sub-sample, compared to the statistically insignificant coefficient in the sub-sample
of firms without underfunded pension plans. These findings complement the evidence on stock
return volatility, and suggest that investors in debt markets appear to incorporate the information
in pension returns into their assessment of default risk.
The control variables in Table 3 yield coefficients that are largely consistent with
expectations. For instance, the probability of default increases with leverage and the book-to-
market ratio. Furthermore, firms with lower profitability (ROA) and greater variability in

20
profitability (income volatility) are associated with higher probabilities of default. These
findings are consistent with the results in prior research (e.g., Bharath and Shumway, 2008).23
4.3. Assumed rate of return and the cost of debt
To test hypothesis H3 pertaining to the firm‟s cost of debt, we examine the following
regression specification:
𝐶𝑜𝑠𝑡 𝑜𝑓 𝑑𝑒𝑏𝑡𝑖 ,𝑡 =
∝ + 𝛽1 𝐴𝑠𝑠𝑢𝑚𝑒𝑑 𝑟𝑎𝑡𝑒 𝑜𝑓 𝑟𝑒𝑡𝑢𝑟𝑛 𝑖 ,𝑡 + 𝛽2 𝐿𝑜𝑔 𝑡𝑜𝑡𝑎𝑙 𝑎𝑠𝑠𝑒𝑡𝑠 𝑖 ,𝑡
+ 𝛽3 𝐿𝑒𝑣𝑒𝑟𝑎𝑔𝑒 𝑖,𝑡 + 𝛽4 𝑅𝑂𝐴 𝑖,𝑡 + 𝛽5 𝐼𝑛𝑡𝑒𝑟𝑒𝑠𝑡 𝑐𝑜𝑣𝑒𝑟𝑎𝑔𝑒 𝑖 ,𝑡
+ 𝛽6 𝐼𝑛𝑐𝑜𝑚𝑒 𝑣𝑜𝑙𝑎𝑡𝑖𝑙𝑖𝑡𝑦 𝑖,𝑡 + 𝛽7 𝑃𝑟𝑜𝑏𝑎𝑏𝑖𝑙𝑖𝑡𝑦 𝑜𝑓 𝑑𝑒𝑓𝑎𝑢𝑙𝑡 𝑖 ,𝑡
+ 𝛽8 𝐵𝑜𝑜𝑘 𝑡𝑜 𝑚𝑎𝑟𝑘𝑒𝑡 𝑖,𝑡 + 𝛽9 𝑅𝑎𝑡𝑒𝑑 𝑖,𝑡 + 𝛽10 𝑇𝑒𝑟𝑚 𝑠𝑡𝑟𝑢𝑐𝑡𝑢𝑟𝑒 𝑖 ,𝑡
+ ∈𝑖 ,𝑡 (5)
Following Francis, LaFond, Olsson, and Schipper (2005), the dependent variable in the
regression is a measure of the aggregate amount of interest payments made by firms in a given
fiscal year. In section 4.8, we describe the robustness of our findings using the at-issue yield to
maturity for a sample of new debt issues as an alternative measure of the cost of debt. Following
prior research (e.g., Francis, et al., 2005), we include firm characteristics that are likely to affect
the firm‟s cost of debt. In addition, we control for the term structure of Treasury yields to
account for interest rate conditions in the market. These variables are defined in the Appendix.
Table 4 presents findings from the above regression specification. Based on hypothesis
H3, we expect the coefficient on Assumed rate of return to be positive. In Model 1 of Table 4,
23
We do not include the interest coverage ratio in this regression because interest coverage and firm profitability
(ROA) largely capture the same construct. We verify that the coefficient on the assumed rate of return is not
sensitive to the inclusion of interest coverage ratio. In addition, the coefficient on the assumed rate of return is
positive and significant even if ROA is replaced by interest coverage ratio in the regression. The results are also
similar to those reported when both ROA and interest coverage are excluded.

21
with only the fixed effects indicators included in the regression, the coefficient on Assumed rate
of return is 0.41 with a t-statistic of 6.44. In Model 2, controlling for other factors affecting the
cost of debt, the coefficient on Assumed rate of return is 0.35 with a t-statistic of 4.54, indicating
that the positive relation between the cost of debt and the assumed rate of return is highly
significant. The coefficient on the assumed rate of return in Model 3 (including income volatility
as an additional control variable) indicates that a one percent increase in the assumed rate of
return is associated with a 32 basis point increase in the cost of debt.
Given that the average cost of debt for the sample firms is 8.37 percent, a 32 basis point
increase in cost of debt represents a 3.82 percent increase at the mean. Moreover, comparing
Model 1 and Model 3, the goodness of fit in Model 1, with only the assumed rate of return as the
independent variable, is 0.77 percent whereas the corresponding number in Model 3 is 6.53,
suggesting that about 12 percent of the explanatory power in Model 3 is attributable to the
assumed rate of return.
The last two columns in Table 4 present results categorized by firm-years with
underfunded pension plans versus plans that are not underfunded. If pension plan returns reflect
the potential risk of future pension deficits, and hence, the possibility that future cash flow could
be channeled to cover such deficits, then the pension funding status should influence the relation
between assumed rate of return and the cost of debt. Consistent with this intuition, the results in
the last two columns indicate that the coefficient on the assumed rate of return is positive and
significant among firms with underfunded pension plans, but statistically insignificant among
firms whose plans are not underfunded. Thus, the statistically significant association between
the assumed rate of return and the cost of debt is driven primarily by the sub-sample of firms
where creditors are concerned about the funding status of the pension plans.

22
With the exception of leverage, the coefficients for control variables have the expected
signs and indicate that the cost of debt is declining in firm size, interest coverage and
profitability, and is lower for rated firms.24
Our findings imply that a one percent increase in the
assumed rate of return is associated with a 32 basis point increase in the cost of debt. In dollar
terms, a one percent increase in the assumed rate of return implies an increase of $6.78 million in
income (1 percent X mean pension assets of $677.65 million). In comparison, a 32 basis point
increase in the cost of debt translates into an increase of $12.70 million in debt payments.25
Thus, for every dollar increase in net income attributable to a percent increase in the assumed
rate of return, the firm incurs a $1.87 increase in debt payments ($12.70 million / $6.78 million).
These findings suggest that by reporting higher assumed rates of return, firms incur an
economically significant indirect cost in the form of a higher cost of debt.
4.4. Does the actual return on pension assets matter for the cost of debt?
Although the assumed rate of return reflects information about the firm‟s expectations of
the long-term rate of return on pension assets, and hence, the perceived level of risk associated
with pension assets (Amir and Benartzi, 1998; Bergstresser, Desai and Rauh, 2006), it does not
reflect the actual performance of pension assets. An alternative measure of pension plan returns
that is more representative of the true performance of the pension assets is the actual return on
24
The negative coefficient on leverage is due to a mechanical relation between the definitions of cost of debt
(interest cost divided by average total debt) and leverage (total debt divided by assets). The result is similar when
we use market leverage instead of book leverage. In addition, we find similar results if leverage is defined by
including pension liabilities and assets, as in Shivdasani and Stefanescu (2009). Moreover, the reported negative
relation between leverage and cost of debt is similar to that reported by Francis et al. (2005). However, excluding
leverage from the regression does not alter our conclusions. In addition, we show later in the analyses of new debt
issues, that the coefficient on leverage is positive and highly significant in regressions with at-issue yield to maturity
as the dependent variable. Thus, our conclusions are unaffected by the definition of cost of debt or leverage.
25
The average total debt (short-term plus long-term debt) for our sample is $3,969.55 million. Hence, a 32 basis
point increase in the cost of debt translates into additional debt payments of $12.70 million (0.32% X 3,969.55
million).

23
pension assets. In this section, we examine the relative importance of the assumed rate of return
and the actual return on pension assets for the firm‟s cost of debt.
4.4.1. Actual return on pension assets and the cost of debt: Hypotheses
The relation between the actual returns on pension assets and the firm‟s cost of debt is
ambiguous for several reasons. On the one hand, actual returns on pension assets affect pension
funding levels by either enhancing or eroding the value of pension assets. As such, actual returns
could influence the expected level of cash required for future contributions to the pension plan as
firms are required to make additional contributions depending on the extent to which the plans
are underfunded.26
Prior research suggests that creditors may incorporate pension accounting
footnote information into their assessments of the firm‟s credit worthiness (Martin and
Henderson, 1983; Maher, 1987; Carroll and Niehaus, 1998). In addition, Jin, Merton, and Bodie
(2006) find that equity risk (measured by the CAPM beta) reflects the risk of the firm‟s pension
plans, despite the practical difficulties of deciphering corporate pension accounts.
Furthermore, advocates of fair value accounting standards often argue that the actual
return on pension assets is less affected by earnings management, and hence, should be more
informative. For instance, prominent analysts, investors, and lawmakers have argued in favor of
the use of the actual return rather than the assumed rate of return in their push for greater
transparency in firms‟ pension disclosures (e.g., Loomis, 2001; UBS, 2003; Barlas, 2005;
PAAinE, 2008). These arguments suggest that all else equal, higher actual returns may be
relevant for bond investors and could be viewed favorably by bond market participants because
higher actual returns reduce the extent of pension plan underfunding; alternately, if higher actual
26
Goldman Sachs estimates that companies will be forced to boost their pension contributions to $40 billion in
2009, from about $18 billion in 2008 as a result of decimated stock prices during the recent credit crisis.

24
returns reflect the riskiness of pension plans, debt holders may view high actual returns
adversely.
On the other hand, advocates of SFAS 87 or IAS 19 (favoring the use of the assumed rate
of return) argue that the actual return on pension assets reflects transitory gains and losses, and
hence adds to the volatility of pension costs and the firm‟s reported earnings27
. Recent empirical
evidence suggests that fair value pension accounting (including the use of the actual return on
pension assets) impairs the relevance of financial statements to the market‟s assessment of firms‟
credit risk (Hann, Heflin, and Subramanyam, 2007). Furthermore, the evidence in some studies
suggests that market participants do not appear to incorporate pension accounting footnote
information into earnings forecasts and equity prices (e.g., Coronado and Sharpe, 2003; Picconi,
2006; Franzoni and Marin, 2006). Moreover, even if market participants pay attention to such
information, the actual return on pension assets may simply be less informative about the risk
and return of pension assets as it is subject to fluctuations in capital markets that are beyond the
control of the firm. Thus, the actual rate of return may be unrelated to the cost of debt.
Collectively, the above arguments suggest that the relation between the firm‟s cost of
debt and the actual return on pension assets is an empirical issue that can shed light on whether
investors in the bond market assign more weight to information that reflects actual pension plan
returns or to information that reflects expected long-term pension plan returns.
4.4.2. Actual return on pension assets and the cost of debt: Empirical results
The results of regressions explaining the cost of debt are presented in Table 5. The key
independent variables of interest are the lagged actual return (scaled by lagged pension assets)
27
SFAS 87 permits an additional smoothing mechanism by which the expected rate of return may be multiplied by
either the fair value of plan assets or by a „smoothed fair value‟, i.e. a moving average of the fair values of pension
assets.

25
and the assumed rate of return on pension assets. In Model 1 of Table 5, the results indicate a
positive and significant coefficient (t-statistic of 3.76) on Lagged actual return. Controlling for
other factors affecting the cost of debt, in Model 2 and Model 3, we find that while Assumed rate
of return has positive and significant coefficients, the coefficient on Lagged actual return is
insignificant in Model 2 and significant in Model 3.
Notably, we find a sharp contrast in the magnitude of the coefficients on the assumed rate
of return versus those on the actual return. For instance, in Models 2 and 3, the coefficients on
Assumed rate of return are 0.36, whereas the coefficients on Lagged actual return are 0.005 and
0.007 respectively.28
These coefficients on the actual return imply that every one percent higher
actual return reported by firms is associated with a 0.7 basis point increase in the cost of debt; in
comparison, in the same model (Model 3), the coefficient on the assumed rate of return implies
that the impact of one percent increase in the assumed rate on the cost of debt is 36 basis points.
The last two columns present the regression results for sub-samples categorized by the
funding status of pension plans. Consistent with the results for the full sample, the coefficient on
the assumed rate of return is positive and significant in the sub-sample of firms with underfunded
pension plans. In contrast, the coefficient on the actual return is insignificant for firms with
underfunded plans, but positive and significant for firms whose plans are not underfunded.
These findings suggest that the empirical relation between the firm‟s cost of debt and the
actual return appears to be weak, and importantly, the economic significance of this relation is
very small. Thus, our results do not support the hypothesis that the actual return on pension
assets affects the cost of debt. Rather, the findings are consistent with the evidence in Hann, et
28
If the lagged actual return is replaced with the contemporaneous actual return on pension assets, the coefficient on
actual return is statistically insignificant in all the models (Model 1, Model 2 and Model 3). However, the
coefficient on the assumed rate of return in Model 2 and Model 3, with the inclusion of the contemporaneous actual
return, continues to be statistically significant and is stable with values of 0.34 and 0.35 respectively.

26
al. (2007) that fair value pension accounting information (including actual return on pension
assets) impairs the relevance of financial statement information for credit markets.
These findings have implications for accounting standard setters contemplating the pros
and cons of having firms disclose a smoothed measure of pension plan performance versus a
measure that more closely represents the true economic value of pension assets. Our findings
suggest that the debt market appears to incorporate information in the smoothed measure of
pension plan performance rather than the actual return on pension assets.29
4.5. Change in variables specification
Given that the assumed rate of return is at the discretion of managers, it is arguably a
choice that is likely to be endogenously determined. In this section, following the suggestion in
Weber (2006), we attempt to address this concern by estimating the cost of debt regression using
a change in variables specification. Thus, we examine the following regression specification:
∆𝐶𝑜𝑠𝑡 𝑜𝑓 𝑑𝑒𝑏𝑡𝑖 ,𝑡 =
∝ + 𝛽1 ∆𝐴𝑠𝑠𝑢𝑚𝑒𝑑 𝑟𝑎𝑡𝑒 𝑜𝑓 𝑟𝑒𝑡𝑢𝑟𝑛 𝑖,𝑡 + 𝛽2 ∆𝐿𝑜𝑔 𝑡𝑜𝑡𝑎𝑙 𝑎𝑠𝑠𝑒𝑡𝑠 𝑖 ,𝑡
+ 𝛽3 ∆𝐿𝑒𝑣𝑒𝑟𝑎𝑔𝑒 𝑖 ,𝑡 + 𝛽4 ∆𝑅𝑂𝐴 𝑖,𝑡 + 𝛽5 ∆𝐼𝑛𝑡𝑒𝑟𝑒𝑠𝑡 𝑐𝑜𝑣𝑒𝑟𝑎𝑔𝑒 𝑖,𝑡
+ 𝛽6 ∆𝐼𝑛𝑐𝑜𝑚𝑒 𝑣𝑜𝑙𝑎𝑡𝑖𝑙𝑖𝑡𝑦 𝑖,𝑡 + 𝛽7 ∆𝑃𝑟𝑜𝑏𝑎𝑏𝑖𝑙𝑖𝑡𝑦 𝑜𝑓 𝑑𝑒𝑓𝑎𝑢𝑙𝑡 𝑖,𝑡
+ 𝛽8 ∆𝐵𝑜𝑜𝑘 𝑡𝑜 𝑚𝑎𝑟𝑘𝑒𝑡 𝑖 ,𝑡 + 𝛽9 ∆𝑅𝑎𝑡𝑒𝑑 𝑖,𝑡 + 𝛽10 ∆𝑇𝑒𝑟𝑚 𝑠𝑡𝑟𝑢𝑐𝑡𝑢𝑟𝑒 𝑖 ,𝑡
+ ∈𝑖 ,𝑡 (6)
29
As an additional robustness check, we define an indicator variable which takes the value of one if the lagged
actual return on pension assets is either in the lowest quartile or the highest quartile. The lowest quartile of actual
returns captures the risks of pension deficits arising from lower values of pension assets, whereas the highest
quartile of actual returns captures the riskiness of pension plan investments. As both these factors adversely affect
credit risk, we expect the coefficient on this indicator variable to be positive in a regression with cost of debt as the
dependent variable. However, we find that the coefficient of this indicator variable is statistically insignificant.

27
The variables used in the above regression are as defined in the Appendix, in first-
differenced form. The results, presented in Table 6, indicate that 𝛽1 is 0.19 with a t-statistic of
2.31. Furthermore, the results in the last two columns indicate that 𝛽1 is positive and significant
for firms with underfunded pension plans, but not for other firms. This finding is consistent with
the earlier results using variable levels. Overall, the results using the change specification
suggest that the relation between cost of debt and the assumed rate of return is robust with
respect to the potential endogeneity of the assumed rate of return.
4.6. Assumed rate of return and the cost of debt: Evidence on new debt issues
The above results are based on a pooled sample of observations where the cost of debt is
measured as the interest expense during the year (scaled by the average total debt during the
current year and the prior year). In this section, we examine the relation between the assumed
rate of return and the cost of debt using a sample of new debt issues. We obtain a sample of new
debt issues by publicly listed firms between 1990 and 2007 from the Securities Data Corporation
(SDC) database. This database contains data on the characteristics of the new issue, such as
maturity, issue size, offer yield to maturity, and other relevant information.
We exclude observations where the maturity date is incorrectly recorded as appearing
before the issue announcement date; if the contemporaneous yield on the Treasury security is
recorded as negative or the offer yield to maturity for the issuer is recorded as being less than the
corresponding maturity Treasury security; or if the issue proceeds information is missing or
recorded as zero. Furthermore, we retain only the largest issue by an issuer in a given year. We
merge this data with Compustat and retain observations with data available for the fiscal year
preceding the issue. Finally, we merge the data with our full sample of firms with defined

28
benefit pension plans because our objective is to examine the relation between the issuing firm‟s
offer yield to maturity and the assumed rate of return on its pension assets. The final sample of
new debt issues by firms with defined benefit pension plans comprises of 2,120 debt issues. The
sample size varies for the regressions, depending on the availability of data on the issuers.
Following prior studies, we measure the cost of debt as the yield to maturity offered by
the issuing firm at the announcement of the new debt issue (see, e.g., Sengupta, 1998; Shi, 2003;
Jiang, 2008).30
While the cost of debt measured using interest expense (as is the case above, for
the full sample and for the S&P sample) is a proxy for the aggregate amount of debt payments
during the year (assuming that debt repayments and issuance offset each other during the year),
the yield to maturity for new debt issues represents the incremental cost of debt required by
investors for the marginal amount borrowed by the firm. Thus, in any given year, the yield to
maturity captures the actual rate of return required by creditors at the time of issuance.
Following prior research (e.g., Khurana and Raman, 2003; Klock, Mansi, and Maxwell,
2005; Ortiz-Molina, 2006), the regression specification includes variables that control for both
firm characteristics as well as issue characteristics. The firm characteristics, including the
assumed rate of return, are measured as of the fiscal year-end immediately preceding the debt
issue announcement. As the dependent and independent variables can persist over time for a
given firm, and because variables such as the cost of debt could be correlated across firms in a
given year, we include firm and year fixed effects to account for the correlations among these
variables. The regression model is as follows:
30
While our regression specification controls for the corresponding maturity Treasury yield at the announcement,
we verify the robustness of our inferences using the yield spread (difference between the offer yield and the
Treasury yield) at the announcement as an alternative measure of the cost of debt. Prior studies that use the yield
spread as a measure of cost of debt include Bhojraj and Sengupta (2003), Khurana and Raman (2003), Anderson,
Mansi, and Reeb (2004), Klock, Mansi, and Maxwell (2005), and Ortiz-Molina (2006), among others. The
regression with yield spread as the dependent variable indicates that the coefficient of assumed rate of return is
positive (0.23) and highly significant (t-statistic of 4.06) in a specification with other control variables as in Model 3
of Table 7.

29
𝑂𝑓𝑓𝑒𝑟 𝑦𝑖𝑒𝑙𝑑 𝑡𝑜 𝑚𝑎𝑡𝑢𝑟𝑖𝑡𝑦𝑖 =
∝ + 𝛽1 𝐴𝑠𝑠𝑢𝑚𝑒𝑑 𝑟𝑎𝑡𝑒 𝑜𝑓 𝑟𝑒𝑡𝑢𝑟𝑛 𝑖 + 𝛽2 𝑇𝑟𝑒𝑎𝑠𝑢𝑟𝑦 𝑌𝑇𝑀 𝑖
+ 𝛽3 𝐿𝑜𝑔 𝑡𝑜𝑡𝑎𝑙 𝑎𝑠𝑠𝑒𝑡𝑠 𝑖 + 𝛽4 𝐿𝑒𝑣𝑒𝑟𝑎𝑔𝑒 𝑖 + 𝛽5 𝑅𝑂𝐴 𝑖
+ 𝛽6 𝐼𝑛𝑣𝑒𝑠𝑡𝑚𝑒𝑛𝑡 𝑔𝑟𝑎𝑑𝑒 𝑖 + 𝛽7 𝐵𝑜𝑜𝑘 𝑡𝑜 𝑚𝑎𝑟𝑘𝑒𝑡 𝑖
+ 𝛽8 𝐶𝑎𝑙𝑙 𝑝𝑟𝑜𝑡𝑒𝑐𝑡𝑖𝑜𝑛 𝑦𝑒𝑎𝑟𝑠 𝑖 + 𝛽9 𝑀𝑎𝑡𝑢𝑟𝑖𝑡𝑦 𝑖 + 𝛽10 𝐼𝑠𝑠𝑢𝑒 𝑠𝑖𝑧𝑒 𝑖
+ 𝛽11 𝑆𝑢𝑏𝑜𝑟𝑑𝑖𝑛𝑎𝑡𝑒𝑑 𝑖 + 𝛽12 𝐷𝑖𝑠𝑡𝑎𝑛𝑐𝑒 𝑡𝑜 𝑑𝑒𝑓𝑎𝑢𝑙𝑡 𝑖 + 𝛽13 𝐵𝑒𝑡𝑎 𝑖
+ 𝛽14 𝐼𝑛𝑡𝑒𝑟𝑒𝑠𝑡 𝑐𝑜𝑣𝑒𝑟𝑎𝑔𝑒 𝑖 + 𝛽15 𝐼𝑛𝑐𝑜𝑚𝑒 𝑣𝑜𝑙𝑎𝑡𝑖𝑙𝑖𝑡𝑦 𝑖 + ∈𝑖 (7)
Findings from the above regression are presented in Table 7. In model 1, 𝛽1 is 0.45 with
a t-statistic of 5.64. In Model 2 of Table7, without including interest coverage and income
volatility, the value of 𝛽1 is 0.13 with a t-statistic of 3.40. In Model 3, including all control
variables, the value of 𝛽1 is 0.28, which is similar to the coefficient of 0.32 for Assumed rate of
return in Table 4 for the full sample. This result indicates that investors in the bond market
require a 28 basis point yield premium for every one percent higher assumed rate of return
reported by the issuing firms. This incremental impact of the assumed rate of return on the offer
yield to maturity represents about 4 percent of the average yield to maturity (6.80 percent)
offered by the issuing firms in the sample.
The results in the last two columns indicate that investors require a premium from issuers
for the higher assumed rate of return on pension assets, regardless of the funding status of their
pension plans. The coefficients on the assumed rate of return in these sub-samples are fairly
similar to each other. Overall, the results from the new debt issues sample are consistent with
those obtained using the full pooled sample of observations, suggesting that the relation between
the assumed rate of return and the firm‟s cost of debt is robust with respect to the specification
used to examine the hypothesis.

30
4.7. Robustness: Controlling for corporate governance and earnings management
Prior research suggests that firms with poor quality earnings are associated with a higher
cost of debt (e.g., Ashbaugh-Skaife, Collins, and LaFond, 2006; Francis, LaFond, Olsson, and
Schipper, 2005). Likewise, studies also find that firms with weak governance are associated
with higher debt financing costs (e.g., Sengupta, 1998; Bhojraj and Sengupta, 2003; Anderson,
Mansi, and Reeb, 2004; Ashbaugh-Skaife, Collins, and LaFond, 2006). In the context of our
study, if firms with weak governance and poor quality accruals are associated with higher
assumed rates of return (as shown by Bergstresser, Desai, and Rauh, 2006), the relation between
assumed rates of return and the firm‟s cost of debt may be spuriously driven by the exclusion of
these potentially correlated variables.
Thus, we examine the robustness of the relation between cost of debt and the assumed
rate of return by including variables representing governance characteristics. In particular, we
include key board characteristics such as board size, CEO duality, proportion of independent
board members, and the equity holdings of officers and directors in the company. The regression
specification is as follows.
𝐶𝑜𝑠𝑡 𝑜𝑓 𝑑𝑒𝑏𝑡𝑖,𝑡 =
∝ + 𝛽1 𝐴𝑠𝑠𝑢𝑚𝑒𝑑 𝑟𝑎𝑡𝑒 𝑜𝑓 𝑟𝑒𝑡𝑢𝑟𝑛 𝑖 ,𝑡 + 𝛽2 𝐿𝑎𝑔𝑔𝑒𝑑 𝑎𝑐𝑡𝑢𝑎𝑙 𝑟𝑒𝑡𝑢𝑟𝑛 𝑖,𝑡
+ 𝛽3 𝐿𝑜𝑔 𝑡𝑜𝑡𝑎𝑙 𝑎𝑠𝑠𝑒𝑡𝑠 𝑖 ,𝑡 + 𝛽4 𝐿𝑒𝑣𝑒𝑟𝑎𝑔𝑒 𝑖,𝑡 + 𝛽5 𝑅𝑂𝐴 𝑖,𝑡
+ 𝛽6 𝐼𝑛𝑡𝑒𝑟𝑒𝑠𝑡 𝑐𝑜𝑣𝑒𝑟𝑎𝑔𝑒 𝑖,𝑡 + 𝛽7 𝐼𝑛𝑐𝑜𝑚𝑒 𝑣𝑜𝑙𝑎𝑡𝑖𝑙𝑖𝑡𝑦 𝑖 ,𝑡 + 𝛽8 𝑅𝑎𝑡𝑒𝑑 𝑖,𝑡
+ 𝛽9 𝑇𝑒𝑟𝑚 𝑠𝑡𝑟𝑢𝑐𝑡𝑢𝑟𝑒 𝑖 ,𝑡 + 𝛽10 𝐴𝑐𝑐𝑜𝑢𝑛𝑡𝑖𝑛𝑔 𝑞𝑢𝑎𝑙𝑖𝑡𝑦 𝑖,𝑡
+ 𝛽11 𝐿𝑜𝑔 𝑏𝑜𝑎𝑟𝑑 𝑠𝑖𝑧𝑒 𝑖 ,𝑡 + 𝛽12 𝑃𝑟𝑜𝑝𝑜𝑟𝑡𝑖𝑜𝑛 𝑖𝑛𝑑𝑒𝑝𝑒𝑛𝑑𝑒𝑛𝑡 𝑖 ,𝑡
+ 𝛽13 𝐷𝑖𝑟 𝑎𝑛𝑑 𝑂𝑓𝑓 𝑜𝑙𝑑𝑖𝑛𝑔𝑠 𝑖 ,𝑡 + 𝛽14 𝐶𝐸𝑂 𝑛𝑜𝑡 𝐶𝑂𝐵 𝑖,𝑡 + ∈𝑖 ,𝑡 (8)

31
We measure Accounting quality as the standard deviation of unexpected accruals, as in
Francis, et al., 2005.31
The inclusion of board characteristics reduces the sample size
substantially. The results, presented in Table 8, indicate that the value of 𝛽1 is positive and
significant in all three models. Moreover, the coefficient on the actual return on pension assets is
statistically insignificant. Among the governance related control variables, the variable
representing CEO duality (equals one if the CEO is not also the chairman of the board) is
significant, indicating that firms with separate CEOs and board chairmen are associated with
lower debt financing costs.
Although the coefficient of Accounting quality is positive, it is statistically insignificant
in Table 8. However, as discussed below, we include this variable in alternate specifications and
find that its coefficient is positive and highly significant, consistent with the findings in Francis,
et al. (2005).32
Overall, the results in this section suggest that the relation between assumed rate
of return on pension assets and the firm‟s cost of debt is robust with respect to the inclusion of
corporate governance and earnings quality variables.
31
We follow the regression approach outlined in Francis, et al. (2005, equation (1)) to construct a measure of
accruals quality. This measure of accruals quality builds on the approach in Dechow and Dichev (2002) as modified
by McNichols (2002). Specifically, in the first step, for each year, using all firms in a given 2-digit SIC code
industry, the dependent variable in the regression is total current accruals, and the independent variables are the one-
year lagged, contemporaneous and the next year‟s cash flow from operations, the change in revenues, and the gross
value of property, plant, and equipment. Thus, we obtain firm-year residuals of total current accruals. In the next
step, for each firm in each year t, we compute the standard deviation of the firm-year residuals for the years t-4
through t and use this estimate as the measure of accounting quality. Thus, larger standard deviations of residuals
are indicators of poorer accruals quality.
32
In our sample, the mean value of Accounting quality is 0.0389, which is slightly lower than the overall average for
Compustat firms, mainly because our sample of firms with defined benefit pension plans are larger than the average
firm in Compustat, as shown in Panel B and Panel C of Table 1. The lower value for Accounting quality in our
sample reflects the inverse relation between firm size and earnings quality reported in the literature (e.g., Francis, et
al., 2005).

32
4.8. Robustness: Alternative regression specifications
The results reported above are based on pooled regressions. To the extent that the
dependent and independent variables in this study (e.g., cost of debt and assumed rate of return)
persist over time for a given firm, Petersen (2009) recommends the firm fixed effects approach to
account for the correlation between observations on the same firm in different years. However,
if the correlations exist across observations on different firms in the same year, Petersen (2009)
suggests that the Fama and Macbeth (1973) approach is better suited to minimize the bias in the
estimates and in the significance levels.
In this section, we examine the relation between the cost of debt and the assumed rate of
return using two alternative specifications: (1) a cross-sectional regression specification; and (2)
a Fama-Macbeth regression specification. The cross-sectional specification involves the use of
firm-specific time-series means, and thereby captures differences across firms. The Fama-
Macbeth regression entails the estimation of regression coefficients each year (from 1991 to
2006 in our sample) and then averaging the coefficients. The standard deviation of the yearly
coefficients is used to determine the significance level.
In Table 9, the results indicate that the coefficient of the assumed rate of return is positive
and highly significant in all three models presented. As income volatility is measured using a
minimum of five years of data, the number of observations is lower when this variable is
included in the regression. The control variables are largely consistent with expectations. In
particular, we find that the coefficient of Accounting quality is positive and significant in all
three models. Overall, the results in this section affirm our earlier findings and suggest that the
positive relation between the cost of debt and the assumed rate of return on pension assets is
robust with respect to the regression specification used to examine the relation.

33
5. Conclusions
Assets held in defined benefit pension plans are the single largest off-balance sheet item
at U.S. corporations, amounting to approximately 14 percent of the firm‟s assets on average. In
this paper we use a comprehensive sample of firms with defined benefit pension plans to
examine the extent to which debt investors see through the accounting veil, such that a firm‟s
cost of debt reflects the risk exposure of its pension assets.
Our findings indicate a positive relation between the assumed rate of return on pension
assets and the firm‟s cost of debt. This finding is robust across different specifications, is both
statistically and economically significant, and is stronger for firms with underfunded pension
plans. We find that a one percent increase in the assumed rate of return is associated with a 32
basis point increase in the firm‟s cost of debt. In contrast, the relation between actual return and
the cost of debt is weak and is not economically significant, confirming that debt holders do not
regard year to year volatility in actual returns from pension asset investments to be informative
about the longer-term prospects of the firm.
We also find positive and statistically significant relations between the assumed rate of
return and (i) the uncertainty of expected cash flows and (ii) the level of a firm‟s default risk.
Debt holders appear to understand that higher assumed returns on pension assets are likely to
reflect higher portfolio risk, with associated negative implications for the likelihood that pension
shortfalls would divert operating cash flows away from the firm‟s creditors. These results are
supportive of the informational efficiency of the market for corporate debt, and suggest that
using an assumed rate of return to determine pension returns and costs (SFAS 87) does not
mislead corporate debt holders.

34
Our findings highlight an economic consequence of off-balance-sheet activities. It has
been documented in the literature (Bergstresser, Desai, and Rauh, 2006) that firms use discretion
over the assumed rate of return on pension assets to opportunistically manage earnings,
particularly in time periods preceding acquisitions and when they are close to critical earnings
thresholds. We find that this form of opportunism comes at a significant cost, in that a one dollar
increase in reported income resulting from a higher assumed rate of return on pension assets
results in a $1.87 increase in debt payments.

35
Appendix
Variable definitions
Accounting quality standard deviation of accruals; defined in more detail in Section 4.7.
Assumed rate of return (%) data336
Beta slope estimate in the regression of daily stock return on the daily
CRSP value-weighted index return during the 240 days ending on
the fiscal year-end date.
Book to market data60/(data199*data54)
Book to market (data60/data199*data54)
Call protection years number of years of call protection / number of years to maturity
CEO not COB equals 1 if CEO is not the board chairman; and 0 otherwise. (as
reported by IRRC)
Cost of debt (%) data15/average total debt, where total debt = data9 + data34, and
average total debt is the average of total debt in the current year and
the prior year.
Dir and Off holdings percentage of shares owned by the officers and directors of the
company (as reported by IRRC)
Distance to default, 𝐷𝐷𝑡 computed as in equation (3); where, 𝑉𝑎 ,𝑡 equals
(data199*data54)+data6-data60; 𝑋𝑡 equals [data34 + (0.5*data9)];
𝜇 equals stock return during the 240 days ending on the fiscal year-
end date; 𝜎𝑎2 is the daily stock return variance, annualized using 240
days ending on the fiscal year-end date; T equals 5 years;
Income volatility (%) (standard deviation of data18 / average of data6) during years -9,0,
where year 0 is a given fiscal year. We require a minimum of 5
observations to compute income volatility.
Interest coverage data13/data15
Investment grade equals 1 if data280 is less than or equal to 9;
equals 0 if data 280 is greater than 9.
Issue size natural logarithm of issue proceeds
Lagged actual return actual return on pension assets in year t-1.
Leverage (%) (data9+data34)/data6
Log board size natural logarithm of board size (as reported by IRRC)
Log total assets natural logarithm of total assets
Maturity number of years to maturity
Offer yield to maturity yield to maturity on the new debt issue at the time of issuance, as
reported by SDC
Pension assets ($millions) prior to and including fiscal year 1997: Equals data 296 if data 287 is
missing; equals data287 if data296 is missing.
after and excluding fiscal year 1997: equals data287.
Probability of default computed as in equation (4): 𝜑 −𝐷𝐷𝑡 , where 𝜑() is the cumulative
normal distribution function.
Proportion independent number of board members classified as independent divided by
board size, (as reported by IRRC).

36
Appendix (continued)
Rated equals 1 if data280 is not missing; otherwise equals 0.
Relative pension asset size (%) equals Pension assets / data6.
ROA (%) data172/data6
Standard deviation of returns standard deviation of daily stock returns during the period (-240,0),
where day 0 represents the fiscal year-end date.
Subordinated equals 1 if the new debt issue is subordinated; 0 otherwise.
Term structure (%) 10-year Treasury yield minus 6-month Treasury yield, both
measured at fiscal year-end.
Total assets ($millions) data 6
Treasury YTM yield to maturity on a Treasury security having the same maturity as
the new debt issue at the time of issuance, as reported by SDC
Underfunded A pension plan is defined as underfunded if Pension assets is less
than Projected benefit obligation; Projected benefit obligation equals
(data286+data294) for fiscal years prior to and including 1997; and
equals data286 after and excluding fiscal year 1997.

37
References
Amir, Eli, and Shlomo Benartzi, 1998, The Expected Rate of Return on Pension Funds and Asset
Allocation as Predictors of Portfolio Performance, The Accounting Review 73, 335-352.
Anderson, Ron C., Sattar A. Mansi, and David M. Reeb, 2004, Board characteristics, accounting
report integrity, and the cost of debt, Journal of Accounting and Economics 37, 315-342.
Ashbaugh-Skaife, Hollis, Daniel W. Collins, and Ryan LaFond, 2006, The effects of corporate
governance on firms‟ credit ratings, Journal of Accounting and Economics 42, 203–243.
Barlas, S., 2005, Grassley wants pension accounting changes. Strategic Finance 87, 20-61.
Barth, Mary E. 1991, Relative measurement errors among alternative pension asset and liability
measures, The Accounting Review 66, 433-463.
Barth, Mary E., William Beaver, and Wayne Landsman, 1992, The market valuation
implications of net periodic pension cost components, Journal of Accounting and Economics 15,
27-62.
Bergstresser, Daniel, Mihir Desai, and Joshua Rauh, 2006, Earnings manipulation, pension
assumptions and managerial investment decisions, Quarterly Journal of Economics 121, 157-
195.
Bessembinder, Hendrik, and William Maxwell, 2008, Transparency and corporate bond market.
Journal of Economic Perspectives 22, 217-234.
Bharath, Sreedhar, and Tyler Shumway, 2008, Forecasting Default with the Merton Distance-to-
Default Model, Review of Financial Studies 21, 1339-1369.
Biais, Bruno R., and Richard C. Green, 2007, The Microstructure of the Bond Market in the 20th
Century, Working Paper, Carnegie Mellon University.
Bhojraj, Sanjeev, and Partha Sengupta, 2003, Effect of corporate governance on bond ratings and
yields: the role of institutional investors and the outside directors, Journal of Business 76, 455–
475.
Boehmer, Ekkehart, and Eric K. Kelley, 2009, Institutional Investors and the Informational
Efficiency of Prices, Review of Financial Studies 22, 3563-3594.
Brick, Ivan E., and Lawrence Fisher, 1987, Effects of classifying equity or debt on the value of
the firm under tax asymmetry, Journal of Financial and Quantitative Analysis 22, 383-399.
Brown, S., 2004, The impact of pension assumptions on firm value, Working paper, University
of Maryland.

38
Carrol, Thomas J., and Greg Niehaus, 1998, Pension Plan Funding and Corporate Debt Ratings,
The Journal of Risk and Insurance 65, 427-443.
CFO Publishing, 2007, Pension Plan Risk: Using the calm before the next storm, March,
http://www.towersperrin.com/tp/getwebcachedoc?webc=HRS/USA/2007/200703/CFO_pension
_risk_survey_report_final.pdf
Collin-Dufresne, Pierre, and Robert Goldstein, 2001, Do Credit Spreads Reflect Stationary
Leverage Ratios? Journal of Finance 56, 1929-1957.
Coronado, Julia L., and Steven A. Sharpe, 2003, Did pension accounting contribute to a stock
market bubble? Brookings papers on economic activity No. 1.
Crosbie, Peter J., 1999, Modeling Default Risk (KMVLLC), http://www.defaultrisk.com/ pp
model 35.htm
Damodaran, Aswath, 2002, Investment valuation: Tools and techniques for determining the
value of any asset, John Wiley& Sons, Inc.
Das, Sanjiv R., and Paul Hanouna, 2009, Hedging credit: Equity liquidity matters, Journal of
Financial Intermediation 18, 112-123.
Dechow, P. and I. Dichev, 2002. The quality of accruals and earnings: The role of accrual
estimation errors, The Accounting Review, 77, 35-59.
Duffie, Darrell, and Kenneth J. Singleton, 2003, Credit Risk: Pricing, Measurement, and
Management, Princeton University Press, Princeton, NJ.
Edwards, Amy K., Lawrence E. Harris, and Michael S. Piwowar, 2007, Corporate Bond Market
Transparency and Transaction Costs, Journal of Finance 62, 1421-1451.
Economist, 2004, Pension Accounting: Murk in the Gloom, October 30, 77-78.
Fama, Eugene, and J. MacBeth, 1973, Risk, return and equilibrium: Empirical tests, Journal of
Political Economy 81, 607-636.
Fama Eugene, and Merton Miller, 1972, The Theory of Finance, New York 1972.
Financial Accounting Standards Board, 2006, Statement of Financial Accounting Standards No.
158, Employers‟ Accounting for Defined Benefit Pension and Other Postretirement Plans.
September.
Francis, J. R., R. LaFond, P. Olsson and K. Schipper, 2005, The market pricing of earnings
quality, Journal of Accounting and Economics 39, 295–327.

39
Franzoni, Francesco, 2009, Underinvestment Vs. Overinvestment: Evidence From Price
Reactions To Pension Contributions, Journal of Financial Economics 92, 491-518.
Franzoni, Francesco, and Jose M. Marin, 2006, Pension Plan Funding and Stock Market
Efficiency, Journal of Finance 61, 921-956.
Graves, Tom, 2009, Corporate America Faces Pension Shortfalls, Standard & Poor‟s, The
Outlook, April 22, Volume 81.
Hann, Rebecca N., Frank Heflin, and K.R. Subramanayam, 2007, Fair-value pension accounting,
Journal of Accounting and Economics 44, 328–358.
International Accounting Standards Board, 2004, International Accounting Standard 19:
Employee benefits.
Jensen, Michael C., and William H. Meckling, 1976, Theory of the firm: Managerial behavior,
agency costs and ownership structure, Journal of Financial Economics 3, 305–360.
Jiang, John X., 2008, Beating Earnings Benchmarks and the Cost of Debt, The Accounting
Review 83, 377-416.
Jin Li, Robert Merton, and Zvi Bodie, 2006, Do a firm‟s equity returns reflect the risk of its
pension plan? Journal of Financial Economics 81, 1–26.
Katz, David M., 2009, Pension vice tightens on cash, CFO.com, January 7.
Kedia, Simi, and Thomas Philippon, 2009, The Economics of Fraudulent Accounting, Review of
Financial Studies 22, 2169-2199.
Khurana, Inder, and K. K. Raman, 2003, Are Fundamentals Priced in the Bond Market?,
Contemporary Accounting Research 20, 465-494.
Klock, Mark S., Sattar A. Mansi, and William F. Maxwell, 2005, Does corporate governance
matter to bondholders?, Journal of Financial and Quantitative Analysis 40, 693-719.
Kwan, Simon, 2003, Underfunding of Private Pension Plans, Federal Reserve Bank of San
Francisco, Economic Letter 16.
Loomis, Carol, 2001, Warren Buffett on the stock market,
http://money.cnn.com/magazines/fortune/fortune_archive/2001/12/10/314691/, Dec 10.
Malitz, Ileen, 1994, The Modern Role of Bond Covenants, (The Research Foundation of the
Institute of Chartered Financial Analysts).
Maher, John, 1987, Pension Obligations and the Bond Credit Market: An Empirical Analysis of
Accounting Numbers, The Accounting Review 62, 785-798.

40
Martin, Linda, and Glenn Henderson, 1983, On Bond Ratings and Pension Obligations: A Note.
Journal of Financial and Quantitative Analysis 18, 463-470.
McNichols, M. F., 2002, Discussion of the Quality of Accruals and Earnings: The Role of
Accrual Estimation Errors, The Accounting Review 77, 61-69.
Merton, Robert C., 1974, On the Pricing of Corporate Debt: The Risk Structure of Interest Rates,
Journal of Finance 29, 449-470.
Minton, Bernadette A., and Catherine Schrand, 1999, The impact of cash flow volatility on
discretionary investment and the costs of debt and equity financing, Journal of Financial
Economics, 54, 423-460.
Molina, Carlos A., 2005, Are firms underleveraged? An examination of the effect of leverage on
default probabilities, Journal of Finance 60, 1427-1459.
Muller, Joann, 2003, GM Erases Its Pension Fund Gap, Forbes.com,
http://www.forbes.com/2003/12/13/cz_jm_1213gm.html
Ortiz-Molina, Hernan, 2006, Top-management incentives and the pricing of corporate public
debt, Journal of Financial and Quantitative Analysis 41, 317-340.
PAAinE, 2008, Pro-active accounting activities in Europe. The financial reporting of pensions:
A PAAinE discussion paper, January, Brussels.
Pennacchi, George G. and Craig M. Lewis, 1994, The Value of Pension Benefit Guaranty
Corporation Insurance, Journal of Money, Credit and Banking 26, 735-753.
Petersen, Mitchell A., 1994, Cash flow variability and firm‟s pension choice: A role for
operating leverage, Journal of Financial Economics 36, 361- 383.
Petersen, Mitchell A., 2009, Estimating Standard Errors in Finance Panel Data Sets: Comparing
Approaches, Review of Financial Studies 22, 435-480.
Picconi, M. 2006, The perils of pensions: Does pension accounting lead investors and analysts
astray? The Accounting Review 81, 925-955.
Rauh, Joshua, 2006, Investment and Financing Constraints: Evidence from the Funding of
Corporate Pension Plans, Journal of Finance 61, 33-71.
Rauh, Joshua, 2009, Risk Shifting versus Risk Management: Investment Policy in Corporate
Pension Plans, Review of Financial Studies 22, 2687-2734.

41
Richard, Christine, 2006, Pension deficit, now $500 Billion, may clobber corporate bonds,
Bloomberg.com,
http://www.bloomberg.com/apps/news?pid=10000103&refer=us&sid=a8gDLCneeLM8
Ryan, Ronald J., and Frank J. Fabozzi, 2002, Rethinking Pension Liabilities and Asset
Allocation, Journal of Portfolio Management 28, 7-15.
Sengupta, Partha, 1998, Corporate disclosure quality and the cost of debt, The Accounting
Review 73, 459–474.
Sharpe, William F., 1976, Corporate Pension Funding Policy, Journal of Financial Economics 3,
183-193.
Shi, C., 2003, On the trade-off between the future benefits and riskiness of R&D: A bondholders'
Perspective, Journal of Accounting and Economics 35, 227-254.
Shivdasani, Anil, and Irina Stefanescu, 2009, How Do Pensions Affect Corporate Capital
Structure Decisions? Review of Financial Studies, Forthcoming.
Smith, Clifford, and Jerold Warner, 1979, On Financial contracting: An Analysis of Bond
Covenants, Journal of Financial Economics 7, 117- 161.
Treynor, J., 1977, The Principles of Corporate Pension Finance, Journal of Finance 32, 627-638.
UBS Investment Research, 2003, Pension fund asset allocation, September.
Vassalou Maria, and Yuhang Xing, 2004, Default risk in equity returns, Journal of Finance 59,
831-868.
Wall Street Journal, Dec 29, 2005, GM Faces a new threat to its books: Shareholder equity
stands to vanish if pensions become a liability via proposed rule.
Weber, Joseph, 2006, Discussion of the effects of corporate governance on firms‟ credit ratings,
Journal of Accounting and Economics 42, 245–254.
White, Gregory L., 2002, GM Profit Grows, but Pension Costs Worry Investors, The Wall Street
Journal, July 17, 2002.

42
Figure 1: Relation between cost of debt and assumed rate of return on pension assets
The above graph presents the average cost of debt for each quartile of assumed rate of return.
7.8
8
8.2
8.4
8.6
8.8
9
1 2 3 4
Cost of
debt (%)
Assumed rate of return quartile

43
Table 1
Sample Distribution by Year and Descriptive Statistics
The full sample comprises of 30,077 firm-years for firms having defined benefit pension plans
and data available on Compustat from 1991 to 2006. These firms have non-zero debt levels with
non-missing data on total assets. Panels B (and C) present descriptive statistics on key
characteristics of firms that are (are not) in our full sample, respectively. The latter do not have
defined benefit pension plans, and for comparability with our sample firms, we require that they
have non-zero debt levels. All variables are defined in the Appendix.
Panel A: Distribution of sample by year
Year Number of observations Percentage of sample
1991 1801 5.99
1992 1867 6.21
1993 1882 6.26
1994 1890 6.28
1995 1848 6.14
1996 1832 6.09
1997 1762 5.86
1998 1721 5.72
1999 1731 5.76
2000 1910 6.35
2001 1917 6.37
2002 2105 7.00
2003 2067 6.87
2004 2043 6.79
2005 2002 6.66
2006 1699 5.65
Total 30,077 100.00

44
Table 1 (continued)
Panel B: Descriptive statistics for the full sample
Full
sample
Under-
funded
Not
underfunded
Variable N Mean Median Std dev Mean Mean
Cost of debt (%) 27,023 8.37 7.60 4.90 8.36 8.39
Assumed rate of return (%) 30,077 8.44 8.50 1.19 8.29 8.70
Pension assets ($millions) 29,349 677.65 75.95 1874.75 573.15 853.52
Relative pension asset size (%) 29,349 14.18 7.56 64.27 12.14 17.60
Underfunded 29,224 0.63 N/A N/A
Total assets ($millions) 30,077 12317.78 1274.31 66,856.98 11,615.83 13,776.59
Leverage (%) 29,987 30.82 28.64 21.03 31.08 30.31
ROA (%) 30,061 2.37 2.91 8.26 1.99 2.92
Interest coverage 26,692 13.00 5.22 32.27 13.51 12.26
Income volatility (%) 15,744 4.04 2.63 4.76 4.47 3.35
Rated 30,077 0.51 0.50 0.52
Standard deviation of returns 22,096 2.51 2.10 1.53 2.59 2.36
Book to market 25,193 0.58 0.55 0.84 0.55 0.62
Beta 22,101 0.71 0.65 0.52 0.77 0.60
Distance to default 21,880 4.45 4.19 3.74 4.33 4.68
Probability of default 21,880 0.1095 0.0000 0.2540 0.1152 0.0985
Term structure (%) 30,077 1.46 1.31 1.33 1.57 1.29
Panel C: Key characteristics of firms without defined benefit pension plans
Variable N Mean Median Std dev
Cost of debt (%) 100,210 11.85 8.12 16.62
Total assets ($millions) 116,442 1,639.96 119.20 7714.00
Leverage (%) 115,541 34.49 24.24 43.64
ROA (%) 115,461 -4.00 1.50 20.22
Interest coverage 97,127 3.16 3.50 70.07
Income volatility (%) 61,333 14.51 5.96 24.07
Rated 116,442 0.13
Book to market 90,271 0.49 0.50 1.40
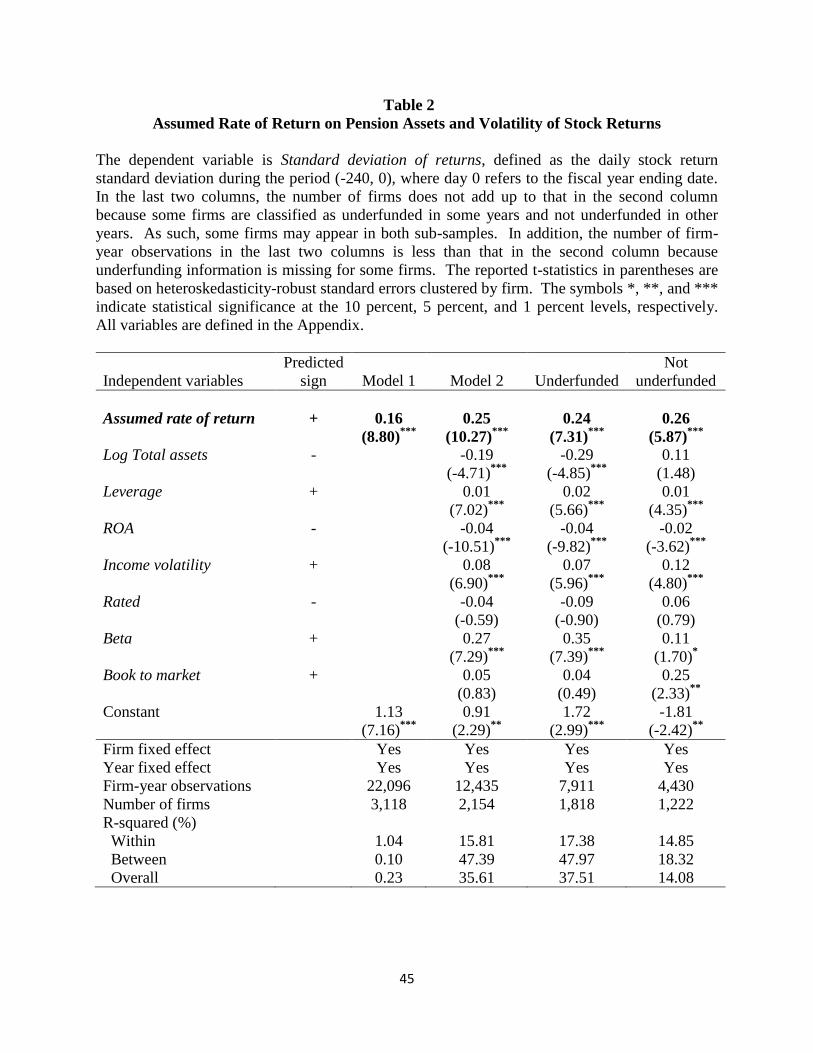
45
Table 2
Assumed Rate of Return on Pension Assets and Volatility of Stock Returns
The dependent variable is Standard deviation of returns, defined as the daily stock return
standard deviation during the period (-240, 0), where day 0 refers to the fiscal year ending date.
In the last two columns, the number of firms does not add up to that in the second column
because some firms are classified as underfunded in some years and not underfunded in other
years. As such, some firms may appear in both sub-samples. In addition, the number of firm-
year observations in the last two columns is less than that in the second column because
underfunding information is missing for some firms. The reported t-statistics in parentheses are
based on heteroskedasticity-robust standard errors clustered by firm. The symbols *, **, and ***
indicate statistical significance at the 10 percent, 5 percent, and 1 percent levels, respectively.
All variables are defined in the Appendix.
Independent variables
Predicted
sign
Model 1
Model 2
Underfunded
Not
underfunded
Assumed rate of return + 0.16
(8.80)***
0.25
(10.27)***
0.24
(7.31)***
0.26
(5.87)***
Log Total assets - -0.19
(-4.71)***
-0.29
(-4.85)***
0.11
(1.48)
Leverage + 0.01
(7.02)***
0.02
(5.66)***
0.01
(4.35)***
ROA - -0.04
(-10.51)***
-0.04
(-9.82)***
-0.02
(-3.62)***
Income volatility + 0.08
(6.90)***
0.07
(5.96)***
0.12
(4.80)***
Rated - -0.04
(-0.59)
-0.09
(-0.90)
0.06
(0.79)
Beta + 0.27
(7.29)***
0.35
(7.39)***
0.11
(1.70)*
Book to market + 0.05
(0.83)
0.04
(0.49)
0.25
(2.33)**
Constant 1.13
(7.16)***
0.91
(2.29)**
1.72
(2.99)***
-1.81
(-2.42)**
Firm fixed effect Yes Yes Yes Yes
Year fixed effect Yes Yes Yes Yes
Firm-year observations 22,096 12,435 7,911 4,430
Number of firms 3,118 2,154 1,818 1,222
R-squared (%)
Within
Between
Overall
1.04
0.10
0.23
15.81
47.39
35.61
17.38
47.97
37.51
14.85
18.32
14.08
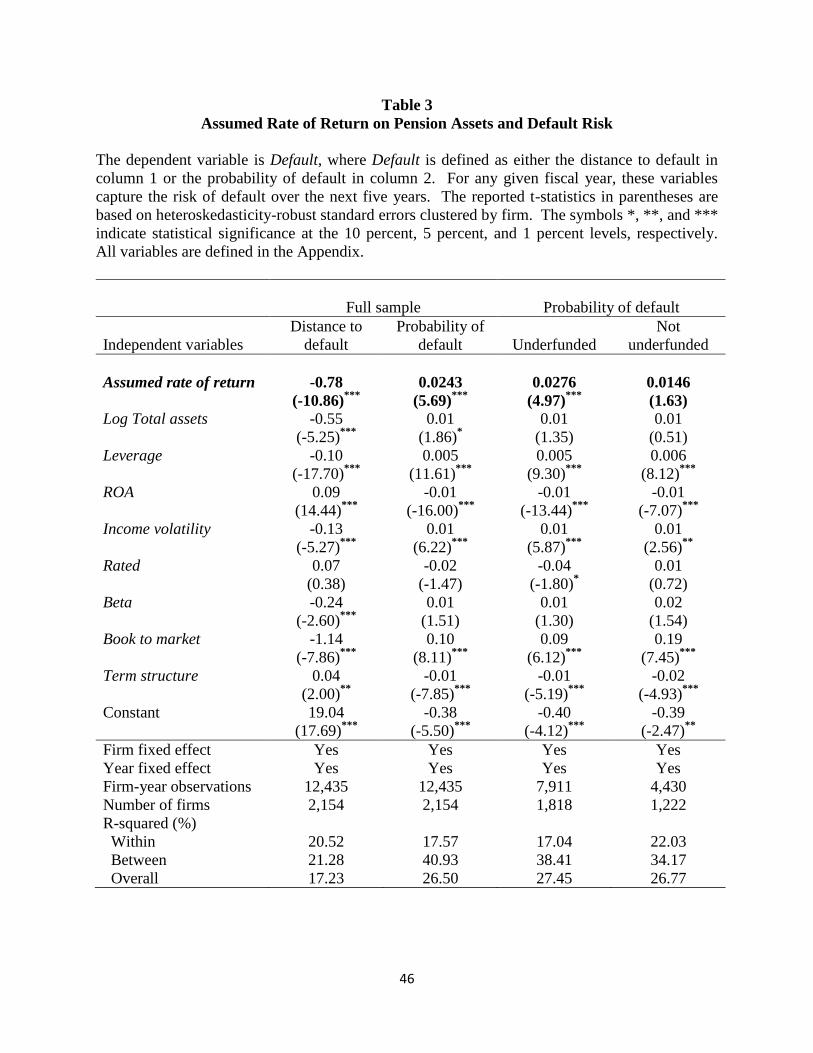
46
Table 3
Assumed Rate of Return on Pension Assets and Default Risk
The dependent variable is Default, where Default is defined as either the distance to default in
column 1 or the probability of default in column 2. For any given fiscal year, these variables
capture the risk of default over the next five years. The reported t-statistics in parentheses are
based on heteroskedasticity-robust standard errors clustered by firm. The symbols *, **, and ***
indicate statistical significance at the 10 percent, 5 percent, and 1 percent levels, respectively.
All variables are defined in the Appendix.
Full sample
Probability of default
Independent variables
Distance to
default
Probability of
default
Underfunded
Not
underfunded
Assumed rate of return -0.78
(-10.86)***
0.0243
(5.69)***
0.0276
(4.97)***
0.0146
(1.63)
Log Total assets -0.55
(-5.25)***
0.01
(1.86)*
0.01
(1.35)
0.01
(0.51)
Leverage -0.10
(-17.70)***
0.005
(11.61)***
0.005
(9.30)***
0.006
(8.12)***
ROA 0.09
(14.44)***
-0.01
(-16.00)***
-0.01
(-13.44)***
-0.01
(-7.07)***
Income volatility -0.13
(-5.27)***
0.01
(6.22)***
0.01
(5.87)***
0.01
(2.56)**
Rated 0.07
(0.38)
-0.02
(-1.47)
-0.04
(-1.80)*
0.01
(0.72)
Beta -0.24
(-2.60)***
0.01
(1.51)
0.01
(1.30)
0.02
(1.54)
Book to market -1.14
(-7.86)***
0.10
(8.11)***
0.09
(6.12)***
0.19
(7.45)***
Term structure 0.04
(2.00)**
-0.01
(-7.85)***
-0.01
(-5.19)***
-0.02
(-4.93)***
Constant 19.04
(17.69)***
-0.38
(-5.50)***
-0.40
(-4.12)***
-0.39
(-2.47)**
Firm fixed effect Yes Yes Yes Yes
Year fixed effect Yes Yes Yes Yes
Firm-year observations 12,435 12,435 7,911 4,430
Number of firms 2,154 2,154 1,818 1,222
R-squared (%)
Within
Between
Overall
20.52
21.28
17.23
17.57
40.93
26.50
17.04
38.41
27.45
22.03
34.17
26.77
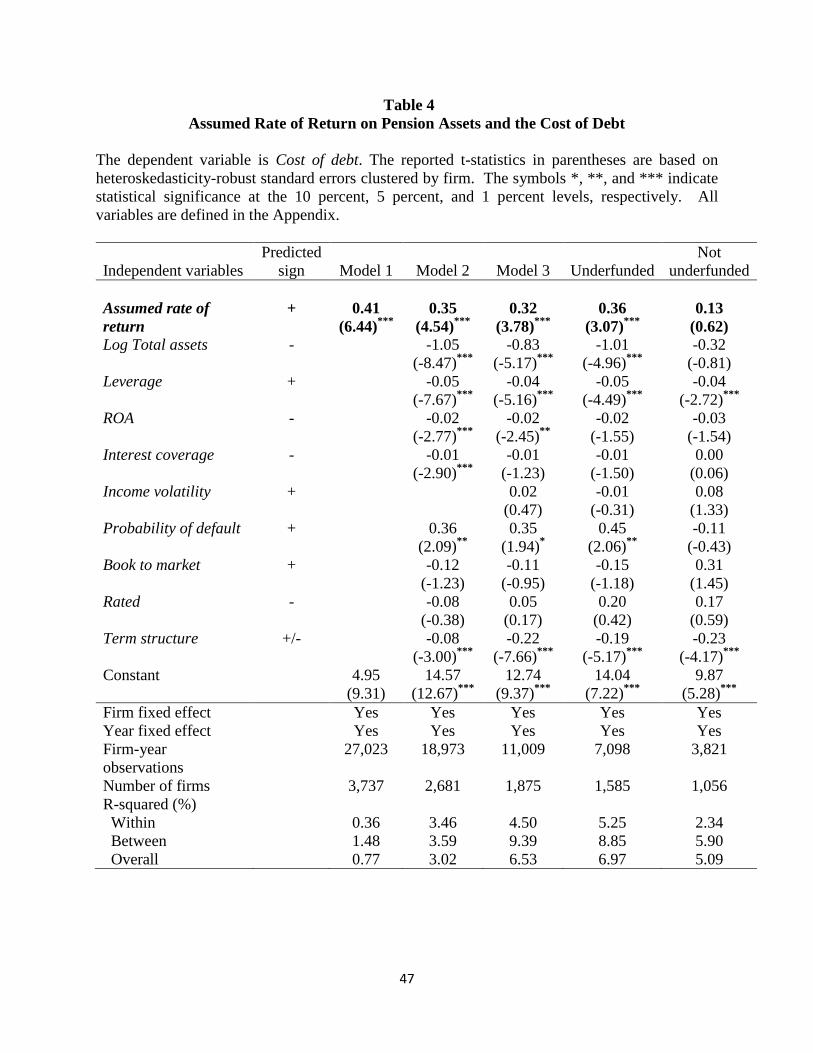
47
Table 4
Assumed Rate of Return on Pension Assets and the Cost of Debt
The dependent variable is Cost of debt. The reported t-statistics in parentheses are based on
heteroskedasticity-robust standard errors clustered by firm. The symbols *, **, and *** indicate
statistical significance at the 10 percent, 5 percent, and 1 percent levels, respectively. All
variables are defined in the Appendix.
Independent variables
Predicted
sign
Model 1
Model 2
Model 3
Underfunded
Not
underfunded
Assumed rate of
return
+ 0.41
(6.44)***
0.35
(4.54)***
0.32
(3.78)***
0.36
(3.07)***
0.13
(0.62)
Log Total assets - -1.05
(-8.47)***
-0.83
(-5.17)***
-1.01
(-4.96)***
-0.32
(-0.81)
Leverage + -0.05
(-7.67)***
-0.04
(-5.16)***
-0.05
(-4.49)***
-0.04
(-2.72)***
ROA - -0.02
(-2.77)***
-0.02
(-2.45)**
-0.02
(-1.55)
-0.03
(-1.54)
Interest coverage - -0.01
(-2.90)***
-0.01
(-1.23)
-0.01
(-1.50)
0.00
(0.06)
Income volatility + 0.02
(0.47)
-0.01
(-0.31)
0.08
(1.33)
Probability of default + 0.36
(2.09)**
0.35
(1.94)*
0.45
(2.06)**
-0.11
(-0.43)
Book to market + -0.12
(-1.23)
-0.11
(-0.95)
-0.15
(-1.18)
0.31
(1.45)
Rated - -0.08
(-0.38)
0.05
(0.17)
0.20
(0.42)
0.17
(0.59)
Term structure +/- -0.08
(-3.00)***
-0.22
(-7.66)***
-0.19
(-5.17)***
-0.23
(-4.17)***
Constant 4.95
(9.31)
14.57
(12.67)***
12.74
(9.37)***
14.04
(7.22)***
9.87
(5.28)***
Firm fixed effect Yes Yes Yes Yes Yes
Year fixed effect Yes Yes Yes Yes Yes
Firm-year
observations
27,023 18,973 11,009 7,098 3,821
Number of firms 3,737 2,681 1,875 1,585 1,056
R-squared (%)
Within
Between
Overall
0.36
1.48
0.77
3.46
3.59
3.02
4.50
9.39
6.53
5.25
8.85
6.97
2.34
5.90
5.09

48
Table 5
Actual Return on Pension Assets and the Cost of Debt
The sample used for this analysis comprises of firms belonging to the S&P 500 Index during the
period 1991 to 2006. The dependent variable is Cost of debt. The reported t-statistics in
parentheses are based on heteroskedasticity-robust standard errors clustered by firm. The
symbols *, **, and *** indicate statistical significance at the 10 percent, 5 percent, and 1 percent
levels, respectively. All variables are defined in the Appendix.
Independent variables Predicted
sign
Model 1
Model 2
Model 3
Underfunded
Not
underfunded
Assumed rate of
return
+
0.36
(3.17)***
0.36
(4.04)***
0.49
(4.91)***
-0.13
(-0.45)
Lagged actual return + 0.019
(3.76)***
0.005
(1.03)
0.007
(2.28)**
-0.001
(-0.36)
0.02
(2.18)**
Log Total assets -0.97
(-4.68)***
-0.95
(-4.21)***
-1.11
(-6.54)***
-0.49
(-0.98)
Leverage + -0.05
(-3.65)***
-0.05
(-4.39)***
-0.06
(-3.97)***
-0.03
(-1.89)*
ROA ? -0.04
(-2.08)**
-0.03
(-1.50)
-0.02
(-0.90)
-0.08
(-2.52)**
Interest coverage + -0.001
(-0.06)
-0.03
(-2.74)***
-0.03
(-2.08)**
-0.001
(-0.15)
Income volatility + 0.05
(1.03)
0.03
(0.62)
0.02
(0.40)
-0.04
(-0.33)
Probability of default + 0.16
(0.41)
0.22
(0.62)
-0.31
(-0.78)
0.52
(1.15)
Book to market + 0.34
(1.00)
0.25
(0.72)
1.02
(2.83)***
-0.79
(-0.85)
Rated - -0.66
(-1.34)
Investment grade -
-0.44
(-2.23)**
-0.33
(-1.65)*
-0.87
(-2.42)**
Term structure - -0.13
(-3.68)***
-0.13
(-3.75)***
-0.17
(-5.17)***
-0.04
(-0.54)
Constant 6.51
(137.44)***
14.62
(7.43)***
14.68
(7.08)***
14.78
(7.21)***
15.18
(5.18)***
Firm fixed effect Yes Yes Yes Yes Yes
Year fixed effect Yes Yes Yes Yes Yes
Firm-year observations 2,226 2,113 1,971 1,386 583
Number of firms 323 311 297 282 180
R-squared (%)
Within
Between
Overall
1.06
0.25
0.65
12.94
4.70
5.32
18.72
8.25
7.69
23.79
4.90
8.76
6.16
8.58
8.06

49
Table 6
Assumed Rate of Return on Pension Assets and the Cost of Debt
Change in Variables Regressions
The sample used in this analysis comprises of the full sample of observations from 1991 to 2006.
The dependent variable is Cost of debt. The symbol „‟ represents the change in the value of
the variable in year t from year t-1 (first differenced values). The reported t-statistics in
parentheses are based on heteroskedasticity-robust standard errors clustered by firm. The
symbols *, **, and *** indicate statistical significance at the 10 percent, 5 percent, and 1 percent
levels, respectively. All variables are defined in the Appendix.
Independent variables
Predicted
sign
Full sample
Underfunded
Not
underfunded
Assumed rate of return + 0.19
(2.31)**
0.24
(2.27)**
0.06
(0.48)
Log Total assets - -0.11
(-0.58)
-0.38
(-1.79)*
0.35
(1.17)
Leverage + -0.03
(-3.94)***
-0.03
(-3.20)***
-0.03
(-2.51)**
ROA - -0.01
(-1.01)
-0.002
(-0.21)
-0.02
(-1.51)
Interest coverage - -0.02
(-6.64)***
-0.03
(-5.90)***
-0.02
(-3.07)***
Income volatility + 0.08
(2.70)***
0.06
(1.99)**
0.21
(2.49)**
Probability of default + -0.29
(-2.18)**
-0.28
(-1.90)*
-0.31
(-1.31)
Book to market + 0.09
(0.95)
0.08
(0.73)
0.13
(0.79)
Rated - -0.12
(-2.04)**
-0.08
(-1.12)
-0.17
(-1.70)*
Term structure +/- -0.18
(-9.54)***
-0.18
(-8.26)***
-0.18
(-4.63)***
Constant -0.005
(-0.10)
0.00
(0.00)
-0.02
(-0.19)
Firm-year observations 8,872 5,710 3,102
Number of firms 1,558 1,286 926
R-squared (%) 4.10 4.88 3.52

50
Table 7
Assumed Rate of Return and Yield to Maturity: Evidence on New Debt Issues
The sample used in this analysis comprises of announcements of new debt issues by public firms between
1991 and 2007, as reported in SDC. The dependent variable in the regressions is Offer yield to maturity.
The reported t-statistics in parentheses are based on heteroskedasticity-robust standard errors clustered by
firm. The symbols *, **, and *** indicate statistical significance at the 10 percent, 5 percent, and 1
percent levels, respectively. All variables are defined in the Appendix.
Independent variables
Predicted
sign
Model 1
Model 2
Model 3
Underfunded
Not
underfunded
Assumed rate of return + 0.45
(5.64)***
0.13
(3.40)***
0.28
(4.89)***
0.33
(3.78)***
0.30
(2.54)**
Treasury YTM + 0.84
(28.24)***
0.79
(17.93)***
0.79
(11.90)***
0.70
(9.87)***
Log Total assets - -0.11
(-1.60)
-0.17
(-1.47)
-0.14
(-0.74)
0.05
(0.23)
Leverage + 0.02
(4.81)***
0.02
(3.33)***
0.03
(2.34)**
0.01
(0.95)
ROA - -0.01
(-1.20)
-0.01
(-0.73)
-0.02
(-0.81)
0.03
(2.65)***
Investment grade - -0.55
(-2.60)***
-0.34
(-1.12)
0.16
(0.28)
-0.39
(-0.46)
Probability of default - 0.69
(3.49)***
1.08
(3.92)***
0.75
(1.74)*
1.48
(3.99)***
Book to market + 0.49
(2.34)**
0.63
(1.99)***
0.36
(0.67)
-0.51
(-1.21)
Call protection years - -0.55
(-3.83)***
-1.04
(-2.87)***
-1.05
(-2.81)***
0.13
(0.41)
Maturity + 0.003
(1.99)**
0.002
(1.17)
-0.01
(-1.06)
-0.001
(-0.56)
Issue size + 0.24
(6.13)***
0.30
(5.32)***
0.29
(3.19)***
0.33
(4.38)***
Subordinated + 0.42
(3.68)***
0.61
(0.92)
1.42
(2.11)**
dropped
Beta + -0.11
(-1.28)
0.003
(0.03)
0.28
(1.97)**
0.17
(1.27)
Interest coverage - -0.003
(-2.67)***
0.01
(0.71)
-0.01
(-1.58)
Income volatility + 0.01
(0.27)
0.01
(0.32)
-0.05
(-0.77)
Constant 2.81
(3.97)***
0.99
(1.19)
0.15
(0.11)
-1.37
(-0.59)
-2.00
(-0.82)
Firm fixed effect Yes Yes Yes Yes Yes
Year fixed effect Yes Yes Yes Yes Yes
Firm-year observations 1,726 1,428 822 462 352
Number of firms 710 562 364 261 194
R-squared (%)
Within
Between
Overall
5.06
2.69
2.36
72.80
66.99
66.74
67.87
46.96
53.76
60.15
33.74
37.99
65.08
15.75
23.42

51
Table 8
Assumed Rate of Return and the Cost of Debt:
Controlling for Corporate Governance and Earnings Management
The sample used in this analysis is the full sample. The dependent variable is Cost of debt. The reported t-statistics
in parentheses are based on heteroskedasticity-robust standard errors clustered by firm. The symbols *, **, and ***
indicate statistical significance at the 10 percent, 5 percent, and 1 percent levels, respectively. All variables are
defined in the Appendix.
Independent variables
Predicted
sign
Full
Sample
Full
Sample
Smaller
S&P Sample
Assumed rate of return + 0.28
(2.96)***
0.37
(2.07)**
0.44
(2.68)***
Lagged actual return + -0.001
(-0.14)
Log Total assets - -0.81
(-4.68)***
-1.08
(-4.74)***
-1.09
(-4.18)***
Leverage + -0.05
(-5.00)***
-0.06
(-2.95)***
-0.06
(-2.57)***
ROA - -0.02
(-2.39)**
0.003
(0.24)
-0.02
(-0.95)
Interest coverage - -0.01
(-1.07)
-0.001
(-0.01)
-0.001
(-0.06)
Income volatility + 0.02
(0.65)
-0.03
(-0.36)
0.14
(1.99)**
Probability of default + 0.35
(1.85)*
-0.18
(-0.86)
0.14
(0.32)
Book to market + -0.10
(-0.84)
0.25
(1.35)
0.18
(0.42)
Rated - 0.04
(0.14)
0.54
(0.85)
-0.51
(-0.55)
Term structure +/- -0.21
(-6.68)***
-0.18
(-4.93)***
-0.14
(-4.23)***
Accounting quality + 0.81
(0.24)
2.55
(0.40)
-2.53
(-0.35)
Log board size + 0.34
(0.81)
0.54
(1.18)
Proportion independent - -0.24
(-0.34)
0.28
(0.39)
Dir and Off holdings + 0.02
(1.68)*
0.01
(0.46)
CEO not COB - -0.11
(-0.72)
-0.30
(-2.11)**
Constant 12.93
(8.89)***
13.24
(4.44)***
13.15
(3.91)***
Firm fixed effect Yes Yes Yes
Year fixed effect Yes Yes Yes
Observations 9,852 3,232 1,307
Number of firms 1,633 578 252
R-squared (%)
Within
Between
Overall
4.19
9.28
6.06
7.64
2.59
2.69
13.38
0.47
2.67

52
Table 9
Assumed Rate of Return and the Cost of Debt:
Alternative Regression Specifications
The sample used in this analysis is the full sample. The dependent variable is Cost of debt. The
cross-sectional regression specification involves regressing firm specific time-series means of
cost of debt on the time-series means of the independent variables. The t-statistics reported for
the cross-sectional regression are based on heteroskedasticity robust standard errors. The Fama-
Macbeth specifications involve regressing the cost of debt on the independent variables each
year. The reported coefficients for the Fama-Macbeth regressions are the means of the
coefficients estimated each year. The t-statistics for the Fama-Macbeth regressions are
computed using the standard deviations of the coefficients estimated each year. The symbols *,
**, and *** indicate statistical significance at the 10 percent, 5 percent, and 1 percent levels,
respectively. All variables are defined in the Appendix.
Independent variables
Predicted
sign
Cross-
sectional
regression
Fama-
Macbeth
regression
Fama-
Macbeth
regression
Assumed rate of return + 0.38
(4.50)***
0.18
(4.77)***
0.14
(3.46)***
Log Total assets - -0.11
(-1.94)*
-0.16
(-1.50)
-0.29
(-16.89)***
Leverage + -0.03
(-3.98)***
-0.04
(-7.35)***
-0.04
(-6.26)***
ROA - -0.09
(-3.58)***
-0.05
(-5.56)***
-0.05
(-6.58)***
Interest coverage - -0.01
(-1.13)
-0.01
(-2.57)**
-0.01
(-2.63)***
Income volatility + 0.06
(2.07)**
0.12
(9.47)***
Probability of default + 1.66
(2.26)**
1.32
(4.82)***
0.91
(3.02)***
Book to market + -0.44
(-2.64)***
-0.57
(-4.96)***
-0.33
(-1.78)*
Rated - 0.02
(0.09)
0.27
(3.76)***
0.42
(4.81)***
Term structure +/- 0.12
(0.41)
0.39
(1.61)
0.44
(1.69)*
Accounting quality
+ 7.41
(2.12)**
12.68
(8.03)***
7.99
(6.31)***
Constant 6.48
(6.22)***
8.12
(5.89)***
8.59
(12.80)***
Observations 1,687 16 12
R-squared (%) 14.68 N/A N/A