pennsylvania geisinger medical center - chu-imaa
TRANSCRIPT
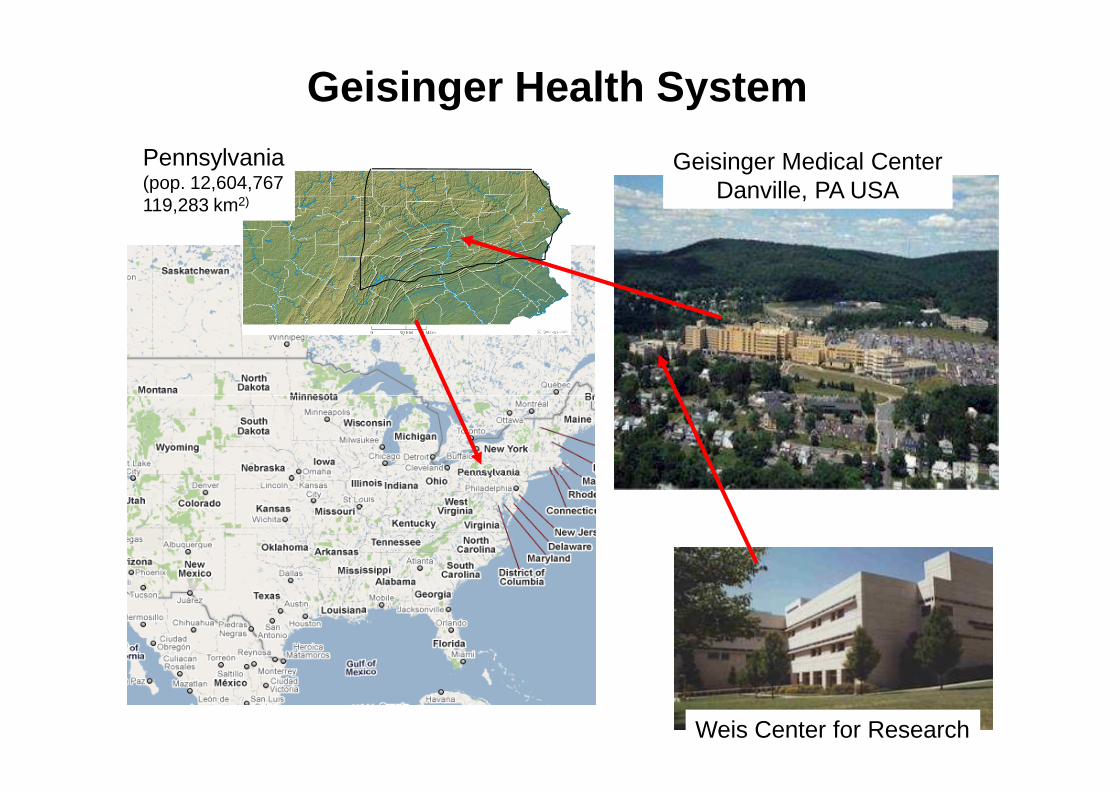
Geisinger Medical CenterDanville, PA USA
Pennsylvania(pop. 12,604,767119,283 km2)
Geisinger Health System
Weis Center for Research
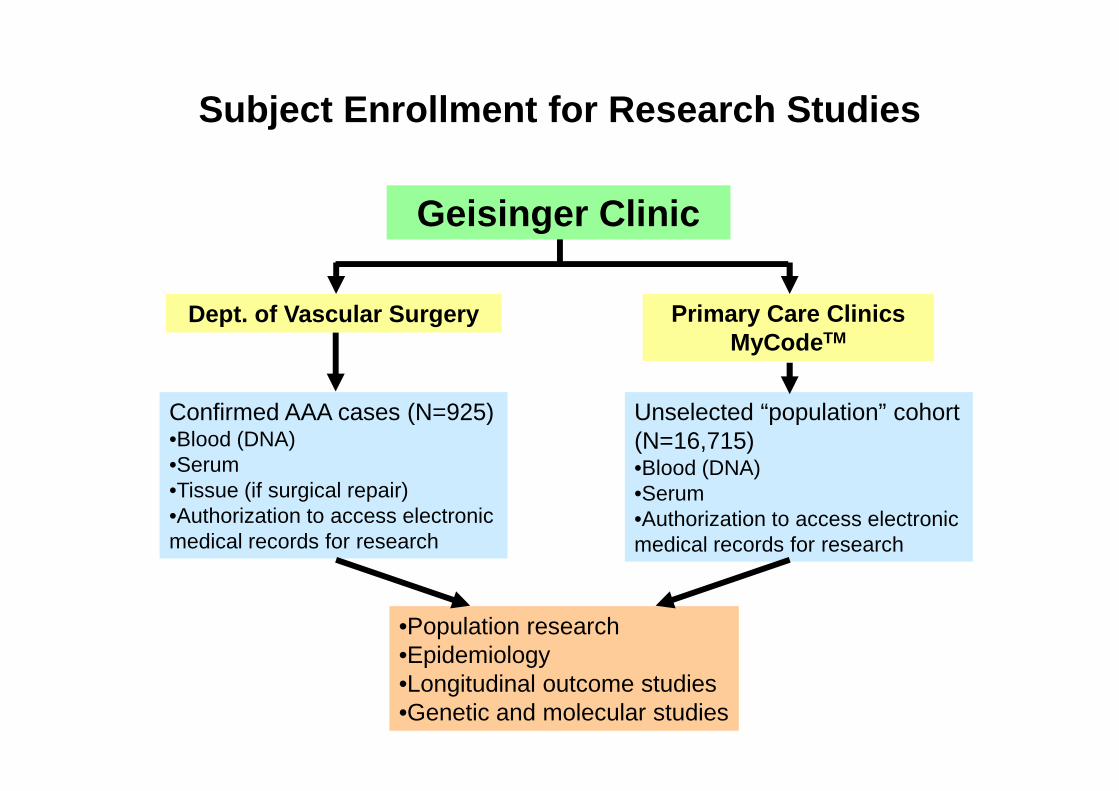
Geisinger Clinic
Dept. of Vascular Surgery Primary Care ClinicsMyCode TM
Subject Enrollment for Research Studies
Confirmed AAA cases (N=925)•Blood (DNA)•Serum•Tissue (if surgical repair)•Authorization to access electronic medical records for research
Unselected “population” cohort (N=16,715)•Blood (DNA)•Serum•Authorization to access electronic medical records for research
•Population research•Epidemiology•Longitudinal outcome studies•Genetic and molecular studies
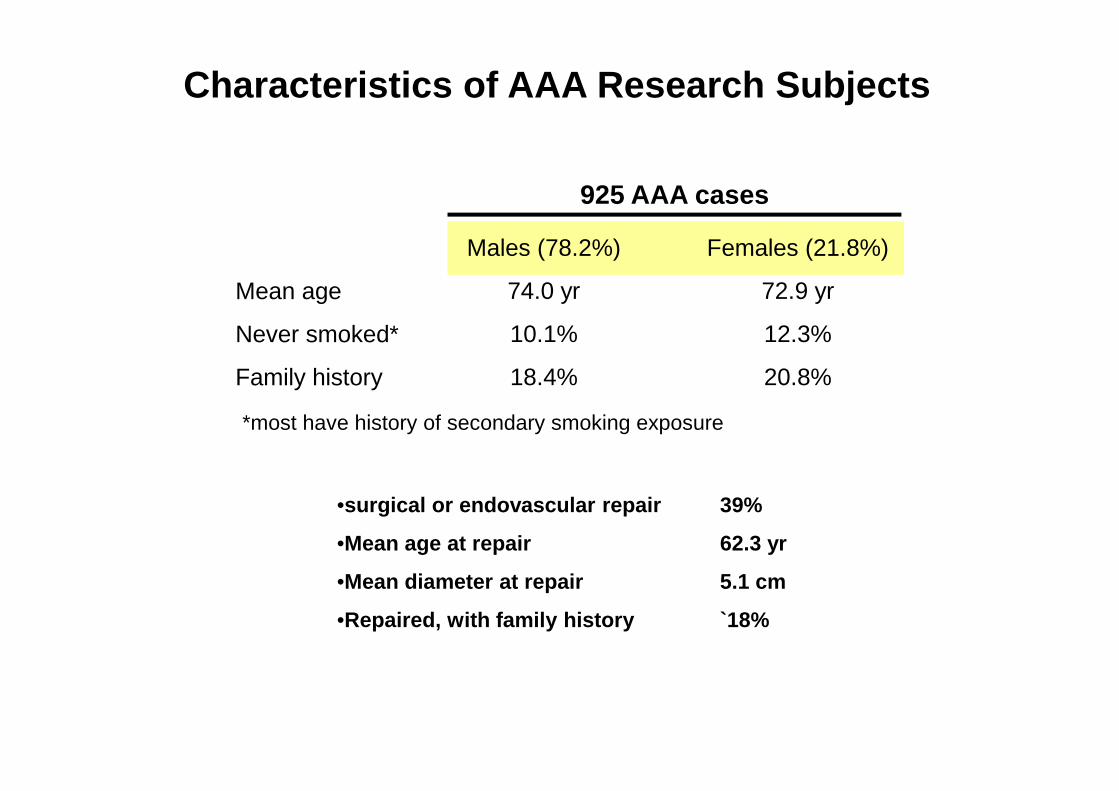
Males (78.2%)
74.0 yr
10.1%
18.4%
Females (21.8%)
72.9 yr
12.3%
20.8%
Mean age
Never smoked*
Family history
925 AAA cases
Characteristics of AAA Research Subjects
•surgical or endovascular repair 39%
•Mean age at repair 62.3 yr
•Mean diameter at repair 5.1 cm
•Repaired, with family history `18%
*most have history of secondary smoking exposure
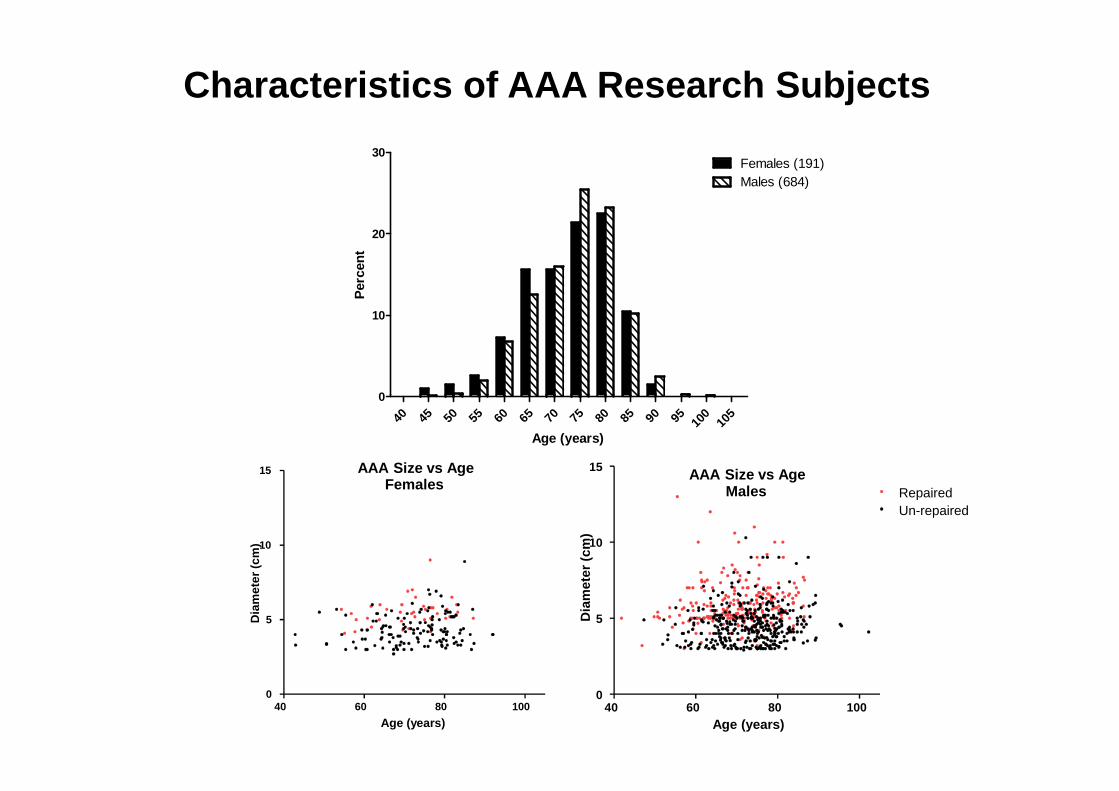
0
10
20
30Females (191)Males (684)
Per
cent
Characteristics of AAA Research Subjects
40 45 50 55 60 65 70 75 80 85 90 95 100
105
0
Age (years)
AAA Size vs AgeFemales
40 60 80 1000
5
10
15
Age (years)
Dia
met
er (c
m)
AAA Size vs AgeMales
40 60 80 1000
5
10
15
RepairedUn-repaired
Age (years)
Dia
met
er (
cm)
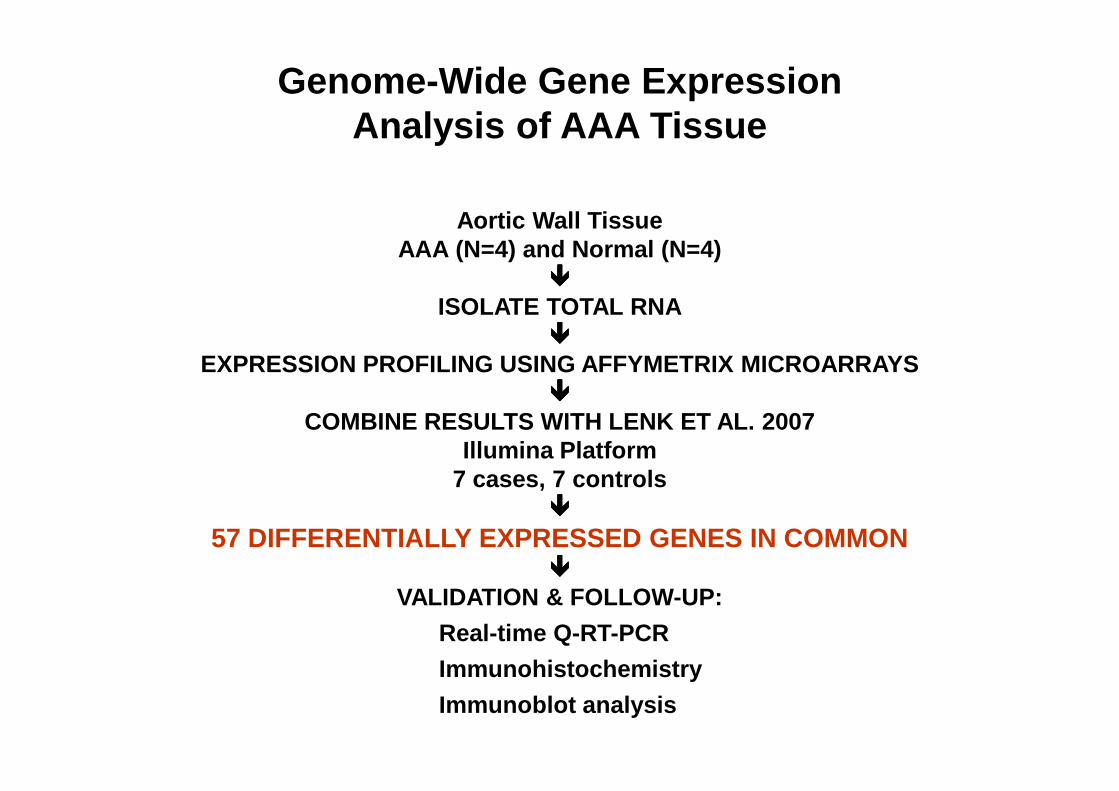
Aortic Wall TissueAAA (N=4) and Normal (N=4)
����
ISOLATE TOTAL RNA����
EXPRESSION PROFILING USING AFFYMETRIX MICROARRAYS����
Genome-Wide Gene Expression Analysis of AAA Tissue
����
COMBINE RESULTS WITH LENK ET AL. 2007 Illumina Platform
7 cases, 7 controls ����
57 DIFFERENTIALLY EXPRESSED GENES IN COMMON����
VALIDATION & FOLLOW -UP:
Real-time Q-RT-PCR
Immunohistochemistry
Immunoblot analysis
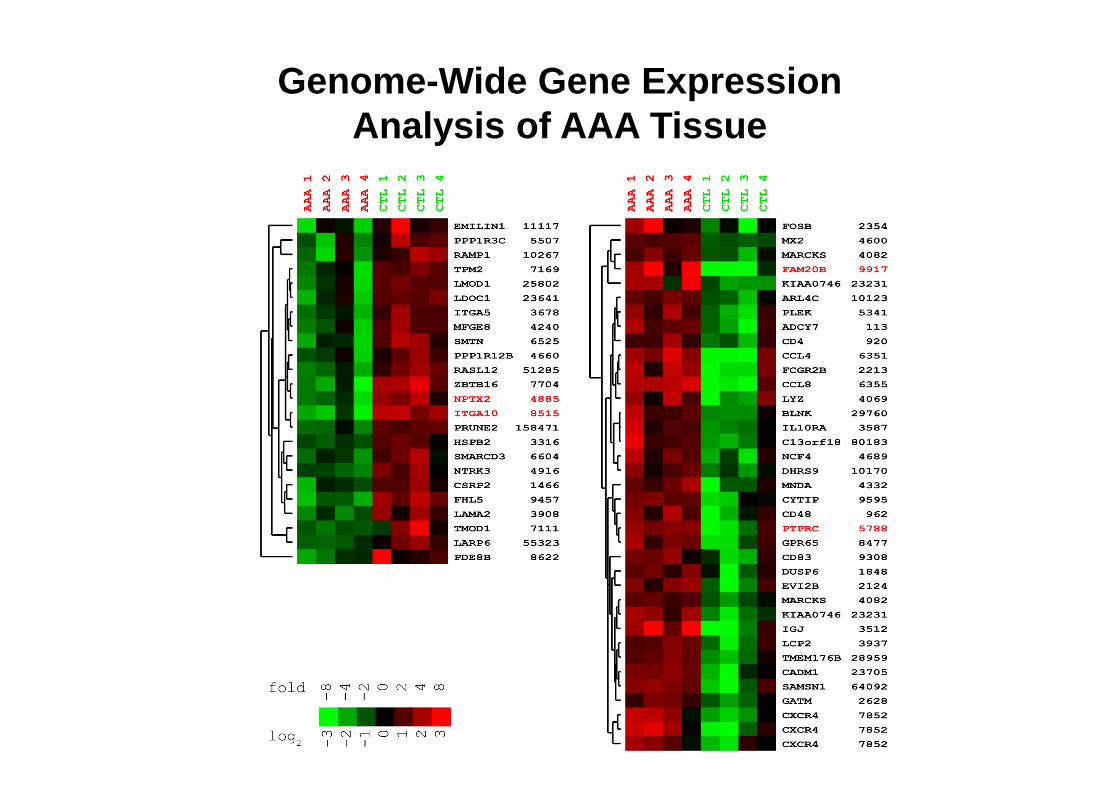
Genome-Wide Gene Expression Analysis of AAA Tissue
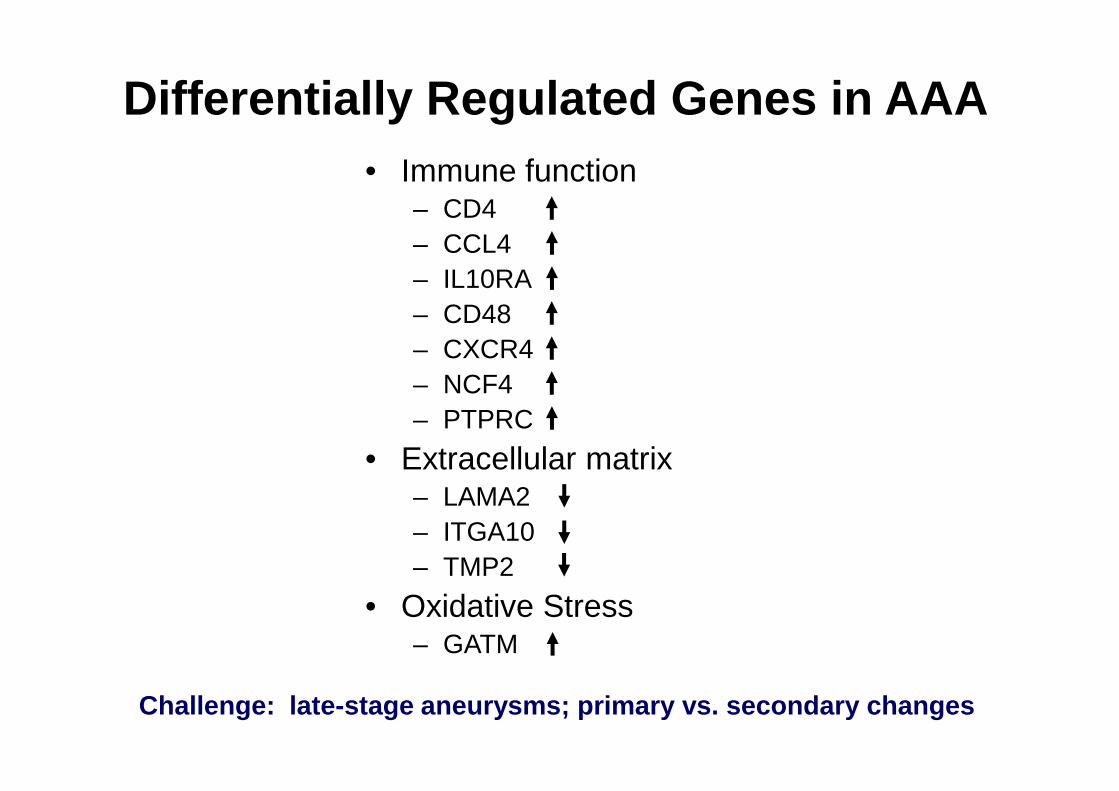
Differentially Regulated Genes in AAA• Immune function
– CD4– CCL4– IL10RA– CD48– CXCR4– NCF4– NCF4– PTPRC
• Extracellular matrix – LAMA2– ITGA10– TMP2
• Oxidative Stress – GATM
Challenge: late-stage aneurysms; primary vs. secon dary changes
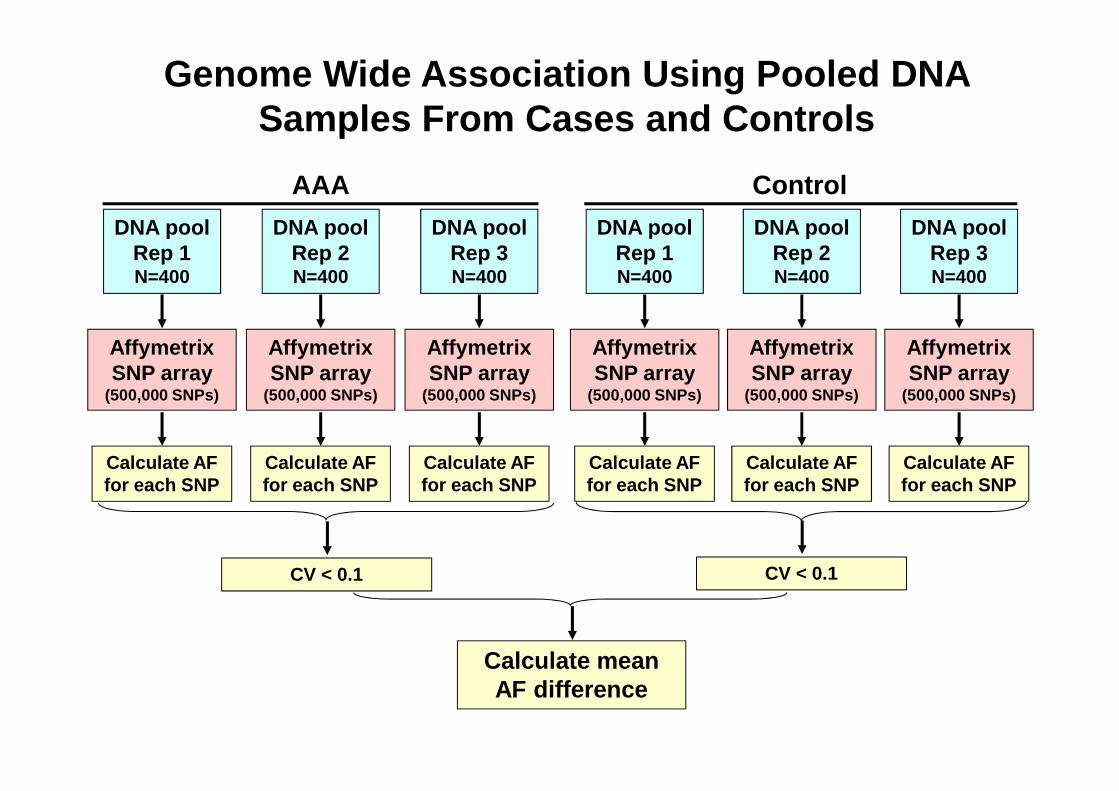
AAA Control
Genome Wide Association Using Pooled DNA Samples From Cases and Controls
DNA poolRep 1N=400
DNA poolRep 3N=400
DNA poolRep 2N=400
DNA poolRep 1N=400
DNA poolRep 3N=400
DNA poolRep 2N=400
Affymetrix SNP array
(500,000 SNPs)
Affymetrix SNP array
(500,000 SNPs)
Affymetrix SNP array
(500,000 SNPs)
Affymetrix SNP array
(500,000 SNPs)
Affymetrix SNP array
(500,000 SNPs)
Affymetrix SNP array
(500,000 SNPs)
Calculate mean AF difference
Calculate AF for each SNP
Calculate AF for each SNP
Calculate AF for each SNP
Calculate AF for each SNP
Calculate AF for each SNP
Calculate AF for each SNP
(500,000 SNPs) (500,000 SNPs)(500,000 SNPs) (500,000 SNPs) (500,000 SNPs)(500,000 SNPs)
CV < 0.1 CV < 0.1

PDZRN3 CNTN3 ROBO2 ROBO1
74M 76M 78M 80M
GWAS Case-Control Allele Frequency Differences Chromosome 3p12.3
10
12 CNTN3
75M 76M
0
2
4
6
8
10
-log
10PΣ
5
Map position75,000,000 76,000,000
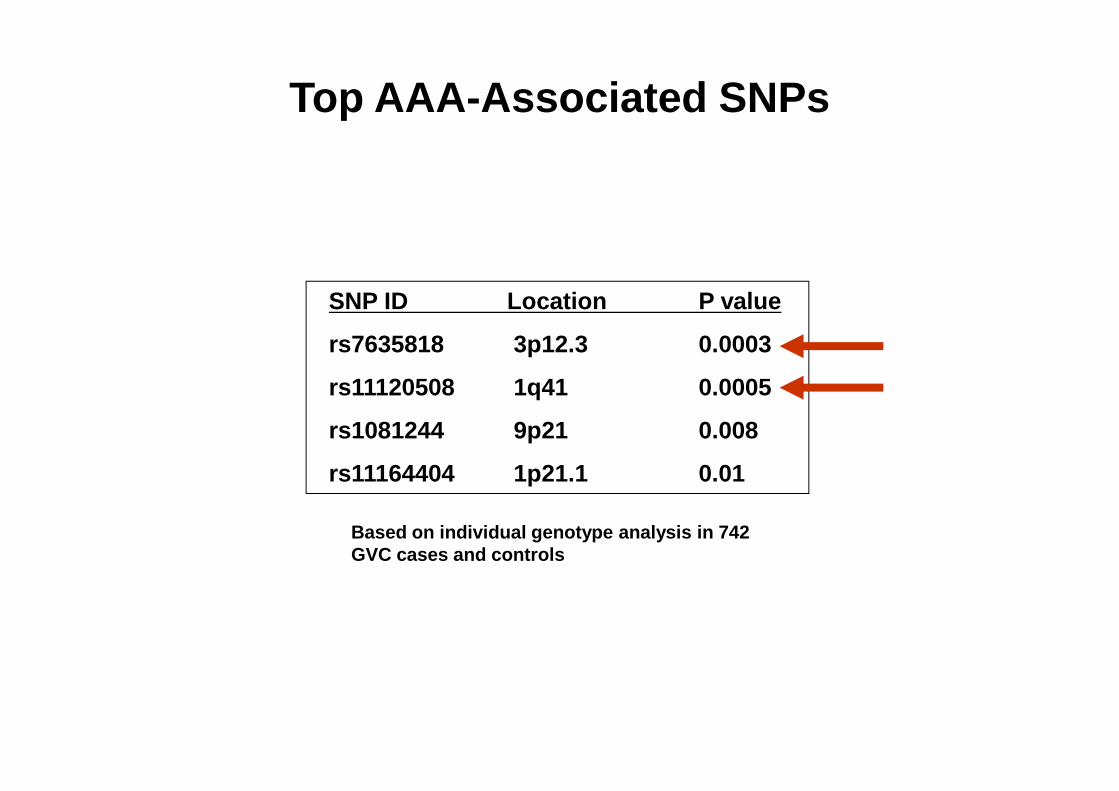
SNP ID Location P value
rs7635818 3p12.3 0.0003
rs11120508 1q41 0.0005
Top AAA -Associated SNPs
rs11120508 1q41 0.0005
rs1081244 9p21 0.008
rs11164404 1p21.1 0.01
Based on individual genotype analysis in 742 GVC cases and controls
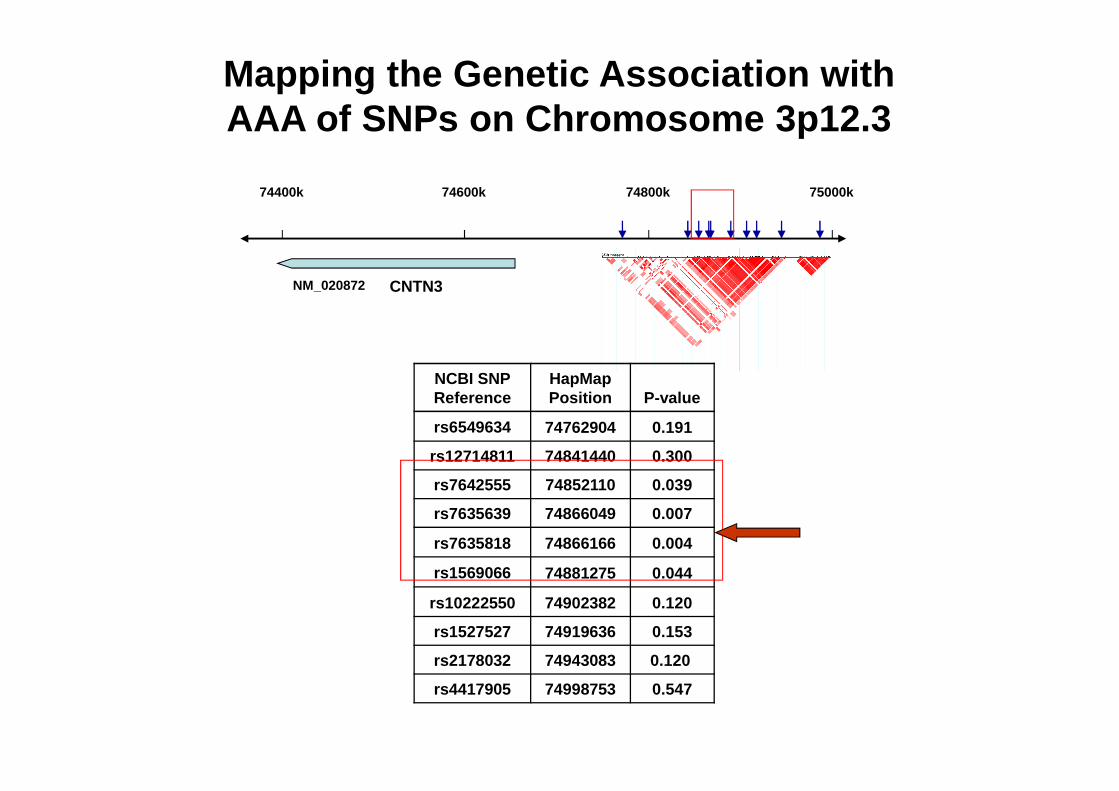
74400k 74600k 74800k 75000k
NM_020872 CNTN3
NCBI SNP Reference
HapMap Position P-value
Mapping the Genetic Association with AAA of SNPs on Chromosome 3p12.3
Reference Position P-value
rs6549634 74762904 0.191
rs12714811 74841440 0.300
rs7642555 74852110 0.039
rs7635639 74866049 0.007
rs7635818 74866166 0.004
rs1569066 74881275 0.044
rs10222550 74902382 0.120
rs1527527 74919636 0.153
rs2178032 74943083 0.120
rs4417905 74998753 0.547
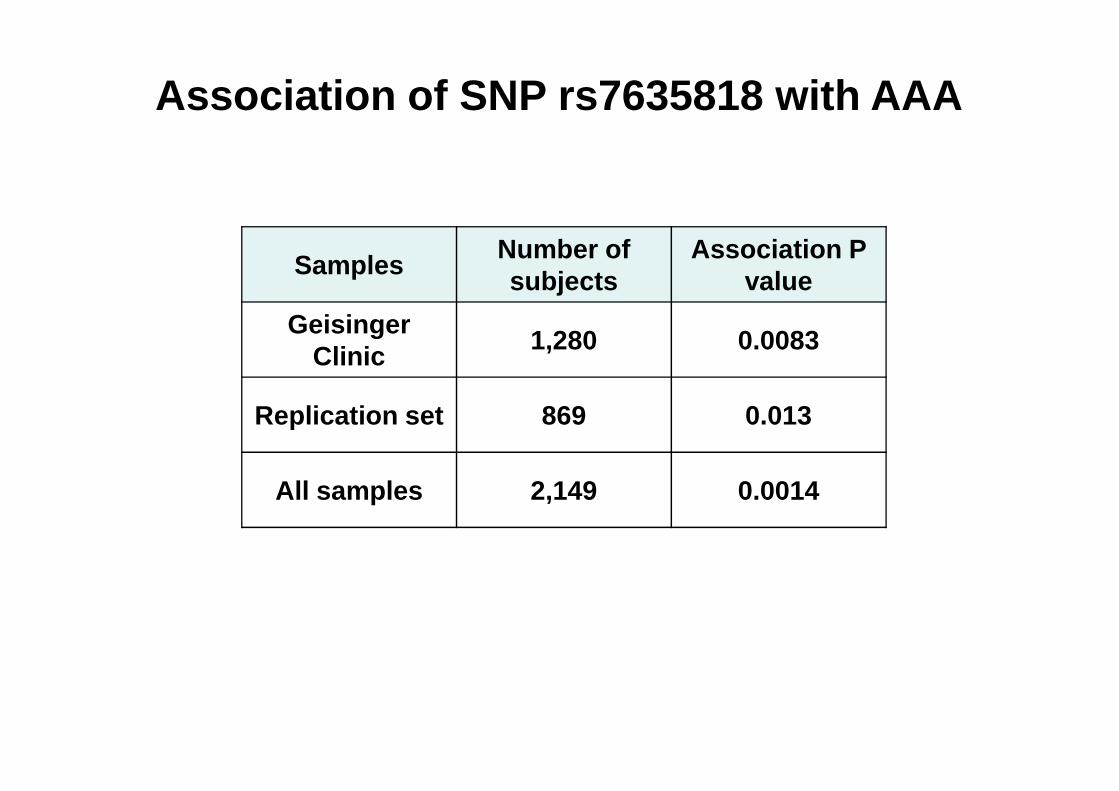
Association of SNP rs7635818 with AAA
SamplesNumber of subjects
Association P value
Geisinger Clinic
1,280 0.0083
Replication set 869 0.013
All samples 2,149 0.0014
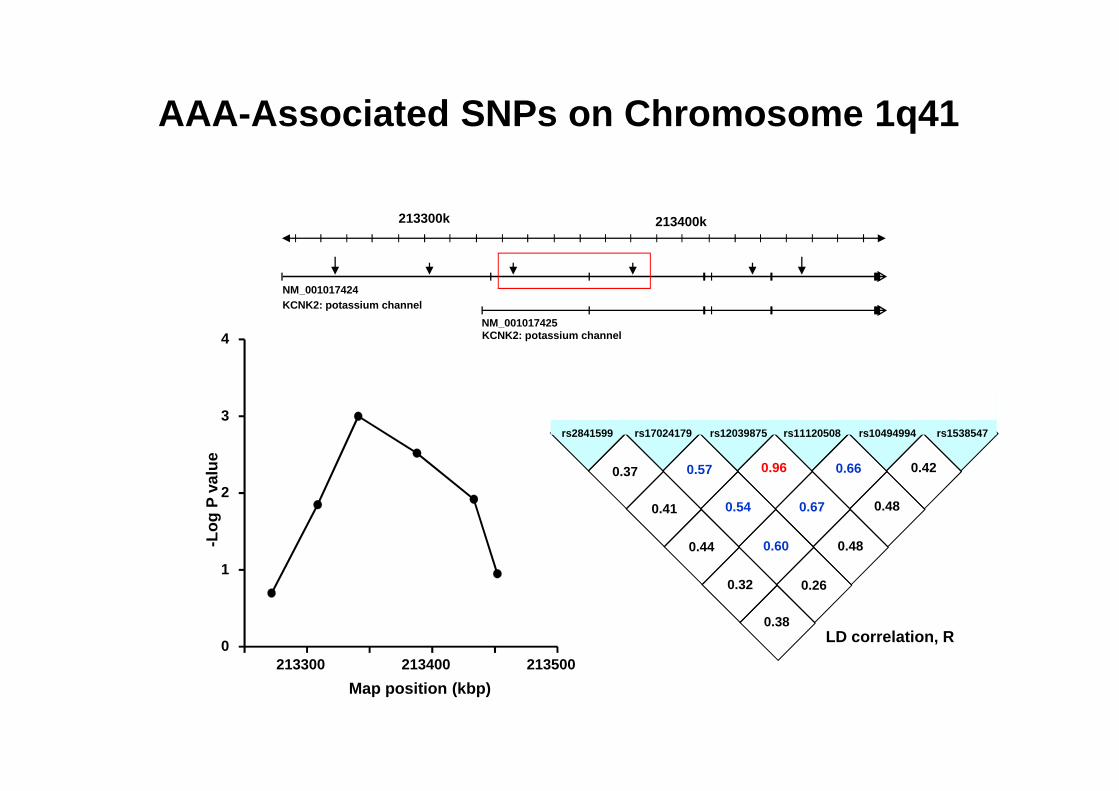
4
213300k 213400k
NM_001017424KCNK2: potassium channel
NM_001017425KCNK2: potassium channel
AAA -Associated SNPs on Chromosome 1q41
213300 213400 2135000
1
2
3
Map position (kbp)
-Log
P v
alue
rs2841599 rs17024179 rs12039875 rs11120508 rs10494994 rs 1538547
0.37
0.41
0.44
0.32
0.38
0.57
0.54
0.60
0.96
0.67
0.48
0.66
0.48
0.26
0.42
LD correlation, R
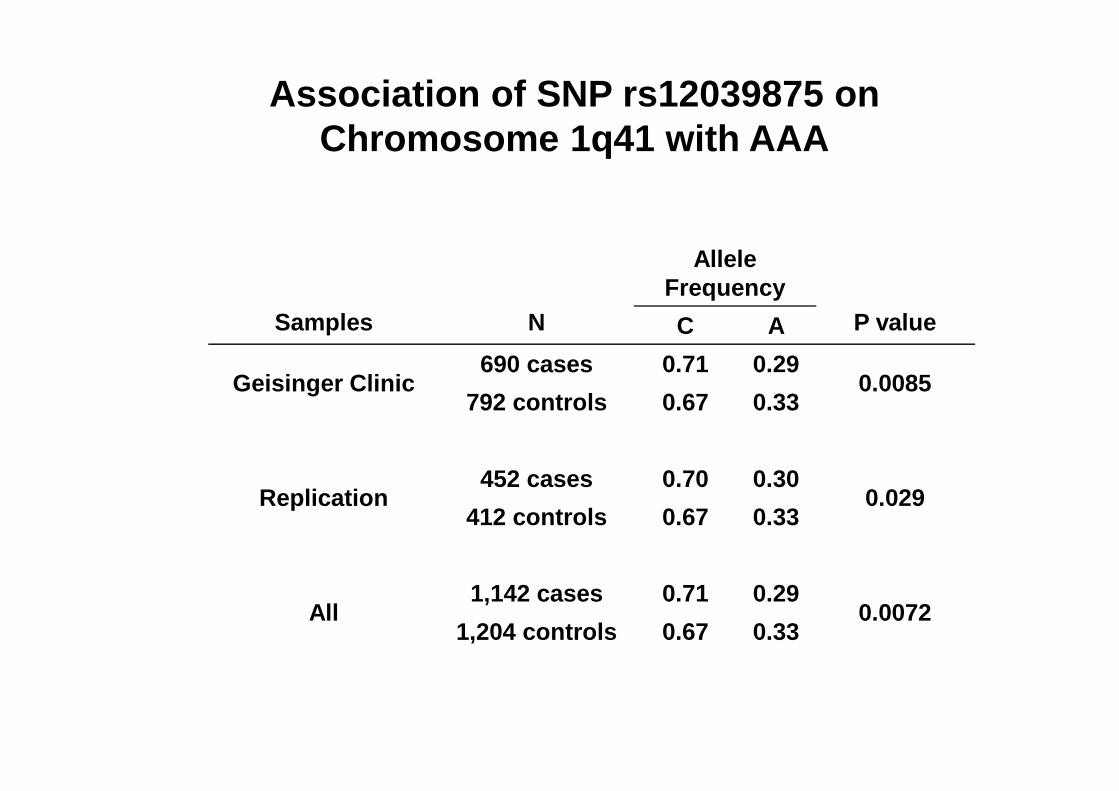
0.330.67792 controls0.0085
0.290.71690 casesGeisinger Clinic
AC P value
Allele Frequency
NSamples
Association of SNP rs12039875 on Chromosome 1q41 with AAA
0.330.671,204 controls0.0072
0.290.711,142 casesAll
0.330.67412 controls0.029
0.300.70452 casesReplication
0.330.67792 controls0.0085Geisinger Clinic

A/CG/AA/GC/AT/CC/G P valuecontrolcase
haplotype frequency
SNPs
AAA is Associated With a Common Haplotype on Chromosome 1q41
0.00290.580.68A/CGACTC/G
0.000890.600.70A/CG/AACTC/G
0.000220.610.72A/CG/AA/GCTC/G

MMNPRAKRDFYLAAPDLLDPKSAAQNSKPRLSFSTKPTVLa:
MAAPDLLDPKSAAQNSKPRLSFSTKPTVLb:
MLPSASRERPGYRAGVAAPDLLDPKSAAQNSKPRLSFSTKPTVL c:
KCNK2 Expression in AAA Tissue
AAA AOD normal NTC
Tissue
NM_001017424KCNK2: potassium channel
NM_001017425KCNK2: potassium channel
bca
GAPDH
KCNK2
PCR amplification of reverse-transcribed total RNA
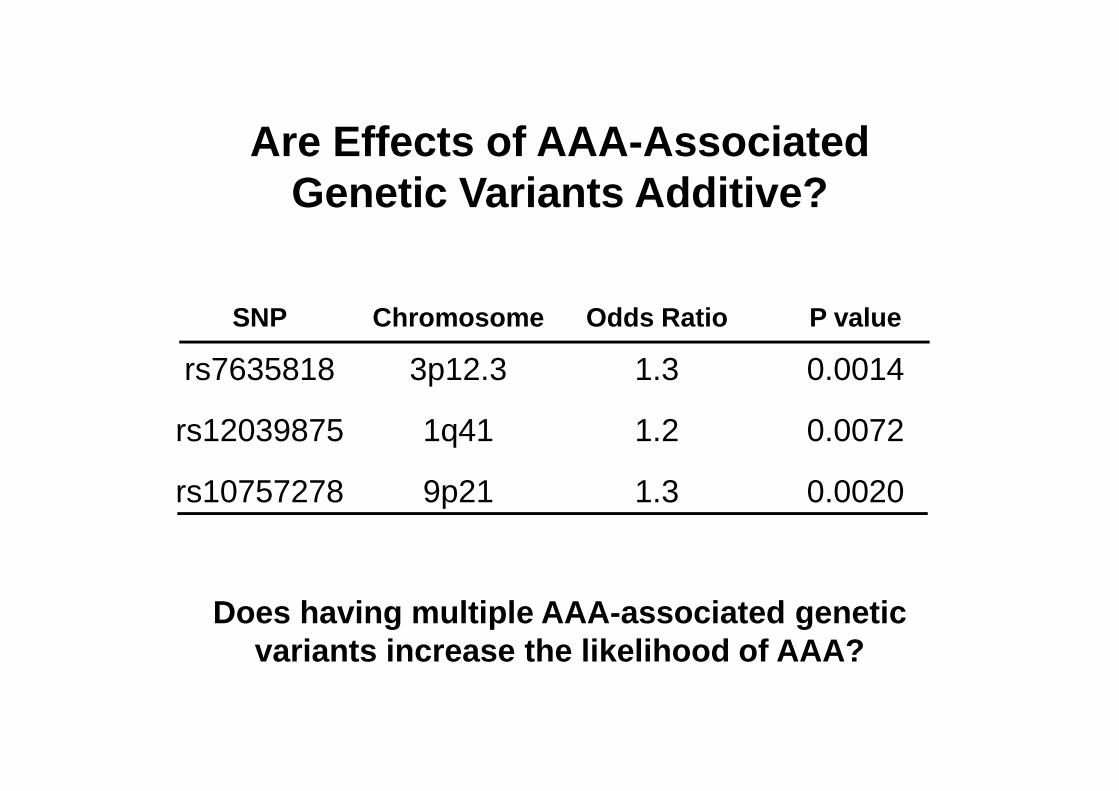
Are Effects of AAA -Associated Genetic Variants Additive?
SNP Chromosome Odds Ratio P value
rs7635818 3p12.3 1.3 0.0014
rs12039875 1q41 1.2 0.0072
rs10757278 9p21 1.3 0.0020
Does having multiple AAA -associated genetic variants increase the likelihood of AAA?
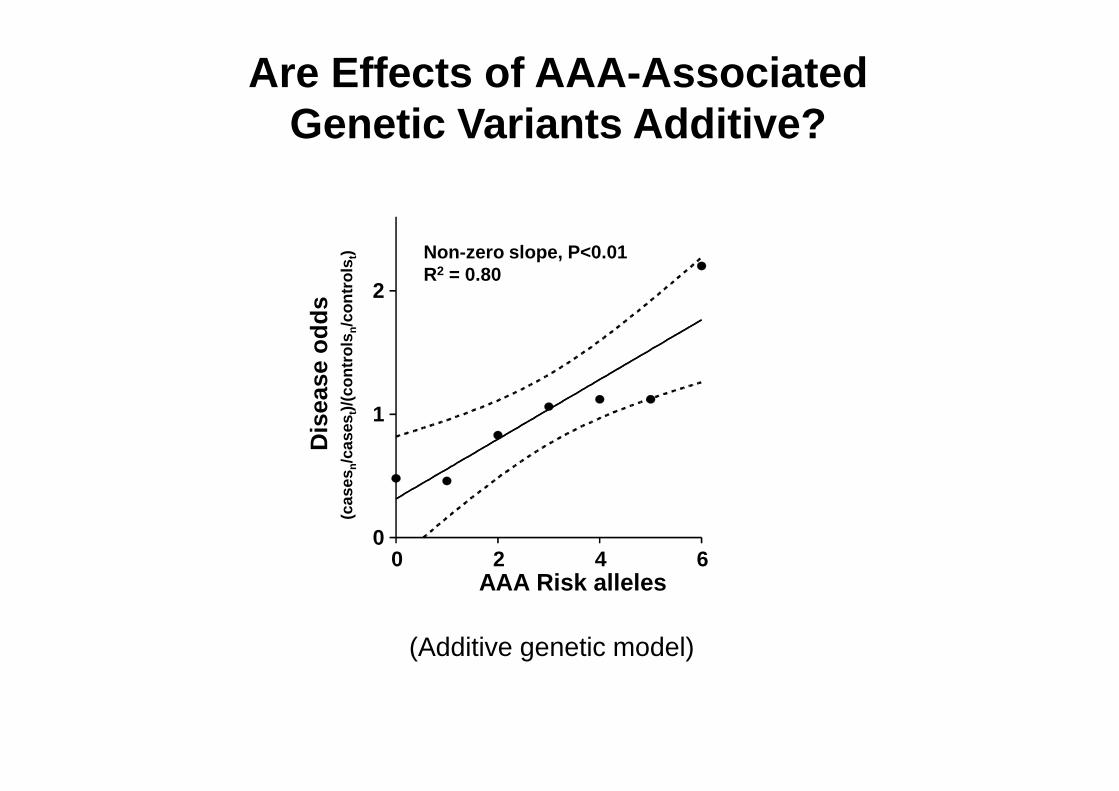
Are Effects of AAA -Associated Genetic Variants Additive?
2D
isea
se o
dds
)/(c
ontr
ols
n/c
ontr
ols
t) Non-zero slope, P<0.01R2 = 0.80
(Additive genetic model)
0 2 4 60
1
AAA Risk alleles
Dis
ease
odd
s(c
ases
n/c
ases
t)/(c
ontr
ols
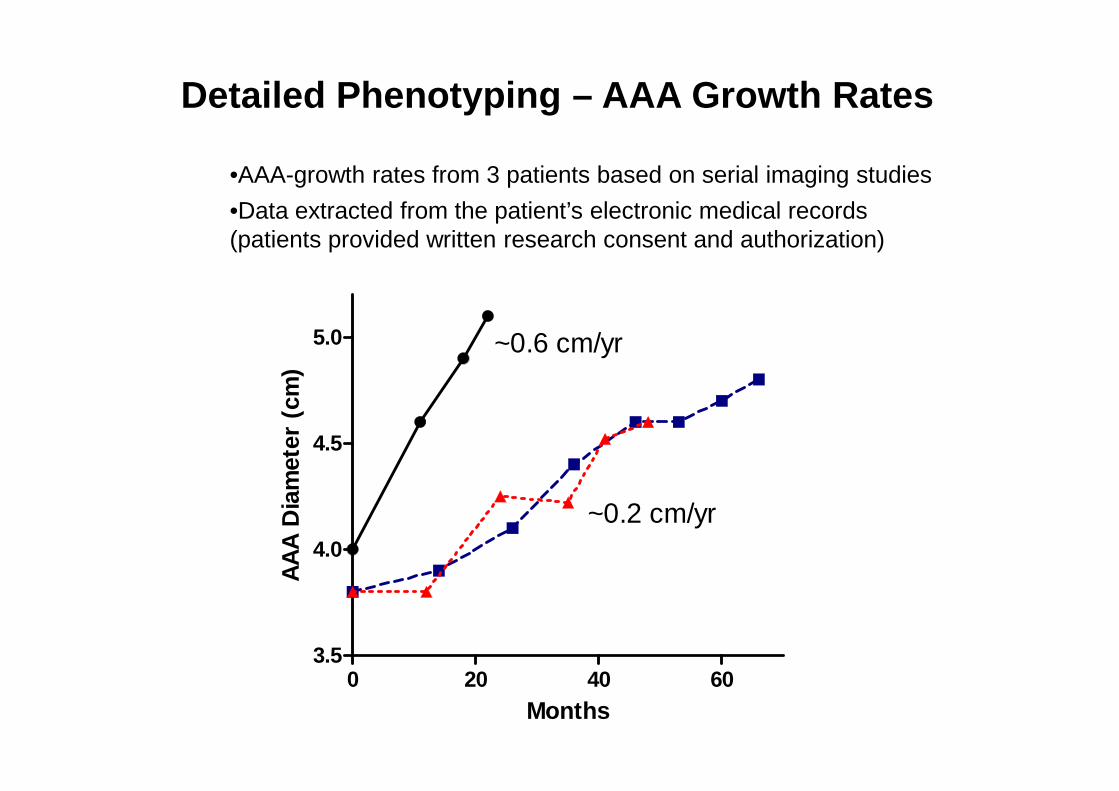
5.0 ~0.6 cm/yr
AA
A D
iam
eter
(cm
)
Detailed Phenotyping – AAA Growth Rates
•AAA-growth rates from 3 patients based on serial imaging studies
•Data extracted from the patient’s electronic medical records (patients provided written research consent and authorization)
0 20 40 603.5
4.0
4.5
~0.2 cm/yr
Months
AA
A D
iam
eter
(cm
)
Acknowledgements
Alicia GoldenKathy MaskerGlenn GerhardDiane Smelser
James ElmoreDavid Franklin
Helena KuivaniemiDiane SmelserBill Bowen
Funding:American Heart Association, PA CURE Fund, Geisinger Clinical Research Fund, Ben Franklin Technology Development Fund, NIH
Helena KuivaniemiGerard Tromp

EHR
Research Data Broker and Clinical Decision Intelligence System (CDIS) Data Warehouse
Orders
Data
searchableexportable
DiagnosesLab values
MedsProcedures
Etc.
PHI FirewallTPO
Investigator
Central Biobank (MyCode)>30,000 consented participants
>72,000 samples
•Blood, serum, DNA, tissue
Governing Board
DataBroker
Research data
CDIS
FinanceClaims Ops

Quantitative RT -PCR Analysis of AAA Tissue
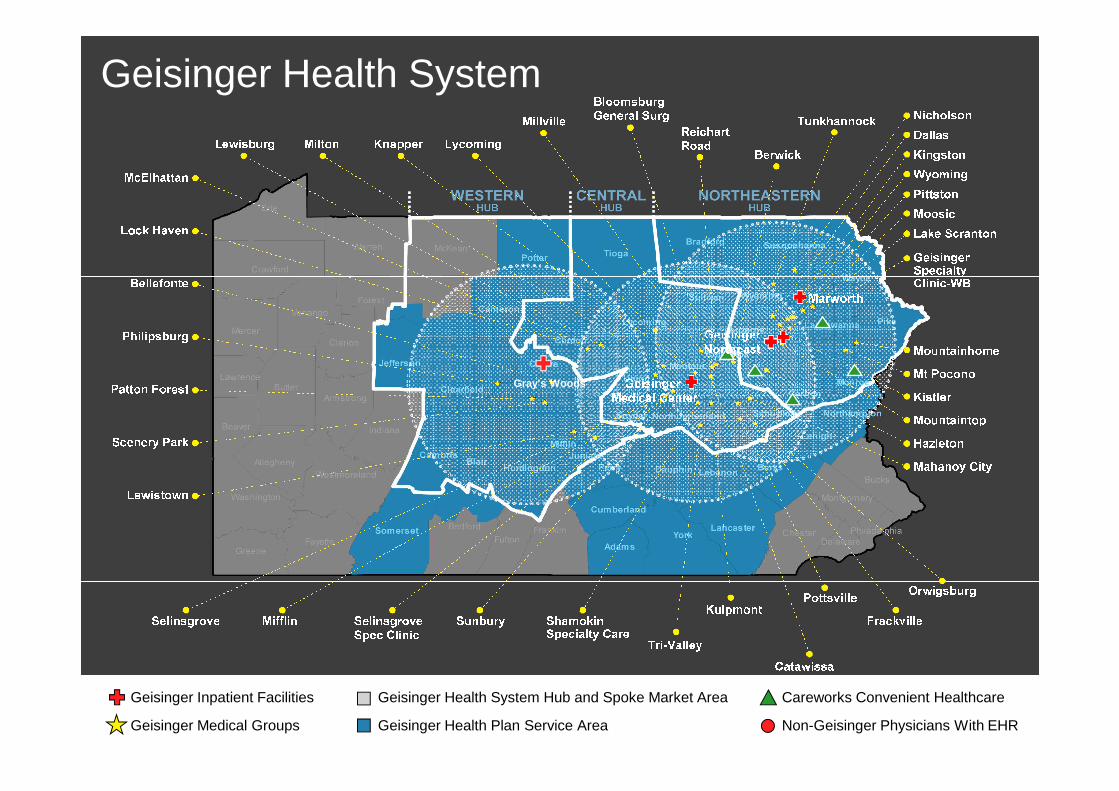
Geisinger Health System
Gray’s Woods
Geisinger Inpatient Facilities
Geisinger Medical Groups
Geisinger Health System Hub and Spoke Market Area
Geisinger Health Plan Service Area
Careworks Convenient Healthcare
Non-Geisinger Physicians With EHR
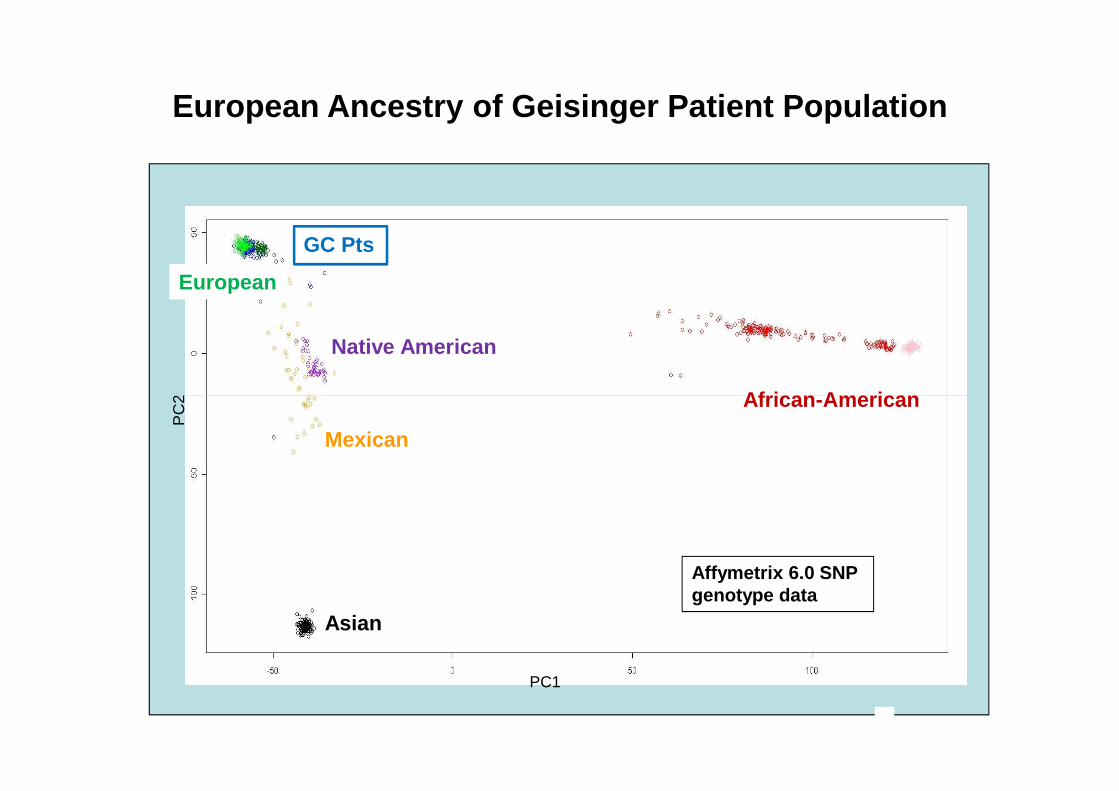
African -American
Native American
European
GC Pts
PC
2
European Ancestry of Geisinger Patient Population
Asian
African -American
Mexican
PC1
PC
2
Affymetrix 6.0 SNP genotype data
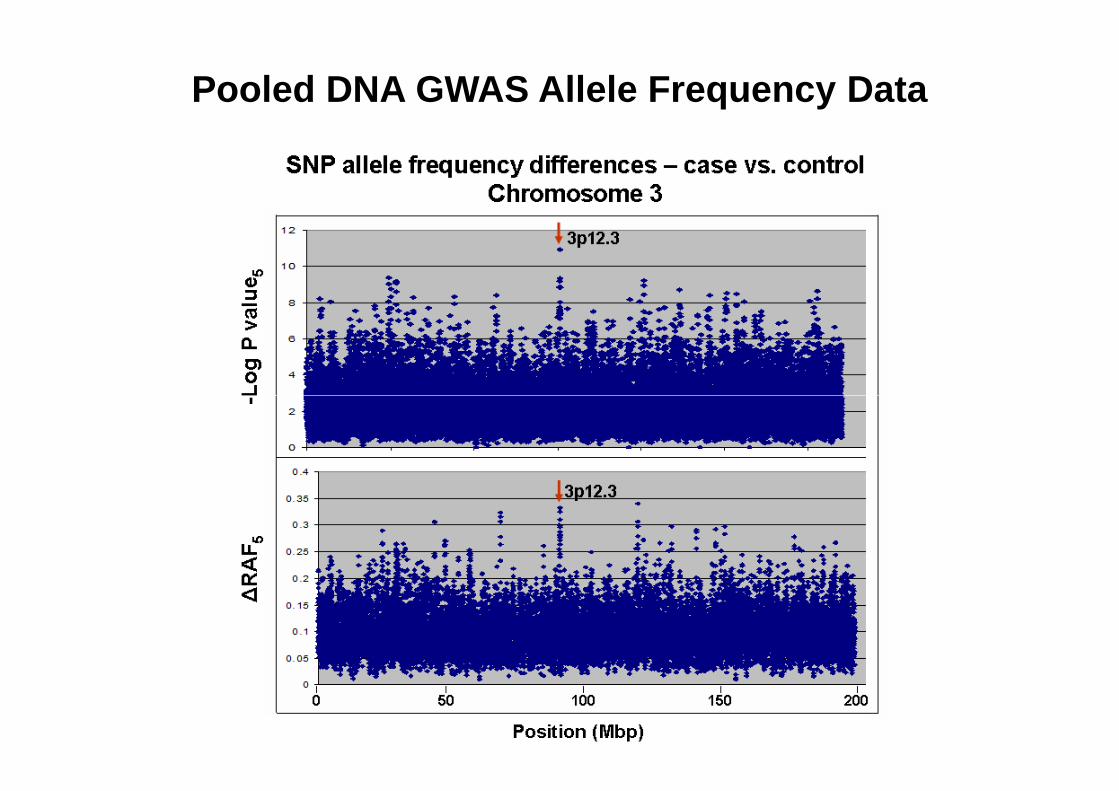
Pooled DNA GWAS Allele Frequency Data
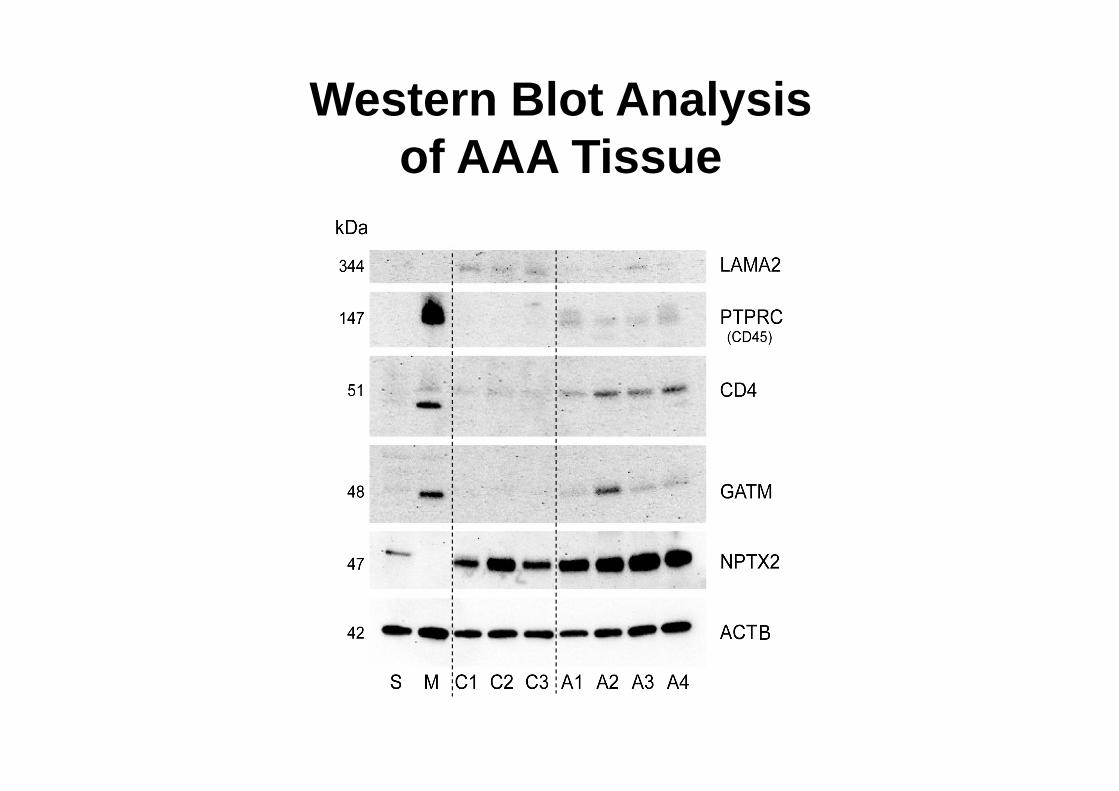
Western Blot Analysis of AAA Tissue
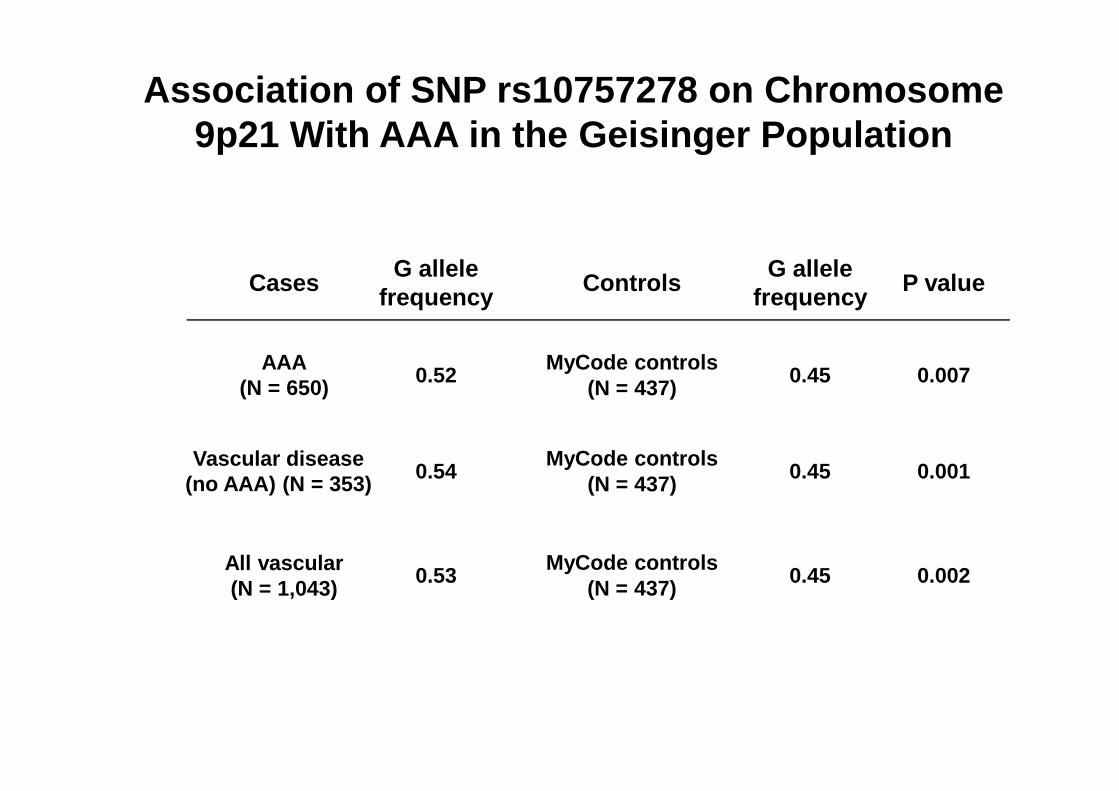
0.0070.45MyCode controls
(N = 437)0.52
AAA(N = 650)
P valueG allele
frequencyControls
G allele frequency
Cases
Association of SNP rs10757278 on Chromosome 9p21 With AAA in the Geisinger Population
0.0020.45MyCode controls
(N = 437)0.53All vascular
(N = 1,043)
0.0010.45MyCode controls
(N = 437)0.54
Vascular disease(no AAA) (N = 353)
(N = 437)(N = 650)
3000
4000
Num
ber
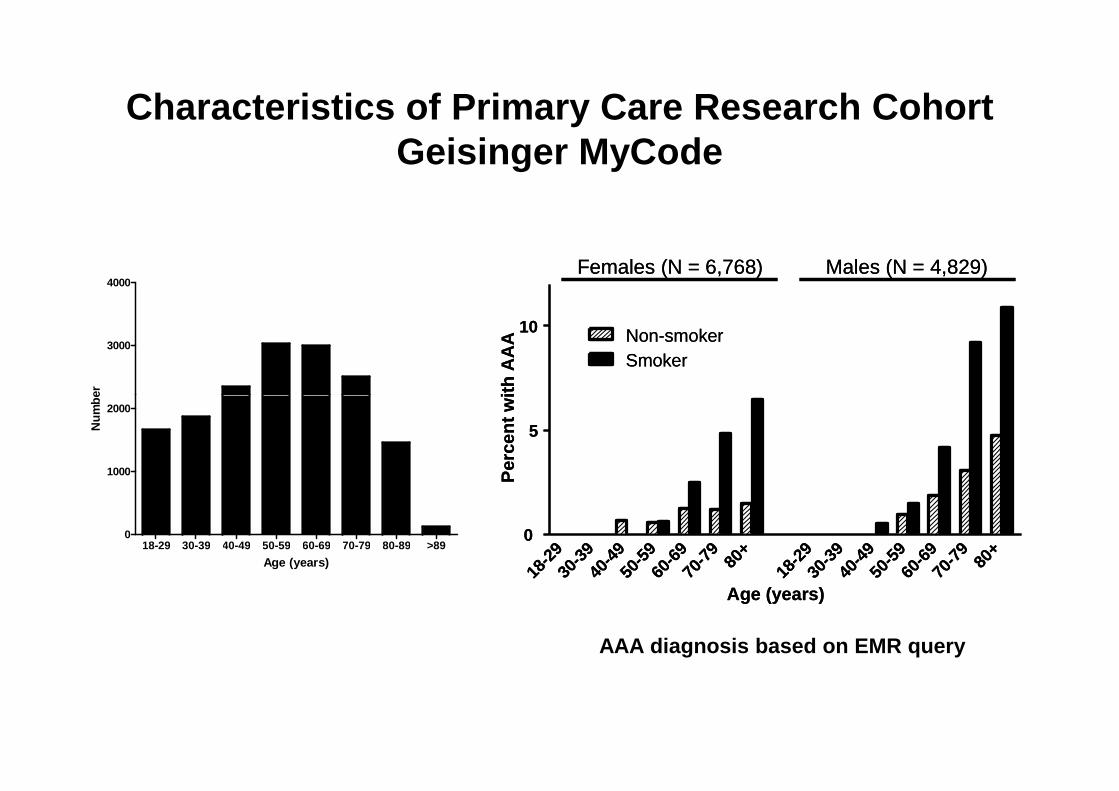
10 Non-smokerSmoker
Females (N = 6,768) Males (N = 4,829)
Per
cent
with
AA
A
10 Non-smokerSmoker
Females (N = 6,768) Males (N = 4,829)
Per
cent
with
AA
A
Characteristics of Primary Care Research CohortGeisinger MyCode
18-29 30-39 40-49 50-59 60-69 70-79 80-89 >890
1000
2000
Age (years)
Num
ber
18-2
930
-39
40-4
950
-59
60-6
970
-79
80+
18-2
930
-39
40-4
950
-59
60-6
970
-79
80+
0
5
Age (years)
Per
cent
with
AA
A
18-2
930
-39
40-4
950
-59
60-6
970
-79
80+
18-2
930
-39
40-4
950
-59
60-6
970
-79
80+
0
5
Age (years)
Per
cent
with
AA
A
AAA diagnosis based on EMR query