pend oreille sediment tmdl methodologyair.idaho.gov/media/571953-sediment_tmdl_allocations...1,014 2...
TRANSCRIPT

ParsonsParsons
PEND OREILLE TRIBUTARIES PEND OREILLE TRIBUTARIES SEDIMENT TMDLSSEDIMENT TMDLS
June 14, 2007June 14, 2007Idaho Department of Environmental QualityIdaho Department of Environmental Quality
USEPA Region 10USEPA Region 10PARSONSPARSONS

ParsonsParsons
WATERSHED BOUNDARY MAPWATERSHED BOUNDARY MAP
North Gold Creek-2 Assessment Units
Rapid Lightning Creek
Gold Creek
Upper Pack River -4 Assessment Units
Sand Creek,Schweitzer Creek -3 Assessment Units
ParsonsParsons
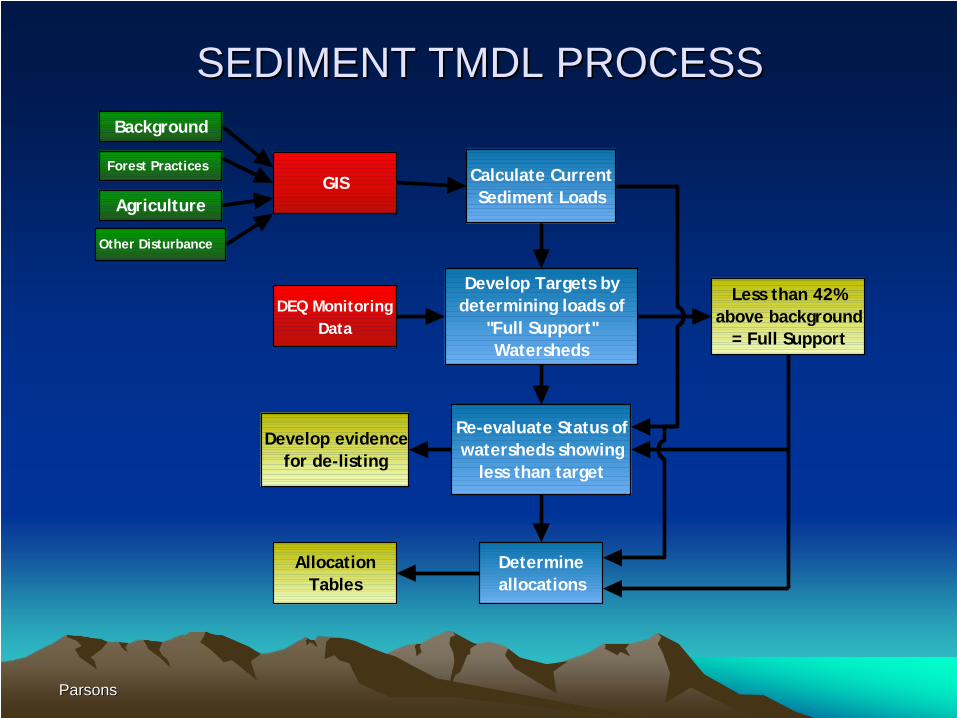
SEDIMENT TMDL PROCESSSEDIMENT TMDL PROCESS
Calculate CurrentSediment Loads
Develop Targets bydetermining loads of
"Full Support"Watersheds
Re-evaluate Status ofwatersheds showing
less than target
Determineallocations
GIS
DEQ MonitoringData
Background
Less than 42%above background
= Full Support
Forest Practices
Agriculture
Other Disturbance
AllocationTables
Develop evidencefor de-listing

ParsonsParsons
SEDIMENT SOURCESSEDIMENT SOURCES
Background• Forest• Shrubland• Barren (no delivery)• Water (no delivery)• Mass Wasting
“Non-Natural”• Grassland Agriculture• Grassland Permanent• Urban• Mass Wasting (originating
from road or harvested area)• Harvest• Roads• Road Crossings• Fire

ParsonsParsons
SEDIMENT MODELING/ESTIMATION SEDIMENT MODELING/ESTIMATION TECHNIQUESTECHNIQUES
• Sediment yield coefficients for forestland, shrubland, and urban areas.
• RUSLE 2 estimated erosion from agricultural and permanent grassland.

ParsonsParsons
SEDIMENT MODELING/ESTIMATION SEDIMENT MODELING/ESTIMATION TECHNIQUESTECHNIQUES
• Best professional judgment was used to estimate stream erosion due to narrowing of the stream channel near roadways.
• McGreer Relationship approximated erosion from roads, other than at stream crossings.
• WEPP Roads calculated erosion from roads at stream crossings.
ParsonsParsons
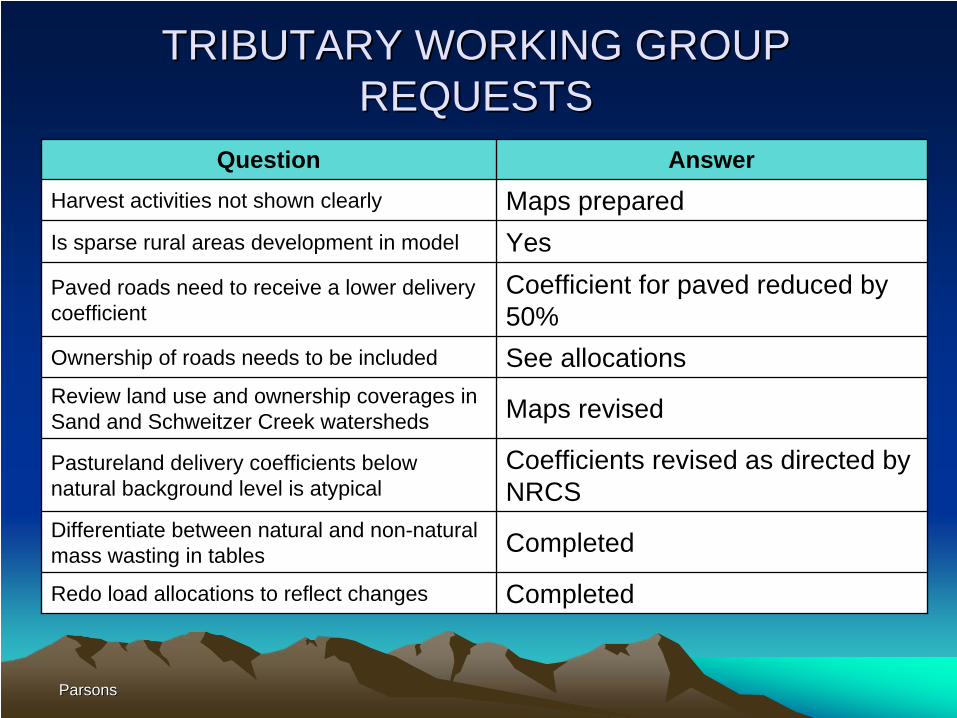
TRIBUTARY WORKING GROUP TRIBUTARY WORKING GROUP REQUESTSREQUESTS
Question AnswerHarvest activities not shown clearly Maps preparedIs sparse rural areas development in model YesPaved roads need to receive a lower delivery coefficient
Coefficient for paved reduced by 50%
Ownership of roads needs to be included See allocationsReview land use and ownership coverages in Sand and Schweitzer Creek watersheds Maps revised
Pastureland delivery coefficients below natural background level is atypical
Coefficients revised as directed by NRCS
Differentiate between natural and non-natural mass wasting in tables Completed
Redo load allocations to reflect changes Completed

ParsonsParsons
LAND USE/LAND COVER REVISIONSLAND USE/LAND COVER REVISIONS

ParsonsParsons
LAND USE/LAND COVER REVISIONSLAND USE/LAND COVER REVISIONS
Watershed Landuse Acres Percent of Total
Gold Creek (Pack River) Grassland Agriculture 1,058 13.7%
North Gold Creek Grassland Permanent 28 0.3%
Rapid Lightning Creek Grassland Agriculture 487 1.6%
Sand Creek & Grassland Agriculture 3,124 12.9%
Schweitzer Creek Grassland Permanent 2,172 9.0%
Upper Pack River Grassland Permanent 4,061 8.4%

ParsonsParsons
LOAD CAPACITY SUMMARYLOAD CAPACITY SUMMARY
Watershed Load Type
Watershed Area
(acres)
Estimated Existing
Load(tons/year)
Natural Background
Load(tons/year)
Load Capacity at 42% above
Background1
(tons/year)
Gold Creek Sediment 7,747 390 181 257North Gold Creek Sediment 10,519 762 246 349Rapid Lightning Creek Sediment 30,985 1,0142 717 1,018Schweitzer CreekSand Creek Sediment 24,209 2,039 562 798
Upper Pack River Sediment 48,467 2,309 970 1,3771 Load capacity=natural background x 1.422 No TMDL is required since Existing Sediment Load is less than Load
Capacity.

ParsonsParsons
ESTIMATED SEDIMENT LOAD ESTIMATED SEDIMENT LOAD REDUCTIONS BY WATERSHEDREDUCTIONS BY WATERSHED
WatershedWatershed
Area (acres)
a b (a-b) (a-b)/a x 100
Estimated Existing
Load (tons/year)
Load Capacity at 42% above
Background (tons/year)
Required Sediment
Load Reduction(tons/year)
Percent Load
ReductionRequired
Gold Creek 7,747 390 257 133 34%
North Gold Creek 10,519 762 349 412* 54%
Sand and Schweitzer Creeks 24,209 2,039 798 1,241 61%
Upper Pack River 48,467 2,309 1,364 945 41%
Rapid Lightning Creek 30,985 1,014 1,018 0** 0%**
*Value varies from difference between column “a” and column “b” due to rounding error. ** Sediment determined not to be a pollutant of concern based on model.

ParsonsParsons
ESTIMATED ANNUAL AVERAGE EXISTING ESTIMATED ANNUAL AVERAGE EXISTING SEDIMENT LOADS BY LAND TYPESEDIMENT LOADS BY LAND TYPE
Land Type
EXISTING SEDIMENT LOAD1 (tons/year)
GoldCreek
NorthGoldCreek
RapidLightning
Creek
Sand andSchweitzer
Creek
UpperPackRiver
Forest2 151 210 690 376 584
Forest - Harvested 0 435 4 0 398
Forest - Burned 0 0 0 0 0
Grassland-Agriculture 170 0 78 406 0
Grassland-Permanent 0 3 0 261 386
Shrubland2 3 1 13 18 241
Urban 18 2 9 465 23
Unpaved Roads 31 72 108 347 255
Paved Roads 0 0 0 73 0
Mass Wasting-Natural2 0 0 0 0 34
Mass Wasting- Anthropogenic 0 0 0 0 296
Road Encroachment 17 39 112 93 92
Total Existing Load 390 762 1,014 2,039 2,309
1 Existing Sediment Load = Natural Background Load + Non-natural Nonpoint Sources Load 2 Sediment sources defined as natural.

ParsonsParsons
LOAD ALLOCATIONS BY LAND LOAD ALLOCATIONS BY LAND MANAGER FOR GOLD CREEKMANAGER FOR GOLD CREEK
SEDIMENT LOAD REDUCTION ALLOCATION (tons/year)GOLD CREEK
Private 124
City 0County 5
State 0BLM 0Military 0
USFS 4

ParsonsParsons
LOAD ALLOCATIONS BY LAND MANAGER LOAD ALLOCATIONS BY LAND MANAGER FOR NORTH GOLD CREEKFOR NORTH GOLD CREEK
SEDIMENT LOAD REDUCTION ALLOCATION (tons/year)NORTH GOLD CREEK
Private 1City 0County 0State 0
USFS 411
BLM 0Military 0

ParsonsParsons
LOAD ALLOCATION BY LAND MANAGER LOAD ALLOCATION BY LAND MANAGER FOR SAND AND SCHWEITZER CREEKSFOR SAND AND SCHWEITZER CREEKS
SEDIMENT LOAD REDUCTION ALLOCATION (tons/year)SAND AND SCHWEITZER CREEKS
Private 1,075
City 55County 45
State - IDL 29State - ITD 22
USFS 0BLM 15
Military 0

ParsonsParsons
LOAD ALLOCATION BY LAND MANAGER LOAD ALLOCATION BY LAND MANAGER FOR UPPER PACK RIVERFOR UPPER PACK RIVER
SEDIMENT LOAD REDUCTION ALLOCATION (tons/year)UPPER PACK RIVER AT BURP STATION 1994SCDAA008
Private 118City 0County 9State 3
USFS 814
BLM 1Military 0

ParsonsParsons
LOAD ALLOCATIONS BY LAND USE FOR LOAD ALLOCATIONS BY LAND USE FOR GOLD CREEKGOLD CREEK
Land Type
Area AssociatedWith
AnthropogenicSediment Load
(acres)
AnthropogenicSediment
Load(tons/year)
Percentof
Load
SedimentLoad
Reduction(tons/year)
Grassland-Agriculture 1,058 169 72% 96Urban 72 18 8% 10Unpaved Roads - Road Crossing 0 9 4% 5Unpaved Roads - Within 200' 0 12 5% 7Unpaved Roads - Exceeding 200' 0 10 4% 6Road Encroachment 0 17 7% 10Total 1,129* 235 100% 133*
* Total value varies from sum of individual values due to rounding error.

ParsonsParsons
LOAD ALLOCATIONS BY LAND USE FORLOAD ALLOCATIONS BY LAND USE FOR NORTH GOLD CREEKNORTH GOLD CREEK
Land Type
Area AssociatedWith
AnthropogenicSediment Load
(acres)
AnthropogenicSediment
Load(tons/year)
Percentof
Load
SedimentLoad
Reduction(tons/year)
Forest - Harvested (04-06) 356 356 65% 267
Forest - Harvested (01-03) 491 49 9% 37
Forest - Harvested (97-00) 597 30 5% 22Grassland-Permanent 28 3 1% 2Urban 6 2 0% 1Unpaved Roads - Road Crossing 0 31 6% 23Unpaved Roads - Within 200' 0 27 5% 21Unpaved Roads - Exceeding 200' 0 13 2% 10Road Encroachment 0 39 7% 29Total 1,479* 550 100% 412
* Total value varies from sum of individual values due to rounding error.

ParsonsParsons
LOAD ALLOCATIONS BY LAND USE FORLOAD ALLOCATIONS BY LAND USE FOR SAND AND SCHWEITZER CREEKSSAND AND SCHWEITZER CREEKS
Land Type
Area AssociatedWith
AnthropogenicSediment Load
(acres)
AnthropogenicSediment
Load(tons/year)
Percentof
Load
SedimentLoad
Reduction(tons/year)
Grassland-Agriculture 3,124 406 25% 306
Grassland-Permanent 2,172 261 16% 197
Urban 1,862 465 28% 351Unpaved Roads - Road Crossing 0 252 15% 190Unpaved Roads - Within 200' 0 28 2% 21Unpaved Roads - Exceeding 200' 0 67 4% 51Paved Roads - Road Crossing 0 53 3% 40Paved Roads - Within 200' 0 5 0% 4Paved Roads - Exceeding 200' 0 15 1% 11Road Encroachment 0 93 6% 70Total 7,157* 1,645 100% 1,241
* Total value varies from sum of individual values due to rounding error.
ParsonsParsons
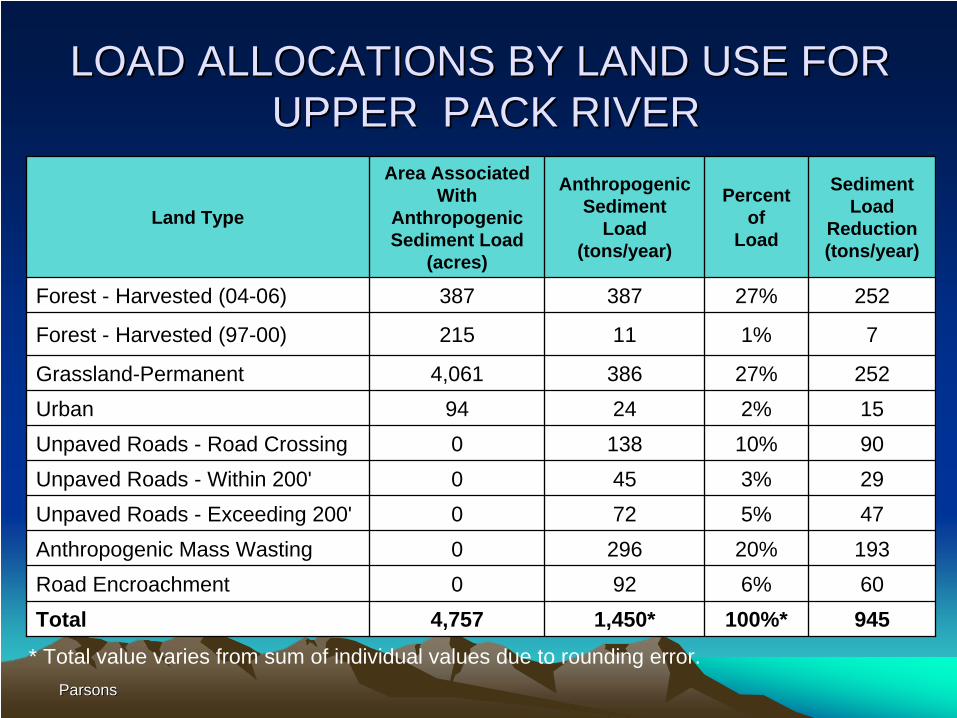
LOAD ALLOCATIONS BY LAND USE FOR LOAD ALLOCATIONS BY LAND USE FOR UPPER PACK RIVERUPPER PACK RIVER
Land Type
Area AssociatedWith
AnthropogenicSediment Load
(acres)
AnthropogenicSediment
Load(tons/year)
Percentof
Load
SedimentLoad
Reduction(tons/year)
Forest - Harvested (04-06) 387 387 27% 252
Forest - Harvested (97-00) 215 11 1% 7
Grassland-Permanent 4,061 386 27% 252Urban 94 24 2% 15Unpaved Roads - Road Crossing 0 138 10% 90Unpaved Roads - Within 200' 0 45 3% 29Unpaved Roads - Exceeding 200' 0 72 5% 47Anthropogenic Mass Wasting 0 296 20% 193Road Encroachment 0 92 6% 60Total 4,757 1,450* 100%* 945
* Total value varies from sum of individual values due to rounding error.

ParsonsParsons
DiscussionDiscussion