pefcr for beer - ec.europa.euec.europa.eu/environment/eussd/smgp/pdf/beer pefcr june 2018...
TRANSCRIPT

Page | 1
PEFCR for Beer
Note: the text included in italics in each section shall not be modified when drafting the PEFCR. Further text
can be added if relevant.
The order of sections and their titles shall not be modified.
FINAL version (post positive opinion of the EF Steering Committee on 18 April 2018)
June 2018
Date of expiration: 31st of December 2020 (validity of secondary datasets accompanying this PEFCR).
Page | 2
Contents
ACRONYMS 4
DEFINITIONS 5
1 INTRODUCTION 13
2 GENERAL INFORMATION ABOUT THE PEFCR 14
2.1 TECHNICAL SECRETARIAT 14
2.2 CONSULTATIONS AND STAKEHOLDERS 15
2.3 REVIEW PANEL AND REVIEW REQUIREMENTS 17
2.4 REVIEW STATEMENT 17
2.5 GEOGRAPHIC VALIDITY 18
2.6 LANGUAGE 18
2.7 CONFORMANCE TO OTHER DOCUMENTS 18
3 PEFCR SCOPE 19
3.1 PRODUCT CLASSIFICATION 19
3.2 REPRESENTATIVE PRODUCT(S) 19
3.3 FUNCTIONAL UNIT AND REFERENCE FLOW 24
3.4 SYSTEM BOUNDARY 25
3.5 EF IMPACT ASSESSMENT 28
3.6 LIMITATIONS 30
4 SUMMARY OF MOST RELEVANT IMPACT CATEGORIES, LIFE CYCLE STAGES AND PROCESSES 31
5 LIFE CYCLE INVENTORY 37
5.1 LIST OF MANDATORY COMPANY-SPECIFIC DATA 37
5.2 DATA GAPS 38
5.3 DATA QUALITY REQUIREMENTS 38
5.4 COMPANY-SPECIFIC DATASETS 39
5.5 DATA NEEDS MATRIX (DNM) 41
5.6 PROCESSES IN SITUATION 1 43
5.7 PROCESSES IN SITUATION 2 43
5.8 PROCESSES IN SITUATION 3 45
Page | 3
5.9 WHICH DATASETS TO USE? 45
5.10 HOW TO CALCULATE THE AVERAGE DQR OF THE STUDY 46
5.11 ALLOCATION RULES 46
5.12 ELECTRICITY MODELLING 47
5.13 CLIMATE CHANGE MODELLING 50
5.14 MODELLING OF WASTES AND RECYCLED CONTENT 52
6 LIFE CYCLE STAGES 55
6.1 CULTIVATION OF GRAIN FOR MALTING 55
6.2 MALTING / OTHER RAW MATERIALS AND PROCESSING 55
6.3 PACKAGING AND MATERIAL PRODUCTION 56
6.3.1 REUSE RATES 60
6.4 AGRICULTURAL MODELLING 62
6.5 INBOUND DISTRIBUTION 65
6.6 BREWERY OPERATIONS / MANUFACTURING 66
6.7 DISTRIBUTION STAGE 67
6.8 USE STAGE 69
6.9 END OF LIFE 70
7 PEF RESULTS 74
7.1 BENCHMARK VALUES 74
7.2 PEF PROFILE 75
7.3 ADDITIONAL TECHNICAL INFORMATION 75
7.4 ADDITIONAL ENVIRONMENTAL INFORMATION 75
8 VERIFICATION 77
9 REFERENCES 79
10 ANNEX 80
ANNEX 1 - LIST OF EF NORMALISATION AND WEIGHTING FACTORS 80
ANNEX 2 - CHECK-LIST FOR PEF STUDY 83
ANNEX 3 - CRITICAL REVIEW REPORT 85
ANNEX 4 - OTHER ANNEXES 85
ANNEX 4.1 - SUPPORTING MATERIAL PEFCR FOR BEER FINAL VERSION - COMPANY SPECIFIC DATA 85
ANNEX 4.2 – SENSITIVITY ANALYSIS TO ALLOCATION CHOICES AT BREWERY FOR BREWERS’ GRAIN 85
Page | 4
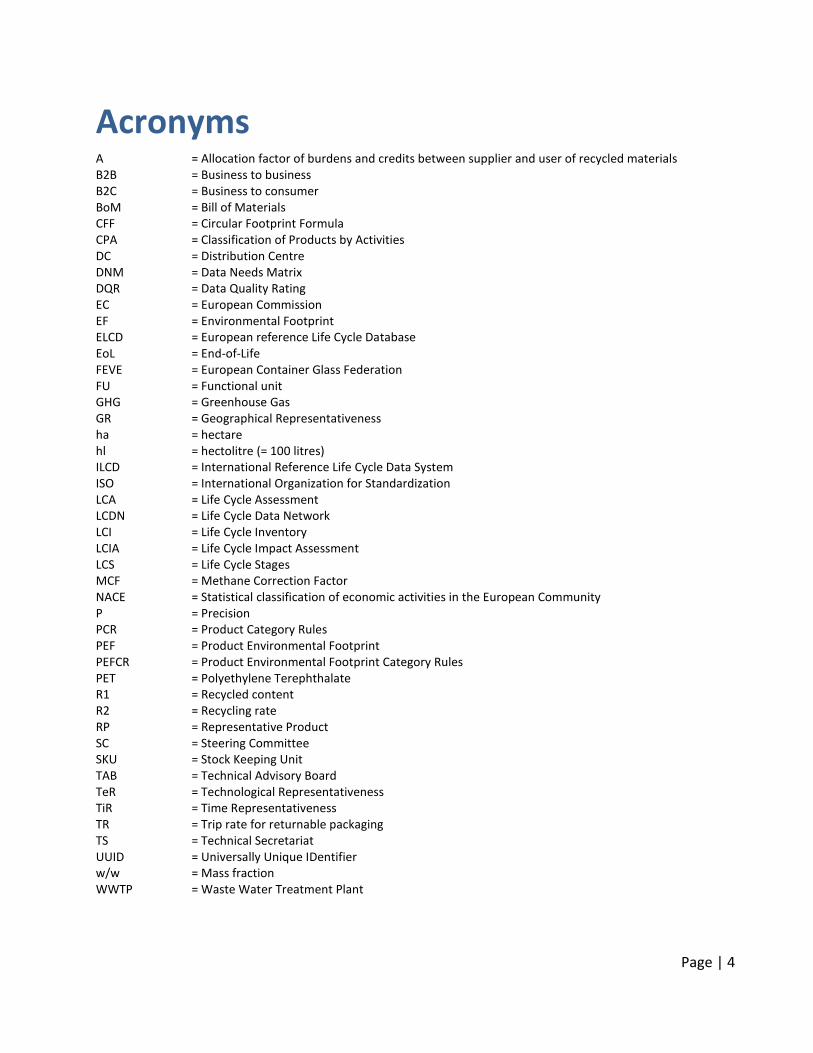
Acronyms A = Allocation factor of burdens and credits between supplier and user of recycled materials B2B = Business to business B2C = Business to consumer BoM = Bill of Materials CFF = Circular Footprint Formula CPA = Classification of Products by Activities DC = Distribution Centre DNM = Data Needs Matrix DQR = Data Quality Rating EC = European Commission EF = Environmental Footprint ELCD = European reference Life Cycle Database EoL = End-of-Life FEVE = European Container Glass Federation FU = Functional unit GHG = Greenhouse Gas GR = Geographical Representativeness ha = hectare hl = hectolitre (= 100 litres) ILCD = International Reference Life Cycle Data System ISO = International Organization for Standardization LCA = Life Cycle Assessment LCDN = Life Cycle Data Network LCI = Life Cycle Inventory LCIA = Life Cycle Impact Assessment LCS = Life Cycle Stages MCF = Methane Correction Factor NACE = Statistical classification of economic activities in the European Community P = Precision PCR = Product Category Rules PEF = Product Environmental Footprint PEFCR = Product Environmental Footprint Category Rules PET = Polyethylene Terephthalate R1 = Recycled content R2 = Recycling rate RP = Representative Product SC = Steering Committee SKU = Stock Keeping Unit TAB = Technical Advisory Board TeR = Technological Representativeness TiR = Time Representativeness TR = Trip rate for returnable packaging TS = Technical Secretariat UUID = Universally Unique IDentifier w/w = Mass fraction WWTP = Waste Water Treatment Plant
Page | 5
Definitions Activity data - This term refers to information which is associated with processes while modelling Life Cycle
Inventories (LCI). In the PEF Guide it is also called “non-elementary flows”. The aggregated LCI results of the
process chains that represent the activities of a process are each multiplied by the corresponding activity
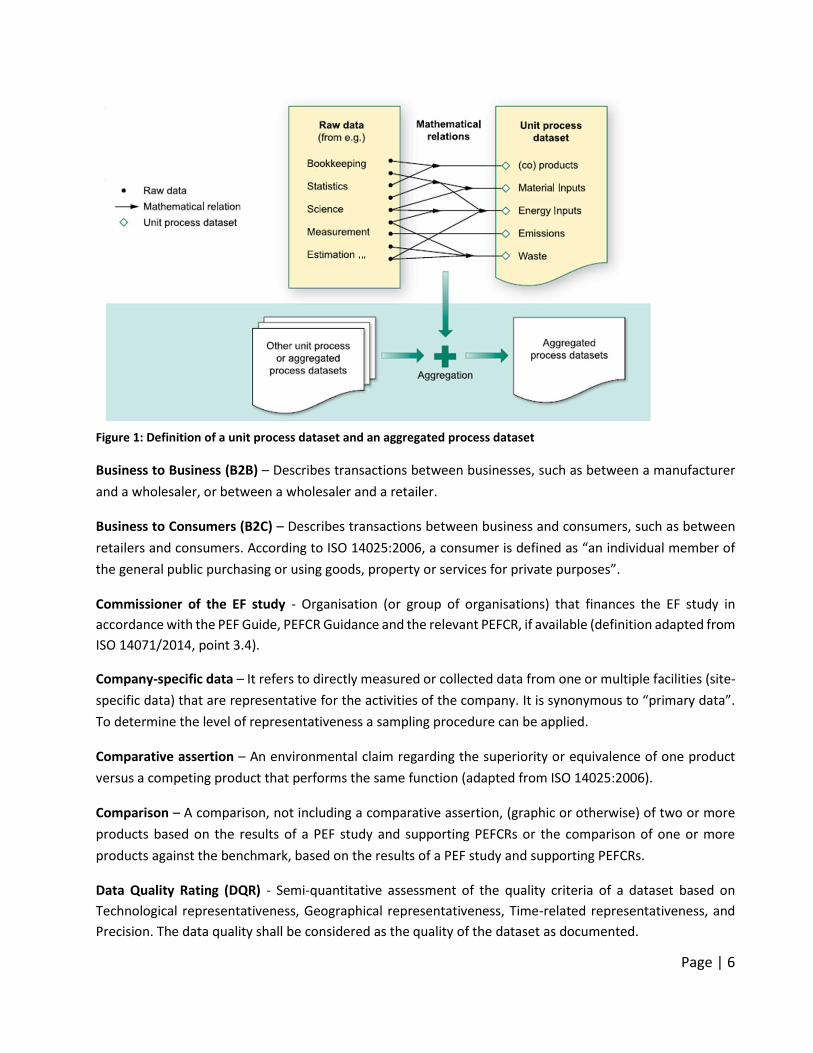
data1 and then combined to derive the environmental footprint associated with that process (See Figure 1).
Examples of activity data include quantity of kilowatt-hours of electricity used, quantity of fuel used, output
of a process (e.g. waste), number of hours equipment is operated, distance travelled, floor area of a building,
etc. In the context of PEF the amounts of ingredients from the bill of material (BOM) shall always be
considered as activity data.
Aggregated dataset - This term is defined as a life cycle inventory of multiple unit processes (e.g. material or
energy production) or life cycle stages (cradle-to-gate), but for which the inputs and outputs are provided
only at the aggregated level. Aggregated datasets are also called "LCI results", “cumulative inventory” or
“system processes” datasets. The aggregated dataset can have been aggregated horizontally and/or
vertically. Depending on the specific situation and modelling choices a "unit process" dataset can also be
aggregated. See Figure 12.
Application specific – It refers to the generic aspect of the specific application in which a material is used.
For example, the average recycling rate of PET in bottles.
Benchmark – A standard or point of reference against which any comparison can be made. In the context of
PEF, the term ‘benchmark’ refers to the average environmental performance of the representative product
sold in the EU market. A benchmark may eventually be used, if appropriate, in the context of communicating
environmental performance of a product belonging to the same category.
Bill of materials – A bill of materials or product structure (sometimes bill of material, BOM or associated list)
is a list of the raw materials, sub-assemblies, intermediate assemblies, sub-components, parts and the
quantities of each needed to manufacture an end product.
1 Based on GHG protocol scope 3 definition from the Corporate Accounting and Reporting Standard (World resources institute, 2011). 2 Source: UNEP/SETAC “Global Guidance Principles for LCA Databases"
Page | 6
Figure 1: Definition of a unit process dataset and an aggregated process dataset
Business to Business (B2B) – Describes transactions between businesses, such as between a manufacturer
and a wholesaler, or between a wholesaler and a retailer.
Business to Consumers (B2C) – Describes transactions between business and consumers, such as between
retailers and consumers. According to ISO 14025:2006, a consumer is defined as “an individual member of
the general public purchasing or using goods, property or services for private purposes”.
Commissioner of the EF study - Organisation (or group of organisations) that finances the EF study in
accordance with the PEF Guide, PEFCR Guidance and the relevant PEFCR, if available (definition adapted from
ISO 14071/2014, point 3.4).
Company-specific data – It refers to directly measured or collected data from one or multiple facilities (site-
specific data) that are representative for the activities of the company. It is synonymous to “primary data”.
To determine the level of representativeness a sampling procedure can be applied.
Comparative assertion – An environmental claim regarding the superiority or equivalence of one product
versus a competing product that performs the same function (adapted from ISO 14025:2006).
Comparison – A comparison, not including a comparative assertion, (graphic or otherwise) of two or more
products based on the results of a PEF study and supporting PEFCRs or the comparison of one or more
products against the benchmark, based on the results of a PEF study and supporting PEFCRs.
Data Quality Rating (DQR) - Semi-quantitative assessment of the quality criteria of a dataset based on
Technological representativeness, Geographical representativeness, Time-related representativeness, and
Precision. The data quality shall be considered as the quality of the dataset as documented.
Page | 7
Direct elementary flows (also named elementary flows) – All output emissions and input resource use that
arise directly in the context of a process. Examples are emissions from a chemical process, or fugitive
emissions from a boiler directly onsite. See Figure 2.
Disaggregation – The process that breaks down an aggregated dataset into smaller unit process datasets
(horizontal or vertical). The disaggregation can help making data more specific. The process of disaggregation
should never compromise or threat to compromise the quality and consistency of the original aggregated
dataset
EF communication vehicles – It includes all the possible ways that can be used to communicate the results
of the EF study to the stakeholders. The list of EF communication vehicles includes, but it is not limited to,
labels, environmental product declarations, green claims, websites, infographics, etc.
EF report – Document that summarises the results of the EF study. For the EF report the template provided
as annex to the PECFR Guidance shall be used. In case the commissioner of the EF study decides to
communicate the results of the EF study (independently from the communication vehicle used), the EF report
shall be made available for free through the commissioner’s website. The EF report shall not contain any
information that is considered as confidential by the commissioner, however the confidential information
shall be provided to the verifier(s).
EF study – Term used to identify the totality of actions needed to calculate the EF results. It includes the
modelling, the data collection, and the analysis of the results.
Electricity tracking3 – Electricity tracking is the process of assigning electricity generation attributes to
electricity consumption.
Elementary flow - Material or energy entering the system being studied that has been drawn from the
environment without previous human transformation, or material or energy leaving the system being
studied that is released into the environment without subsequent human transformation.
Environmental aspect – Element of an organization’s activities or products or services that interacts or can
interact with the environment (ISO 14001:2015)
External Communication – Communication to any interested party other than the commissioner or the
practitioner of the study.
Foreground elementary flows - Direct elementary flows (emissions and resources) for which access to
primary data (or company-specific information) is available.
Functional unit - The functional unit defines the qualitative and quantitative aspects of the function(s) and/or
service(s) that the Organisation being evaluated provides; the unit of analysis definition answers the
questions “what?”, “how much?”, “how well?”, and “for how long?” (European Commission, 2013).
3 https://ec.europa.eu/energy/intelligent/projects/en/projects/e-track-ii
Page | 8
Independent external expert – Competent person, not employed in a full-time or part-time role by the
commissioner of the EF study or the practitioner of the EF study, and not involved in defining the scope or
conducting the EF study (adapted from ISO 14071/2014, point 3.2).
Input flows – Product, material or energy flow that enters a unit process. Products and materials include raw
materials, intermediate products and co-products (ISO 14040:2006).
Intermediate product - An intermediate product is a product that requires further processing before it is
saleable to the final consumer.
Lead verifier – Verifier taking part in a verification team with additional responsibilities compared to the
other verifiers in the team.
Life Cycle Assessment (LCA) - Compilation and evaluation of the inputs, outputs and the potential
environmental impacts of a product system throughout its life cycle (ISO, 2006).
Life Cycle Inventory (LCI) - The combined set of exchanges of elementary, waste and product flows in a LCI
dataset.
Life Cycle Inventory (LCI) dataset - A document or file with life cycle information of a specified product or
other reference (e.g., site, process), covering descriptive metadata and quantitative life cycle inventory. A
LCI dataset could be a unit process dataset, partially aggregated or an aggregated dataset.
Life Cycle Impact Assessment (LCIA) - Stage of life cycle assessment aimed at understanding and evaluating
the magnitude and significance of the potential environmental impacts for a product system throughout the
life cycle of the product (ISO, 2006).
Material-specific – It refers to a generic aspect of a material. For example, the recycling rate of PET.
Output flows – Product, material or energy flow that leaves a unit process. Products and materials include
raw materials, intermediate products, co-products and releases (ISO 14040:2006).
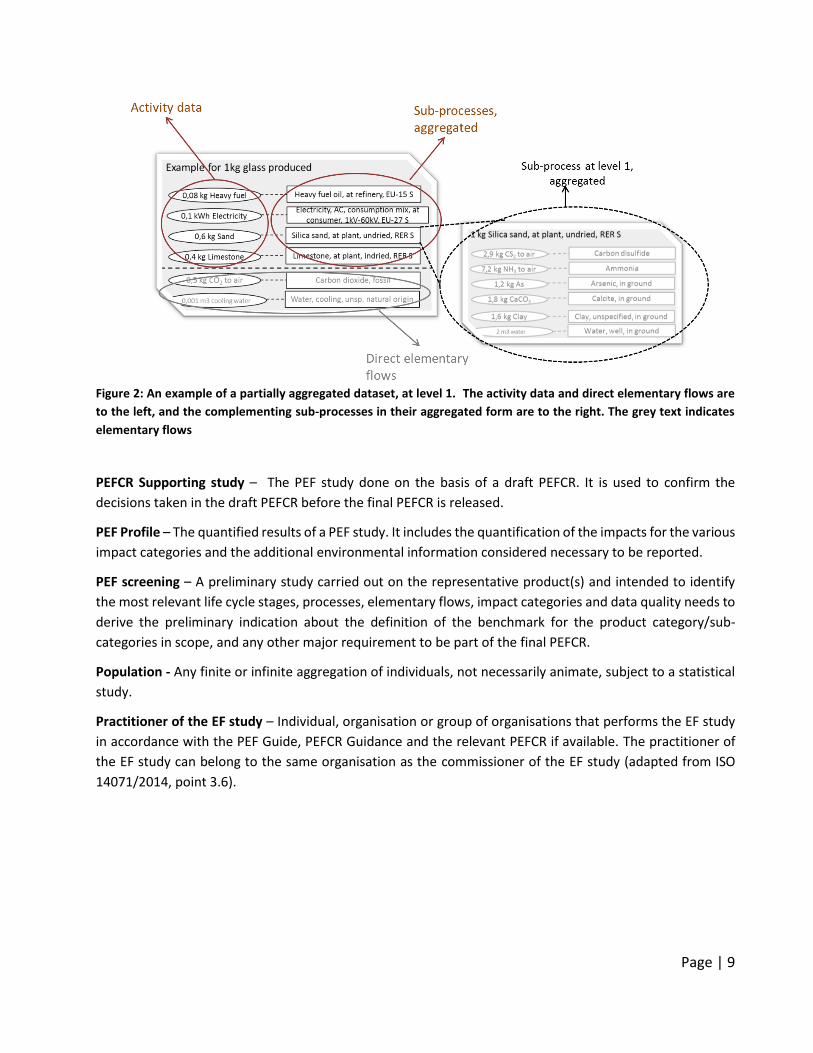
Partially disaggregated dataset - A dataset with a LCI that contains elementary flows and activity data, and
that only in combination with its complementing underlying datasets yield a complete aggregated LCI data
set. We refer to a partially disaggregated dataset at level 1 in case the LCI contains elementary flows and
activity data, while all complementing underlaying dataset are in their aggregated form (see an example in
Figure 2).
Page | 9
Figure 2: An example of a partially aggregated dataset, at level 1. The activity data and direct elementary flows are
to the left, and the complementing sub-processes in their aggregated form are to the right. The grey text indicates
elementary flows
PEFCR Supporting study – The PEF study done on the basis of a draft PEFCR. It is used to confirm the
decisions taken in the draft PEFCR before the final PEFCR is released.
PEF Profile – The quantified results of a PEF study. It includes the quantification of the impacts for the various
impact categories and the additional environmental information considered necessary to be reported.
PEF screening – A preliminary study carried out on the representative product(s) and intended to identify
the most relevant life cycle stages, processes, elementary flows, impact categories and data quality needs to
derive the preliminary indication about the definition of the benchmark for the product category/sub-
categories in scope, and any other major requirement to be part of the final PEFCR.
Population - Any finite or infinite aggregation of individuals, not necessarily animate, subject to a statistical
study.
Practitioner of the EF study – Individual, organisation or group of organisations that performs the EF study
in accordance with the PEF Guide, PEFCR Guidance and the relevant PEFCR if available. The practitioner of
the EF study can belong to the same organisation as the commissioner of the EF study (adapted from ISO
14071/2014, point 3.6).
Page | 10
Primary data4 - This term refers to data from specific processes within the supply-chain of the company
applying the PEFCR. Such data may take the form of activity data, or foreground elementary flows (life cycle
inventory). Primary data are site-specific, company-specific (if multiple sites for the same product) or supply-
chain-specific. Primary data may be obtained through meter readings, purchase records, utility bills,
engineering models, direct monitoring, material/product balances, stoichiometry, or other methods for
obtaining data from specific processes in the value chain of the company applying the PEFCR. In this
Guidance, primary data is synonym of "company-specific data" or "supply-chain specific data".
Primary packaging - Primary Packaging constitutes the packaging designed to come into direct contact with
the product (The Consumer Goods Forum, 2011).
Product category – Group of products (or services) that can fulfil equivalent functions (ISO 14025:2006).
Product Category Rules (PCR) – Set of specific rules, requirements and guidelines for developing Type III
environmental declarations for one or more product categories (ISO 14025:2006).
Product Environmental Footprint Category Rules (PEFCRs) – Product category-specific, life-cycle-based rules
that complement general methodological guidance for PEF studies by providing further specification at the
level of a specific product category. PEFCRs help to shift the focus of the PEF study towards those aspects
and parameters that matter the most, and hence contribute to increased relevance, reproducibility and
consistency of the results by reducing costs versus a study based on the comprehensive requirements of the
PEF guide.
Refurbishment – It is the process of restoring components to a functional and/or satisfactory state to the
original specification (providing the same function), using methods such as resurfacing, repainting, etc.
Refurbished products may have been tested and verified to function properly.
Representative product (model) - The “representative product” may or may not be a real product that one
can buy on the EU market. Especially when the market is made up of different technologies, the
“representative product” can be a virtual (non-existing) product built, for example, from the average EU
sales-weighted characteristics of all technologies around. A PEFCR may include more than one representative
product if appropriate.
Secondary data5 - It refers to data not from specific process within the supply-chain of the company applying
the PEFCR. This refers to data that is not directly collected, measured, or estimated by the company, but
sourced from a third-party life-cycle-inventory database or other sources. Secondary data includes industry-
average data (e.g., from published production data, government statistics, and industry associations),
literature studies, engineering studies and patents, and can also be based on financial data, and contain
proxy data, and other generic data. Primary data that go through a horizontal aggregation step are
considered as secondary data.
4 Based on GHG protocol scope 3 definition from the Corporate Accounting and Reporting Standard (World resources institute, 2011). 5 Based on GHG protocol scope 3 definition from the Corporate Accounting and Reporting Standard (World resources institute, 2011).
Page | 11
Secondary packaging - Secondary packaging groups a given number of primary packaging units together into
a convenient unit at the point of sale. Secondary packaging typically has one or two roles: it can be a
convenient means to replenish the shelves; or it can group primary packaging units into a package for
purchase. It can be removed without affecting the product’s properties, and generally defines the unit
handled by the retailer (The Consumer Goods Forum, 2011).
Site-specific data – It refers to directly measured or collected data from one facility (production site). It is
synonymous to “primary data”.
Stock Keeping Unit (SKU) - Warehousing item that is unique because of some characteristic (such as brand,
size, colour, model). Every SKU is assigned a unique identification number which is often the same as (or is
tied to) the item's EAN or UPC.
Sub-processes - Those processes used to represent the activities of the level 1 processes (=building blocks).
Sub-processes can be presented in their (partially) aggregated form (see Figure 2).
Supply-chain – It refers to all the upstream and downstream activities associated with the operations of the
company applying the PEFCR, including the use of sold products by consumers and the end-of-life treatment
of sold products after consumer use.
Supply-chain specific – It refers to a specific aspect of the specific supply-chain of a company. For example,
the recycled content value of an aluminium can produced by a specific company.
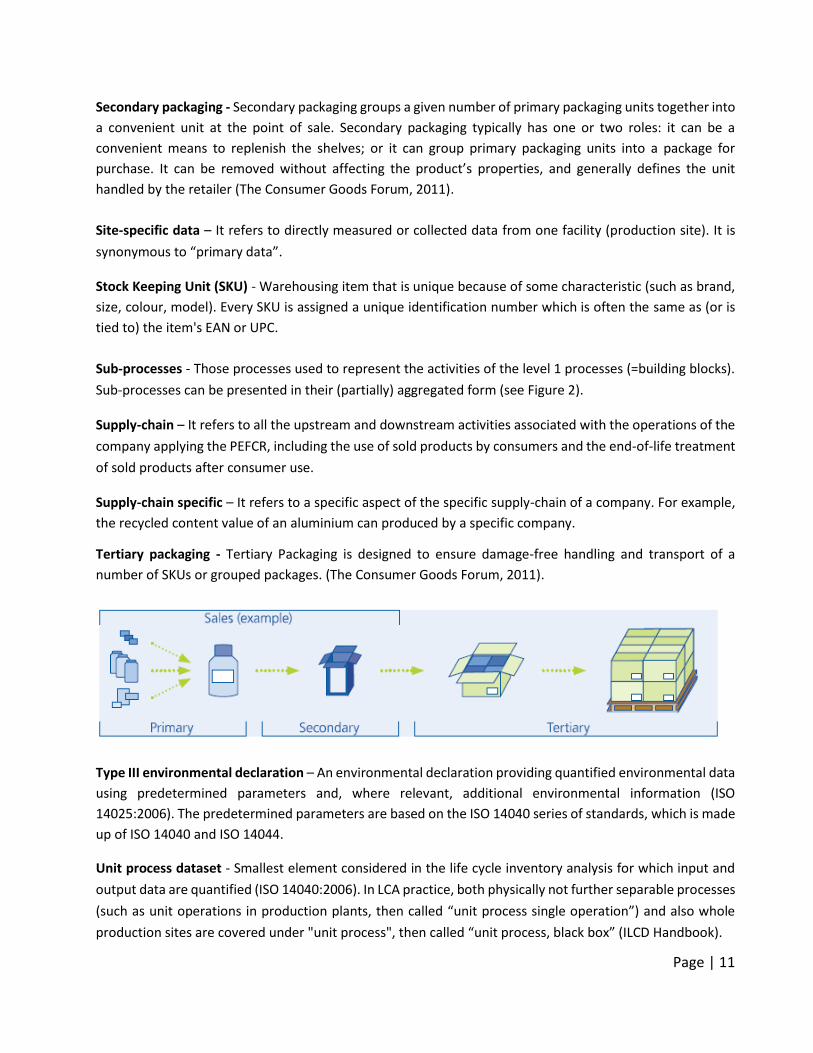
Tertiary packaging - Tertiary Packaging is designed to ensure damage-free handling and transport of a
number of SKUs or grouped packages. (The Consumer Goods Forum, 2011).
Type III environmental declaration – An environmental declaration providing quantified environmental data
using predetermined parameters and, where relevant, additional environmental information (ISO
14025:2006). The predetermined parameters are based on the ISO 14040 series of standards, which is made
up of ISO 14040 and ISO 14044.
Unit process dataset - Smallest element considered in the life cycle inventory analysis for which input and
output data are quantified (ISO 14040:2006). In LCA practice, both physically not further separable processes
(such as unit operations in production plants, then called “unit process single operation”) and also whole
production sites are covered under "unit process", then called “unit process, black box” (ILCD Handbook).

Page | 12
Verification team – Team of verifiers that will perform the verification of the EF study, of the EF report and
the EF communication vehicles.
Verifier – Independent external expert performing a verification of the EF study and eventually taking part
in a verification team.
Page | 13
1 Introduction The Product Environmental Footprint (PEF) Guide provides detailed and comprehensive technical guidance
on how to conduct a PEF study. PEF studies may be used for a variety of purposes, including in-house
management and participation in voluntary or mandatory programmes.
For all requirements not specified in this PEFCR the applicant shall refer to the PEF guidance 6.3.
The compliance with the present PEFCR is optional for PEF in-house applications, whilst it is mandatory
whenever the results of a PEF study or any of its content is intended to be communicated.
Terminology: shall, should and may
This PEFCR uses precise terminology to indicate the requirements, the recommendations and options that
could be chosen when a PEF study is conducted.
● The term “shall” is used to indicate what is required in order for a PEF study to be in conformance
with this PEFCR.
● The term “should” is used to indicate a recommendation rather than a requirement. Any deviation
from a “should” requirement has to be justified when developing the PEF study and made
transparent.
● The term “may” is used to indicate an option that is permissible. Whenever options are available, the
PEF study shall include adequate argumentation to justify the chosen option.
Page | 14
2 General information about the PEFCR 2.1. Technical secretariat
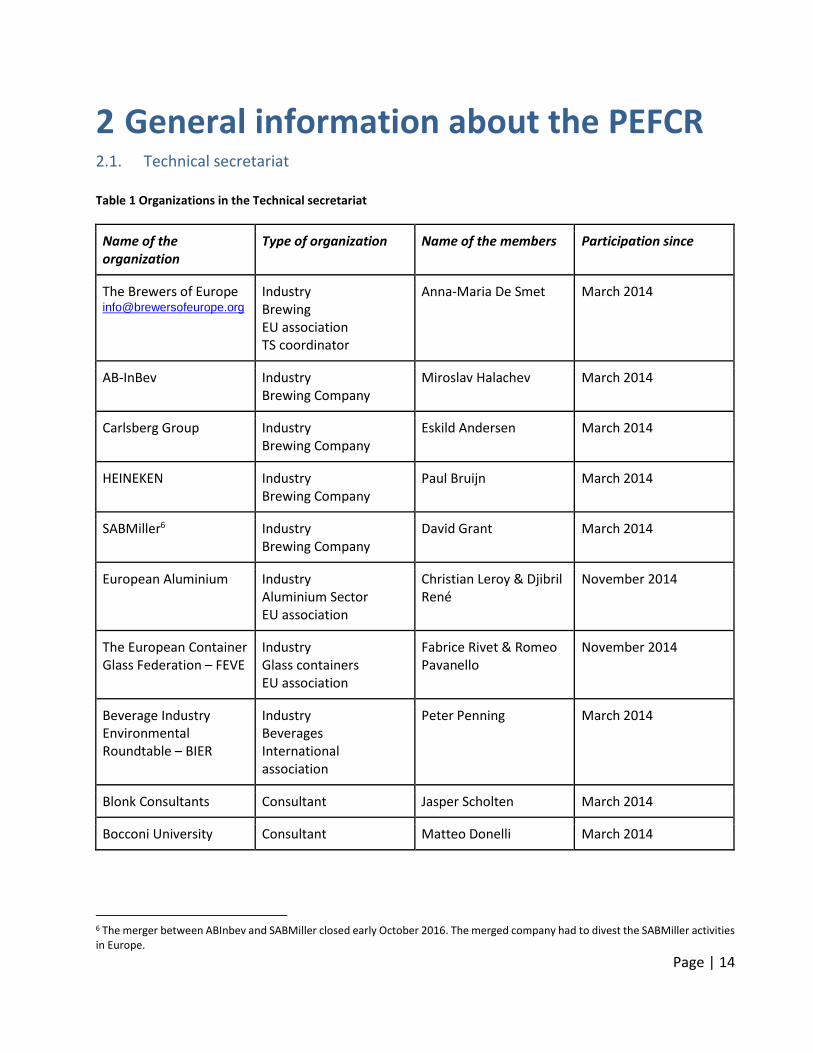
Table 1 Organizations in the Technical secretariat
Name of the organization
Type of organization Name of the members Participation since
The Brewers of Europe [email protected]
Industry Brewing EU association TS coordinator
Anna-Maria De Smet March 2014
AB-InBev Industry Brewing Company
Miroslav Halachev March 2014
Carlsberg Group Industry Brewing Company
Eskild Andersen March 2014
HEINEKEN Industry Brewing Company
Paul Bruijn March 2014
SABMiller6 Industry Brewing Company
David Grant March 2014
European Aluminium Industry Aluminium Sector EU association
Christian Leroy & Djibril René
November 2014
The European Container Glass Federation – FEVE
Industry Glass containers EU association
Fabrice Rivet & Romeo Pavanello
November 2014
Beverage Industry Environmental Roundtable – BIER
Industry Beverages International association
Peter Penning March 2014
Blonk Consultants Consultant Jasper Scholten March 2014
Bocconi University Consultant Matteo Donelli March 2014
6 The merger between ABInbev and SABMiller closed early October 2016. The merged company had to divest the SABMiller activities in Europe.

Page | 15
2.2. Consultations and stakeholders
This PEFCR has been developed in a transparent manner and the different steps were made available on the
dedicated wiki page of the EU pilots’ website:
https://webgate.ec.europa.eu/fpfis/wikis/display/EUENVFP/Stakeholder+workspace%3A+PEFCR+pilot+Beer
The Technical Secretariat of the Beer PEF pilot has on several occasions invited relevant stakeholders to
participate in the PEFCR development. The relevant stakeholders for the PEFCR development include,
amongst others, representatives from suppliers, farm and trade associations, consumers, government
representatives, non-governmental organizations (NGOs), public agencies, independent parties and
certification bodies. The identified relevant stakeholders were proactively informed by the Technical
Secretariat about the opportunity to take part in the different public consultations.
The first public virtual consultation on the draft scope and representative product was performed from 15
September 2014 to 31 October 2014. The 1st physical consultation was held on 26 September 2014 and
resulted in the report “PEF Pilot Beer; Draft Scope and Representative Product” (The Brewers of Europe,
2014) which was accepted by the Steering Committee on 16 December 2014.
The screening study and draft PEFCR were part of the 2nd open virtual consultation which was held from 15
September 2015 to 18 October 2015. The draft PEFCR was accepted in the Steering Committee of 19 January
2016. Notwithstanding, the supporting studies could only be started once:
• the draft PEFCR was updated to include the comments and commitments made during the Steering
Committee meeting; and
• missing information needed to perform the supporting studies (e.g., the list of all datasets to be
used) had been shared with the European Commission.
On 21 March 2016 the European Commission provided the green light to the Beer PEF Pilot to embark on
the next step in the process. Based on the updated PEFCR, 8 SKU’s in 3 supporting studies were investigated.
The supporting studies were finalized in July 2016.
The feedback from these supporting studies is integrated in this draft PEFCR which went to a third (final)
public virtual consultation from 2 August 2016 until 15 September 2016.
Page | 16
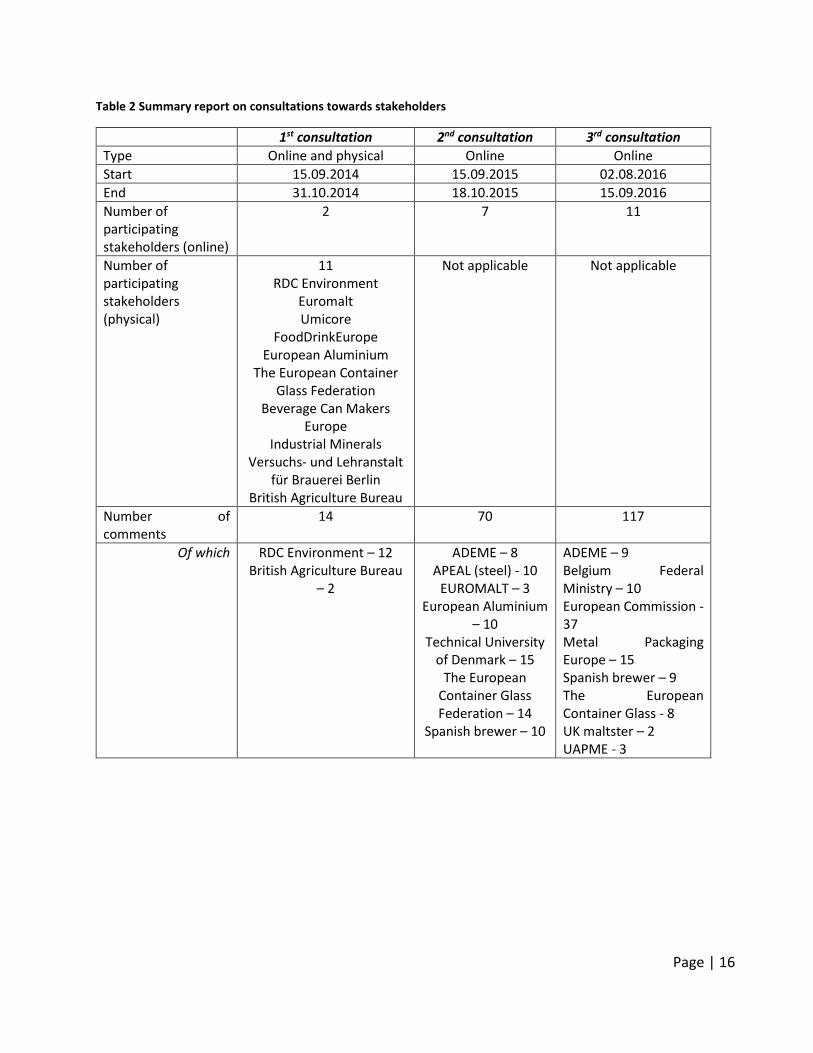
Table 2 Summary report on consultations towards stakeholders
1st consultation 2nd consultation 3rd consultation
Type Online and physical Online Online
Start 15.09.2014 15.09.2015 02.08.2016
End 31.10.2014 18.10.2015 15.09.2016
Number of participating stakeholders (online)
2
7 11
Number of participating stakeholders (physical)
11 RDC Environment
Euromalt Umicore
FoodDrinkEurope European Aluminium
The European Container Glass Federation
Beverage Can Makers Europe
Industrial Minerals Versuchs- und Lehranstalt
für Brauerei Berlin British Agriculture Bureau
Not applicable Not applicable
Number of comments
14 70 117
Of which RDC Environment – 12 British Agriculture Bureau
– 2
ADEME – 8 APEAL (steel) - 10
EUROMALT – 3 European Aluminium
– 10 Technical University
of Denmark – 15 The European
Container Glass Federation – 14
Spanish brewer – 10
ADEME – 9 Belgium Federal Ministry – 10 European Commission - 37 Metal Packaging Europe – 15 Spanish brewer – 9 The European Container Glass - 8 UK maltster – 2 UAPME - 3
Page | 17
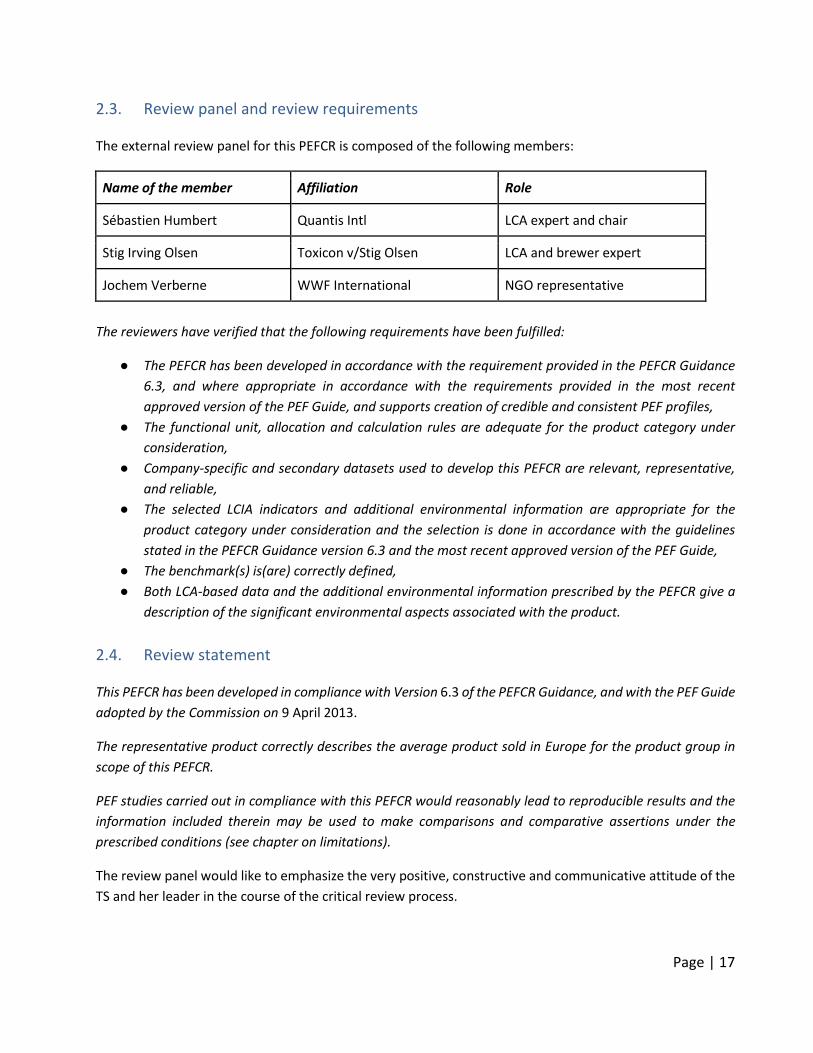
2.3. Review panel and review requirements The external review panel for this PEFCR is composed of the following members:
Name of the member Affiliation Role
Sébastien Humbert Quantis Intl LCA expert and chair
Stig Irving Olsen Toxicon v/Stig Olsen LCA and brewer expert
Jochem Verberne WWF International NGO representative
The reviewers have verified that the following requirements have been fulfilled:
● The PEFCR has been developed in accordance with the requirement provided in the PEFCR Guidance
6.3, and where appropriate in accordance with the requirements provided in the most recent
approved version of the PEF Guide, and supports creation of credible and consistent PEF profiles,
● The functional unit, allocation and calculation rules are adequate for the product category under
consideration,
● Company-specific and secondary datasets used to develop this PEFCR are relevant, representative,
and reliable,
● The selected LCIA indicators and additional environmental information are appropriate for the
product category under consideration and the selection is done in accordance with the guidelines
stated in the PEFCR Guidance version 6.3 and the most recent approved version of the PEF Guide,
● The benchmark(s) is(are) correctly defined,
● Both LCA-based data and the additional environmental information prescribed by the PEFCR give a
description of the significant environmental aspects associated with the product.
2.4. Review statement This PEFCR has been developed in compliance with Version 6.3 of the PEFCR Guidance, and with the PEF Guide
adopted by the Commission on 9 April 2013.
The representative product correctly describes the average product sold in Europe for the product group in
scope of this PEFCR.
PEF studies carried out in compliance with this PEFCR would reasonably lead to reproducible results and the
information included therein may be used to make comparisons and comparative assertions under the
prescribed conditions (see chapter on limitations).
The review panel would like to emphasize the very positive, constructive and communicative attitude of the
TS and her leader in the course of the critical review process.
Page | 18
2.5. Geographic validity This PEFCR is valid for products in scope consumed in the European Union + EFTA.
Each PEF study shall identify its geographical validity listing all the countries where the product object of the
PEF study is sold with the relative market share. In case the information on the market for the specific product
object of the study is not available, Europe +EFTA shall be considered as the default market, with an equal
market share for each country.
2.6. Language The PEFCR is written in English. The original in English supersedes translated versions in case of conflicts.
2.7. Conformance to other documents This PEFCR has been prepared in conformance with the following documents (in prevailing order):
- PEFCR Guidance 6.3.
- Product Environmental Footprint (PEF) Guide; Annex II to the Recommendation 2013/179/EU, 9 April
2013. Published in the Official Journal of the European Union Volume 56, 4 May 2013
Page | 19
3 PEFCR scope The main objective of this PEFCR is to develop a consistent set of rules to calculate the relevant
environmental impacts of beer.
3.1. Product classification The CPA code for the products included in this PEFCR is C11.0.5 - Manufacture of beer.
Beer is a beverage obtained as a result of a fermentation of a wort produced from water, a starch source –
generally provided through cereals (whether or not processed), hops (whether or not processed) and
possibly other carbohydrate matter. The CPA code includes;
- Manufacture of malt liquors, such as beer, ale, porter and stout.
- Manufacture of low alcohol or non-alcoholic beer.
3.2. Representative product(s)
The representative product (“weighted average beer recipe” in “average packaging”) was developed during
the screening phase. The screening study is available upon request to the TS coordinator that has the
responsibility of distributing it with an adequate disclaimer about its limitations7.
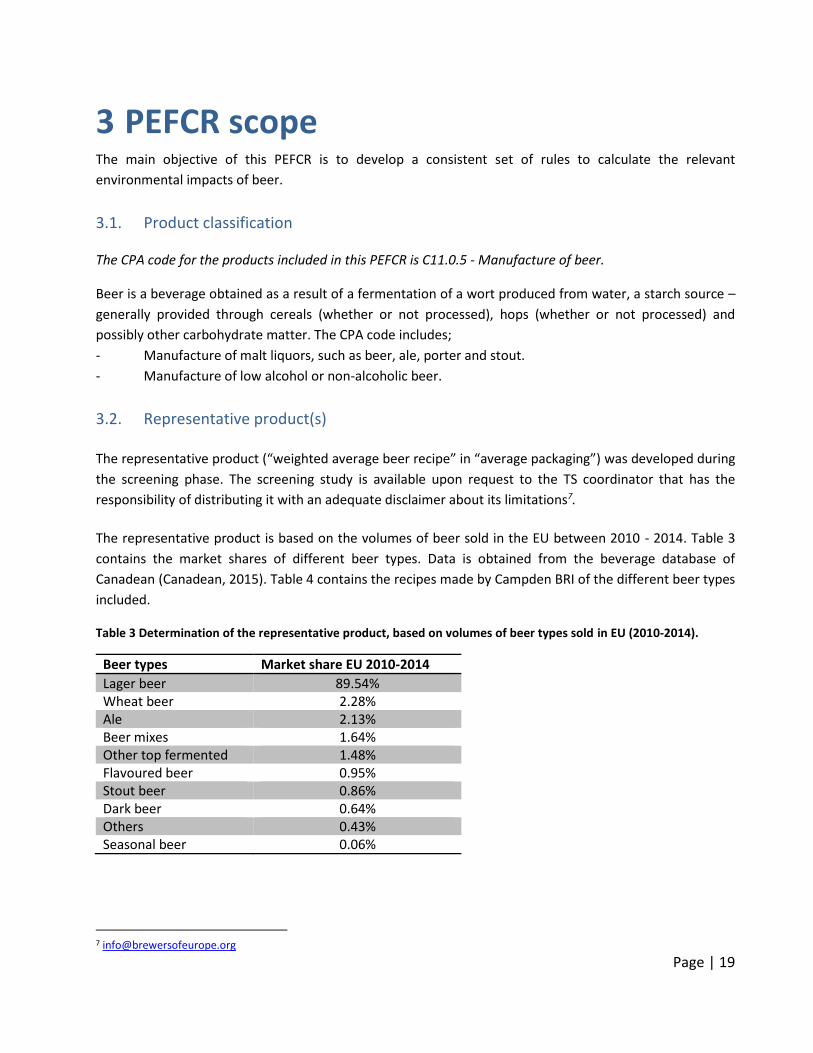
The representative product is based on the volumes of beer sold in the EU between 2010 - 2014. Table 3
contains the market shares of different beer types. Data is obtained from the beverage database of
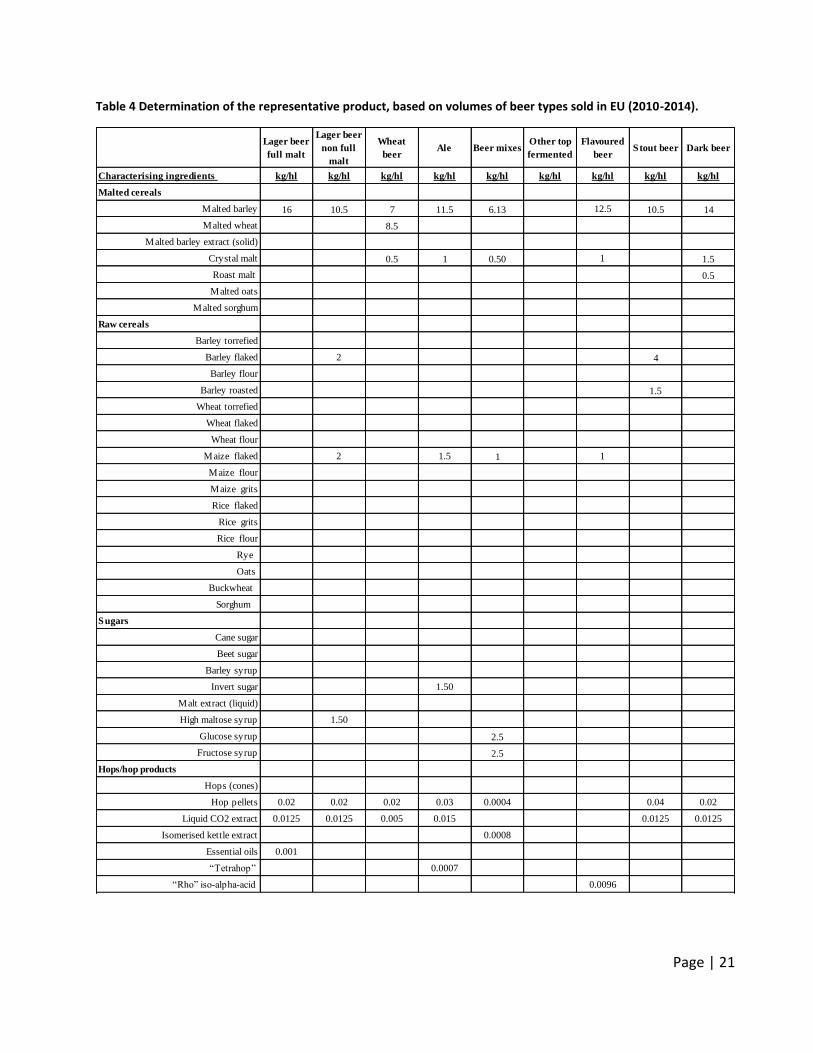
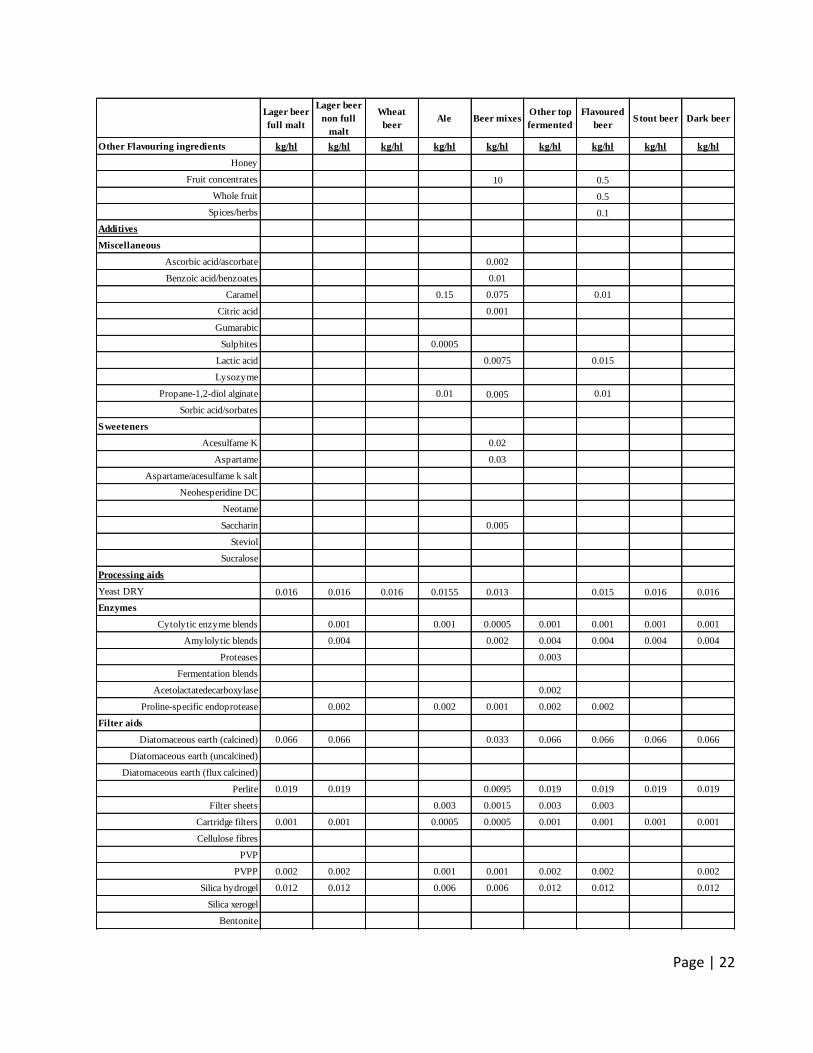
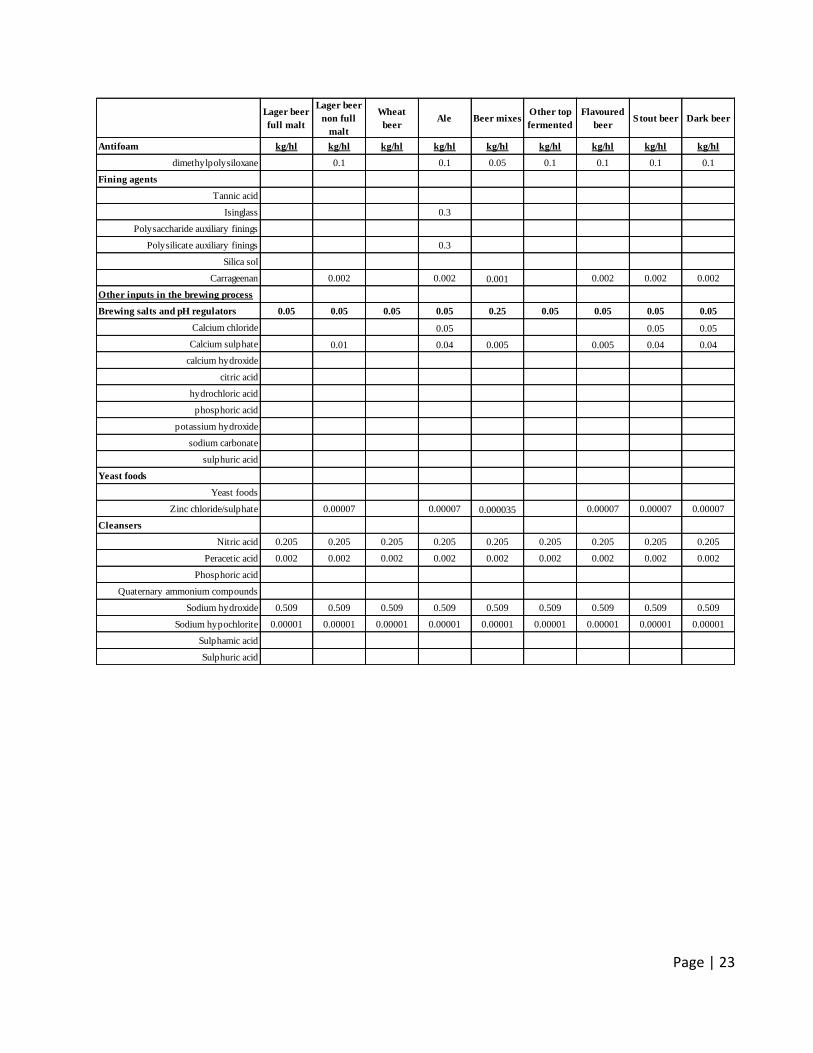
Canadean (Canadean, 2015). Table 4 contains the recipes made by Campden BRI of the different beer types
included.
Table 3 Determination of the representative product, based on volumes of beer types sold in EU (2010-2014).
Beer types Market share EU 2010-2014
Lager beer 89.54% Wheat beer 2.28% Ale 2.13% Beer mixes 1.64% Other top fermented 1.48% Flavoured beer 0.95% Stout beer 0.86% Dark beer 0.64% Others 0.43% Seasonal beer 0.06%
Page | 20
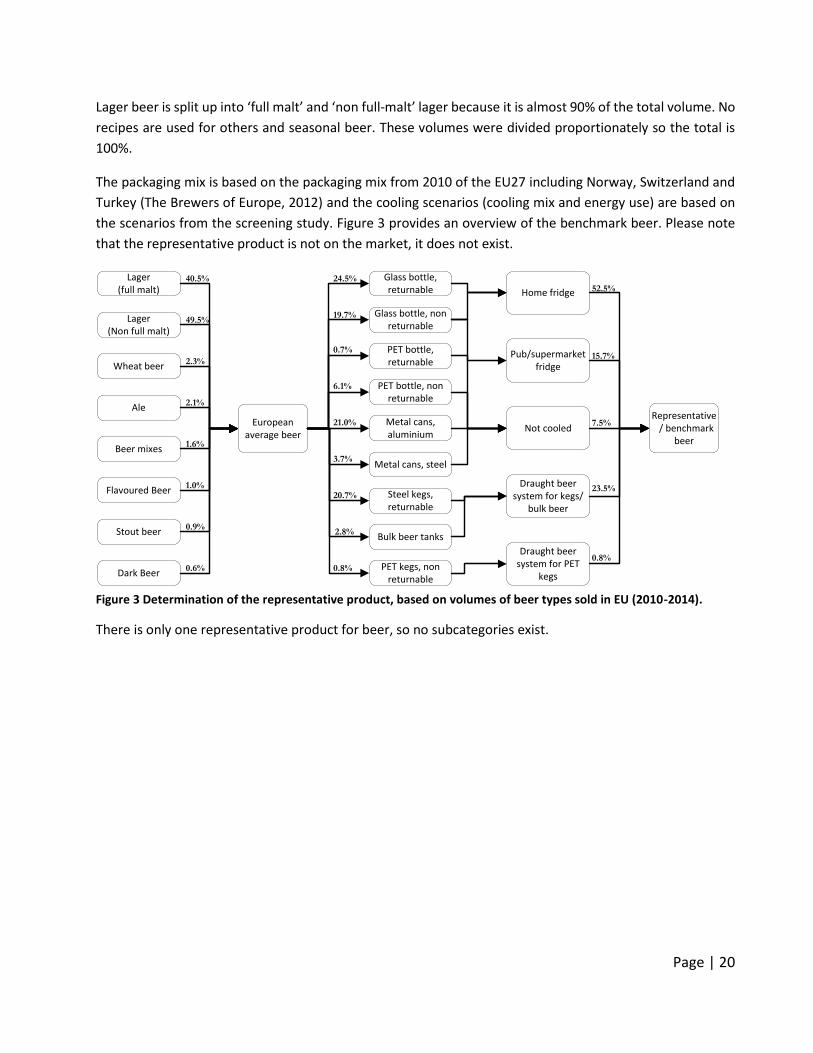
Lager beer is split up into ‘full malt’ and ‘non full-malt’ lager because it is almost 90% of the total volume. No
recipes are used for others and seasonal beer. These volumes were divided proportionately so the total is
100%.
The packaging mix is based on the packaging mix from 2010 of the EU27 including Norway, Switzerland and
Turkey (The Brewers of Europe, 2012) and the cooling scenarios (cooling mix and energy use) are based on
the scenarios from the screening study. Figure 3 provides an overview of the benchmark beer. Please note
that the representative product is not on the market, it does not exist.
Figure 3 Determination of the representative product, based on volumes of beer types sold in EU (2010-2014).
There is only one representative product for beer, so no subcategories exist.
Lager (full malt)
Lager(Non full malt)
Wheat beer
Ale
Beer mixes
Flavoured Beer
Stout beer
Dark Beer
European average beer
40.5%
49.5%
1.6%
2.1%
2.3%
1.0%
0.9%
0.6%
Glass bottle, returnable
Glass bottle, non returnable
PET bottle, returnable
PET bottle, non returnable
Metal cans, aluminium
Metal cans, steel
Steel kegs, returnable
Bulk beer tanks
PET kegs, non returnable
24.5%
19.7%
0.7%
6.1%
21.0%
3.7%
20.7%
0.8%
2.8%
Representative / benchmark
beer
Draught beer system for kegs/
bulk beer
Pub/supermarket fridge
Home fridge
Draught beer system for PET
kegs
Not cooled
52.5%
15.7%
7.5%
0.8%
23.5%
Page | 21
Table 4 Determination of the representative product, based on volumes of beer types sold in EU (2010-2014).
Lager beer
full malt
Lager beer
non full
malt
Wheat
beerAle Beer mixes
Other top
fermented
Flavoured
beerStout beer Dark beer
Characterising ingredients kg/hl kg/hl kg/hl kg/hl kg/hl kg/hl kg/hl kg/hl kg/hl
Malted cereals
Malted barley 16 10.5 7 11.5 6.13 12.5 10.5 14
Malted wheat 8.5
Malted barley extract (solid)
Crystal malt 0.5 1 0.50 1 1.5
Roast malt 0.5
Malted oats
Malted sorghum
Raw cereals
Barley torrefied
Barley flaked 2 4
Barley flour
Barley roasted 1.5
Wheat torrefied
Wheat flaked
Wheat flour
Maize flaked 2 1.5 1 1
Maize flour
Maize grits
Rice flaked
Rice grits
Rice flour
Rye
Oats
Buckwheat
Sorghum
Sugars
Cane sugar
Beet sugar
Barley syrup
Invert sugar 1.50
Malt extract (liquid)
High maltose syrup 1.50
Glucose syrup 2.5
Fructose syrup 2.5
Hops/hop products
Hops (cones)
Hop pellets 0.02 0.02 0.02 0.03 0.0004 0.04 0.02
Liquid CO2 extract 0.0125 0.0125 0.005 0.015 0.0125 0.0125
Isomerised kettle extract 0.0008
Essential oils 0.001
“Tetrahop” 0.0007
“Rho” iso-alpha-acid 0.0096
Page | 22
Lager beer
full malt
Lager beer
non full
malt
Wheat
beerAle Beer mixes
Other top
fermented
Flavoured
beerStout beer Dark beer
Other Flavouring ingredients kg/hl kg/hl kg/hl kg/hl kg/hl kg/hl kg/hl kg/hl kg/hl
Honey
Fruit concentrates 10 0.5
Whole fruit 0.5
Spices/herbs 0.1
Additives
Miscellaneous
Ascorbic acid/ascorbate 0.002
Benzoic acid/benzoates 0.01
Caramel 0.15 0.075 0.01
Citric acid 0.001
Gumarabic
Sulphites 0.0005
Lactic acid 0.0075 0.015
Lysozyme
Propane-1,2-diol alginate 0.01 0.005 0.01
Sorbic acid/sorbates
Sweeteners
Acesulfame K 0.02
Aspartame 0.03
Aspartame/acesulfame k salt
Neohesperidine DC
Neotame
Saccharin 0.005
Steviol
Sucralose
Processing aids
Yeast DRY 0.016 0.016 0.016 0.0155 0.013 0.015 0.016 0.016
Enzymes
Cytolytic enzyme blends 0.001 0.001 0.0005 0.001 0.001 0.001 0.001
Amylolytic blends 0.004 0.002 0.004 0.004 0.004 0.004
Proteases 0.003
Fermentation blends
Acetolactatedecarboxylase 0.002
Proline-specific endoprotease 0.002 0.002 0.001 0.002 0.002
Filter aids
Diatomaceous earth (calcined) 0.066 0.066 0.033 0.066 0.066 0.066 0.066
Diatomaceous earth (uncalcined)
Diatomaceous earth (flux calcined)
Perlite 0.019 0.019 0.0095 0.019 0.019 0.019 0.019
Filter sheets 0.003 0.0015 0.003 0.003
Cartridge filters 0.001 0.001 0.0005 0.0005 0.001 0.001 0.001 0.001
Cellulose fibres
PVP
PVPP 0.002 0.002 0.001 0.001 0.002 0.002 0.002
Silica hydrogel 0.012 0.012 0.006 0.006 0.012 0.012 0.012
Silica xerogel
Bentonite
Page | 23
Lager beer
full malt
Lager beer
non full
malt
Wheat
beerAle Beer mixes
Other top
fermented
Flavoured
beerStout beer Dark beer
Antifoam kg/hl kg/hl kg/hl kg/hl kg/hl kg/hl kg/hl kg/hl kg/hl
dimethylpolysiloxane 0.1 0.1 0.05 0.1 0.1 0.1 0.1
Fining agents
Tannic acid
Isinglass 0.3
Polysaccharide auxiliary finings
Polysilicate auxiliary finings 0.3
Silica sol
Carrageenan 0.002 0.002 0.001 0.002 0.002 0.002
Other inputs in the brewing process
Brewing salts and pH regulators 0.05 0.05 0.05 0.05 0.25 0.05 0.05 0.05 0.05
Calcium chloride 0.05 0.05 0.05
Calcium sulphate 0.01 0.04 0.005 0.005 0.04 0.04
calcium hydroxide
citric acid
hydrochloric acid
phosphoric acid
potassium hydroxide
sodium carbonate
sulphuric acid
Yeast foods
Yeast foods
Zinc chloride/sulphate 0.00007 0.00007 0.000035 0.00007 0.00007 0.00007
Cleansers
Nitric acid 0.205 0.205 0.205 0.205 0.205 0.205 0.205 0.205 0.205
Peracetic acid 0.002 0.002 0.002 0.002 0.002 0.002 0.002 0.002 0.002
Phosphoric acid
Quaternary ammonium compounds
Sodium hydroxide 0.509 0.509 0.509 0.509 0.509 0.509 0.509 0.509 0.509
Sodium hypochlorite 0.00001 0.00001 0.00001 0.00001 0.00001 0.00001 0.00001 0.00001 0.00001
Sulphamic acid
Sulphuric acid
Page | 24
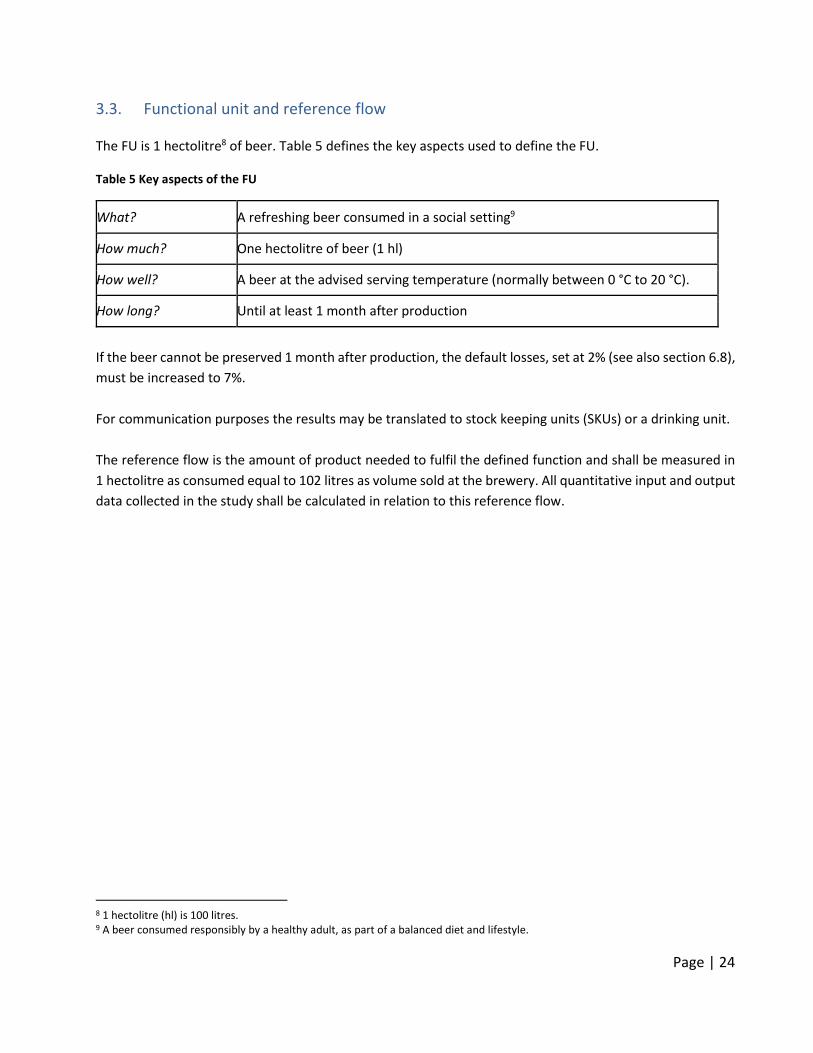
3.3. Functional unit and reference flow The FU is 1 hectolitre8 of beer. Table 5 defines the key aspects used to define the FU.
Table 5 Key aspects of the FU
What? A refreshing beer consumed in a social setting9
How much? One hectolitre of beer (1 hl)
How well? A beer at the advised serving temperature (normally between 0 °C to 20 °C).
How long? Until at least 1 month after production
If the beer cannot be preserved 1 month after production, the default losses, set at 2% (see also section 6.8),
must be increased to 7%.
For communication purposes the results may be translated to stock keeping units (SKUs) or a drinking unit.
The reference flow is the amount of product needed to fulfil the defined function and shall be measured in
1 hectolitre as consumed equal to 102 litres as volume sold at the brewery. All quantitative input and output
data collected in the study shall be calculated in relation to this reference flow.
8 1 hectolitre (hl) is 100 litres. 9 A beer consumed responsibly by a healthy adult, as part of a balanced diet and lifestyle.
Page | 25
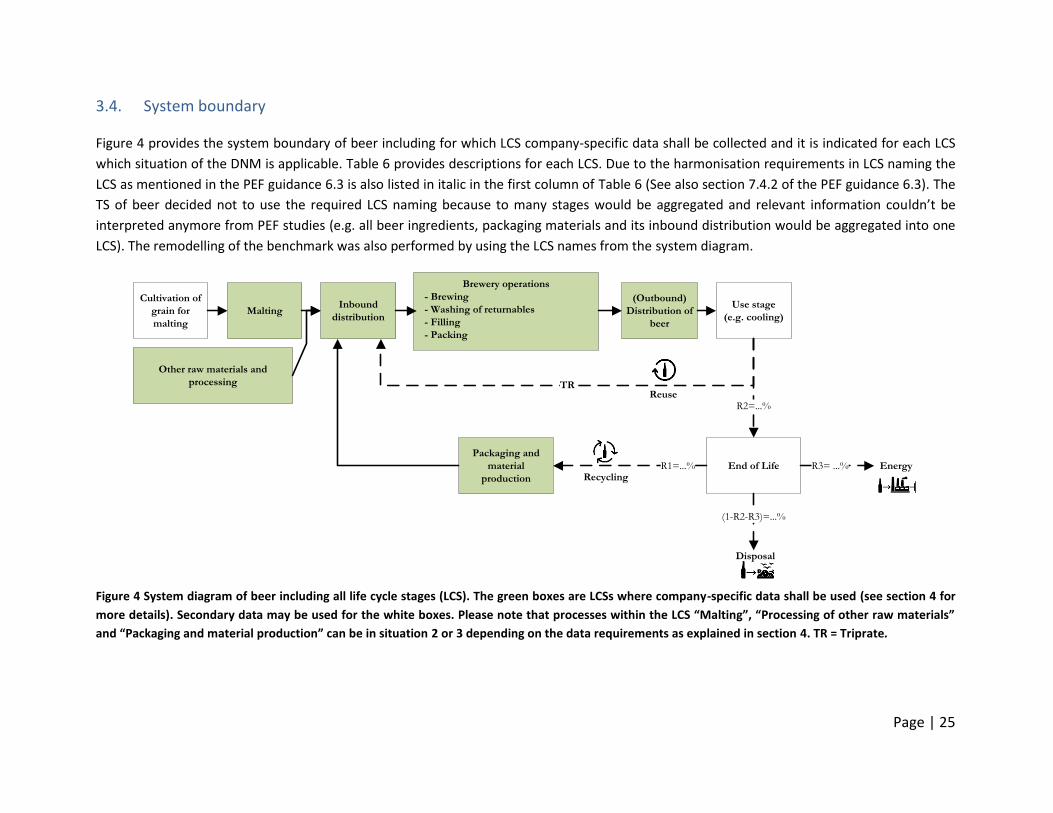
3.4. System boundary Figure 4 provides the system boundary of beer including for which LCS company-specific data shall be collected and it is indicated for each LCS
which situation of the DNM is applicable. Table 6 provides descriptions for each LCS. Due to the harmonisation requirements in LCS naming the
LCS as mentioned in the PEF guidance 6.3 is also listed in italic in the first column of Table 6 (See also section 7.4.2 of the PEF guidance 6.3). The
TS of beer decided not to use the required LCS naming because to many stages would be aggregated and relevant information couldn’t be
interpreted anymore from PEF studies (e.g. all beer ingredients, packaging materials and its inbound distribution would be aggregated into one
LCS). The remodelling of the benchmark was also performed by using the LCS names from the system diagram.
Cultivation of
grain for
malting
Malting
(Outbound)
Distribution of
beer
Use stage
(e.g. cooling)
Packaging and
material
production
Reuse
Brewery operations
- Brewing
- Washing of returnables
- Filling
- Packing
TR
R2=...%
Recycling
Inbound
distribution
Other raw materials and
processing
End of LifeR1=...%
(1-R2-R3)=...%
R3= ...%
Disposal
Energy
Figure 4 System diagram of beer including all life cycle stages (LCS). The green boxes are LCSs where company-specific data shall be used (see section 4 for
more details). Secondary data may be used for the white boxes. Please note that processes within the LCS “Malting”, “Processing of other raw materials”
and “Packaging and material production” can be in situation 2 or 3 depending on the data requirements as explained in section 4. TR = Triprate.
Page | 26
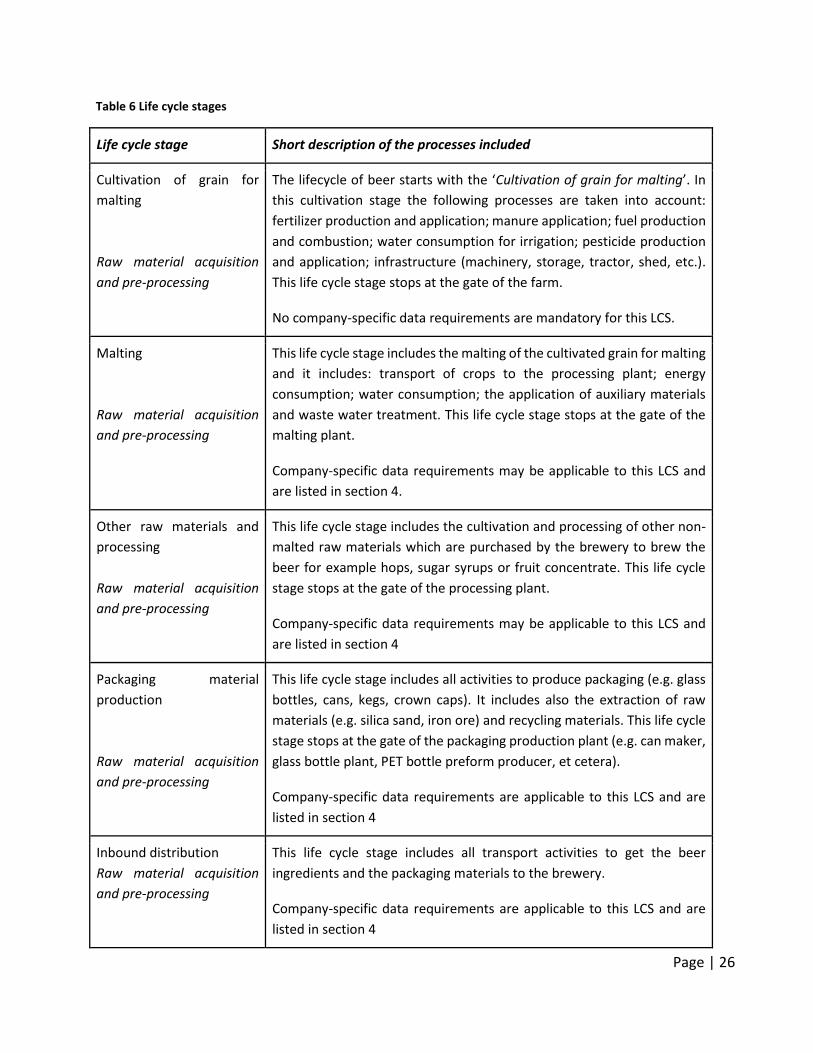
Table 6 Life cycle stages
Life cycle stage Short description of the processes included
Cultivation of grain for
malting
Raw material acquisition
and pre-processing
The lifecycle of beer starts with the ‘Cultivation of grain for malting’. In
this cultivation stage the following processes are taken into account:
fertilizer production and application; manure application; fuel production
and combustion; water consumption for irrigation; pesticide production
and application; infrastructure (machinery, storage, tractor, shed, etc.).
This life cycle stage stops at the gate of the farm.
No company-specific data requirements are mandatory for this LCS.
Malting
Raw material acquisition
and pre-processing
This life cycle stage includes the malting of the cultivated grain for malting
and it includes: transport of crops to the processing plant; energy
consumption; water consumption; the application of auxiliary materials
and waste water treatment. This life cycle stage stops at the gate of the
malting plant.
Company-specific data requirements may be applicable to this LCS and
are listed in section 4.
Other raw materials and
processing
Raw material acquisition
and pre-processing
This life cycle stage includes the cultivation and processing of other non-
malted raw materials which are purchased by the brewery to brew the
beer for example hops, sugar syrups or fruit concentrate. This life cycle
stage stops at the gate of the processing plant.
Company-specific data requirements may be applicable to this LCS and
are listed in section 4
Packaging material
production
Raw material acquisition
and pre-processing
This life cycle stage includes all activities to produce packaging (e.g. glass
bottles, cans, kegs, crown caps). It includes also the extraction of raw
materials (e.g. silica sand, iron ore) and recycling materials. This life cycle
stage stops at the gate of the packaging production plant (e.g. can maker,
glass bottle plant, PET bottle preform producer, et cetera).
Company-specific data requirements are applicable to this LCS and are
listed in section 4
Inbound distribution
Raw material acquisition
and pre-processing
This life cycle stage includes all transport activities to get the beer
ingredients and the packaging materials to the brewery.
Company-specific data requirements are applicable to this LCS and are
listed in section 4
Page | 27
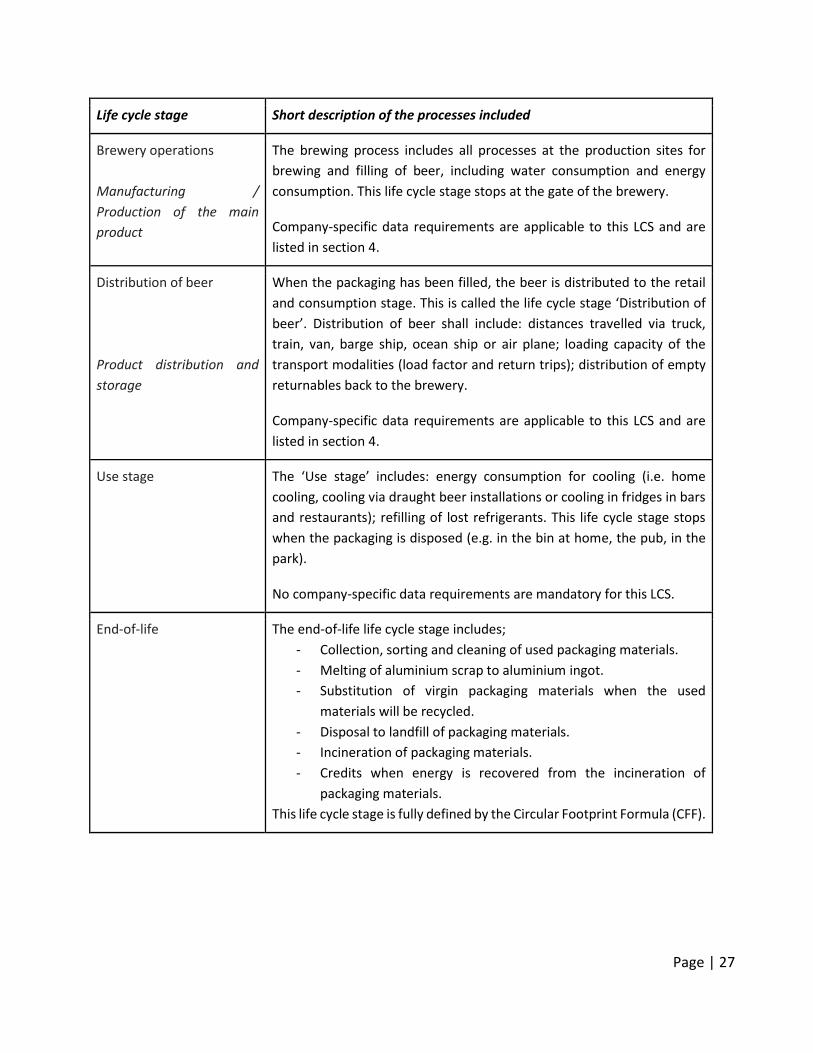
Life cycle stage Short description of the processes included
Brewery operations
Manufacturing /
Production of the main
product
The brewing process includes all processes at the production sites for
brewing and filling of beer, including water consumption and energy
consumption. This life cycle stage stops at the gate of the brewery.
Company-specific data requirements are applicable to this LCS and are
listed in section 4.
Distribution of beer
Product distribution and
storage
When the packaging has been filled, the beer is distributed to the retail
and consumption stage. This is called the life cycle stage ‘Distribution of
beer’. Distribution of beer shall include: distances travelled via truck,
train, van, barge ship, ocean ship or air plane; loading capacity of the
transport modalities (load factor and return trips); distribution of empty
returnables back to the brewery.
Company-specific data requirements are applicable to this LCS and are
listed in section 4.
Use stage The ‘Use stage’ includes: energy consumption for cooling (i.e. home
cooling, cooling via draught beer installations or cooling in fridges in bars
and restaurants); refilling of lost refrigerants. This life cycle stage stops
when the packaging is disposed (e.g. in the bin at home, the pub, in the
park).
No company-specific data requirements are mandatory for this LCS.
End-of-life The end-of-life life cycle stage includes;
- Collection, sorting and cleaning of used packaging materials.
- Melting of aluminium scrap to aluminium ingot.
- Substitution of virgin packaging materials when the used
materials will be recycled.
- Disposal to landfill of packaging materials.
- Incineration of packaging materials.
- Credits when energy is recovered from the incineration of
packaging materials.
This life cycle stage is fully defined by the Circular Footprint Formula (CFF).
Page | 28
Life cycle stage Short description of the processes included
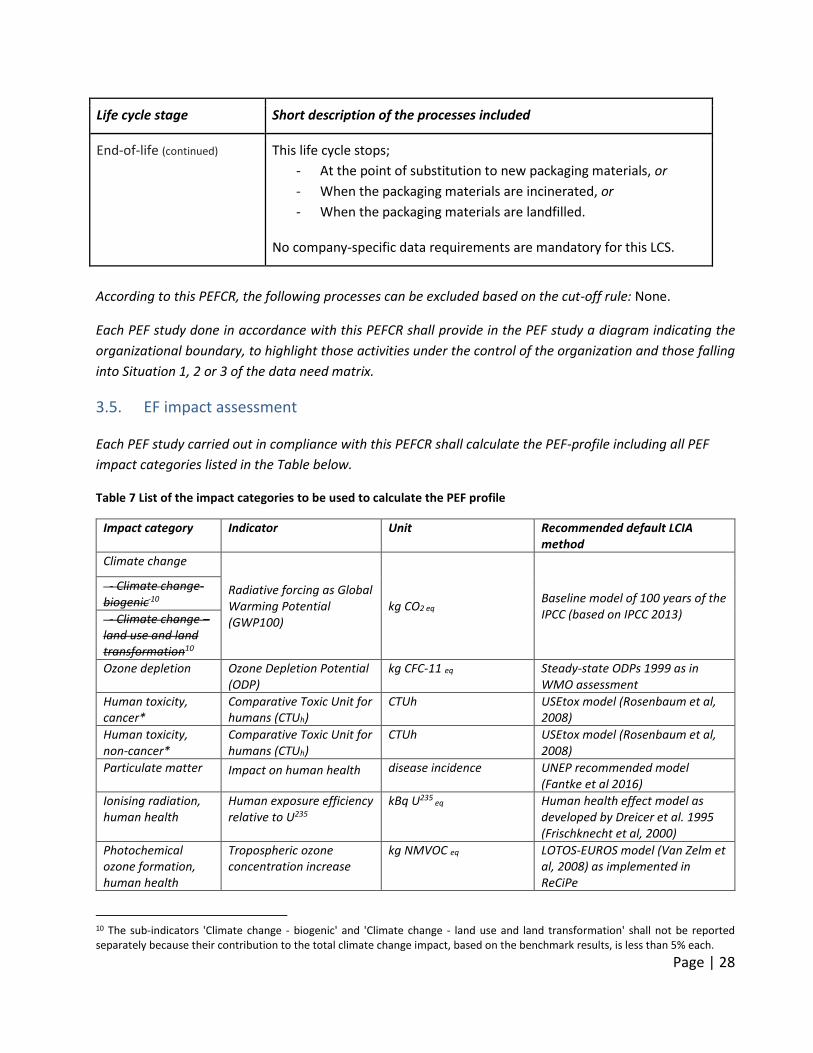
End-of-life (continued) This life cycle stops;
- At the point of substitution to new packaging materials, or
- When the packaging materials are incinerated, or
- When the packaging materials are landfilled.
No company-specific data requirements are mandatory for this LCS.
According to this PEFCR, the following processes can be excluded based on the cut-off rule: None.
Each PEF study done in accordance with this PEFCR shall provide in the PEF study a diagram indicating the
organizational boundary, to highlight those activities under the control of the organization and those falling
into Situation 1, 2 or 3 of the data need matrix.
3.5. EF impact assessment Each PEF study carried out in compliance with this PEFCR shall calculate the PEF-profile including all PEF
impact categories listed in the Table below.
Table 7 List of the impact categories to be used to calculate the PEF profile
Impact category Indicator Unit Recommended default LCIA method
Climate change
Radiative forcing as Global Warming Potential (GWP100)
kg CO2 eq Baseline model of 100 years of the IPCC (based on IPCC 2013)
- Climate change-biogenic 10
- Climate change – land use and land transformation10
Ozone depletion Ozone Depletion Potential (ODP)
kg CFC-11 eq Steady-state ODPs 1999 as in WMO assessment
Human toxicity, cancer*
Comparative Toxic Unit for humans (CTUh)
CTUh USEtox model (Rosenbaum et al, 2008)
Human toxicity, non-cancer*
Comparative Toxic Unit for humans (CTUh)
CTUh USEtox model (Rosenbaum et al, 2008)
Particulate matter Impact on human health disease incidence UNEP recommended model (Fantke et al 2016)
Ionising radiation, human health
Human exposure efficiency relative to U235
kBq U235 eq Human health effect model as
developed by Dreicer et al. 1995 (Frischknecht et al, 2000)
Photochemical ozone formation, human health
Tropospheric ozone concentration increase
kg NMVOC eq LOTOS-EUROS model (Van Zelm et al, 2008) as implemented in ReCiPe
10 The sub-indicators 'Climate change - biogenic' and 'Climate change - land use and land transformation' shall not be reported separately because their contribution to the total climate change impact, based on the benchmark results, is less than 5% each.
Page | 29
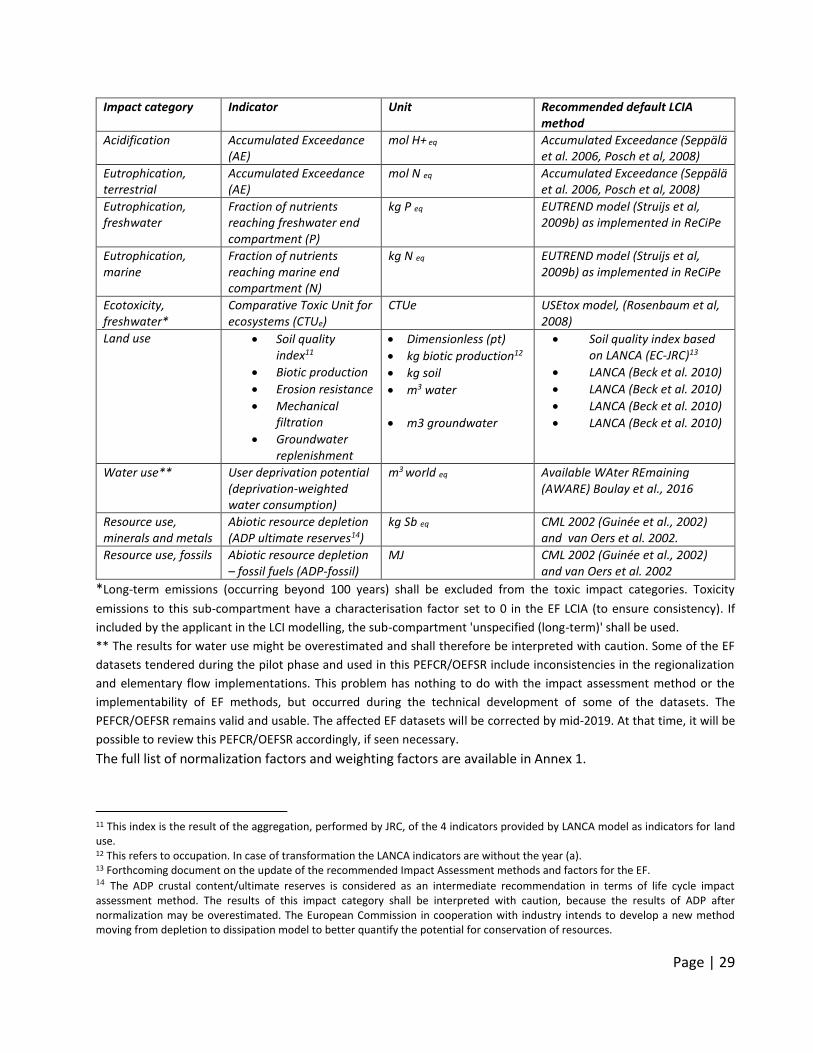
Impact category Indicator Unit Recommended default LCIA method
Acidification Accumulated Exceedance (AE)
mol H+ eq Accumulated Exceedance (Seppälä et al. 2006, Posch et al, 2008)
Eutrophication, terrestrial
Accumulated Exceedance (AE)
mol N eq Accumulated Exceedance (Seppälä et al. 2006, Posch et al, 2008)
Eutrophication, freshwater
Fraction of nutrients reaching freshwater end compartment (P)
kg P eq EUTREND model (Struijs et al, 2009b) as implemented in ReCiPe
Eutrophication, marine
Fraction of nutrients reaching marine end compartment (N)
kg N eq EUTREND model (Struijs et al, 2009b) as implemented in ReCiPe
Ecotoxicity, freshwater*
Comparative Toxic Unit for ecosystems (CTUe)
CTUe USEtox model, (Rosenbaum et al, 2008)
Land use
• Soil quality index11
• Biotic production
• Erosion resistance
• Mechanical filtration
• Groundwater replenishment
• Dimensionless (pt)
• kg biotic production12
• kg soil
• m3 water
• m3 groundwater
• Soil quality index based on LANCA (EC-JRC)13
• LANCA (Beck et al. 2010)
• LANCA (Beck et al. 2010)
• LANCA (Beck et al. 2010)
• LANCA (Beck et al. 2010)
Water use** User deprivation potential (deprivation-weighted water consumption)
m3 world eq Available WAter REmaining (AWARE) Boulay et al., 2016
Resource use, minerals and metals
Abiotic resource depletion (ADP ultimate reserves14)
kg Sb eq CML 2002 (Guinée et al., 2002) and van Oers et al. 2002.
Resource use, fossils Abiotic resource depletion – fossil fuels (ADP-fossil)
MJ CML 2002 (Guinée et al., 2002) and van Oers et al. 2002
*Long-term emissions (occurring beyond 100 years) shall be excluded from the toxic impact categories. Toxicity
emissions to this sub-compartment have a characterisation factor set to 0 in the EF LCIA (to ensure consistency). If
included by the applicant in the LCI modelling, the sub-compartment 'unspecified (long-term)' shall be used.
** The results for water use might be overestimated and shall therefore be interpreted with caution. Some of the EF
datasets tendered during the pilot phase and used in this PEFCR/OEFSR include inconsistencies in the regionalization
and elementary flow implementations. This problem has nothing to do with the impact assessment method or the
implementability of EF methods, but occurred during the technical development of some of the datasets. The
PEFCR/OEFSR remains valid and usable. The affected EF datasets will be corrected by mid-2019. At that time, it will be
possible to review this PEFCR/OEFSR accordingly, if seen necessary.
The full list of normalization factors and weighting factors are available in Annex 1.
11 This index is the result of the aggregation, performed by JRC, of the 4 indicators provided by LANCA model as indicators for land use. 12 This refers to occupation. In case of transformation the LANCA indicators are without the year (a). 13 Forthcoming document on the update of the recommended Impact Assessment methods and factors for the EF. 14 The ADP crustal content/ultimate reserves is considered as an intermediate recommendation in terms of life cycle impact assessment method. The results of this impact category shall be interpreted with caution, because the results of ADP after normalization may be overestimated. The European Commission in cooperation with industry intends to develop a new method moving from depletion to dissipation model to better quantify the potential for conservation of resources.
Page | 30
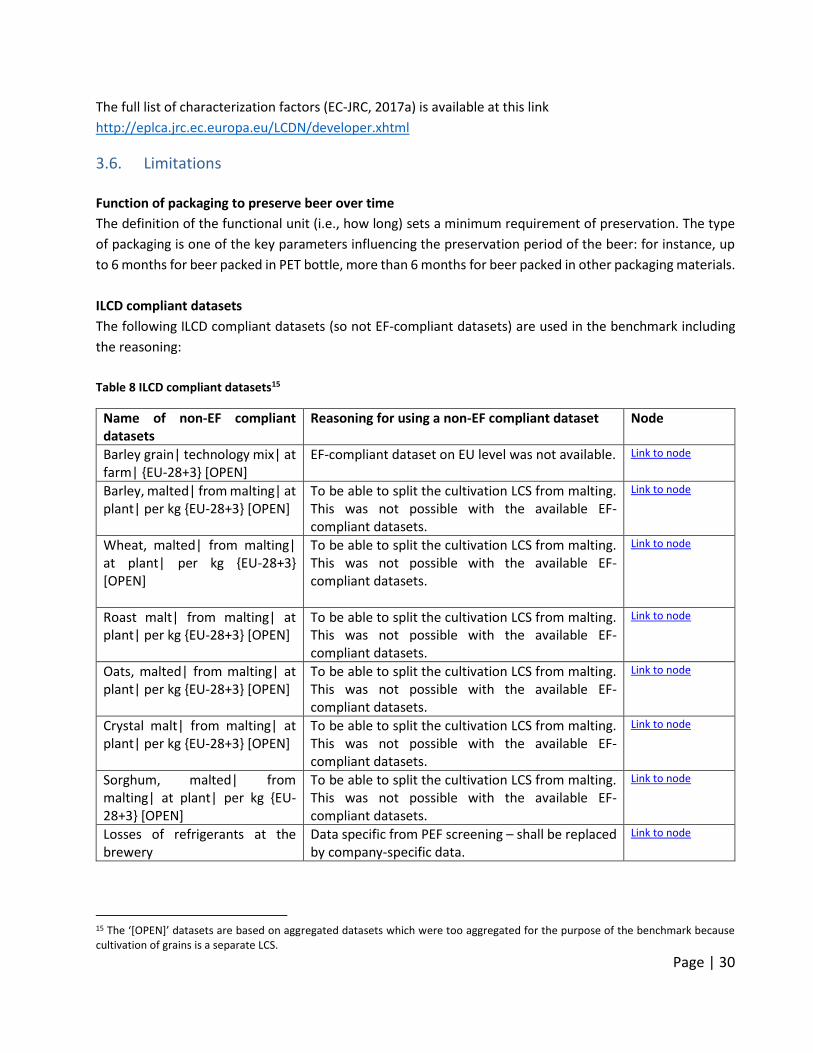
The full list of characterization factors (EC-JRC, 2017a) is available at this link
http://eplca.jrc.ec.europa.eu/LCDN/developer.xhtml
3.6. Limitations
Function of packaging to preserve beer over time
The definition of the functional unit (i.e., how long) sets a minimum requirement of preservation. The type
of packaging is one of the key parameters influencing the preservation period of the beer: for instance, up
to 6 months for beer packed in PET bottle, more than 6 months for beer packed in other packaging materials.
ILCD compliant datasets
The following ILCD compliant datasets (so not EF-compliant datasets) are used in the benchmark including
the reasoning:
Table 8 ILCD compliant datasets15
Name of non-EF compliant datasets
Reasoning for using a non-EF compliant dataset Node
Barley grain| technology mix| at farm| {EU-28+3} [OPEN]
EF-compliant dataset on EU level was not available. Link to node
Barley, malted| from malting| at plant| per kg {EU-28+3} [OPEN]
To be able to split the cultivation LCS from malting. This was not possible with the available EF-compliant datasets.
Link to node
Wheat, malted| from malting| at plant| per kg {EU-28+3} [OPEN]
To be able to split the cultivation LCS from malting. This was not possible with the available EF-compliant datasets.
Link to node
Roast malt| from malting| at plant| per kg {EU-28+3} [OPEN]
To be able to split the cultivation LCS from malting. This was not possible with the available EF-compliant datasets.
Link to node
Oats, malted| from malting| at plant| per kg {EU-28+3} [OPEN]
To be able to split the cultivation LCS from malting. This was not possible with the available EF-compliant datasets.
Link to node
Crystal malt| from malting| at plant| per kg {EU-28+3} [OPEN]
To be able to split the cultivation LCS from malting. This was not possible with the available EF-compliant datasets.
Link to node
Sorghum, malted| from malting| at plant| per kg {EU-28+3} [OPEN]
To be able to split the cultivation LCS from malting. This was not possible with the available EF-compliant datasets.
Link to node
Losses of refrigerants at the brewery
Data specific from PEF screening – shall be replaced by company-specific data.
Link to node
15 The ‘[OPEN]’ datasets are based on aggregated datasets which were too aggregated for the purpose of the benchmark because cultivation of grains is a separate LCS.
Page | 31
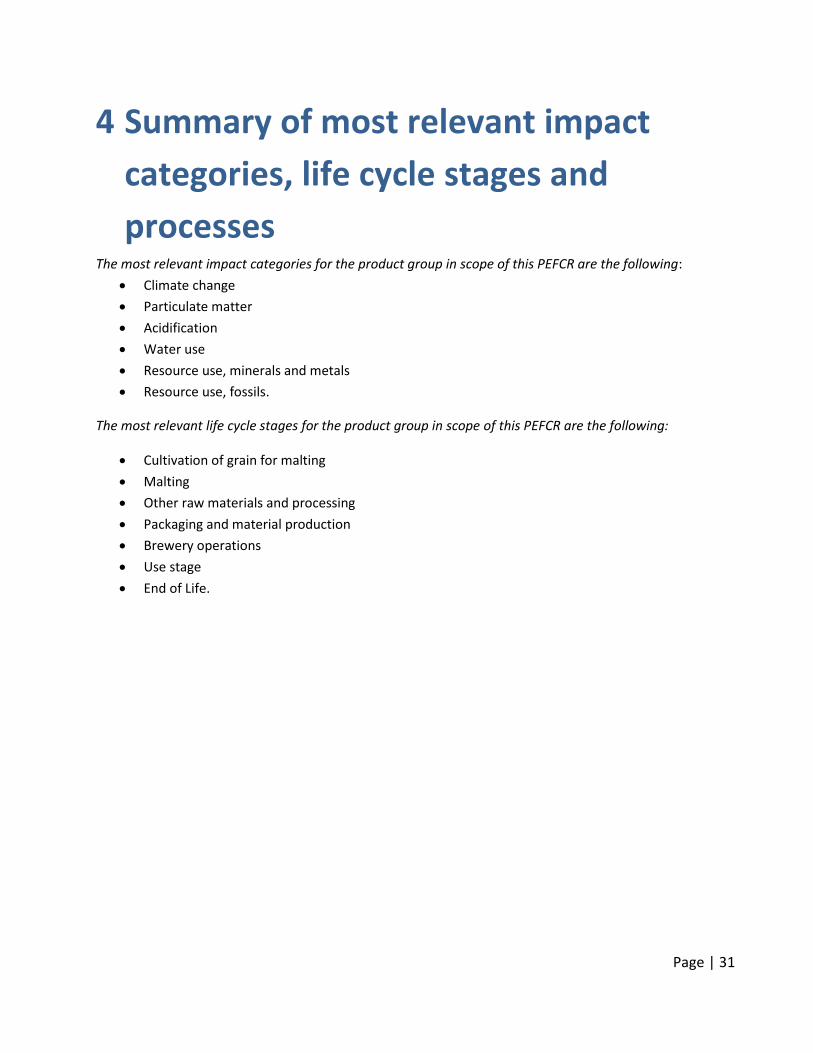
4 Summary of most relevant impact
categories, life cycle stages and
processes The most relevant impact categories for the product group in scope of this PEFCR are the following:
• Climate change
• Particulate matter
• Acidification
• Water use
• Resource use, minerals and metals
• Resource use, fossils.
The most relevant life cycle stages for the product group in scope of this PEFCR are the following:
• Cultivation of grain for malting
• Malting
• Other raw materials and processing
• Packaging and material production
• Brewery operations
• Use stage
• End of Life.
Page | 32
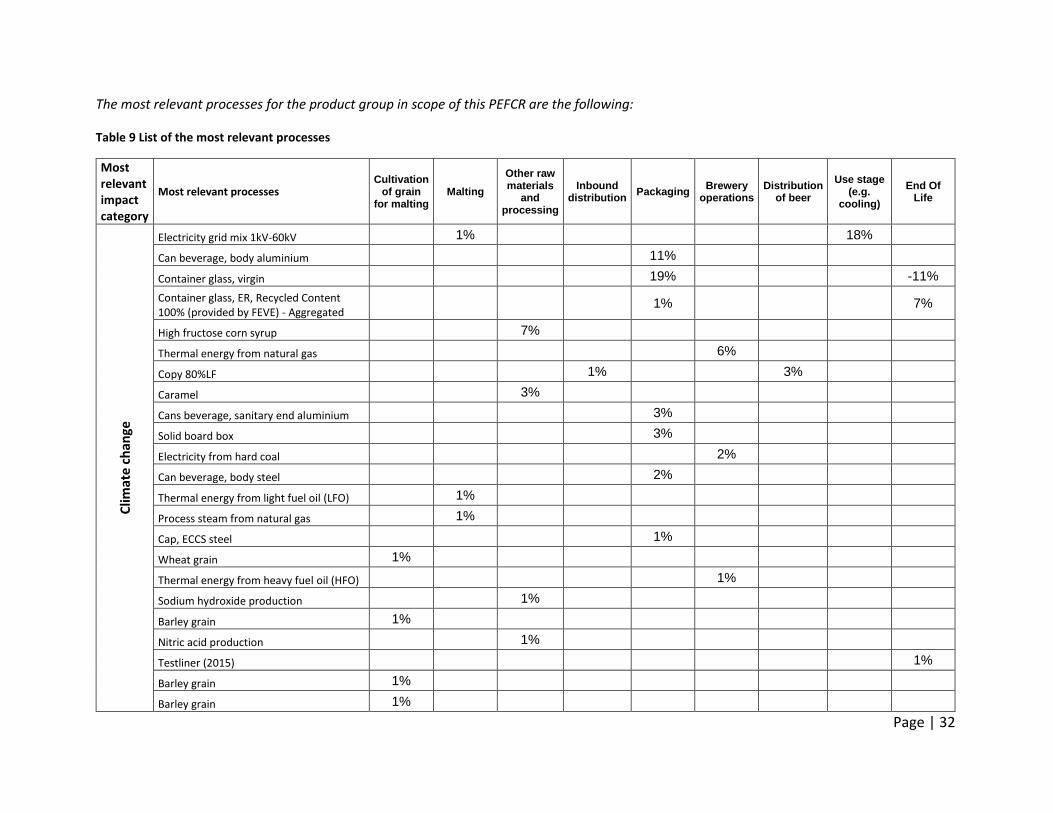
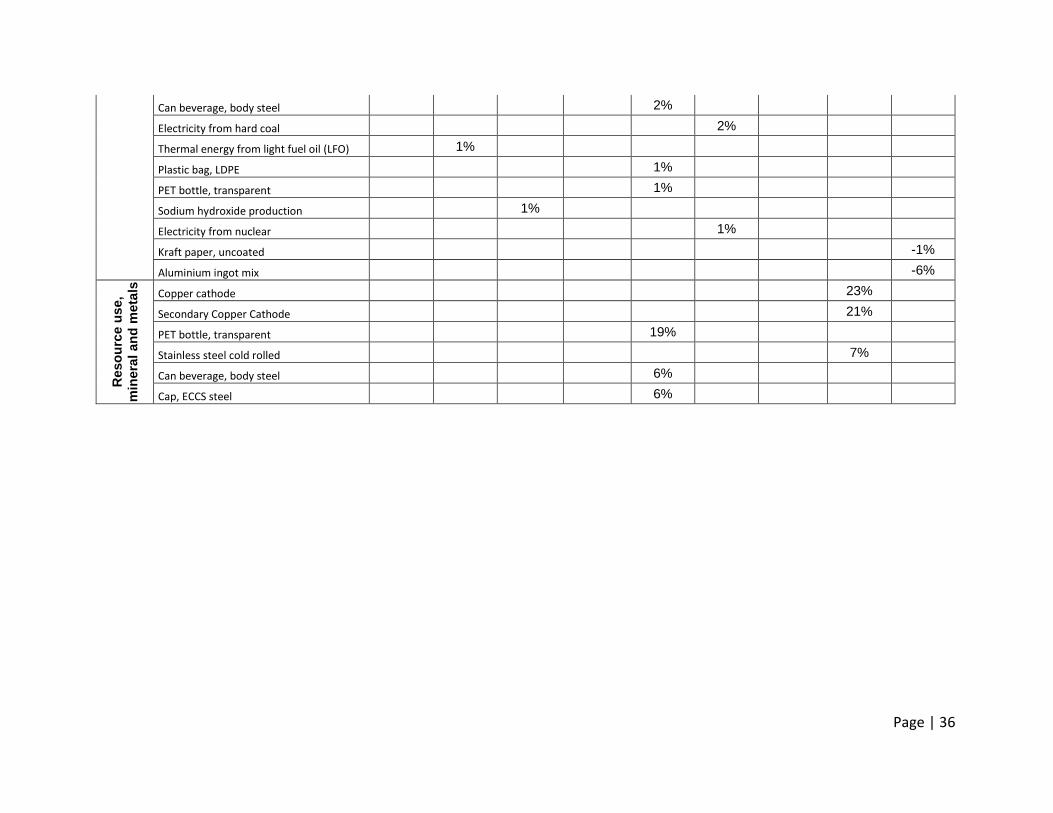
The most relevant processes for the product group in scope of this PEFCR are the following:
Table 9 List of the most relevant processes
Most relevant impact category
Most relevant processes Cultivation
of grain for malting
Malting
Other raw materials
and processing
Inbound distribution
Packaging Brewery
operations Distribution
of beer
Use stage (e.g.
cooling)
End Of Life
Clim
ate
chan
ge
Electricity grid mix 1kV-60kV 1% 18%
Can beverage, body aluminium 11%
Container glass, virgin 19% -11%
Container glass, ER, Recycled Content 100% (provided by FEVE) - Aggregated
1% 7%
High fructose corn syrup 7%
Thermal energy from natural gas 6%
Copy 80%LF 1% 3%
Caramel 3%
Cans beverage, sanitary end aluminium 3%
Solid board box 3%
Electricity from hard coal 2%
Can beverage, body steel 2%
Thermal energy from light fuel oil (LFO) 1%
Process steam from natural gas 1%
Cap, ECCS steel 1%
Wheat grain 1%
Thermal energy from heavy fuel oil (HFO) 1%
Sodium hydroxide production 1%
Barley grain 1%
Nitric acid production 1%
Testliner (2015) 1%
Barley grain 1%
Barley grain 1%
Page | 33
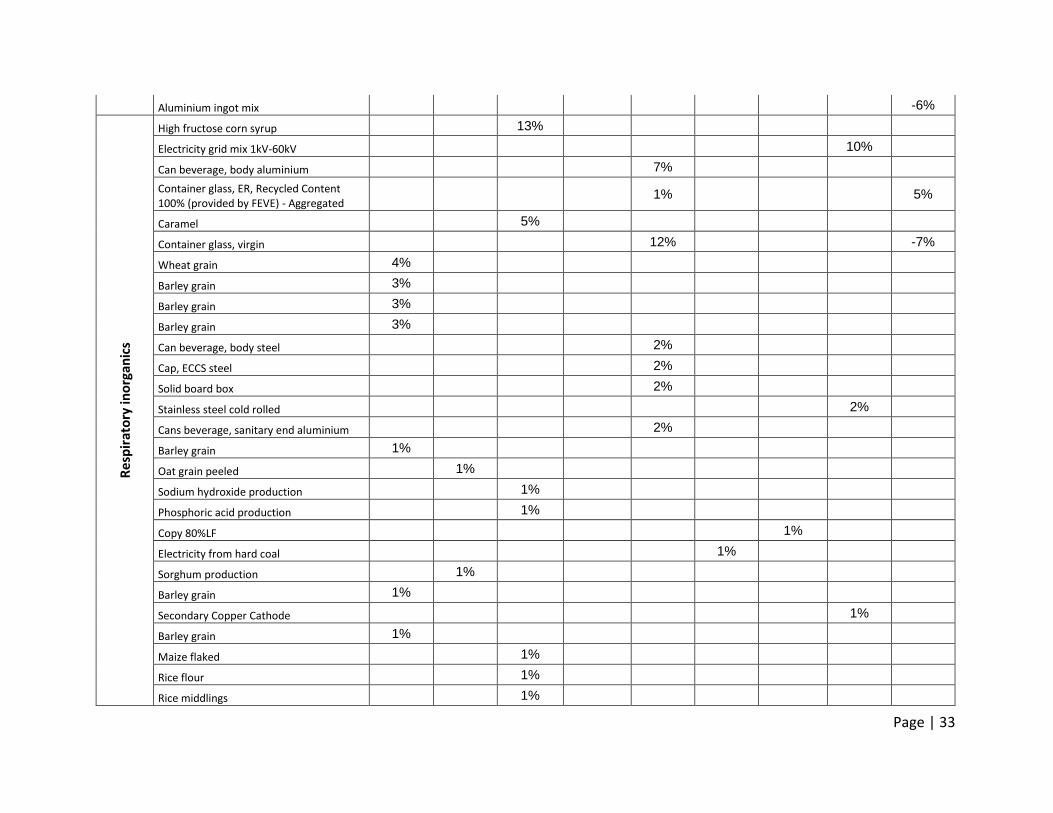
Aluminium ingot mix -6%
Re
spir
ato
ry in
org
anic
s High fructose corn syrup 13%
Electricity grid mix 1kV-60kV 10%
Can beverage, body aluminium 7%
Container glass, ER, Recycled Content 100% (provided by FEVE) - Aggregated
1% 5%
Caramel 5%
Container glass, virgin 12% -7%
Wheat grain 4%
Barley grain 3%
Barley grain 3%
Barley grain 3%
Can beverage, body steel 2%
Cap, ECCS steel 2%
Solid board box 2%
Stainless steel cold rolled 2%
Cans beverage, sanitary end aluminium 2%
Barley grain 1%
Oat grain peeled 1%
Sodium hydroxide production 1%
Phosphoric acid production 1%
Copy 80%LF 1%
Electricity from hard coal 1%
Sorghum production 1%
Barley grain 1%
Secondary Copper Cathode 1%
Barley grain 1%
Maize flaked 1%
Rice flour 1%
Rice middlings 1%
Page | 34
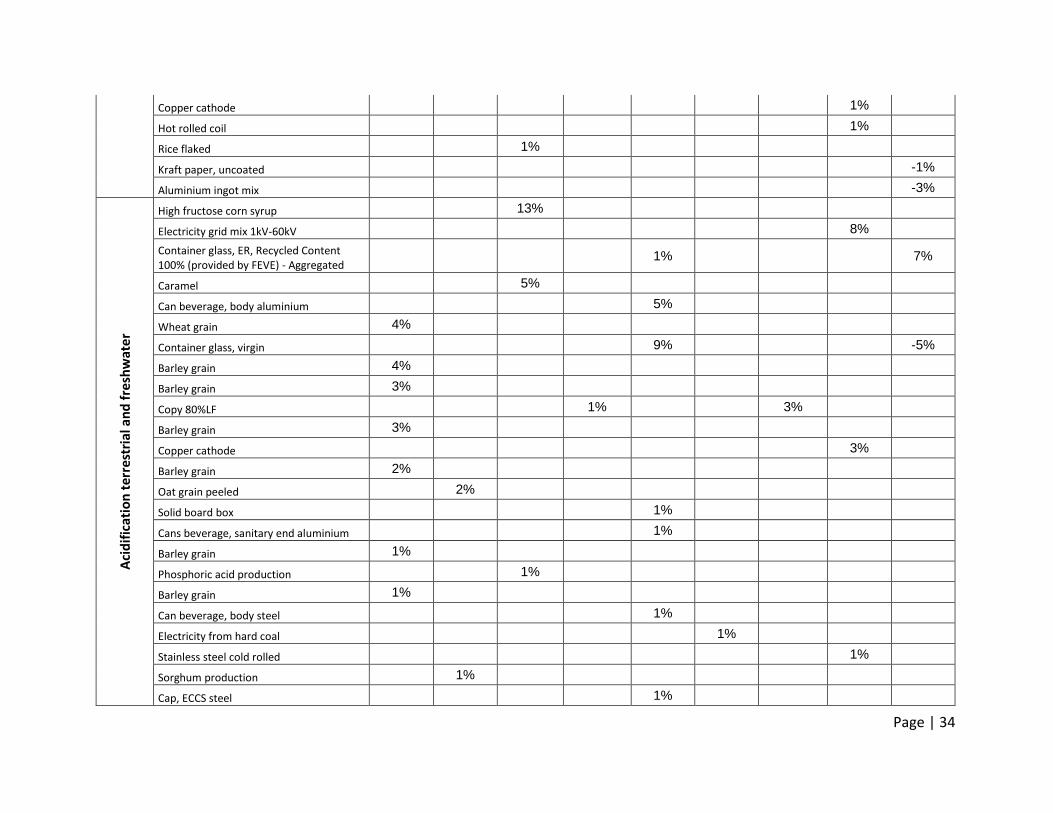
Copper cathode 1%
Hot rolled coil 1%
Rice flaked 1%
Kraft paper, uncoated -1%
Aluminium ingot mix -3%
Aci
dif
icat
ion
ter
rest
rial
an
d f
resh
wat
er
High fructose corn syrup 13%
Electricity grid mix 1kV-60kV 8%
Container glass, ER, Recycled Content 100% (provided by FEVE) - Aggregated
1% 7%
Caramel 5%
Can beverage, body aluminium 5%
Wheat grain 4%
Container glass, virgin 9% -5%
Barley grain 4%
Barley grain 3%
Copy 80%LF 1% 3%
Barley grain 3%
Copper cathode 3%
Barley grain 2%
Oat grain peeled 2%
Solid board box 1%
Cans beverage, sanitary end aluminium 1%
Barley grain 1%
Phosphoric acid production 1%
Barley grain 1%
Can beverage, body steel 1%
Electricity from hard coal 1%
Stainless steel cold rolled 1%
Sorghum production 1%
Cap, ECCS steel 1%
Page | 35
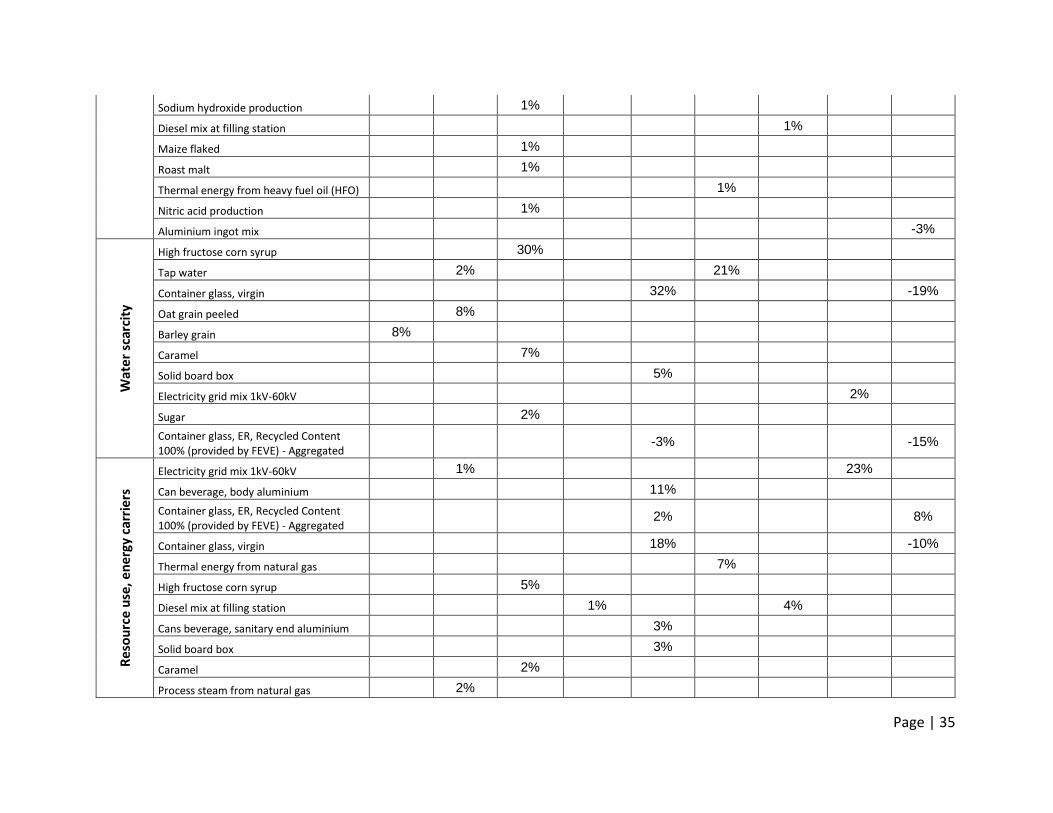
Sodium hydroxide production 1%
Diesel mix at filling station 1%
Maize flaked 1%
Roast malt 1%
Thermal energy from heavy fuel oil (HFO) 1%
Nitric acid production 1%
Aluminium ingot mix -3%
Wat
er
scar
city
High fructose corn syrup 30%
Tap water 2% 21%
Container glass, virgin 32% -19%
Oat grain peeled 8%
Barley grain 8%
Caramel 7%
Solid board box 5%
Electricity grid mix 1kV-60kV 2%
Sugar 2%
Container glass, ER, Recycled Content 100% (provided by FEVE) - Aggregated
-3% -15%
Re
sou
rce
use
, en
ergy
car
rier
s
Electricity grid mix 1kV-60kV 1% 23%
Can beverage, body aluminium 11%
Container glass, ER, Recycled Content 100% (provided by FEVE) - Aggregated
2% 8%
Container glass, virgin 18% -10%
Thermal energy from natural gas 7%
High fructose corn syrup 5%
Diesel mix at filling station 1% 4%
Cans beverage, sanitary end aluminium 3%
Solid board box 3%
Caramel 2%
Process steam from natural gas 2%
Page | 36
Can beverage, body steel 2%
Electricity from hard coal 2%
Thermal energy from light fuel oil (LFO) 1%
Plastic bag, LDPE 1%
PET bottle, transparent 1%
Sodium hydroxide production 1%
Electricity from nuclear 1%
Kraft paper, uncoated -1%
Aluminium ingot mix -6%
Reso
urc
e u
se,
min
era
l an
d m
eta
ls
Copper cathode 23%
Secondary Copper Cathode 21%
PET bottle, transparent 19%
Stainless steel cold rolled 7%
Can beverage, body steel 6%
Cap, ECCS steel 6%
Page | 37
5 Life cycle inventory All newly created processes shall be EF-compliant.
Sampling is not allowed.
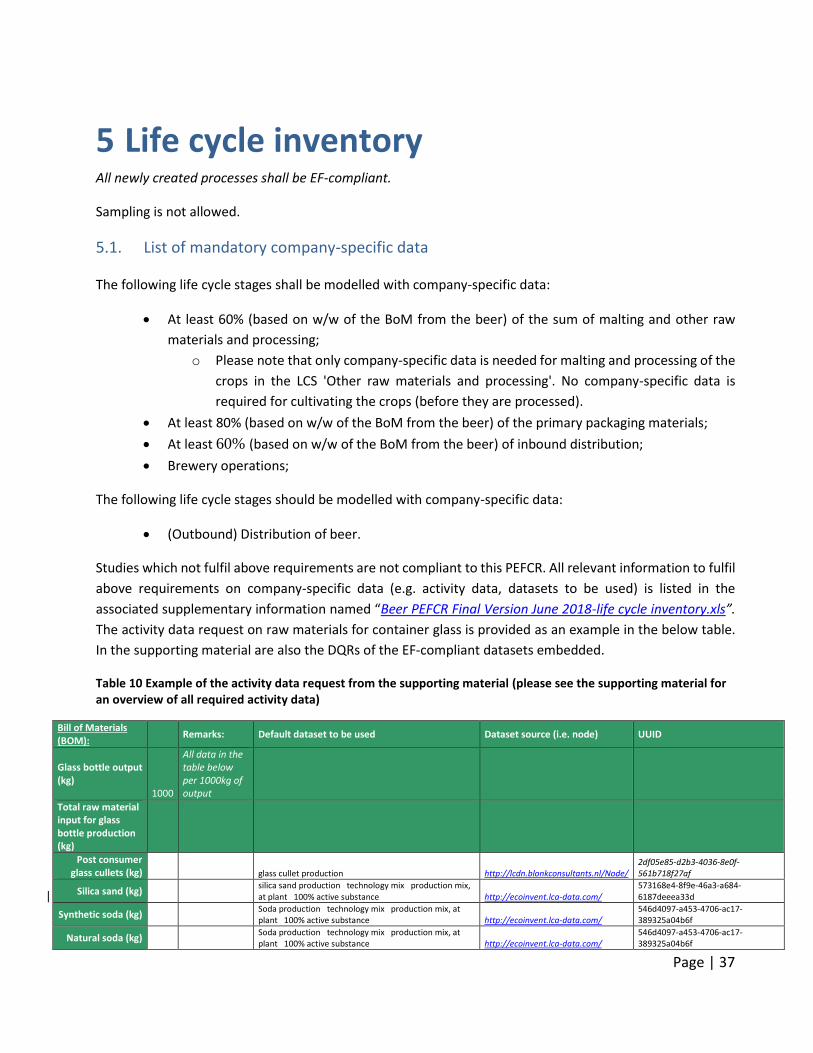
5.1. List of mandatory company-specific data The following life cycle stages shall be modelled with company-specific data:
• At least 60% (based on w/w of the BoM from the beer) of the sum of malting and other raw
materials and processing;
o Please note that only company-specific data is needed for malting and processing of the
crops in the LCS 'Other raw materials and processing'. No company-specific data is
required for cultivating the crops (before they are processed).
• At least 80% (based on w/w of the BoM from the beer) of the primary packaging materials;
• At least 60% (based on w/w of the BoM from the beer) of inbound distribution;
• Brewery operations;
The following life cycle stages should be modelled with company-specific data:
• (Outbound) Distribution of beer.
Studies which not fulfil above requirements are not compliant to this PEFCR. All relevant information to fulfil
above requirements on company-specific data (e.g. activity data, datasets to be used) is listed in the
associated supplementary information named “Beer PEFCR Final Version June 2018-life cycle inventory.xls”.
The activity data request on raw materials for container glass is provided as an example in the below table.
In the supporting material are also the DQRs of the EF-compliant datasets embedded.
Table 10 Example of the activity data request from the supporting material (please see the supporting material for an overview of all required activity data)
Bill of Materials (BOM):
Remarks: Default dataset to be used Dataset source (i.e. node) UUID
Glass bottle output (kg)
1000
All data in the table below per 1000kg of output
Total raw material input for glass bottle production (kg)
Post consumer glass cullets (kg) glass cullet production http://lcdn.blonkconsultants.nl/Node/
2df05e85-d2b3-4036-8e0f-561b718f27af
Silica sand (kg)
silica sand production technology mix production mix, at plant 100% active substance http://ecoinvent.lca-data.com/
573168e4-8f9e-46a3-a684-6187deeea33d
Synthetic soda (kg)
Soda production technology mix production mix, at plant 100% active substance http://ecoinvent.lca-data.com/
546d4097-a453-4706-ac17-389325a04b6f
Natural soda (kg)
Soda production technology mix production mix, at plant 100% active substance http://ecoinvent.lca-data.com/
546d4097-a453-4706-ac17-389325a04b6f
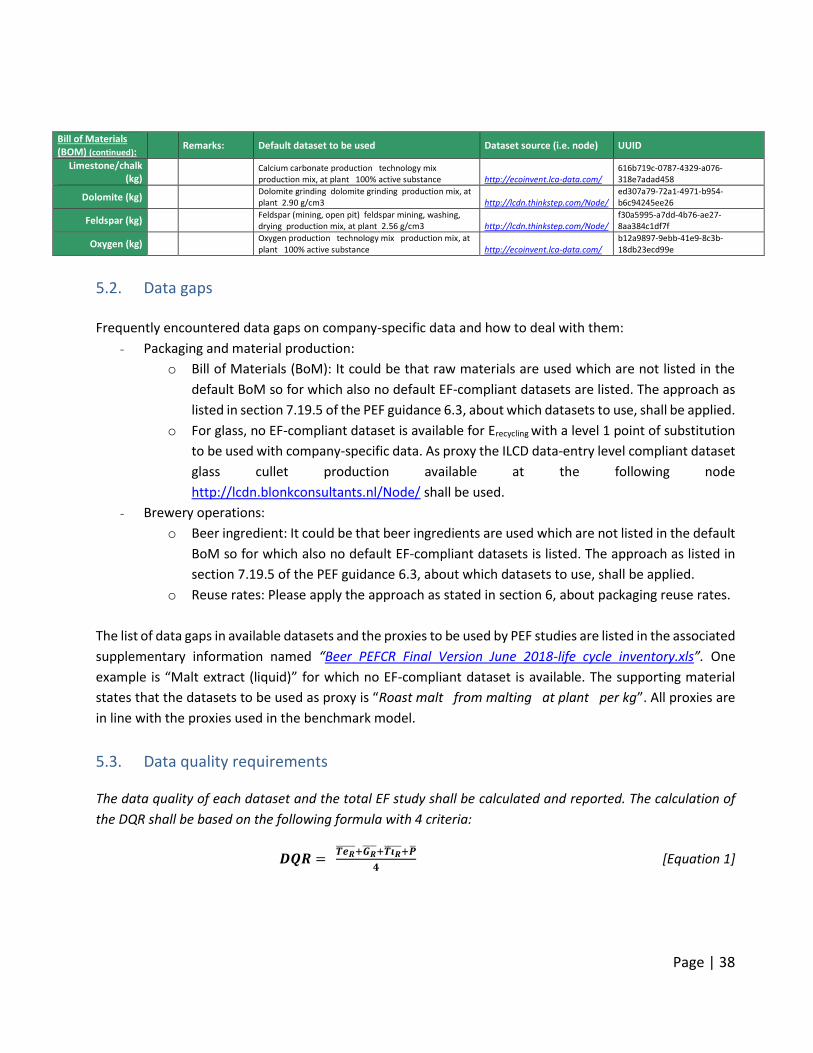
Page | 38
Bill of Materials (BOM) (continued):
Remarks: Default dataset to be used Dataset source (i.e. node) UUID
Limestone/chalk (kg)
Calcium carbonate production technology mix production mix, at plant 100% active substance http://ecoinvent.lca-data.com/
616b719c-0787-4329-a076-318e7adad458
Dolomite (kg)
Dolomite grinding dolomite grinding production mix, at plant 2.90 g/cm3 http://lcdn.thinkstep.com/Node/
ed307a79-72a1-4971-b954-b6c94245ee26
Feldspar (kg)
Feldspar (mining, open pit) feldspar mining, washing, drying production mix, at plant 2.56 g/cm3 http://lcdn.thinkstep.com/Node/
f30a5995-a7dd-4b76-ae27-8aa384c1df7f
Oxygen (kg)
Oxygen production technology mix production mix, at plant 100% active substance http://ecoinvent.lca-data.com/
b12a9897-9ebb-41e9-8c3b-18db23ecd99e
5.2. Data gaps
Frequently encountered data gaps on company-specific data and how to deal with them:
- Packaging and material production:
o Bill of Materials (BoM): It could be that raw materials are used which are not listed in the
default BoM so for which also no default EF-compliant datasets are listed. The approach as
listed in section 7.19.5 of the PEF guidance 6.3, about which datasets to use, shall be applied.
o For glass, no EF-compliant dataset is available for Erecycling with a level 1 point of substitution
to be used with company-specific data. As proxy the ILCD data-entry level compliant dataset
glass cullet production available at the following node
http://lcdn.blonkconsultants.nl/Node/ shall be used.
- Brewery operations:
o Beer ingredient: It could be that beer ingredients are used which are not listed in the default
BoM so for which also no default EF-compliant datasets is listed. The approach as listed in
section 7.19.5 of the PEF guidance 6.3, about which datasets to use, shall be applied.
o Reuse rates: Please apply the approach as stated in section 6, about packaging reuse rates.
The list of data gaps in available datasets and the proxies to be used by PEF studies are listed in the associated
supplementary information named “Beer PEFCR Final Version June 2018-life cycle inventory.xls”. One
example is “Malt extract (liquid)” for which no EF-compliant dataset is available. The supporting material
states that the datasets to be used as proxy is “Roast malt from malting at plant per kg”. All proxies are
in line with the proxies used in the benchmark model.
5.3. Data quality requirements The data quality of each dataset and the total EF study shall be calculated and reported. The calculation of
the DQR shall be based on the following formula with 4 criteria:
𝑫𝑸𝑹 = 𝑻𝒆𝑹 +𝑮𝑹
+𝑻𝒊𝑹 +��
𝟒 [Equation 1]
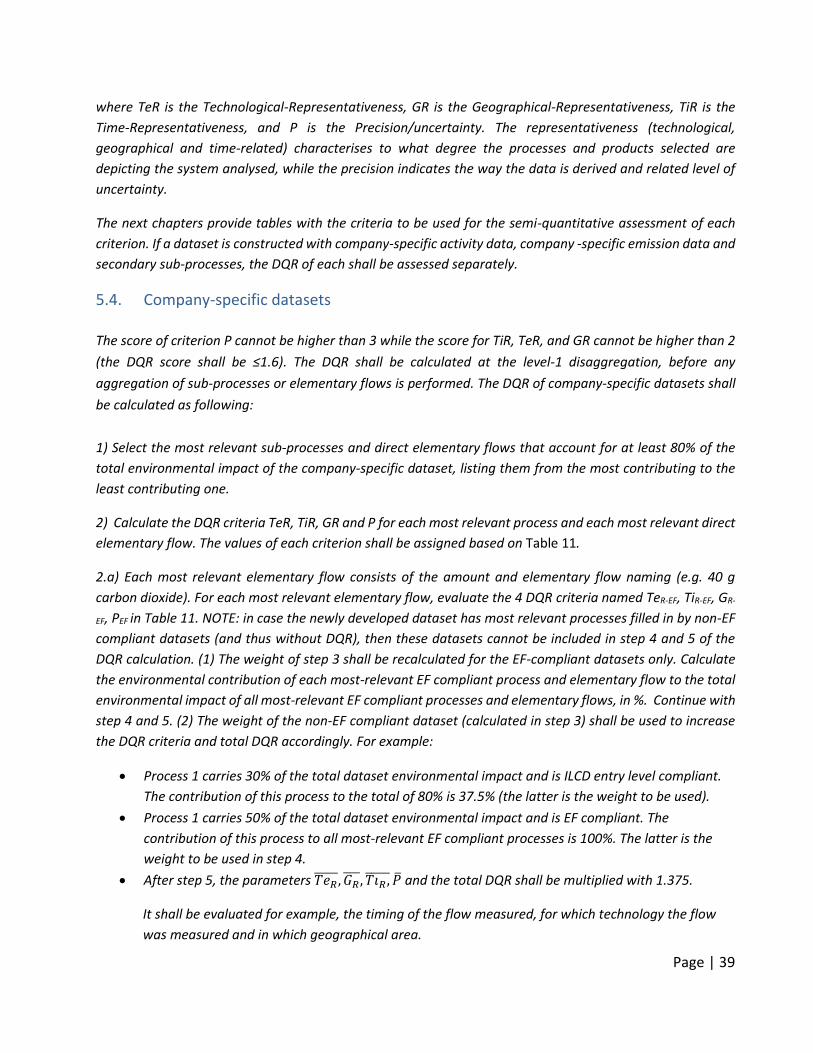
Page | 39
where TeR is the Technological-Representativeness, GR is the Geographical-Representativeness, TiR is the
Time-Representativeness, and P is the Precision/uncertainty. The representativeness (technological,
geographical and time-related) characterises to what degree the processes and products selected are
depicting the system analysed, while the precision indicates the way the data is derived and related level of
uncertainty.
The next chapters provide tables with the criteria to be used for the semi-quantitative assessment of each
criterion. If a dataset is constructed with company-specific activity data, company -specific emission data and
secondary sub-processes, the DQR of each shall be assessed separately.
5.4. Company-specific datasets
The score of criterion P cannot be higher than 3 while the score for TiR, TeR, and GR cannot be higher than 2
(the DQR score shall be ≤1.6). The DQR shall be calculated at the level-1 disaggregation, before any
aggregation of sub-processes or elementary flows is performed. The DQR of company-specific datasets shall
be calculated as following:
1) Select the most relevant sub-processes and direct elementary flows that account for at least 80% of the
total environmental impact of the company-specific dataset, listing them from the most contributing to the
least contributing one.
2) Calculate the DQR criteria TeR, TiR, GR and P for each most relevant process and each most relevant direct
elementary flow. The values of each criterion shall be assigned based on Table 11.
2.a) Each most relevant elementary flow consists of the amount and elementary flow naming (e.g. 40 g
carbon dioxide). For each most relevant elementary flow, evaluate the 4 DQR criteria named TeR-EF, TiR-EF, GR-
EF, PEF in Table 11. NOTE: in case the newly developed dataset has most relevant processes filled in by non-EF
compliant datasets (and thus without DQR), then these datasets cannot be included in step 4 and 5 of the
DQR calculation. (1) The weight of step 3 shall be recalculated for the EF-compliant datasets only. Calculate
the environmental contribution of each most-relevant EF compliant process and elementary flow to the total
environmental impact of all most-relevant EF compliant processes and elementary flows, in %. Continue with
step 4 and 5. (2) The weight of the non-EF compliant dataset (calculated in step 3) shall be used to increase
the DQR criteria and total DQR accordingly. For example:
• Process 1 carries 30% of the total dataset environmental impact and is ILCD entry level compliant.
The contribution of this process to the total of 80% is 37.5% (the latter is the weight to be used).
• Process 1 carries 50% of the total dataset environmental impact and is EF compliant. The
contribution of this process to all most-relevant EF compliant processes is 100%. The latter is the
weight to be used in step 4.
• After step 5, the parameters 𝑇𝑒𝑅 , 𝐺𝑅
, 𝑇𝑖𝑅 , �� and the total DQR shall be multiplied with 1.375.
It shall be evaluated for example, the timing of the flow measured, for which technology the flow
was measured and in which geographical area.
Page | 40
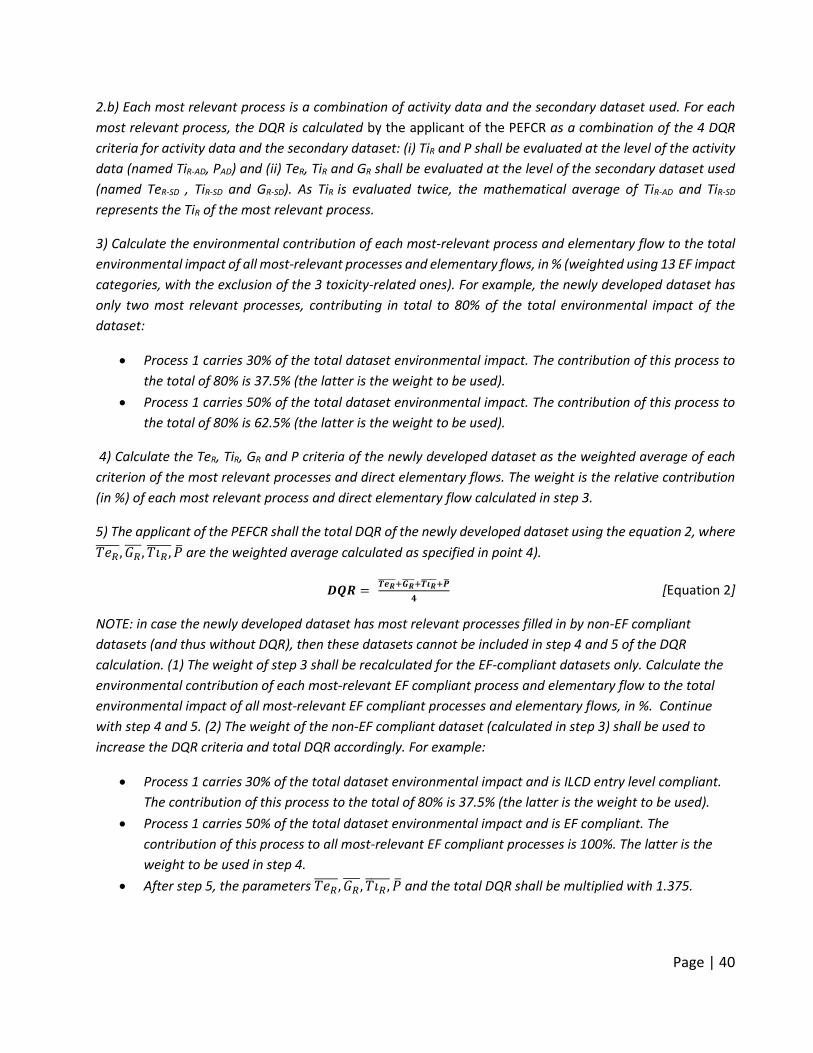
2.b) Each most relevant process is a combination of activity data and the secondary dataset used. For each
most relevant process, the DQR is calculated by the applicant of the PEFCR as a combination of the 4 DQR
criteria for activity data and the secondary dataset: (i) TiR and P shall be evaluated at the level of the activity
data (named TiR-AD, PAD) and (ii) TeR, TiR and GR shall be evaluated at the level of the secondary dataset used
(named TeR-SD , TiR-SD and GR-SD). As TiR is evaluated twice, the mathematical average of TiR-AD and TiR-SD
represents the TiR of the most relevant process.
3) Calculate the environmental contribution of each most-relevant process and elementary flow to the total
environmental impact of all most-relevant processes and elementary flows, in % (weighted using 13 EF impact
categories, with the exclusion of the 3 toxicity-related ones). For example, the newly developed dataset has
only two most relevant processes, contributing in total to 80% of the total environmental impact of the
dataset:
• Process 1 carries 30% of the total dataset environmental impact. The contribution of this process to
the total of 80% is 37.5% (the latter is the weight to be used).
• Process 1 carries 50% of the total dataset environmental impact. The contribution of this process to
the total of 80% is 62.5% (the latter is the weight to be used).
4) Calculate the TeR, TiR, GR and P criteria of the newly developed dataset as the weighted average of each
criterion of the most relevant processes and direct elementary flows. The weight is the relative contribution
(in %) of each most relevant process and direct elementary flow calculated in step 3.
5) The applicant of the PEFCR shall the total DQR of the newly developed dataset using the equation 2, where
𝑇𝑒𝑅 , 𝐺𝑅
, 𝑇𝑖𝑅 , �� are the weighted average calculated as specified in point 4).
𝑫𝑸𝑹 = 𝑻𝒆𝑹 +𝑮𝑹 +𝑻𝒊𝑹 +��
𝟒 [Equation 2]
NOTE: in case the newly developed dataset has most relevant processes filled in by non-EF compliant
datasets (and thus without DQR), then these datasets cannot be included in step 4 and 5 of the DQR
calculation. (1) The weight of step 3 shall be recalculated for the EF-compliant datasets only. Calculate the
environmental contribution of each most-relevant EF compliant process and elementary flow to the total
environmental impact of all most-relevant EF compliant processes and elementary flows, in %. Continue
with step 4 and 5. (2) The weight of the non-EF compliant dataset (calculated in step 3) shall be used to
increase the DQR criteria and total DQR accordingly. For example:
• Process 1 carries 30% of the total dataset environmental impact and is ILCD entry level compliant.
The contribution of this process to the total of 80% is 37.5% (the latter is the weight to be used).
• Process 1 carries 50% of the total dataset environmental impact and is EF compliant. The
contribution of this process to all most-relevant EF compliant processes is 100%. The latter is the
weight to be used in step 4.
• After step 5, the parameters 𝑇𝑒𝑅 , 𝐺𝑅
, 𝑇𝑖𝑅 , �� and the total DQR shall be multiplied with 1.375.

Page | 41
Table 11 How to assess the value of the DQR criteria for datasets with company-specific information
PEF and PAD TiR-EF and TiR-AD TiR-SD TeR-EF and TeR-SD GR-EF and GR-SD
1 Measured/calculated and externally verified
The data refers to the most recent annual administration period with respect to the EF report publication date
The EF report publication date happens within the time validity of the dataset
The elementary flows and the secondary dataset reflect exactly the technology of the newly developed dataset
The data(set) reflects the exact geography where the process modelled in the newly created dataset takes place
2 Measured/calculated and internally verified, plausibility checked by reviewer
The data refers to maximum 2 annual administration periods with respect to the EF report publication date
The EF report publication date happens not later than 2 years beyond the time validity of the dataset
The elementary flows and the secondary dataset is a proxy of the technology of the newly developed dataset
The data(set) partly reflects the geography where the process modelled in the newly created dataset takes place
3 Measured/calculated/literature and plausibility not checked by reviewer OR Qualified estimate based on calculations plausibility checked by reviewer
The data refers to maximum three annual administration periods with respect to the EF report publication date
Not applicable Not applicable Not applicable
4-5 Not applicable Not applicable Not applicable Not applicable Not applicable
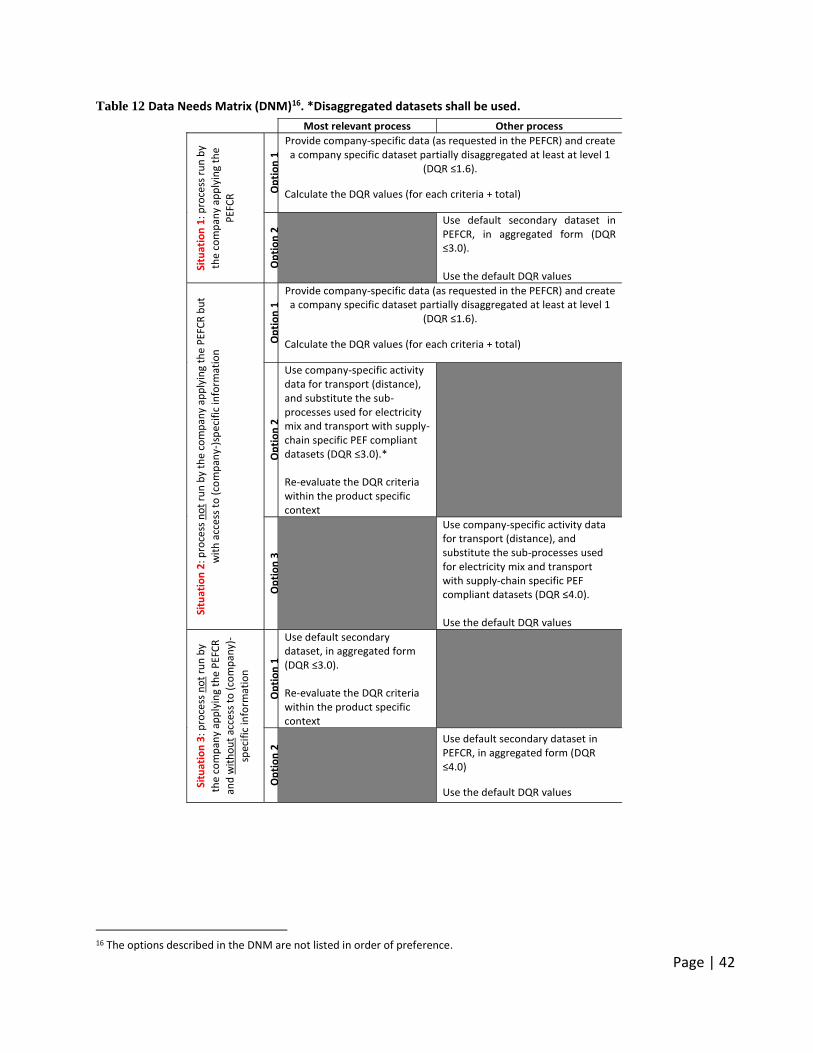
5.5. Data needs matrix (DNM) All processes required to model the product and outside the list of mandatory company-specific (listed in
section 4) shall be evaluated using the Data Needs Matrix (See table 12). The DNM shall be used by the
PEFCR applicant to evaluate which data is needed and shall be used within the modelling of its PEF,
depending on the level of influence the applicant (company) has on the specific process. The following three
cases are found in the DNM and are explained below:
1. Situation 1: the process is run by the company applying the PEFCR
2. Situation 2: the process is not run by the company applying the PEFCR but the company has access
to (company-)specific information.
3. Situation 3: the process is not run by the company applying the PEFCR and this company does not
have access to (company-)specific information.
Page | 42
Table 12 Data Needs Matrix (DNM)16. *Disaggregated datasets shall be used.
16 The options described in the DNM are not listed in order of preference.
Most relevant process Other process
Situ
atio
n 1
: pro
cess
ru
n b
y
the
com
pan
y ap
ply
ing
the
PEF
CR
Op
tio
n 1
Provide company-specific data (as requested in the PEFCR) and create a company specific dataset partially disaggregated at least at level 1
(DQR ≤1.6).
Calculate the DQR values (for each criteria + total)
Op
tio
n 2
Use default secondary dataset in PEFCR, in aggregated form (DQR ≤3.0). Use the default DQR values
Situ
atio
n 2
: pro
cess
no
t ru
n b
y th
e co
mp
any
app
lyin
g th
e P
EFC
R b
ut
wit
h a
cces
s to
(co
mp
any-
)sp
ecif
ic in
form
atio
n O
pti
on
1
Provide company-specific data (as requested in the PEFCR) and create a company specific dataset partially disaggregated at least at level 1
(DQR ≤1.6).
Calculate the DQR values (for each criteria + total)
Op
tio
n 2
Use company-specific activity data for transport (distance), and substitute the sub-processes used for electricity mix and transport with supply-chain specific PEF compliant datasets (DQR ≤3.0).* Re-evaluate the DQR criteria within the product specific context
Op
tio
n 3
Use company-specific activity data for transport (distance), and substitute the sub-processes used for electricity mix and transport with supply-chain specific PEF compliant datasets (DQR ≤4.0). Use the default DQR values
Situ
atio
n 3
: pro
cess
no
t ru
n b
y
the
com
pan
y ap
ply
ing
the
PEF
CR
and
wit
ho
ut
acce
ss t
o (
com
pan
y)-
spec
ific
info
rmat
ion
Op
tio
n 1
Use default secondary dataset, in aggregated form (DQR ≤3.0). Re-evaluate the DQR criteria within the product specific context
Op
tio
n 2
Use default secondary dataset in PEFCR, in aggregated form (DQR ≤4.0)
Use the default DQR values
Page | 43
5.6. Processes in situation 1 For each process in situation 1 there are two possible options:
● The process is in the list of most relevant processes as specified in the PEFCR or is not in the list of
most relevant process, but still the company wants to provide company specific data (option 1);
● The process is not in the list of most relevant processes and the company prefers to use a secondary
dataset (option 2).
Situation 1/Option 1
For all processes run by the company and where the company applying the PEFCR uses company specific data.
The DQR of the newly developed dataset shall be evaluated as described in section 5.4.
Situation 1/Option 2
For the non-most relevant processes only, if the applicant decides to model the process without collecting
company-specific data, then the applicant shall use the secondary dataset listed in the PEFCR together with
its default DQR values listed here.
If the default dataset to be used for the process is not listed in the PEFCR, the applicant of the PEFCR shall
take the DQR values from the metadata of the original dataset.
5.7. Processes in situation 2 When a process is not run by the company applying the PEFCR, but there is access to company-specific data,
then there are two possible options:
● The company applying the PEFCR has access to extensive supplier-specific information and wants to
create a new EF-compliant dataset17 (Option 1);
● The company has some supplier-specific information and want to make some minimum changes
(Option 2).
● The process is not in the list of most relevant processes and the company prefers to use a secondary
dataset (option 3).
Situation 2/Option 1
For all processes run by the company and where the company applying the PEFCR uses company specific data.
The DQR of the newly developed dataset shall be evaluated as described in section 5.4.
17 The review of the newly created dataset is optional.
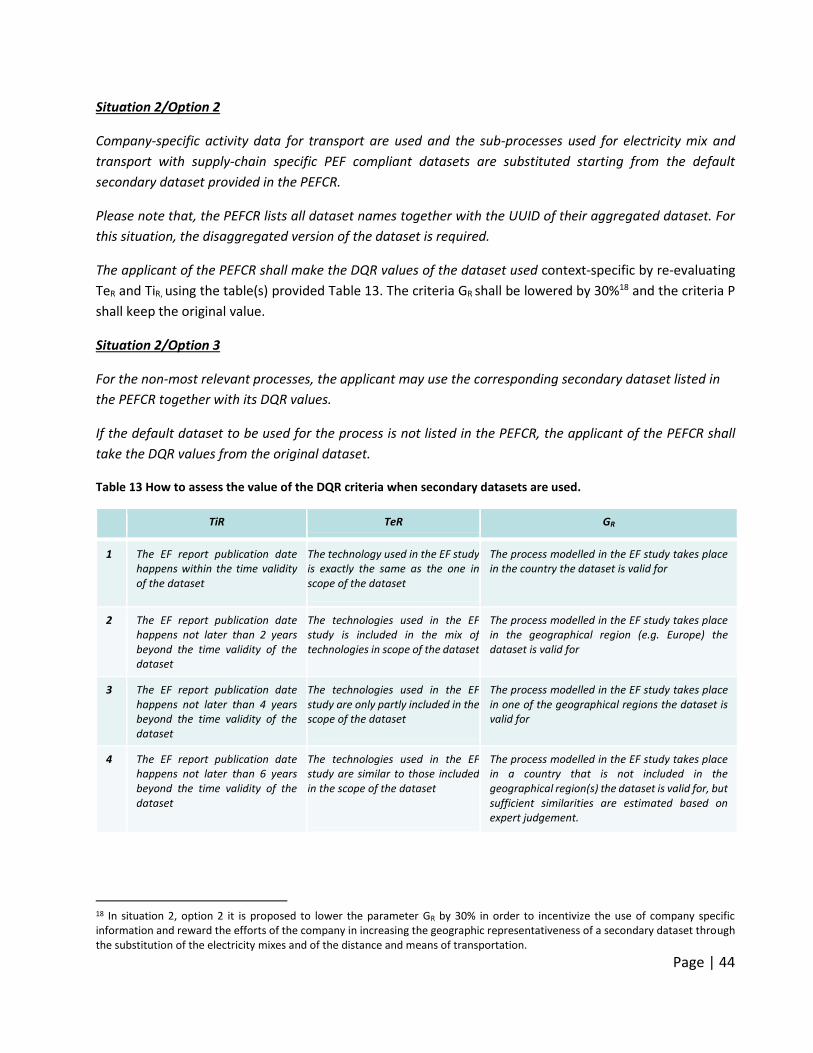
Page | 44
Situation 2/Option 2
Company-specific activity data for transport are used and the sub-processes used for electricity mix and
transport with supply-chain specific PEF compliant datasets are substituted starting from the default
secondary dataset provided in the PEFCR.
Please note that, the PEFCR lists all dataset names together with the UUID of their aggregated dataset. For
this situation, the disaggregated version of the dataset is required.
The applicant of the PEFCR shall make the DQR values of the dataset used context-specific by re-evaluating
TeR and TiR, using the table(s) provided Table 13. The criteria GR shall be lowered by 30%18 and the criteria P
shall keep the original value.
Situation 2/Option 3
For the non-most relevant processes, the applicant may use the corresponding secondary dataset listed in
the PEFCR together with its DQR values.
If the default dataset to be used for the process is not listed in the PEFCR, the applicant of the PEFCR shall
take the DQR values from the original dataset.
Table 13 How to assess the value of the DQR criteria when secondary datasets are used.
TiR TeR GR
1 The EF report publication date happens within the time validity of the dataset
The technology used in the EF study is exactly the same as the one in scope of the dataset
The process modelled in the EF study takes place in the country the dataset is valid for
2 The EF report publication date happens not later than 2 years beyond the time validity of the dataset
The technologies used in the EF study is included in the mix of technologies in scope of the dataset
The process modelled in the EF study takes place in the geographical region (e.g. Europe) the dataset is valid for
3 The EF report publication date happens not later than 4 years beyond the time validity of the dataset
The technologies used in the EF study are only partly included in the scope of the dataset
The process modelled in the EF study takes place in one of the geographical regions the dataset is valid for
4 The EF report publication date happens not later than 6 years beyond the time validity of the dataset
The technologies used in the EF study are similar to those included in the scope of the dataset
The process modelled in the EF study takes place in a country that is not included in the geographical region(s) the dataset is valid for, but sufficient similarities are estimated based on expert judgement.
18 In situation 2, option 2 it is proposed to lower the parameter GR by 30% in order to incentivize the use of company specific information and reward the efforts of the company in increasing the geographic representativeness of a secondary dataset through the substitution of the electricity mixes and of the distance and means of transportation.
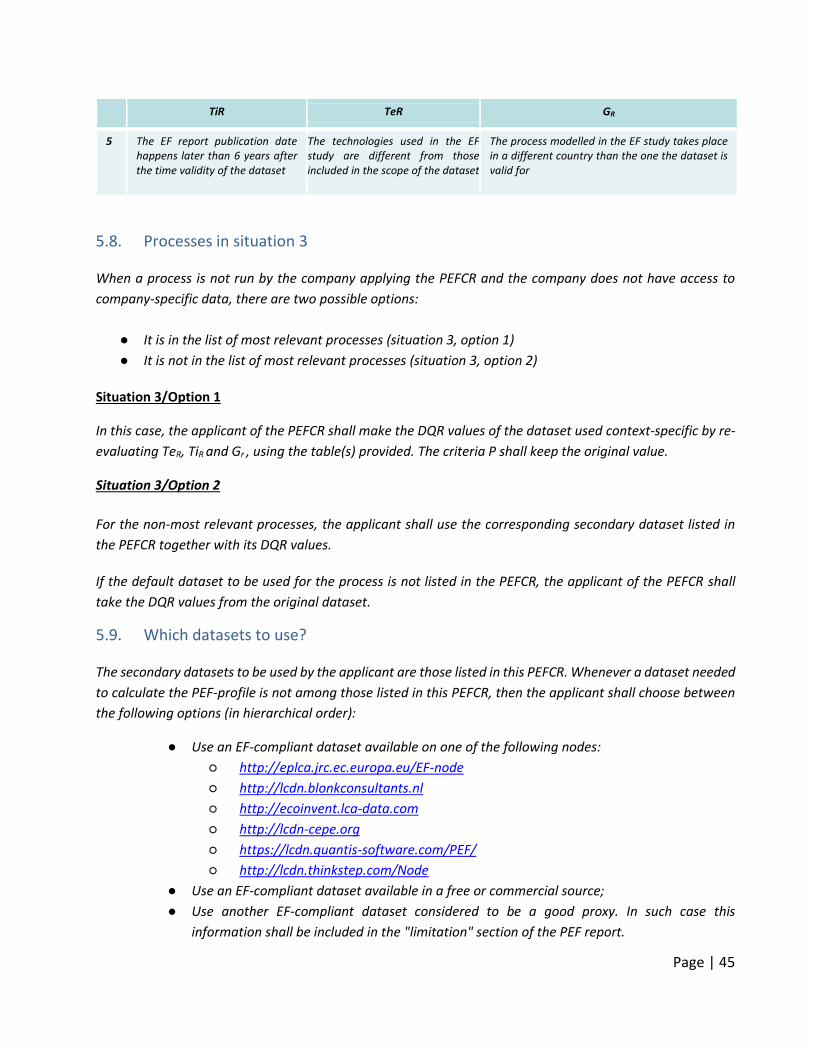
Page | 45
TiR TeR GR
5 The EF report publication date happens later than 6 years after the time validity of the dataset
The technologies used in the EF study are different from those included in the scope of the dataset
The process modelled in the EF study takes place in a different country than the one the dataset is valid for
5.8. Processes in situation 3 When a process is not run by the company applying the PEFCR and the company does not have access to
company-specific data, there are two possible options:
● It is in the list of most relevant processes (situation 3, option 1)
● It is not in the list of most relevant processes (situation 3, option 2)
Situation 3/Option 1
In this case, the applicant of the PEFCR shall make the DQR values of the dataset used context-specific by re-
evaluating TeR, TiR and Gr , using the table(s) provided. The criteria P shall keep the original value.
Situation 3/Option 2
For the non-most relevant processes, the applicant shall use the corresponding secondary dataset listed in
the PEFCR together with its DQR values.
If the default dataset to be used for the process is not listed in the PEFCR, the applicant of the PEFCR shall
take the DQR values from the original dataset.
5.9. Which datasets to use? The secondary datasets to be used by the applicant are those listed in this PEFCR. Whenever a dataset needed
to calculate the PEF-profile is not among those listed in this PEFCR, then the applicant shall choose between
the following options (in hierarchical order):
● Use an EF-compliant dataset available on one of the following nodes:
○ http://eplca.jrc.ec.europa.eu/EF-node
○ http://lcdn.blonkconsultants.nl
○ http://ecoinvent.lca-data.com
○ http://lcdn-cepe.org
○ https://lcdn.quantis-software.com/PEF/
○ http://lcdn.thinkstep.com/Node
● Use an EF-compliant dataset available in a free or commercial source;
● Use another EF-compliant dataset considered to be a good proxy. In such case this
information shall be included in the "limitation" section of the PEF report.
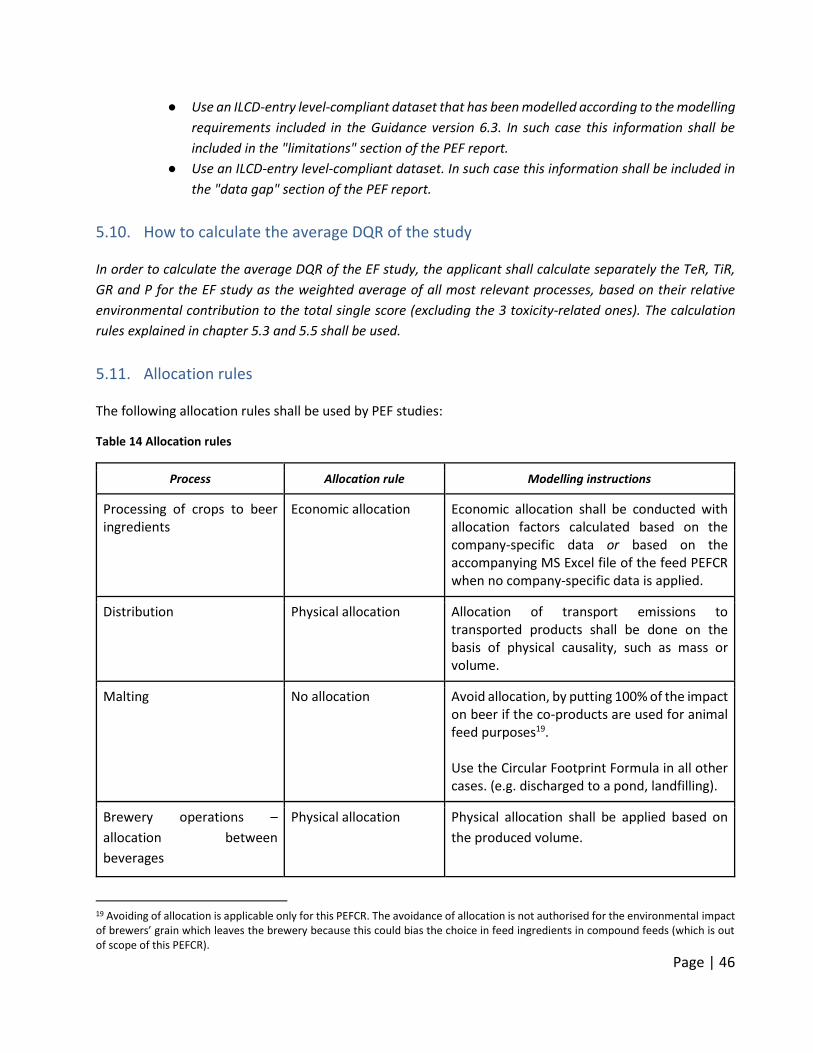
Page | 46
● Use an ILCD-entry level-compliant dataset that has been modelled according to the modelling
requirements included in the Guidance version 6.3. In such case this information shall be
included in the "limitations" section of the PEF report.
● Use an ILCD-entry level-compliant dataset. In such case this information shall be included in
the "data gap" section of the PEF report.
5.10. How to calculate the average DQR of the study In order to calculate the average DQR of the EF study, the applicant shall calculate separately the TeR, TiR,
GR and P for the EF study as the weighted average of all most relevant processes, based on their relative
environmental contribution to the total single score (excluding the 3 toxicity-related ones). The calculation
rules explained in chapter 5.3 and 5.5 shall be used.
5.11. Allocation rules The following allocation rules shall be used by PEF studies:
Table 14 Allocation rules
Process Allocation rule Modelling instructions
Processing of crops to beer ingredients
Economic allocation Economic allocation shall be conducted with allocation factors calculated based on the company-specific data or based on the accompanying MS Excel file of the feed PEFCR when no company-specific data is applied.
Distribution Physical allocation Allocation of transport emissions to transported products shall be done on the basis of physical causality, such as mass or volume.
Malting No allocation Avoid allocation, by putting 100% of the impact on beer if the co-products are used for animal feed purposes19. Use the Circular Footprint Formula in all other cases. (e.g. discharged to a pond, landfilling).
Brewery operations –
allocation between
beverages
Physical allocation Physical allocation shall be applied based on
the produced volume.
19 Avoiding of allocation is applicable only for this PEFCR. The avoidance of allocation is not authorised for the environmental impact of brewers’ grain which leaves the brewery because this could bias the choice in feed ingredients in compound feeds (which is out of scope of this PEFCR).
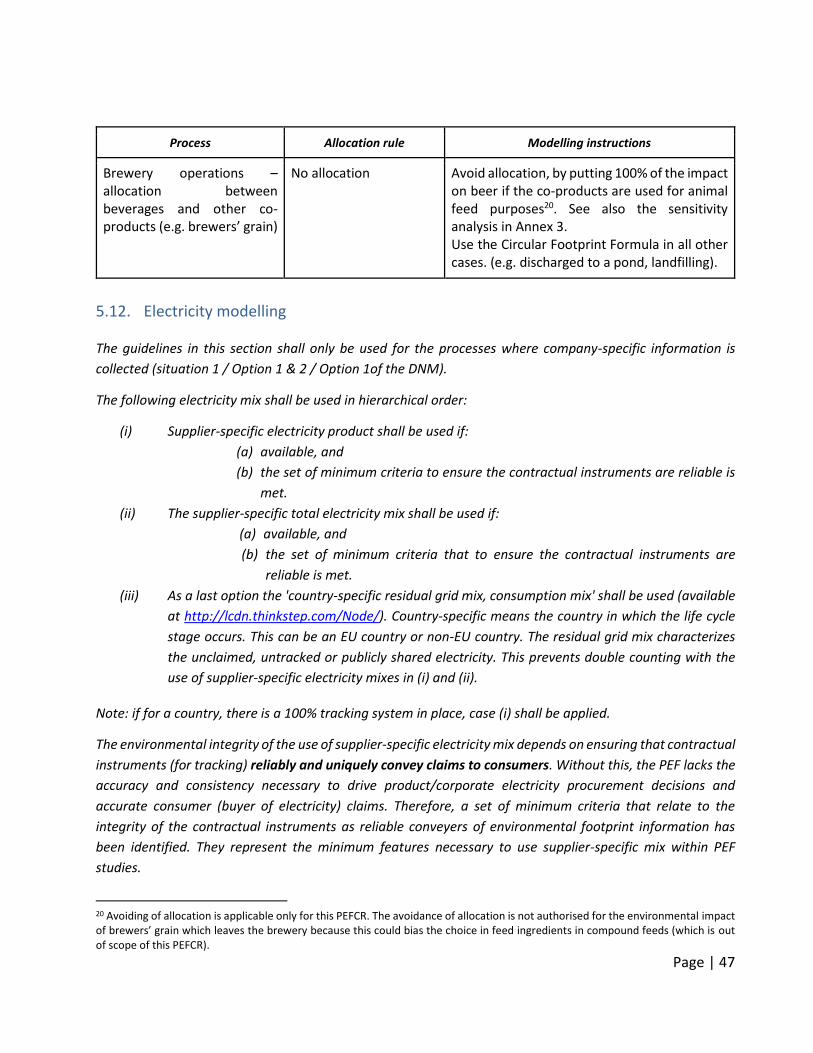
Page | 47
Process Allocation rule Modelling instructions
Brewery operations – allocation between beverages and other co-products (e.g. brewers’ grain)
No allocation Avoid allocation, by putting 100% of the impact on beer if the co-products are used for animal feed purposes20. See also the sensitivity analysis in Annex 3. Use the Circular Footprint Formula in all other cases. (e.g. discharged to a pond, landfilling).
5.12. Electricity modelling The guidelines in this section shall only be used for the processes where company-specific information is
collected (situation 1 / Option 1 & 2 / Option 1of the DNM).
The following electricity mix shall be used in hierarchical order:
(i) Supplier-specific electricity product shall be used if:
(a) available, and
(b) the set of minimum criteria to ensure the contractual instruments are reliable is
met.
(ii) The supplier-specific total electricity mix shall be used if:
(a) available, and
(b) the set of minimum criteria that to ensure the contractual instruments are
reliable is met.
(iii) As a last option the 'country-specific residual grid mix, consumption mix' shall be used (available
at http://lcdn.thinkstep.com/Node/). Country-specific means the country in which the life cycle
stage occurs. This can be an EU country or non-EU country. The residual grid mix characterizes
the unclaimed, untracked or publicly shared electricity. This prevents double counting with the
use of supplier-specific electricity mixes in (i) and (ii).
Note: if for a country, there is a 100% tracking system in place, case (i) shall be applied.
The environmental integrity of the use of supplier-specific electricity mix depends on ensuring that contractual
instruments (for tracking) reliably and uniquely convey claims to consumers. Without this, the PEF lacks the
accuracy and consistency necessary to drive product/corporate electricity procurement decisions and
accurate consumer (buyer of electricity) claims. Therefore, a set of minimum criteria that relate to the
integrity of the contractual instruments as reliable conveyers of environmental footprint information has
been identified. They represent the minimum features necessary to use supplier-specific mix within PEF
studies.
20 Avoiding of allocation is applicable only for this PEFCR. The avoidance of allocation is not authorised for the environmental impact of brewers’ grain which leaves the brewery because this could bias the choice in feed ingredients in compound feeds (which is out of scope of this PEFCR).
Page | 48
Set of minimal criteria to ensure contractual instruments from suppliers:
A supplier-specific electricity product/mix may only be used when the applicant ensures that any contractual
instrument meets the criteria specified below. If contractual instruments do not meet the criteria, then
'country-specific residual grid mix, consumption mix' shall be used in the modelling.
A contractual instrument used for electricity modelling shall:
1. Convey attributes:
● Convey the energy type mix associated with the unit of electricity produced.
● The energy type mix shall be calculated based on delivered electricity, incorporating certificates
sourced and retired on behalf of its customers. Electricity from facilities for which the attributes have
been sold off (via contracts or certificates) shall be characterized as having the environmental
attributes of the country residual consumption mix where the facility is located.
2. Be a unique claim:
● Be the only instruments that carry the environmental attribute claim associated with that quantity
of electricity generated.
● Be tracked and redeemed, retired, or cancelled by or on behalf of the company (e.g. by an audit of
contracts, third-party certification, or may be handled automatically through other disclosure
registries, systems, or mechanisms).
3. Be as close as possible to the period to which the contractual instrument is applied.
Modelling 'country-specific residual grid mix, consumption mix':
Datasets for residual grid mix, per energy type, per country and per voltage have been purchased by the
European Commission and are available in the dedicated node (http://lcdn.thinkstep.com/Node/). In case the
necessary dataset is not available, an alternative dataset shall be chosen according to the procedure
described in section 0. If no dataset is available, the following approach may be used:
Determine the country consumption mix (e.g. X% of MWh produced with hydro energy, Y% of MWh produced
with coal power plant) and combined them with LCI datasets per energy type and country/region (e.g. LCI
dataset for the production of 1MWh hydro energy in Switzerland):
● Activity data related to non-EU country consumption mix per detailed energy type shall be determined
based on:
o Domestic production mix per production technologies
o Import quantity and from which neighbouring countries
o Transmission losses
o Distribution losses
o Type of fuel supply (share of resources used, by import and / or domestic supply)
These data can be found in the publications of the International Energy Agency (IEA).
Page | 49
● Available LCI datasets per fuel technologies in the node. The LCI datasets available are generally
specific to a country or a region in terms of:
o Fuel supply (share of resources used, by import and / or domestic supply),
o Energy carrier properties (e.g. element and energy contents)
o Technology standards of power plants regarding efficiency, firing technology, flue-
gas desulphurisation, NOx removal and de-dusting.
Allocation rules:
Table 15 Allocation rules for electricity
Process Physical relationship Modelling instructions
The same allocation rules shall be
applied for electricity as
mentioned in section 0 and Table
14.
The same allocation rules shall be
applied for electricity as
mentioned in section 0 and Table
14.
The same allocation rules shall be
applied for electricity as
mentioned in section 0 and Table
14.
If the consumed electricity comes from more than one electricity mix, each mix source shall be used in terms
of its proportion in the total kWh consumed. For example, if a fraction of this total kWh consumed is coming
from a specific supplier a supplier-specific electricity mix shall be used for this part. See below for on-site
electricity use.
A specific electricity type can be allocated to one specific product in the following conditions:
a. The production (and related electricity consumption) of a product occurs in a separate site (building),
the energy type physical related to this separated site can be used.
b. The production (and related electricity consumption) of a product occurs in a shared space with
specific energy metering or purchase records or electricity bills, the product specific information
(measure, record, bill) can be used.
c. All the products produced in the specific plant are supplied with a public available PEF study. The
company who wants to make the claim shall make all PEF studies available. The allocation rule
applied shall be described in the PEF study, consistently applied in all PEF studies connected to the
site and verified. An example is the 100% allocation of a greener electricity mix to a specific product.
On-site electricity generation:
If on-site electricity production is equal to the site own consumption, two situations apply:
○ No contractual instruments have been sold to a third party: the own electricity mix (combined with LCI
datasets) shall be modelled.
○ Contractual instruments have been sold to a third party: the 'country-specific residual grid mix,
consumption mix' (combined with LCI datasets) shall be used.
Page | 50
If electricity is produced in excess of the amount consumed on-site within the defined system boundary and
is sold to, for example, the electricity grid, this system can be seen as a multifunctional situation. The system
will provide two functions (e.g. product + electricity) and the following rules shall be followed:
o If possible, apply subdivision.
o Subdivision applies both to separate electricity productions or to a common electricity production
where you can allocate based on electricity amounts the upstream and direct emissions to your own
consumption and to the share you sell out of your company (e.g. if a company has a wind mill on its
production site and export 30% of the produced electricity, emissions related to 70% of produced
electricity should be accounted in the PEF study.
o If not possible, direct substitution shall be used. The country-specific residual consumption electricity
mix shall be used as substitution21.
o Subdivision is considered as not possible when upstream impacts or direct emissions are closely related
to the product itself.
5.13. Climate change modelling The impact category ‘climate change’ shall be modelled considering three sub-categories:
1. Climate change – fossil: This sub-category includes emissions from peat and calcination/carbonation
of limestone. The emission flows ending with '(fossil)' (e.g., 'carbon dioxide (fossil)'' and 'methane
(fossil)') shall be used if available.
2. Climate change – biogenic: This sub-category covers carbon emissions to air (CO2, CO and CH4)
originating from the oxidation and/or reduction of biomass by means of its transformation or
degradation (e.g. combustion, digestion, composting, landfilling) and CO2 uptake from the
atmosphere through photosynthesis during biomass growth – i.e. corresponding to the carbon
content of products, biofuels or aboveground plant residues such as litter and dead wood. Carbon
exchanges from native forests22 shall be modelled under sub-category 3 (incl. connected soil
emissions, derived products, residues). The emission flows ending with '(biogenic)' shall be used.
A simplified modelling approach shall be used when modelling the foreground emissions: Yes
Only the emission 'methane (biogenic)' is modelled, while no further biogenic emissions and uptakes
from atmosphere are included. When methane emissions can be both fossil or biogenic, the release
of biogenic methane shall be modelled first and then the remaining fossil methane.
The product life cycle or part of the life cycle does not have a carbon storage beyond 100 years and
therefore credits from biogenic carbon storage must not be modelled.
21 For some countries, this option is a best case rather than a worst case. 22 Native forests – represents native or long-term, non-degraded forests. Definition adapted from table 8 in Annex V C(2010)3751 to Directive 2009/28/EC.
Page | 51
3. Climate change – land use and land transformation: This sub-category accounts for carbon uptakes
and emissions (CO2, CO and CH4) originating from carbon stock changes caused by land use change
and land use. This sub-category includes biogenic carbon exchanges from deforestation, road
construction or other soil activities (incl. soil carbon emissions). For native forests, all related CO2
emissions are included and modelled under this sub-category (including connected soil emissions,
products derived from native forest23 and residues), while their CO2 uptake is excluded. The emission
flows ending with '(land use change)' shall be used.
For land use change, all carbon emissions and removals shall be modelled following the modelling
guidelines of PAS 2050:2011 (BSI, 2011) and the supplementary document PAS2050-1:2012 (BSI,
2012) for horticultural products. PAS 2050:2011 (BSI, 2011): Large emissions of GHGs can result as a
consequence of land use change. Removals as a direct result of land use change (and not as a result
of long-term management practices) do not usually occur, although it is recognized that this could
happen in specific circumstances. Examples of direct land use change are the conversion of land used
for growing crops to industrial use or conversion from forestland to cropland. All forms of land use
change that result in emissions or removals are to be included. Indirect land use change refers to such
conversions of land use as a consequence of changes in land use elsewhere. While GHG emissions
also arise from indirect land use change, the methods and data requirements for calculating these
emissions are not fully developed. Therefore, the assessment of emissions arising from indirect land
use change is not included.
The GHG emissions and removals arising from direct land use change shall be assessed for any input
to the life cycle of a product originating from that land and shall be included in the assessment of
GHG emissions. The emissions arising from the product shall be assessed on the basis of the default
land use change values provided in PAS 2050:2011 Annex C, unless better data is available. For
countries and land use changes not included in this annex, the emissions arising from the product
shall be assessed using the included GHG emissions and removals occurring as a result of direct land
use change in accordance with the relevant sections of the IPCC (2006). The assessment of the impact
of land use change shall include all direct land use change occurring not more than 20 years, or a
single harvest period, prior to undertaking the assessment (whichever is the longer). The total GHG
emissions and removals arising from direct land use change over the period shall be included in the
quantification of GHG emissions of products arising from this land on the basis of equal allocation to
each year of the period.
1) Where it can be demonstrated that the land use change occurred more than 20 years prior to the
assessment being carried out, no emissions from land use change should be included in the
assessment.
2) Where the timing of land use change cannot be demonstrated to be more than 20 years, or a single
harvest period, prior to making the assessment (whichever is the longer), it shall be assumed that the
land use change occurred on 1 January of either:
23 Following the instantaneous oxidation approach in IPCC 2013 (Chapter 2).
Page | 52
○ the earliest year in which it can be demonstrated that the land use change had occurred; or
○ on 1 January of the year in which the assessment of GHG emissions and removals is being
carried out.
The following hierarchy shall apply when determining the GHG emissions and removals arising from
land use change occurring not more than 20 years or a single harvest period, prior to making the
assessment (whichever is the longer):
1. where the country of production is known and the previous land use is known, the GHG
emissions and removals arising from land use change shall be those resulting from the
change in land use from the previous land use to the current land use in that country
(additional guidelines on the calculations can be found in PAS 2050-1:2012);
2. where the country of production is known, but the former land use is not known, the GHG
emissions arising from land use change shall be the estimate of average emissions from the
land use change for that crop in that country (additional guidelines on the calculations can
be found in PAS 2050-1:2012);
3. where neither the country of production nor the former land use is known, the GHG emissions
arising from land use change shall be the weighted average of the average land use change
emissions of that commodity in the countries in which it is grown.
Knowledge of the prior land use can be demonstrated using a number of sources of information, such
as satellite imagery and land survey data. Where records are not available, local knowledge of prior
land use can be used. Countries in which a crop is grown can be determined from import statistics,
and a cut-off threshold of not less than 90% of the weight of imports may be applied. Data sources,
location and timing of land use change associated with inputs to products shall be reported.
Soil carbon storage shall be modelled, calculated and reported as additional environmental
information: No
The sum of the three sub-categories shall be reported.
The sub-category ‘Climate change-biogenic’ shall be reported separately: No24.
The sub-category ‘Climate change-land use and land transformation’ shall be reported separately: No25.
5.14. Modelling of wastes and recycled content The waste of products used during the manufacturing, distribution, retail, the use stage or after use shall be
included in the overall modelling of the life cycle of the organisation. Overall, this should be modelled and
reported at the life cycle stage where the waste occurs. This section gives guidelines on how to model the
End-of-Life of products as well as the recycled content.
24 See footnote 10. 25 Se footnote 10.
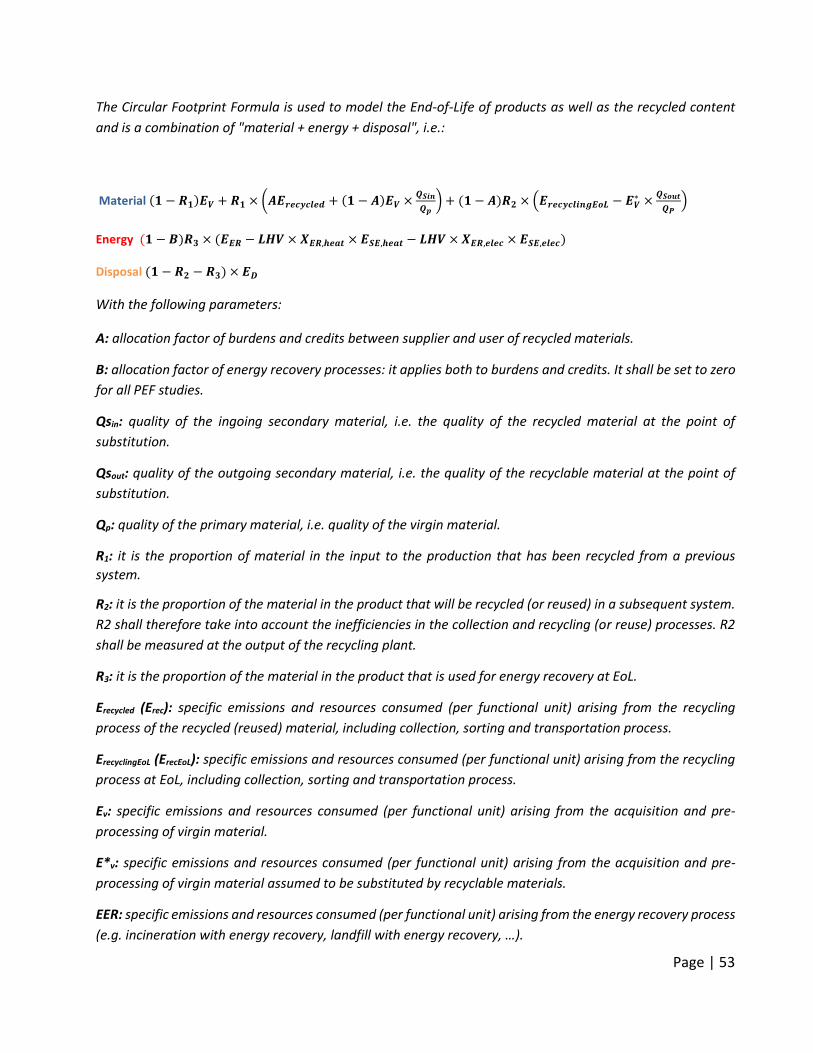
Page | 53
The Circular Footprint Formula is used to model the End-of-Life of products as well as the recycled content
and is a combination of "material + energy + disposal", i.e.:
Material (𝟏 − 𝑹𝟏)𝑬𝑽 + 𝑹𝟏 × (𝑨𝑬𝒓𝒆𝒄𝒚𝒄𝒍𝒆𝒅 + (𝟏 − 𝑨)𝑬𝑽 ×𝑸𝑺𝒊𝒏
𝑸𝒑) + (𝟏 − 𝑨)𝑹𝟐 × (𝑬𝒓𝒆𝒄𝒚𝒄𝒍𝒊𝒏𝒈𝑬𝒐𝑳 − 𝑬𝑽
∗ ×𝑸𝑺𝒐𝒖𝒕
𝑸𝑷)
Energy (𝟏 − 𝑩)𝑹𝟑 × (𝑬𝑬𝑹 − 𝑳𝑯𝑽 × 𝑿𝑬𝑹,𝒉𝒆𝒂𝒕 × 𝑬𝑺𝑬,𝒉𝒆𝒂𝒕 − 𝑳𝑯𝑽 × 𝑿𝑬𝑹,𝒆𝒍𝒆𝒄 × 𝑬𝑺𝑬,𝒆𝒍𝒆𝒄)
Disposal (𝟏 − 𝑹𝟐 − 𝑹𝟑) × 𝑬𝑫
With the following parameters:
A: allocation factor of burdens and credits between supplier and user of recycled materials.
B: allocation factor of energy recovery processes: it applies both to burdens and credits. It shall be set to zero
for all PEF studies.
Qsin: quality of the ingoing secondary material, i.e. the quality of the recycled material at the point of
substitution.
Qsout: quality of the outgoing secondary material, i.e. the quality of the recyclable material at the point of
substitution.
Qp: quality of the primary material, i.e. quality of the virgin material.
R1: it is the proportion of material in the input to the production that has been recycled from a previous
system.
R2: it is the proportion of the material in the product that will be recycled (or reused) in a subsequent system.
R2 shall therefore take into account the inefficiencies in the collection and recycling (or reuse) processes. R2
shall be measured at the output of the recycling plant.
R3: it is the proportion of the material in the product that is used for energy recovery at EoL.
Erecycled (Erec): specific emissions and resources consumed (per functional unit) arising from the recycling
process of the recycled (reused) material, including collection, sorting and transportation process.
ErecyclingEoL (ErecEoL): specific emissions and resources consumed (per functional unit) arising from the recycling
process at EoL, including collection, sorting and transportation process.
Ev: specific emissions and resources consumed (per functional unit) arising from the acquisition and pre-
processing of virgin material.
E*v: specific emissions and resources consumed (per functional unit) arising from the acquisition and pre-
processing of virgin material assumed to be substituted by recyclable materials.
EER: specific emissions and resources consumed (per functional unit) arising from the energy recovery process
(e.g. incineration with energy recovery, landfill with energy recovery, …).
Page | 54
ESE,heat and ESE,elec: specific emissions and resources consumed (per functional unit) that would have arisen
from the specific substituted energy source, heat and electricity respectively.
ED: specific emissions and resources consumed (per functional unit) arising from disposal of waste material
at the EoL of the analysed product, without energy recovery.
XER,heat and XER,elec: the efficiency of the energy recovery process for both heat and electricity.
LHV: Lower Heating Value of the material in the product that is used for energy recovery.
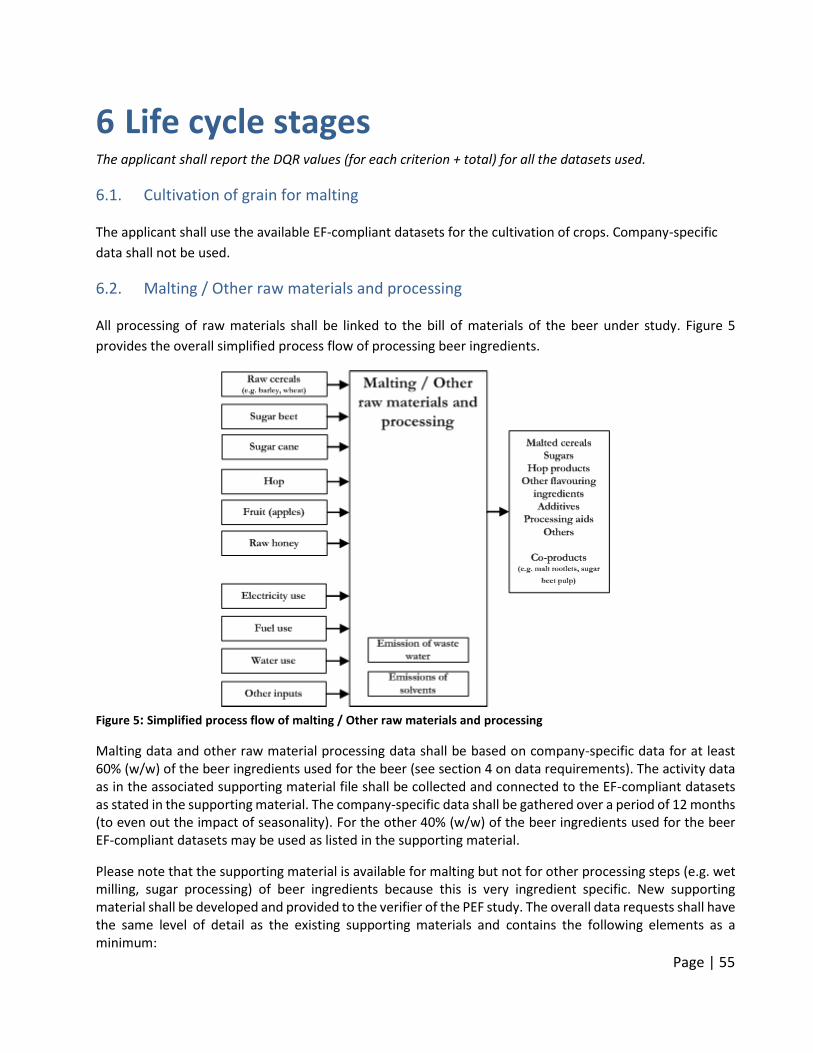
Page | 55
6 Life cycle stages The applicant shall report the DQR values (for each criterion + total) for all the datasets used.
6.1. Cultivation of grain for malting The applicant shall use the available EF-compliant datasets for the cultivation of crops. Company-specific
data shall not be used.
6.2. Malting / Other raw materials and processing All processing of raw materials shall be linked to the bill of materials of the beer under study. Figure 5
provides the overall simplified process flow of processing beer ingredients.
Figure 5: Simplified process flow of malting / Other raw materials and processing
Malting data and other raw material processing data shall be based on company-specific data for at least 60% (w/w) of the beer ingredients used for the beer (see section 4 on data requirements). The activity data as in the associated supporting material file shall be collected and connected to the EF-compliant datasets as stated in the supporting material. The company-specific data shall be gathered over a period of 12 months (to even out the impact of seasonality). For the other 40% (w/w) of the beer ingredients used for the beer EF-compliant datasets may be used as listed in the supporting material.
Please note that the supporting material is available for malting but not for other processing steps (e.g. wet milling, sugar processing) of beer ingredients because this is very ingredient specific. New supporting material shall be developed and provided to the verifier of the PEF study. The overall data requests shall have the same level of detail as the existing supporting materials and contains the following elements as a minimum:
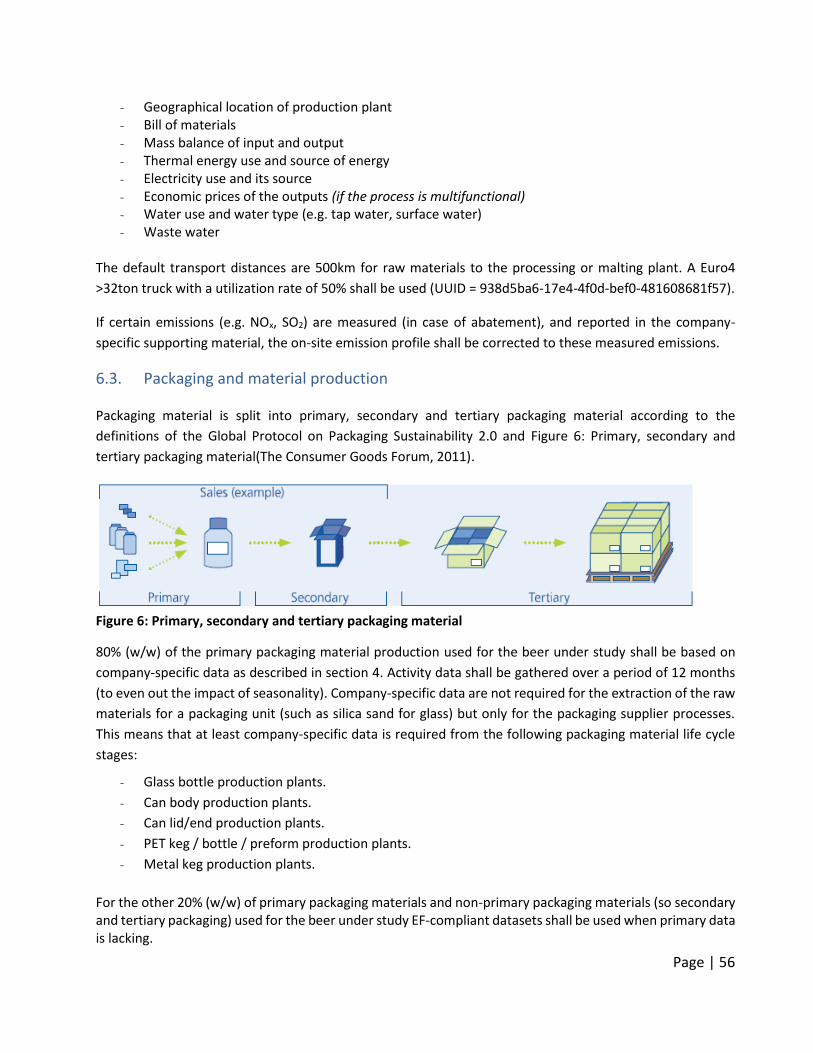
Page | 56
- Geographical location of production plant - Bill of materials - Mass balance of input and output - Thermal energy use and source of energy - Electricity use and its source - Economic prices of the outputs (if the process is multifunctional) - Water use and water type (e.g. tap water, surface water) - Waste water
The default transport distances are 500km for raw materials to the processing or malting plant. A Euro4
>32ton truck with a utilization rate of 50% shall be used (UUID = 938d5ba6-17e4-4f0d-bef0-481608681f57).
If certain emissions (e.g. NOx, SO2) are measured (in case of abatement), and reported in the company-
specific supporting material, the on-site emission profile shall be corrected to these measured emissions.
6.3. Packaging and material production Packaging material is split into primary, secondary and tertiary packaging material according to the
definitions of the Global Protocol on Packaging Sustainability 2.0 and Figure 6: Primary, secondary and
tertiary packaging material(The Consumer Goods Forum, 2011).
Figure 6: Primary, secondary and tertiary packaging material
80% (w/w) of the primary packaging material production used for the beer under study shall be based on
company-specific data as described in section 4. Activity data shall be gathered over a period of 12 months
(to even out the impact of seasonality). Company-specific data are not required for the extraction of the raw
materials for a packaging unit (such as silica sand for glass) but only for the packaging supplier processes.
This means that at least company-specific data is required from the following packaging material life cycle
stages:
- Glass bottle production plants.
- Can body production plants.
- Can lid/end production plants.
- PET keg / bottle / preform production plants.
- Metal keg production plants.
For the other 20% (w/w) of primary packaging materials and non-primary packaging materials (so secondary and tertiary packaging) used for the beer under study EF-compliant datasets shall be used when primary data is lacking.
Page | 57
The company-specific data which shall be collected including the background datasets which shall be used
are listed in the associated supplementary information named “Beer PEFCR Final Version June 2018-life cycle
inventory.xls”.
The company-specific data shall be specific for the plant where the primary packaging material is produced
(so no average of multiple production locations). The raw material input (e.g. post-consumer glass cullets)
shall be packaging specific based on a yearly average. The other input/output may be yearly averages of the
plant.
The default transport distances are 500km for virgin materials to the packaging production location and
100km for recycled materials. A Euro4 >32ton truck with a utilization rate of 50% shall be used (UUID =
938d5ba6-17e4-4f0d-bef0-481608681f57).
It shall be justified in the PEF study if other datasets are used than those stated in the supporting material.
If certain emissions (e.g. NOx, SO2) are measured (in case of abatement), and reported in the company-
specific supporting material, the on-site emission profile shall be corrected to these measured emissions.
Guidance on how to model the production of glass bottles
The point of substitution is at level 1 when glass is modelled based on company specific data. This means
that Ev is the sum of all the emission profiles of the virgin raw materials (e.g. sand, dolomite, etc) used for
the specific beer bottle in the BoM and Ev = E*v. Erecyced is the collection, sorting and transportation of glass
cullets to the glass factory and Erecyced = ErecyclingEoL.
Because the point of substitution is at level 1 (before the gate of the glass factory), the CFF is applied on the
raw materials and the additional resources and emissions of the glass factory can be calculated and added
to the raw materials. This means that the glass factory itself is not part of the CFF.
The following process emissions coming from the carbon in the virgin glass raw materials and emitted from
the furnace shall be applied (based on company-specific data from supporting studies):
- Soda: 0.478 kg CO2-eq. / kg soda
- Dolomite: 0.415 kg CO2-eq. / kg dolomite
- Limestone/Chalk: 0.440 kg CO2-eq. / kg limestone/chalk
Model guidance of aluminium can bodies, steel can bodies and aluminium can ends
The point of substitution is at level 2. The company-specific data provides at least:
- how much recycled content is included in the can body/end.
- the energy use to produce the can body/end.
- The mass balance to produce the can body/end.
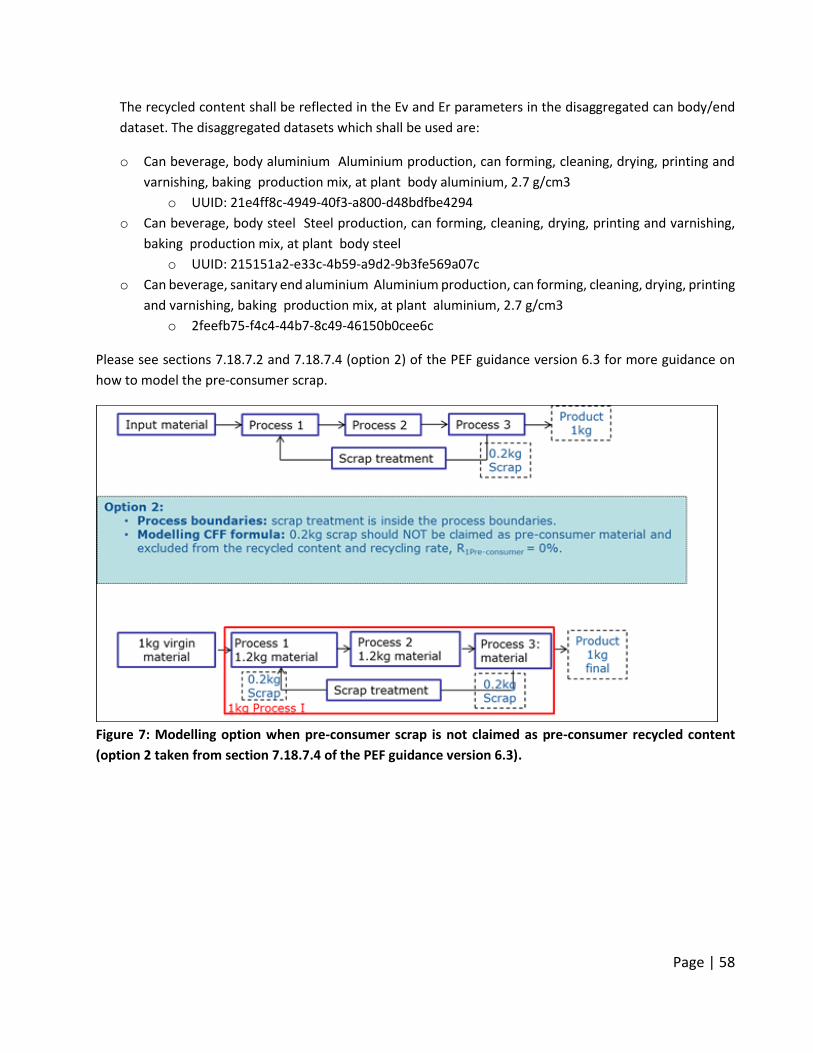
Page | 58
The recycled content shall be reflected in the Ev and Er parameters in the disaggregated can body/end
dataset. The disaggregated datasets which shall be used are:
o Can beverage, body aluminium Aluminium production, can forming, cleaning, drying, printing and
varnishing, baking production mix, at plant body aluminium, 2.7 g/cm3
o UUID: 21e4ff8c-4949-40f3-a800-d48bdfbe4294
o Can beverage, body steel Steel production, can forming, cleaning, drying, printing and varnishing,
baking production mix, at plant body steel
o UUID: 215151a2-e33c-4b59-a9d2-9b3fe569a07c
o Can beverage, sanitary end aluminium Aluminium production, can forming, cleaning, drying, printing
and varnishing, baking production mix, at plant aluminium, 2.7 g/cm3
o 2feefb75-f4c4-44b7-8c49-46150b0cee6c
Please see sections 7.18.7.2 and 7.18.7.4 (option 2) of the PEF guidance version 6.3 for more guidance on
how to model the pre-consumer scrap.
Figure 7: Modelling option when pre-consumer scrap is not claimed as pre-consumer recycled content
(option 2 taken from section 7.18.7.4 of the PEF guidance version 6.3).
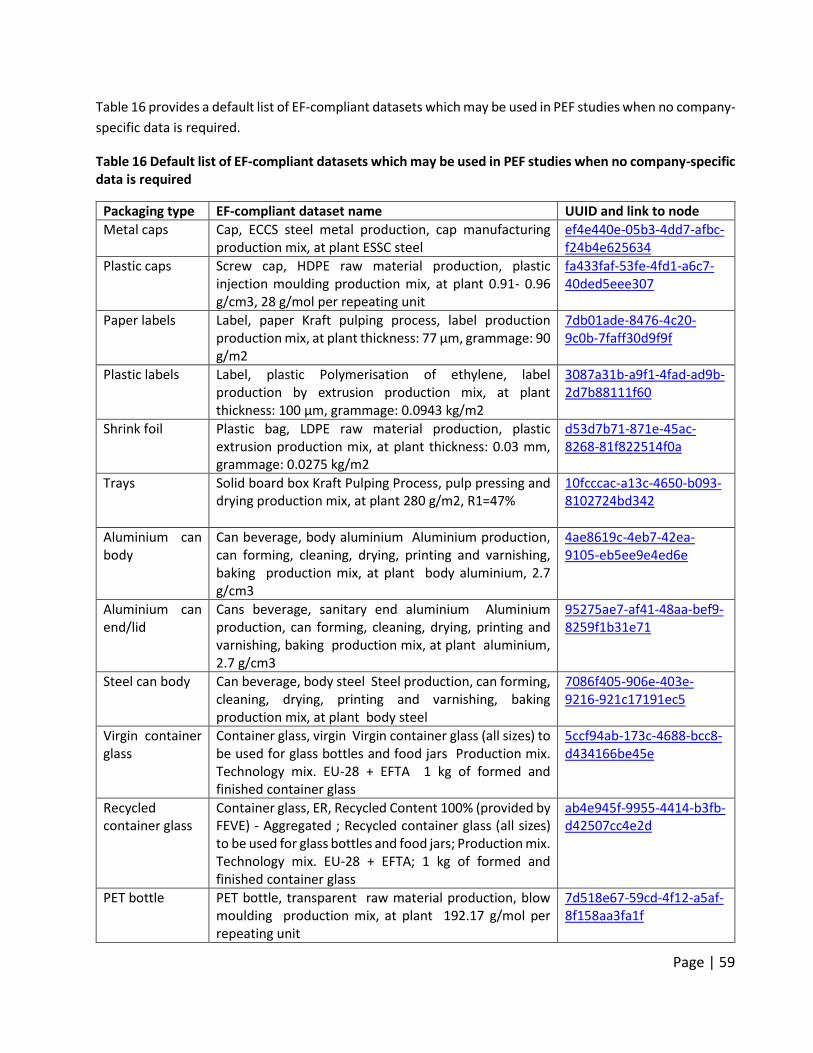
Page | 59
Table 16 provides a default list of EF-compliant datasets which may be used in PEF studies when no company-
specific data is required.
Table 16 Default list of EF-compliant datasets which may be used in PEF studies when no company-specific data is required
Packaging type EF-compliant dataset name UUID and link to node
Metal caps Cap, ECCS steel metal production, cap manufacturing production mix, at plant ESSC steel
ef4e440e-05b3-4dd7-afbc-f24b4e625634
Plastic caps Screw cap, HDPE raw material production, plastic injection moulding production mix, at plant 0.91- 0.96 g/cm3, 28 g/mol per repeating unit
fa433faf-53fe-4fd1-a6c7-40ded5eee307
Paper labels Label, paper Kraft pulping process, label production production mix, at plant thickness: 77 µm, grammage: 90 g/m2
7db01ade-8476-4c20-9c0b-7faff30d9f9f
Plastic labels Label, plastic Polymerisation of ethylene, label production by extrusion production mix, at plant thickness: 100 µm, grammage: 0.0943 kg/m2
3087a31b-a9f1-4fad-ad9b-2d7b88111f60
Shrink foil Plastic bag, LDPE raw material production, plastic extrusion production mix, at plant thickness: 0.03 mm, grammage: 0.0275 kg/m2
d53d7b71-871e-45ac-8268-81f822514f0a
Trays Solid board box Kraft Pulping Process, pulp pressing and drying production mix, at plant 280 g/m2, R1=47%
10fcccac-a13c-4650-b093-8102724bd342
Aluminium can body
Can beverage, body aluminium Aluminium production, can forming, cleaning, drying, printing and varnishing, baking production mix, at plant body aluminium, 2.7 g/cm3
4ae8619c-4eb7-42ea-9105-eb5ee9e4ed6e
Aluminium can end/lid
Cans beverage, sanitary end aluminium Aluminium production, can forming, cleaning, drying, printing and varnishing, baking production mix, at plant aluminium, 2.7 g/cm3
95275ae7-af41-48aa-bef9-8259f1b31e71
Steel can body Can beverage, body steel Steel production, can forming, cleaning, drying, printing and varnishing, baking production mix, at plant body steel
7086f405-906e-403e-9216-921c17191ec5
Virgin container glass
Container glass, virgin Virgin container glass (all sizes) to be used for glass bottles and food jars Production mix. Technology mix. EU-28 + EFTA 1 kg of formed and finished container glass
5ccf94ab-173c-4688-bcc8-d434166be45e
Recycled container glass
Container glass, ER, Recycled Content 100% (provided by FEVE) - Aggregated ; Recycled container glass (all sizes) to be used for glass bottles and food jars; Production mix. Technology mix. EU-28 + EFTA; 1 kg of formed and finished container glass
ab4e945f-9955-4414-b3fb-d42507cc4e2d
PET bottle PET bottle, transparent raw material production, blow moulding production mix, at plant 192.17 g/mol per repeating unit
7d518e67-59cd-4f12-a5af-8f158aa3fa1f
Page | 60
Guidance on how to model steel beer tanks
The weight of a 1000 litre tank is 47.2kg stainless steel. The assumed triprate is 250 based on 25 refills per
year for 10 years.
6.3.1. Reuse rates
Reuse rate is the number of times a packaging material is used (e.g., filled) at the factory. This is often also
called trip rates, reuse time or number of rotations. This may be expressed as the absolute number of reuse
or as % of reuse rate. For example: a reuse rate of 80% equals 5 reuses. Equation 3 describes the conversion:
Number of reuse = 𝟏
𝟏𝟎𝟎%−% 𝒓𝒆𝒖𝒔𝒆 𝒓𝒂𝒕𝒆 [Equation 3]
The number of reuse applied here refers to the total number of uses during the life of a packaging. It includes
both the first use and all the following reuses.
A packaging return system can be organized by the company owning the packaging material (company
owned pools) or can be organized at a higher level by a third party e.g., the government or a pooler (third
party operated pools). This may have an influence on the lifetime of the material as well as the data source
to be used. Therefore, it is important to separate these two return systems.
For company owned packaging pools the reuse rate shall be calculated using supply-chain-specific data.
Depending on the data available within the company, two different calculation approaches may be used (see
Option a and b presented below). Returnable glass bottles are used as example but the calculations also apply
for other company owned reusable packaging.
Option a: The use of supply-chain-specific data, based on accumulated experience over the lifetime of the
previous glass bottle pool. This is the most accurate way to calculate the reuse rate of bottles for the previous
bottle pool and can be a proper estimate for the current bottle pool. The following supply-chain-specific data
is collected (see wiki page 'Access to documents of common interest'
https://webgate.ec.europa.eu/fpfis/wikis/display/ EUENVFP/):
● Number of bottles filled during the lifetime of the bottle pool (#Fi)
● Number of bottles at initial stock plus purchased over the lifetime of the bottle pool (#B)
Reuse rate of the bottle pool =# 𝐹𝑖
#𝐵 [Equation 4]
The net glass use (kg glass/l beverage) =#𝑩×(𝒌𝒈 𝒈𝒍𝒂𝒔𝒔/𝒃𝒐𝒕𝒕𝒍𝒆)
#𝑭𝒊 [Equation 5]
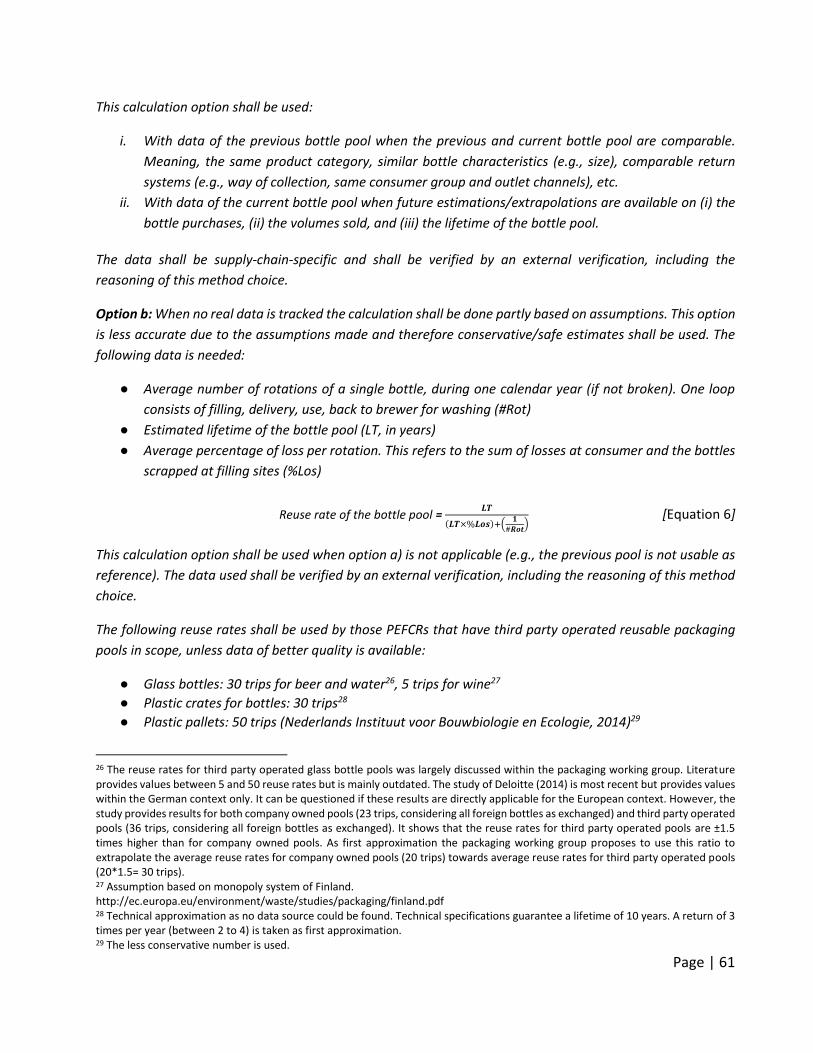
Page | 61
This calculation option shall be used:
i. With data of the previous bottle pool when the previous and current bottle pool are comparable.
Meaning, the same product category, similar bottle characteristics (e.g., size), comparable return
systems (e.g., way of collection, same consumer group and outlet channels), etc.
ii. With data of the current bottle pool when future estimations/extrapolations are available on (i) the
bottle purchases, (ii) the volumes sold, and (iii) the lifetime of the bottle pool.
The data shall be supply-chain-specific and shall be verified by an external verification, including the
reasoning of this method choice.
Option b: When no real data is tracked the calculation shall be done partly based on assumptions. This option
is less accurate due to the assumptions made and therefore conservative/safe estimates shall be used. The
following data is needed:
● Average number of rotations of a single bottle, during one calendar year (if not broken). One loop
consists of filling, delivery, use, back to brewer for washing (#Rot)
● Estimated lifetime of the bottle pool (LT, in years)
● Average percentage of loss per rotation. This refers to the sum of losses at consumer and the bottles
scrapped at filling sites (%Los)
Reuse rate of the bottle pool = 𝑳𝑻
(𝑳𝑻×%𝑳𝒐𝒔)+(𝟏
#𝑹𝒐𝒕) [Equation 6]
This calculation option shall be used when option a) is not applicable (e.g., the previous pool is not usable as
reference). The data used shall be verified by an external verification, including the reasoning of this method
choice.
The following reuse rates shall be used by those PEFCRs that have third party operated reusable packaging
pools in scope, unless data of better quality is available:
● Glass bottles: 30 trips for beer and water26, 5 trips for wine27
● Plastic crates for bottles: 30 trips28
● Plastic pallets: 50 trips (Nederlands Instituut voor Bouwbiologie en Ecologie, 2014)29
26 The reuse rates for third party operated glass bottle pools was largely discussed within the packaging working group. Literature provides values between 5 and 50 reuse rates but is mainly outdated. The study of Deloitte (2014) is most recent but provides values within the German context only. It can be questioned if these results are directly applicable for the European context. However, the study provides results for both company owned pools (23 trips, considering all foreign bottles as exchanged) and third party operated pools (36 trips, considering all foreign bottles as exchanged). It shows that the reuse rates for third party operated pools are ±1.5 times higher than for company owned pools. As first approximation the packaging working group proposes to use this ratio to extrapolate the average reuse rates for company owned pools (20 trips) towards average reuse rates for third party operated pools (20*1.5= 30 trips). 27 Assumption based on monopoly system of Finland. http://ec.europa.eu/environment/waste/studies/packaging/finland.pdf 28 Technical approximation as no data source could be found. Technical specifications guarantee a lifetime of 10 years. A return of 3 times per year (between 2 to 4) is taken as first approximation. 29 The less conservative number is used.
Page | 62
● Wooden pallets: 25 trips (Nederlands Instituut voor Bouwbiologie en Ecologie, 2014)30
The raw material consumption of reusable packaging shall be calculated by dividing the actual weight of the
packaging by the reuse rate.
The reuse rate affects the quantity of transport that is needed per FU. The transport impact shall be calculated
by dividing the one-way trip impact by the number of times this packaging is reused.
Modelling the recycled content
The following formula is used to model the recycled content:
(𝟏 − 𝑹𝟏)𝑬𝑽 + 𝑹𝟏 × (𝑨𝑬𝒓𝒆𝒄𝒚𝒄𝒍𝒆𝒅 + (𝟏 − 𝑨)𝑬𝑽 ×𝑸𝑺𝒊𝒏
𝑸𝒑) [Equation 7]
The R1 values applied shall be supply-chain or default as provided in the table above, in relation with the
DNM. Material-specific values based on supply market statistics are not accepted as a proxy. The applied R1
values shall be subject to PEF study verification.
When using supply-chain specific R1 values other than 0, traceability throughout the supply chain is
necessary. The following general guidelines shall be followed when using supply-chain specific R1 values:
● The supplier information (through e.g., statement of conformity or delivery note) shall be maintained
during all stages of production and delivery at the converter;
● Once the material is delivered to the converter for production of the end products, the converter shall
handle information through their regular administrative procedures;
● The converter for production of the end products claiming recycled content shall demonstrate
through his management system the [%] of recycled input material into the respective end product(s).
● The latter demonstration shall be transferred upon request to the user of the end product. In case a
PEF profile is calculated and reported, this shall be stated as additional technical information of the
PEF profile.
● Company-owned traceability systems can be applied as long as they cover the general guidelines
outlined above.
6.4. Agricultural modelling Handling multi-functional processes: The rules described in the LEAP Guideline shall be followed:
‘Environmental performance of animal feeds supply chains (pages 36-43), FAO 2015, available at
http://www.fao.org/partnerships/leap/publications/en/’.
Use of crop type specific and country-region-or-climate specific data for yield, water and land use, land use
change, fertiliser (artificial and organic) amount (N, P amount) and pesticide amount (per active ingredient),
per hectare per year, if available.
30 Half of plastic pallets is used as approximation.
Page | 63
Cultivation data shall be collected over a period of time sufficient to provide an average assessment of the
life cycle inventory associated with the inputs and outputs of cultivation that will offset fluctuations due to
seasonal differences:
● For annual crops, an assessment period of at least three years shall be used (to level out differences
in crop yields related to fluctuations in growing conditions over the years such as climate, pests and
diseases, et cetera). Where data covering a three-year period is not available i.e. due to starting up
a new production system (e.g. new greenhouse, newly cleared land, shift to other crop), the
assessment may be conducted over a shorter period, but shall be not less than 1 year. Crops/plants
grown in greenhouses shall be considered as annual crops/plants, unless the cultivation cycle is
significantly shorter than a year and another crop is cultivated consecutively within that year.
Tomatoes, peppers and other crops which are cultivated and harvested over a longer period through
the year are considered as annual crops.
● For perennial plants (including entire plants and edible portions of perennial plants) a steady state
situation (i.e. where all development stages are proportionally represented in the studied time period)
shall be assumed and a three-year period shall be used to estimate the inputs and outputs31.
● Where the different stages in the cultivation cycle are known to be disproportional, a correction shall
be made by adjusting the crop areas allocated to different development stages in proportion to the
crop areas expected in a theoretical steady state. The application of such correction shall be justified
and recorded. The life cycle inventory of perennial plants and crops shall not be undertaken until the
production system actually yields output.
● For crops that are grown and harvested in less than one year (e.g. lettuce produced in 2 to 4 months)
data shall be gathered in relation to the specific time period for production of a single crop, from at
least three recent consecutive cycles. Averaging over three years can best be done by first gathering
annual data and calculating the life cycle inventory per year and then determine the three years
average.
Pesticide emissions shall be modelled as specific active ingredients. As default approach, the pesticides
applied on the field shall be modelled as 90% emitted to the agricultural soil compartment, 9% emitted to
air and 1% emitted to water.
Fertiliser (and manure) emissions shall be differentiated per fertilizer type and cover as a minimum:
● NH3, to air (from N-fertiliser application)
● N2O, to air (direct and indirect) (from N-fertiliser application)
● CO2, to air (from lime, urea and urea-compounds application)
● NO3, to water unspecified (leaching from N-fertiliser application)
31 The underlying assumption in the cradle to gate life cycle inventory assessment of horticultural products is that the inputs and outputs of the cultivation are in a ‘steady state’, which means that all development stages of perennial crops (with different quantities of inputs and outputs) shall be proportionally represented in the time period of cultivation that is studied. This approach gives the advantage that inputs and outputs of a relatively short period can be used for the calculation of the cradle-to-gate life cycle inventory from the perennial crop product. Studying all development stages of a horticultural perennial crop can have a lifespan of 30 years and more (e.g. in case of fruit and nut trees).
Page | 64
● PO4, to water unspecified or freshwater (leaching and run-off of soluble phosphate from P-fertiliser
application)
● P, to water unspecified or freshwater (soil particles containing phosphorous, from P-fertiliser
application).
The LCI for P emissions should be modelled as the amount of P emitted to water after run-off and the emission
compartment 'water' shall be used. When this amount is not available, the LCI may be modelled as the
amount of P applied on the agricultural field (through manure or fertilisers) and the emission compartment
'soil' shall be used. In this case, the run-off from soil to water is part of the impact assessment method.
The LCI for N emissions shall be modelled as the amount of emissions ending up in the different emission
compartments per amount of fertilisers applied. The nitrogen emissions shall be calculated from Nitrogen
applications of the farmer on the field and excluding external sources (e.g. rain deposition).
For nitrogen-based fertilisers the Tier 1 emissions factors of IPCC 2006 should be used.
Table 17 Parameters to be used when modelling nitrogen emission in soil
Emission Compartment Value to be applied
N2O (synthetic fertiliser and manure; direct and indirect)
Air 0.022 kg N2O/ kg N fertilizer applied
NH3 (synthetic fertiliser) Air kg NH3= kg N * FracGASF= 1*0.1* (17/14)= 0.12 kg NH3/ kg N fertilizer applied
NH3 (manure) Air kg NH3= kg N*FracGASF= 1*0.2* (17/14)= 0.24 kg NH3/ kg N manure applied
NO3- (synthetic fertiliser and
manure) Water kg NO3
-= kg N*FracLEACH = 1*0.3*(62/14) = 1.33 kg NO3
-/ kg N applied
P based fertilisers Water 0.05 kg P/ kg P applied
Heavy metal emissions from field inputs shall be modelled as emission to soil and/or leaching or erosion to
water. The inventory to water shall specify the oxidation state of the metal (e.g., Cr+3, Cr+6). As crops
assimilate part of the heavy metal emissions during their cultivation clarification is needed on how to model
crops that act as a sink. The following modelling approach shall be used:
● The final fate (emission compartment) of the heavy metal elementary flows is considered within the
system boundary: the inventory does account for the final emissions (release) of the heavy metals in
the environment and therefore shall also account for the uptake of heavy metals by the crop. For
example, heavy metals in agricultural crops cultivated for feed will mainly end up in the animal
digestion and used as manure back on the field where the metals are released in the environment
and their impacts are captured by the impact assessment methods. Therefore, the inventory of the
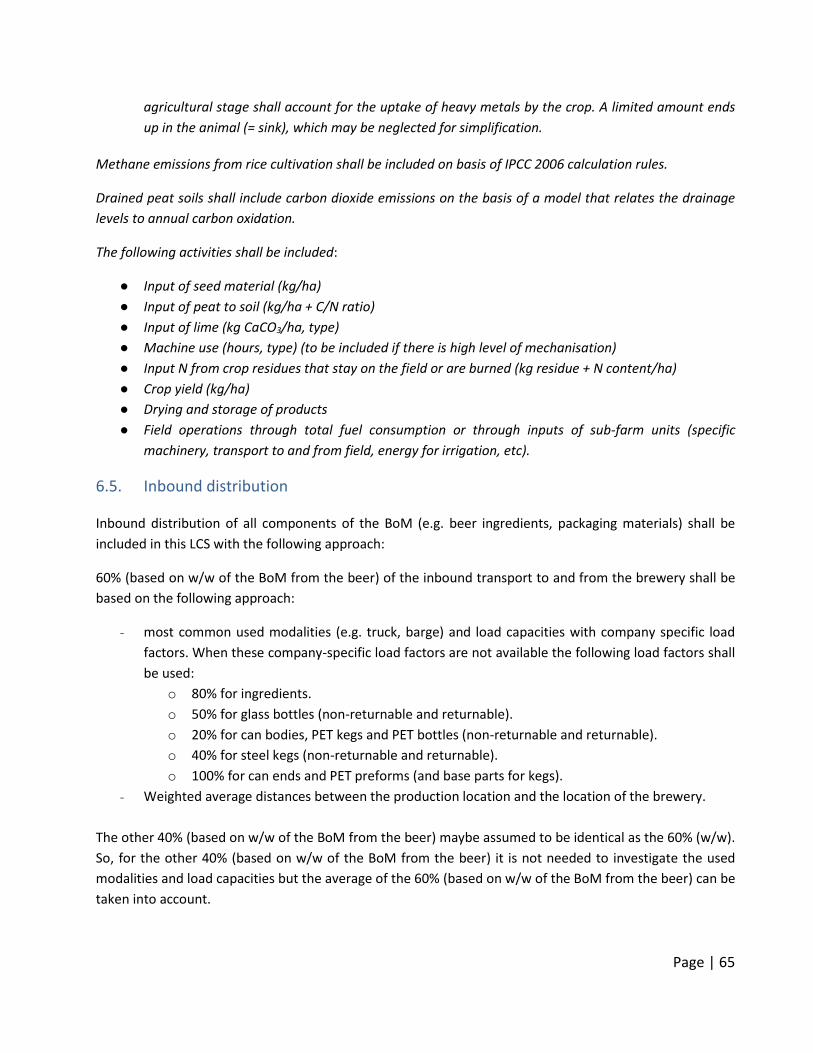
Page | 65
agricultural stage shall account for the uptake of heavy metals by the crop. A limited amount ends
up in the animal (= sink), which may be neglected for simplification.
Methane emissions from rice cultivation shall be included on basis of IPCC 2006 calculation rules.
Drained peat soils shall include carbon dioxide emissions on the basis of a model that relates the drainage
levels to annual carbon oxidation.
The following activities shall be included:
● Input of seed material (kg/ha)
● Input of peat to soil (kg/ha + C/N ratio)
● Input of lime (kg CaCO3/ha, type)
● Machine use (hours, type) (to be included if there is high level of mechanisation)
● Input N from crop residues that stay on the field or are burned (kg residue + N content/ha)
● Crop yield (kg/ha)
● Drying and storage of products
● Field operations through total fuel consumption or through inputs of sub-farm units (specific
machinery, transport to and from field, energy for irrigation, etc).
6.5. Inbound distribution Inbound distribution of all components of the BoM (e.g. beer ingredients, packaging materials) shall be
included in this LCS with the following approach:
60% (based on w/w of the BoM from the beer) of the inbound transport to and from the brewery shall be
based on the following approach:
- most common used modalities (e.g. truck, barge) and load capacities with company specific load
factors. When these company-specific load factors are not available the following load factors shall
be used:
o 80% for ingredients.
o 50% for glass bottles (non-returnable and returnable).
o 20% for can bodies, PET kegs and PET bottles (non-returnable and returnable).
o 40% for steel kegs (non-returnable and returnable).
o 100% for can ends and PET preforms (and base parts for kegs).
- Weighted average distances between the production location and the location of the brewery.
The other 40% (based on w/w of the BoM from the beer) maybe assumed to be identical as the 60% (w/w).
So, for the other 40% (based on w/w of the BoM from the beer) it is not needed to investigate the used
modalities and load capacities but the average of the 60% (based on w/w of the BoM from the beer) can be
taken into account.
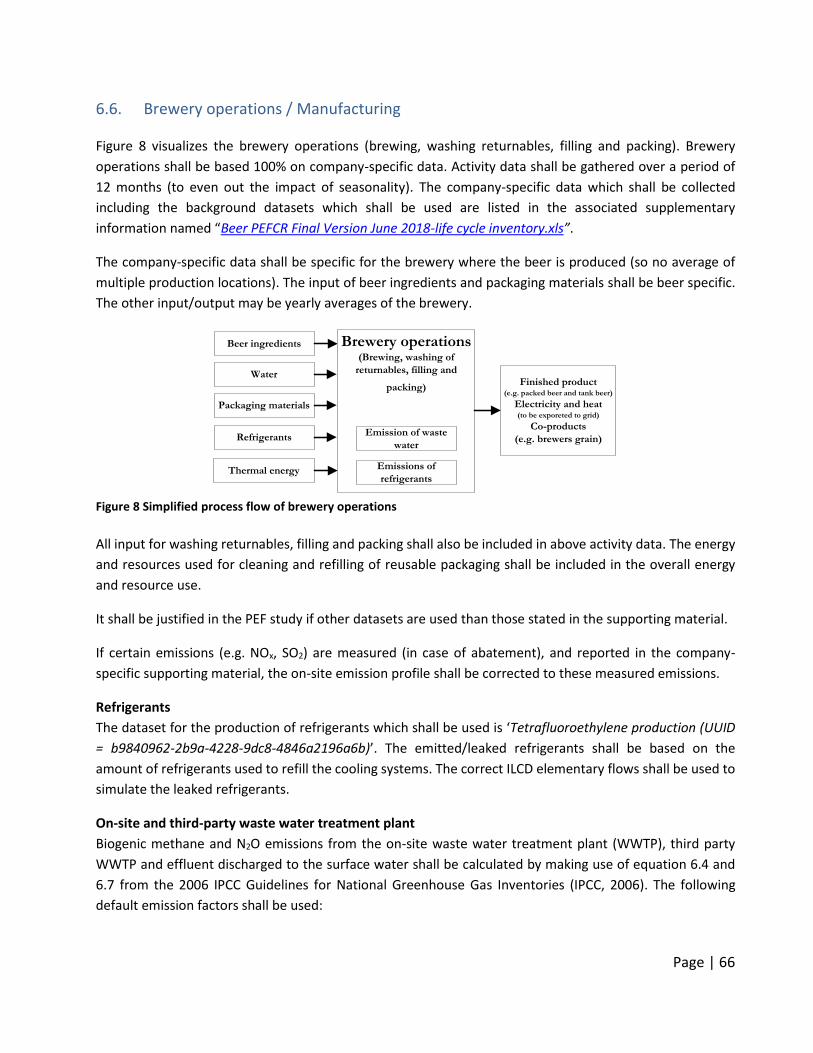
Page | 66
6.6. Brewery operations / Manufacturing Figure 8 visualizes the brewery operations (brewing, washing returnables, filling and packing). Brewery
operations shall be based 100% on company-specific data. Activity data shall be gathered over a period of
12 months (to even out the impact of seasonality). The company-specific data which shall be collected
including the background datasets which shall be used are listed in the associated supplementary
information named “Beer PEFCR Final Version June 2018-life cycle inventory.xls”.
The company-specific data shall be specific for the brewery where the beer is produced (so no average of
multiple production locations). The input of beer ingredients and packaging materials shall be beer specific.
The other input/output may be yearly averages of the brewery.
Figure 8 Simplified process flow of brewery operations
All input for washing returnables, filling and packing shall also be included in above activity data. The energy
and resources used for cleaning and refilling of reusable packaging shall be included in the overall energy
and resource use.
It shall be justified in the PEF study if other datasets are used than those stated in the supporting material.
If certain emissions (e.g. NOx, SO2) are measured (in case of abatement), and reported in the company-
specific supporting material, the on-site emission profile shall be corrected to these measured emissions.
Refrigerants
The dataset for the production of refrigerants which shall be used is ‘Tetrafluoroethylene production (UUID
= b9840962-2b9a-4228-9dc8-4846a2196a6b)’. The emitted/leaked refrigerants shall be based on the
amount of refrigerants used to refill the cooling systems. The correct ILCD elementary flows shall be used to
simulate the leaked refrigerants.
On-site and third-party waste water treatment plant
Biogenic methane and N2O emissions from the on-site waste water treatment plant (WWTP), third party
WWTP and effluent discharged to the surface water shall be calculated by making use of equation 6.4 and
6.7 from the 2006 IPCC Guidelines for National Greenhouse Gas Inventories (IPCC, 2006). The following
default emission factors shall be used:
Beer ingredients
Water
Packaging materials
Refrigerants
Brewery operations(Brewing, washing of
returnables, filling and
packing)
Thermal energy
Finished product(e.g. packed beer and tank beer)
Electricity and heat(to be exporeted to grid)
Co-products
(e.g. brewers grain)
Emissions of
refrigerants
Emission of waste
water
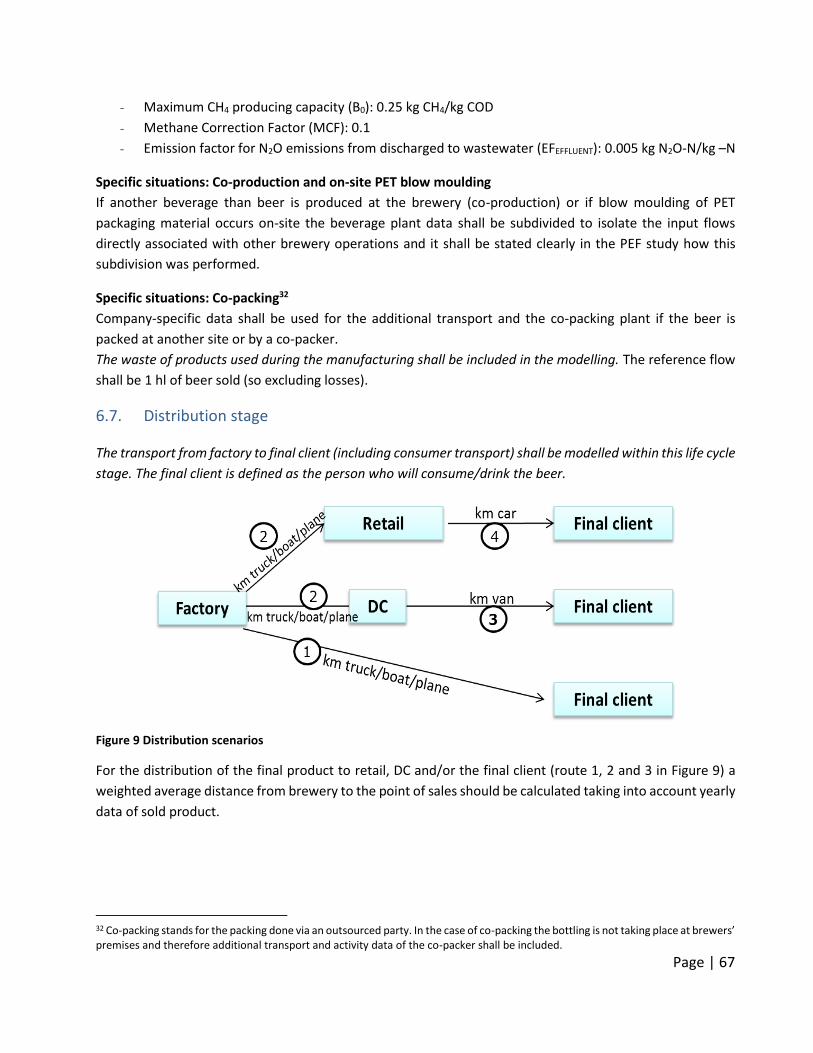
Page | 67
- Maximum CH4 producing capacity (B0): 0.25 kg CH4/kg COD
- Methane Correction Factor (MCF): 0.1
- Emission factor for N2O emissions from discharged to wastewater (EFEFFLUENT): 0.005 kg N2O-N/kg –N
Specific situations: Co-production and on-site PET blow moulding
If another beverage than beer is produced at the brewery (co-production) or if blow moulding of PET
packaging material occurs on-site the beverage plant data shall be subdivided to isolate the input flows
directly associated with other brewery operations and it shall be stated clearly in the PEF study how this
subdivision was performed.
Specific situations: Co-packing32
Company-specific data shall be used for the additional transport and the co-packing plant if the beer is
packed at another site or by a co-packer.
The waste of products used during the manufacturing shall be included in the modelling. The reference flow
shall be 1 hl of beer sold (so excluding losses).
6.7. Distribution stage The transport from factory to final client (including consumer transport) shall be modelled within this life cycle
stage. The final client is defined as the person who will consume/drink the beer.
Figure 9 Distribution scenarios
For the distribution of the final product to retail, DC and/or the final client (route 1, 2 and 3 in Figure 9) a
weighted average distance from brewery to the point of sales should be calculated taking into account yearly
data of sold product.
32 Co-packing stands for the packing done via an outsourced party. In the case of co-packing the bottling is not taking place at brewers’ premises and therefore additional transport and activity data of the co-packer shall be included.
Page | 68
This weighted average distance should consider the following distribution routes:
• distance from brewery /factory to retail or/and DC (route 2);
• distance from brewery /factory to final client (route 1).
The yearly transport modes effectively used shall be applied to each distribution route. The load factor shall
be based on the mass and volume of the packed functional unit per packaging solution for the outbound
transport. These masses, volumes and load factors shall be reported.
The default distance to be applied when company-specific data is not available for route 1 and 2 is 304 km
(taken from the screening study).
Route 3 and 4 shall be based on the following default distribution scenario (as described in the PEF
guidance 6.3):
(3) 40% of the functional unit (= 102 litres*0.4) from DC to final client:
● 100% Local: 250 km round trip by van (lorry <7.5t, EURO 3, utilisation ratio of 20%; UUID aea613ae-
573b-443a-aba2-6a69900ca2ff)
(4) 60%33 of the functional unit (= 102 litres*0.6) from retail to final client:
● 62%: 5 km, by passenger car (average; UUID 1ead35dd-fc71-4b0c-9410-7e39da95c7dc), PEFCR
specific allocation
● 5%: 5 km round trip, by van (lorry <7.5t, EURO 3 with utilisation ratio of 20%6; UUID aea613ae-573b-
443a-aba2-6a69900ca2ff)
● 33%: no impact modelled
The waste of products during the distribution and retail shall be included in the modelling and is represented
in the overall 2% losses which are accounted for in the use-stage.
33 The 60% is based on the cooling mix. 52.5% is assumed to be cooled at home and 7.5% is not cooled (52.5% + 7.5% = 60%).
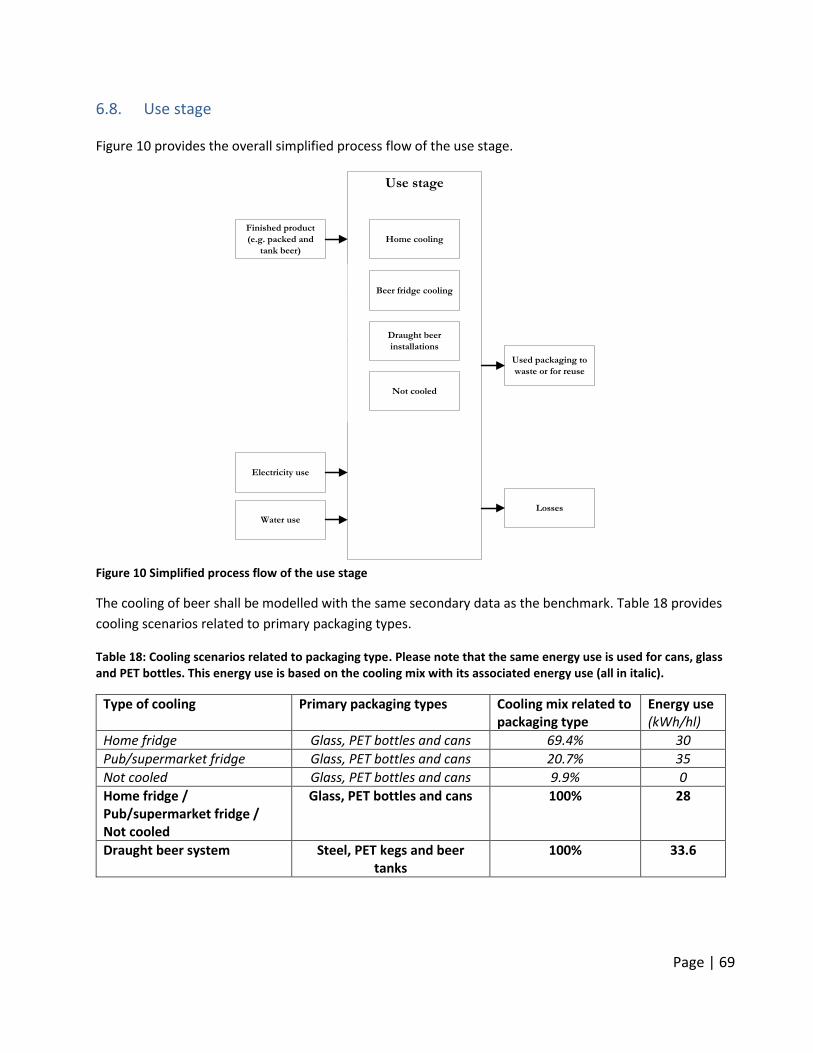
Page | 69
6.8. Use stage Figure 10 provides the overall simplified process flow of the use stage.
Figure 10 Simplified process flow of the use stage
The cooling of beer shall be modelled with the same secondary data as the benchmark. Table 18 provides
cooling scenarios related to primary packaging types.
Table 18: Cooling scenarios related to packaging type. Please note that the same energy use is used for cans, glass and PET bottles. This energy use is based on the cooling mix with its associated energy use (all in italic).
Type of cooling Primary packaging types Cooling mix related to packaging type
Energy use (kWh/hl)
Home fridge Glass, PET bottles and cans 69.4% 30
Pub/supermarket fridge Glass, PET bottles and cans 20.7% 35
Not cooled Glass, PET bottles and cans 9.9% 0
Home fridge / Pub/supermarket fridge / Not cooled
Glass, PET bottles and cans 100% 28
Draught beer system Steel, PET kegs and beer tanks
100% 33.6
Use stage
Finished product
(e.g. packed and
tank beer)
Home cooling
Beer fridge cooling
Draught beer
installations
Not cooled
Production of
detergents
Production of beer
glasses
Washing of beer
glassesElectricity use
Water useMaintainance of
cooling equipment
Used packaging to
waste or for reuse
Losses
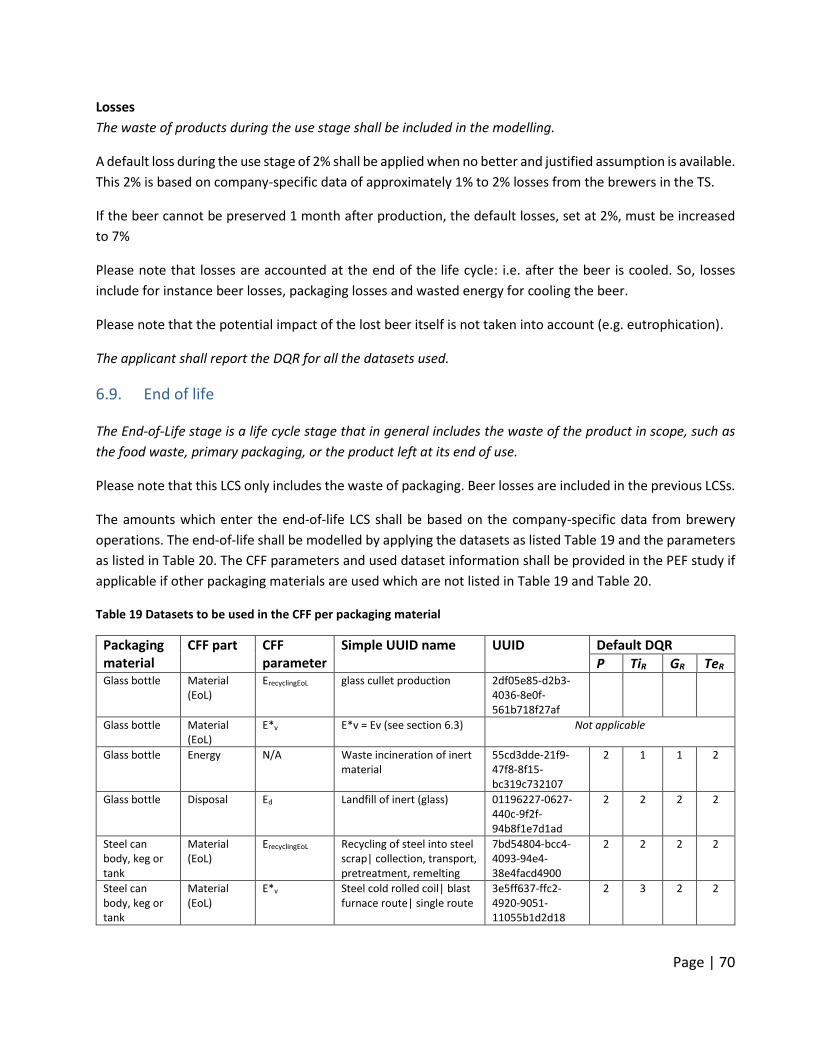
Page | 70
Losses
The waste of products during the use stage shall be included in the modelling.
A default loss during the use stage of 2% shall be applied when no better and justified assumption is available.
This 2% is based on company-specific data of approximately 1% to 2% losses from the brewers in the TS.
If the beer cannot be preserved 1 month after production, the default losses, set at 2%, must be increased
to 7%
Please note that losses are accounted at the end of the life cycle: i.e. after the beer is cooled. So, losses
include for instance beer losses, packaging losses and wasted energy for cooling the beer.
Please note that the potential impact of the lost beer itself is not taken into account (e.g. eutrophication).
The applicant shall report the DQR for all the datasets used.
6.9. End of life The End-of-Life stage is a life cycle stage that in general includes the waste of the product in scope, such as
the food waste, primary packaging, or the product left at its end of use.
Please note that this LCS only includes the waste of packaging. Beer losses are included in the previous LCSs.
The amounts which enter the end-of-life LCS shall be based on the company-specific data from brewery
operations. The end-of-life shall be modelled by applying the datasets as listed Table 19 and the parameters
as listed in Table 20. The CFF parameters and used dataset information shall be provided in the PEF study if
applicable if other packaging materials are used which are not listed in Table 19 and Table 20.
Table 19 Datasets to be used in the CFF per packaging material
Packaging material
CFF part CFF parameter
Simple UUID name UUID Default DQR
P TiR GR TeR Glass bottle Material
(EoL) ErecyclingEoL glass cullet production 2df05e85-d2b3-
4036-8e0f-561b718f27af
Glass bottle Material (EoL)
E*v E*v = Ev (see section 6.3) Not applicable
Glass bottle Energy N/A Waste incineration of inert material
55cd3dde-21f9-47f8-8f15-bc319c732107
2 1 1 2
Glass bottle Disposal Ed Landfill of inert (glass) 01196227-0627-440c-9f2f-94b8f1e7d1ad
2 2 2 2
Steel can body, keg or tank
Material (EoL)
ErecyclingEoL Recycling of steel into steel scrap| collection, transport, pretreatment, remelting
7bd54804-bcc4-4093-94e4-38e4facd4900
2 2 2 2
Steel can body, keg or tank
Material (EoL)
E*v Steel cold rolled coil| blast furnace route| single route
3e5ff637-ffc2-4920-9051-11055b1d2d18
2 3 2 2
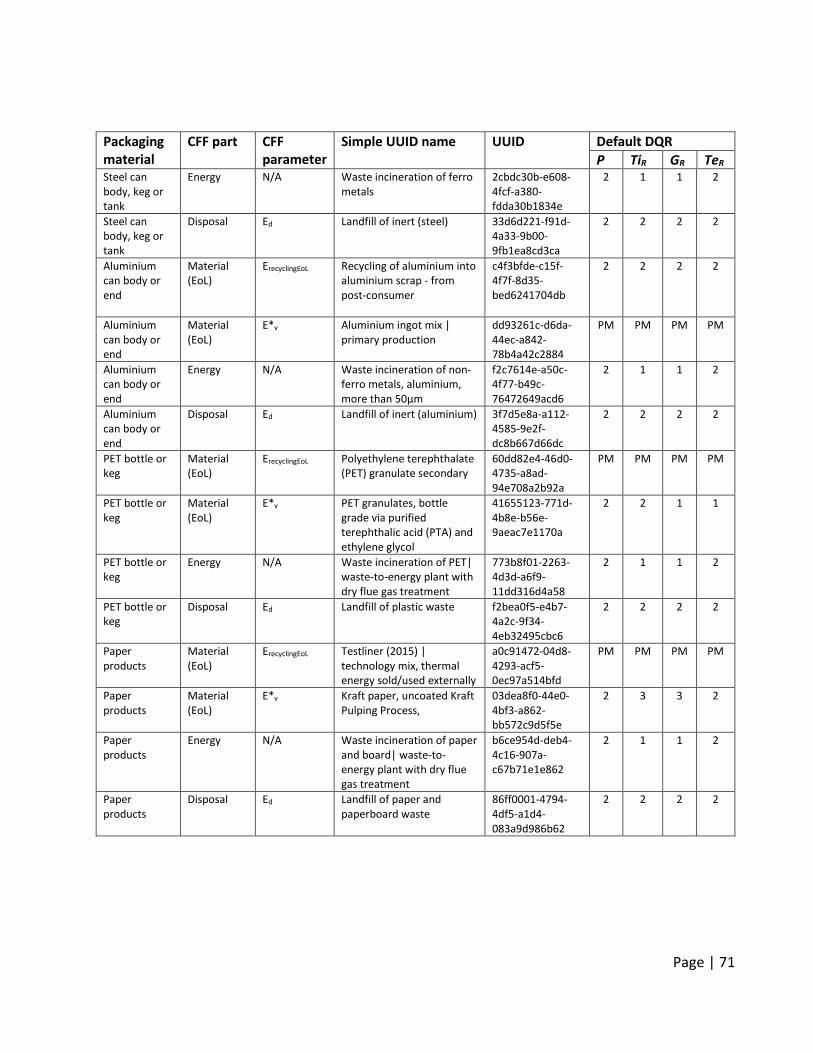
Page | 71
Packaging material
CFF part CFF parameter
Simple UUID name UUID Default DQR
P TiR GR TeR Steel can body, keg or tank
Energy N/A Waste incineration of ferro metals
2cbdc30b-e608-4fcf-a380-fdda30b1834e
2 1 1 2
Steel can body, keg or tank
Disposal Ed Landfill of inert (steel) 33d6d221-f91d-4a33-9b00-9fb1ea8cd3ca
2 2 2 2
Aluminium can body or end
Material (EoL)
ErecyclingEoL Recycling of aluminium into aluminium scrap - from post-consumer
c4f3bfde-c15f-4f7f-8d35-bed6241704db
2 2 2 2
Aluminium can body or end
Material (EoL)
E*v Aluminium ingot mix | primary production
dd93261c-d6da-44ec-a842-78b4a42c2884
PM PM PM PM
Aluminium can body or end
Energy N/A Waste incineration of non-ferro metals, aluminium, more than 50µm
f2c7614e-a50c-4f77-b49c-76472649acd6
2 1 1 2
Aluminium can body or end
Disposal Ed Landfill of inert (aluminium) 3f7d5e8a-a112-4585-9e2f-dc8b667d66dc
2 2 2 2
PET bottle or keg
Material (EoL)
ErecyclingEoL Polyethylene terephthalate (PET) granulate secondary
60dd82e4-46d0-4735-a8ad-94e708a2b92a
PM PM PM PM
PET bottle or keg
Material (EoL)
E*v PET granulates, bottle grade via purified terephthalic acid (PTA) and ethylene glycol
41655123-771d-4b8e-b56e-9aeac7e1170a
2 2 1 1
PET bottle or keg
Energy N/A Waste incineration of PET| waste-to-energy plant with dry flue gas treatment
773b8f01-2263-4d3d-a6f9-11dd316d4a58
2 1 1 2
PET bottle or keg
Disposal Ed Landfill of plastic waste f2bea0f5-e4b7-4a2c-9f34-4eb32495cbc6
2 2 2 2
Paper products
Material (EoL)
ErecyclingEoL Testliner (2015) | technology mix, thermal energy sold/used externally
a0c91472-04d8-4293-acf5-0ec97a514bfd
PM PM PM PM
Paper products
Material (EoL)
E*v Kraft paper, uncoated Kraft Pulping Process,
03dea8f0-44e0-4bf3-a862-bb572c9d5f5e
2 3 3 2
Paper products
Energy N/A Waste incineration of paper and board| waste-to-energy plant with dry flue gas treatment
b6ce954d-deb4-4c16-907a-c67b71e1e862
2 1 1 2
Paper products
Disposal Ed Landfill of paper and paperboard waste
86ff0001-4794-4df5-a1d4-083a9d986b62
2 2 2 2
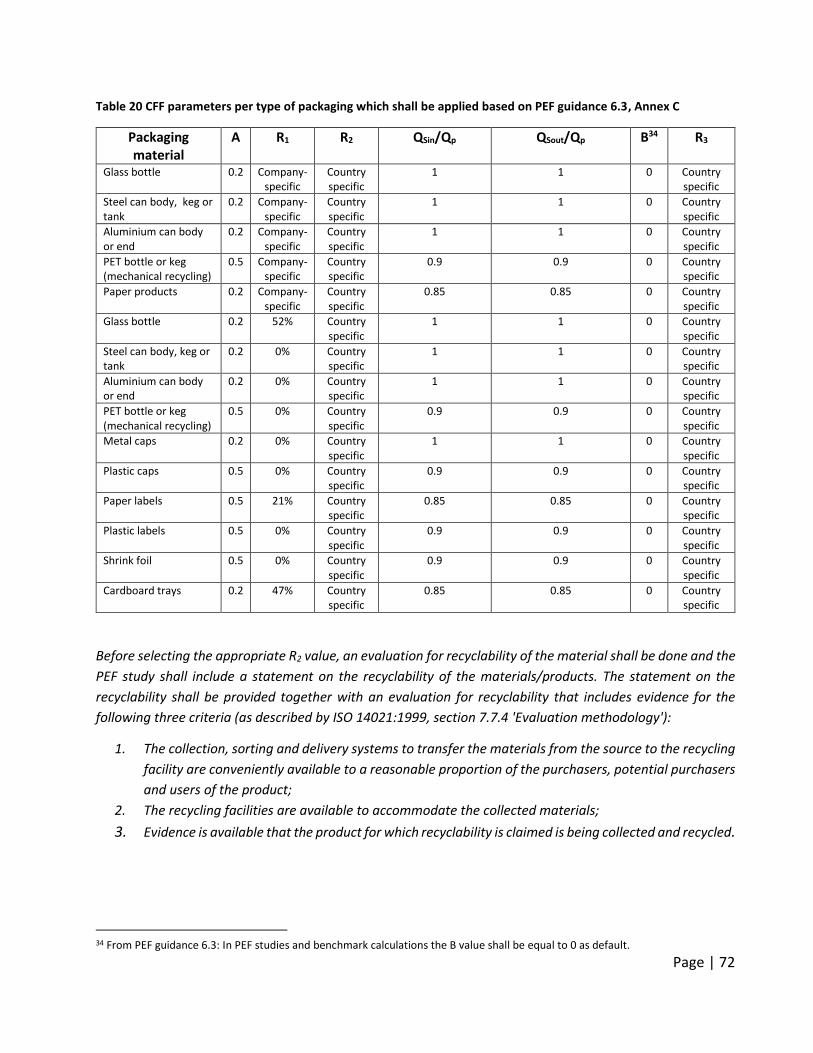
Page | 72
Table 20 CFF parameters per type of packaging which shall be applied based on PEF guidance 6.3, Annex C
Packaging material
A R1 R2 QSin/Qp QSout/Qp B34 R3
Glass bottle 0.2 Company-specific
Country specific
1 1 0 Country specific
Steel can body, keg or tank
0.2 Company-specific
Country specific
1 1 0 Country specific
Aluminium can body or end
0.2 Company-specific
Country specific
1 1 0 Country specific
PET bottle or keg (mechanical recycling)
0.5 Company-specific
Country specific
0.9 0.9 0 Country specific
Paper products 0.2 Company-specific
Country specific
0.85 0.85 0 Country specific
Glass bottle 0.2 52% Country specific
1 1 0 Country specific
Steel can body, keg or tank
0.2 0% Country specific
1 1 0 Country specific
Aluminium can body or end
0.2 0% Country specific
1 1 0 Country specific
PET bottle or keg (mechanical recycling)
0.5 0% Country specific
0.9 0.9 0 Country specific
Metal caps 0.2 0% Country specific
1 1 0 Country specific
Plastic caps 0.5 0% Country specific
0.9 0.9 0 Country specific
Paper labels 0.5 21% Country specific
0.85 0.85 0 Country specific
Plastic labels 0.5 0% Country specific
0.9 0.9 0 Country specific
Shrink foil 0.5 0% Country specific
0.9 0.9 0 Country specific
Cardboard trays 0.2 47% Country specific
0.85 0.85 0 Country specific
Before selecting the appropriate R2 value, an evaluation for recyclability of the material shall be done and the
PEF study shall include a statement on the recyclability of the materials/products. The statement on the
recyclability shall be provided together with an evaluation for recyclability that includes evidence for the
following three criteria (as described by ISO 14021:1999, section 7.7.4 'Evaluation methodology'):
1. The collection, sorting and delivery systems to transfer the materials from the source to the recycling
facility are conveniently available to a reasonable proportion of the purchasers, potential purchasers
and users of the product;
2. The recycling facilities are available to accommodate the collected materials;
3. Evidence is available that the product for which recyclability is claimed is being collected and recycled.
34 From PEF guidance 6.3: In PEF studies and benchmark calculations the B value shall be equal to 0 as default.
Page | 73
Point 1 and 3 can be proven by recycling statistics (country specific) derived from industry associations or
national bodies. Approximation to evidence at point 3 can be provided by applying for example the design for
recyclability evaluation outlined in EN 13430 Material recycling (Annexes A and B) or other sector-specific
recyclability guidelines if available35.
Following the evaluation for recyclability, the appropriate R2 values (supply-chain specific or default) shall be
used. If one criteria is not fulfilled or the sector-specific recyclability guidelines indicate a limited recyclability
an R2 value of 0% shall be applied.
Company-specific R2 values (measured at the output of the recycling plant) shall be used when available. If
no company-specific values are available and the criteria for evaluation of recyclability are fulfilled (see
below), application-specific R2 values shall be used as listed in the table below,
● If an R2 value is not available for a specific country, then the European average shall be used.
● If an R2 value is not available for a specific application, the R2 values of the material shall be used
(e.g. materials average).
● In case no R2 values are available, R2 shall be set equal to 0 or new statistics may be generated in
order to assign an R2 value in the specific situation.
The applied R2 values shall be subject to the PEF study verification.
The reuse rate determines the quantity of packaging material (per product sold) to be treated at end of life.
The amount of packaging treated at end of life shall be calculated by dividing the actual weight of the
packaging by the number of times this packaging was reused.
35 E.g. the EPBP design guidelines (http://www.epbp.org/design-guidelines), or Recyclability by design (http://www.recoup.org/).
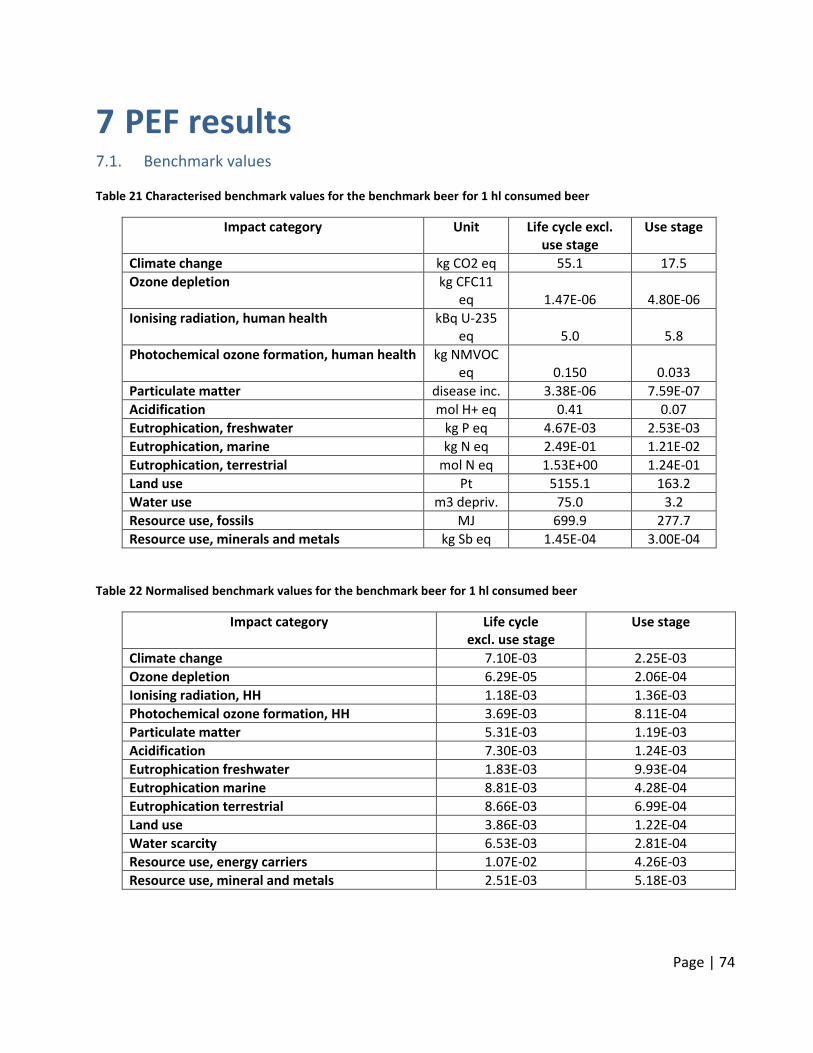
Page | 74
7 PEF results 7.1. Benchmark values Table 21 Characterised benchmark values for the benchmark beer for 1 hl consumed beer
Impact category Unit Life cycle excl. use stage
Use stage
Climate change kg CO2 eq 55.1 17.5
Ozone depletion kg CFC11 eq 1.47E-06 4.80E-06
Ionising radiation, human health kBq U-235 eq 5.0 5.8
Photochemical ozone formation, human health kg NMVOC eq 0.150 0.033
Particulate matter disease inc. 3.38E-06 7.59E-07
Acidification mol H+ eq 0.41 0.07
Eutrophication, freshwater kg P eq 4.67E-03 2.53E-03
Eutrophication, marine kg N eq 2.49E-01 1.21E-02
Eutrophication, terrestrial mol N eq 1.53E+00 1.24E-01
Land use Pt 5155.1 163.2
Water use m3 depriv. 75.0 3.2
Resource use, fossils MJ 699.9 277.7
Resource use, minerals and metals kg Sb eq 1.45E-04 3.00E-04
Table 22 Normalised benchmark values for the benchmark beer for 1 hl consumed beer
Impact category Life cycle excl. use stage
Use stage
Climate change 7.10E-03 2.25E-03
Ozone depletion 6.29E-05 2.06E-04
Ionising radiation, HH 1.18E-03 1.36E-03
Photochemical ozone formation, HH 3.69E-03 8.11E-04
Particulate matter 5.31E-03 1.19E-03
Acidification 7.30E-03 1.24E-03
Eutrophication freshwater 1.83E-03 9.93E-04
Eutrophication marine 8.81E-03 4.28E-04
Eutrophication terrestrial 8.66E-03 6.99E-04
Land use 3.86E-03 1.22E-04
Water scarcity 6.53E-03 2.81E-04
Resource use, energy carriers 1.07E-02 4.26E-03
Resource use, mineral and metals 2.51E-03 5.18E-03
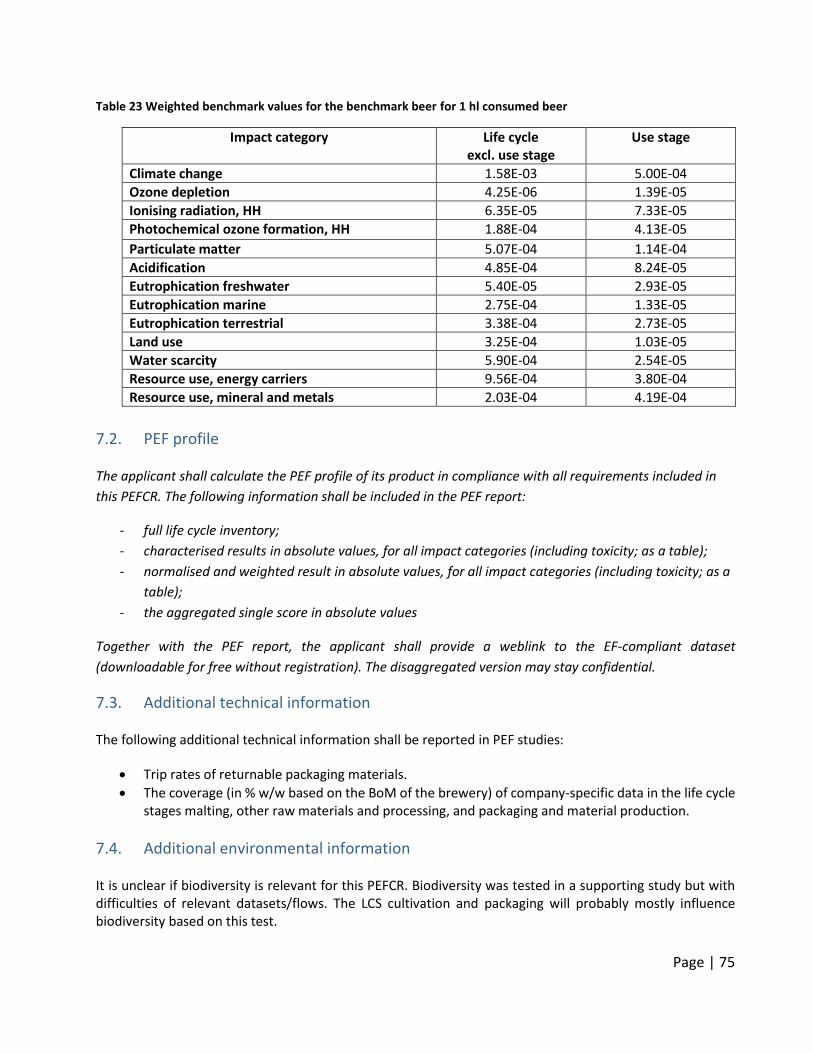
Page | 75
Table 23 Weighted benchmark values for the benchmark beer for 1 hl consumed beer
Impact category Life cycle excl. use stage
Use stage
Climate change 1.58E-03 5.00E-04
Ozone depletion 4.25E-06 1.39E-05
Ionising radiation, HH 6.35E-05 7.33E-05
Photochemical ozone formation, HH 1.88E-04 4.13E-05
Particulate matter 5.07E-04 1.14E-04
Acidification 4.85E-04 8.24E-05
Eutrophication freshwater 5.40E-05 2.93E-05
Eutrophication marine 2.75E-04 1.33E-05
Eutrophication terrestrial 3.38E-04 2.73E-05
Land use 3.25E-04 1.03E-05
Water scarcity 5.90E-04 2.54E-05
Resource use, energy carriers 9.56E-04 3.80E-04
Resource use, mineral and metals 2.03E-04 4.19E-04
7.2. PEF profile The applicant shall calculate the PEF profile of its product in compliance with all requirements included in
this PEFCR. The following information shall be included in the PEF report:
- full life cycle inventory;
- characterised results in absolute values, for all impact categories (including toxicity; as a table);
- normalised and weighted result in absolute values, for all impact categories (including toxicity; as a
table);
- the aggregated single score in absolute values
Together with the PEF report, the applicant shall provide a weblink to the EF-compliant dataset
(downloadable for free without registration). The disaggregated version may stay confidential.
7.3. Additional technical information The following additional technical information shall be reported in PEF studies:
• Trip rates of returnable packaging materials.
• The coverage (in % w/w based on the BoM of the brewery) of company-specific data in the life cycle stages malting, other raw materials and processing, and packaging and material production.
7.4. Additional environmental information It is unclear if biodiversity is relevant for this PEFCR. Biodiversity was tested in a supporting study but with difficulties of relevant datasets/flows. The LCS cultivation and packaging will probably mostly influence biodiversity based on this test.
Page | 76
The following 6 impact categories are relevant for biodiversity: Climate change, Eutrophication aquatic freshwater, Eutrophication aquatic marine, Acidification, Water use, Land use. Three of these 6 impact categories are most relevant in this PEFCR so biodiversity is indirectly covered. The limitation is that this PEFCR does not have company-specific data requirements on cultivation and for meaningful biodiversity assessments detailed company specific data will be required. We strongly advocate for developments of intermediate product PEFCRs with the focus on cultivation, based on company-specific data and which focus on developing/selecting methods to perform biodiversity impact assessments. No additional environmental information shall be included.
Page | 77
8 Verification The verification of an EF study/report carried out in compliance with this PEFCR shall be done according to all the general requirements included in Section 8 of the PEFCR Guidance version 6.3 and the requirements listed below. The verifier(s) shall verify that the EF study is conducted in compliance with this PEFCR. These requirements will remain valid until an EF verification scheme is adopted at European level or alternative verification approaches applicable to EF studies/report are included in existing or new policies. The verifier(s) shall validate the accuracy and reliability of the quantitative information used in the calculation
of the study. As this can be highly resource intensive, the following requirements shall be followed:
• the verifier shall check if the correct version of all impact assessment methods was used. For each of
the most relevant impact categories, at least 50% of the characterisation factors (for each of the most
relevant EF impact categories) shall be verified, while all normalisation and weighting factors of all
ICs shall be verified. In particular, the verifier shall check that the characterisation factors correspond
to those included in the EF impact assessment method the study declares compliance with36;
• all the newly created datasets shall be checked on their EF compliancy (for the meaning of EF
compliant datasets refer to Annex H of the Guidance). All their underlying data (elementary flows,
activity data and sub processes) shall be validated;
• the aggregated EF-compliant dataset of the product in scope (meaning, the EF study) is available on
the EF node (http://eplca.jrc.ec.europa.eu/EF-node).
• for at least 70% of the most relevant processes in situation 2 option 2 of the DNM, 70% of the
underlying data shall be validated. The 70% data shall include all energy and transport sub processes
for those in situation 2 option 2;
• for at least 60% of the most relevant processes in situation 3 of the DNM, 60% of the underlying data
shall be validated;
• for at least 50% of the other processes in situation 1, 2 and 3 of the DNM, 50% of the underlying data shall be validated.
• The verifier shall check newly developed supporting materials if all relevant information is included in this material (see also section 6.2).
In particular, it shall be verified for the selected processes if the DQR of the process satisfies the minimum
DQR as specified in the DNM.
The selection of the processes to be verified for each situation shall be done ordering them from the most
contributing to the less contributing one and selecting those contributing up to the identified percentage
starting from the most contributing ones. In case of non-integer numbers, the rounding shall be made always
considering the next upper integer.
36 Available at: http://eplca.jrc.ec.europa.eu/LCDN/developer.xhtml
Page | 78
These data checks shall include, but should not be limited to, the activity data used, the selection of secondary
sub-processes, the selection of the direct elementary flows and the CFF parameters. For example, if there are
5 processes and each one of them includes 5 activity data, 5 secondary datasets and 10 CFF parameters, then
the verifier(s) has to check at least 4 out of 5 processes (70%) and, for each process, (s)he shall check at least
4 activity data (70% of the total amount of activity data), 4 secondary datasets (70% of the total amount of
secondary datasets), and 7 CFF parameters (70% of the total amount of CFF parameters), i.e. the 70% of each
of data that could be possible subject of check.
The verification of the EF report shall be carried out by randomly checking enough information to provide
reasonable assurance that the EF report fulfils all the conditions listed in section 8 of the PEFCR Guidance.
Page | 79
9 References BSI. (2011). PAS 2050: 2011 Specification for the assessment of the life cycle greenhouse gas emissions of
goods and services.
BSI. (2012). PAS 2050-1: 2012 Assessment of life cycle greenhouse gas emissions from horticultural products. BSI.
Canadean. (2015). Wisdom beverage database - accessed on 20 April 2015 by Carlsberg.
European Commission. (2013). 2013/179/EU: Commission Recommendation of 9 April 2013 on the use of common methods to measure and communicate the life cycle environmental performance of products and organisations. Official Journal of the European Union.
IPCC. (2006). Wastewater Treatment and Discharge (Chapter 6). https://doi.org/WAS-01
ISO. (2006). ISO 14040 Environmental management — Life cycle assessment — Principles and framework.
JRC-IES, & European Commision. (2011). ILCD handbook - Recommendations for Life Cycle Impact Assessment in the European context. https://doi.org/10.278/33030
Scholten, J. (2011). Comparative GHG assessment of Brewers Spent Grain for feed or fuel.
The Brewers of Europe. (2012). The Environmental Performance of the European Brewing Sector.
The Brewers of Europe. (2014). PEF pilot Beer; Draft Scope and Representative Product PEF pilot Beer.
The Consumer Goods Forum. (2011). Global Protocol on Packaging sustainability 2.0.
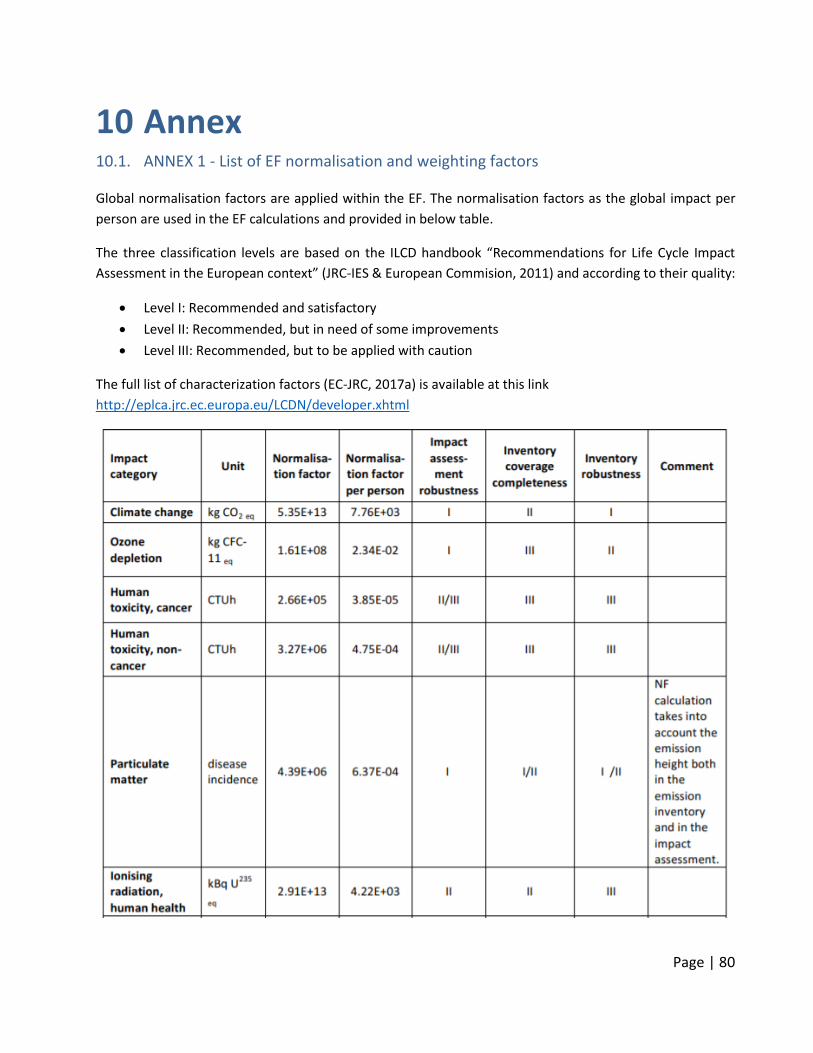
Page | 80
10 Annex 10.1. ANNEX 1 - List of EF normalisation and weighting factors Global normalisation factors are applied within the EF. The normalisation factors as the global impact per
person are used in the EF calculations and provided in below table.
The three classification levels are based on the ILCD handbook “Recommendations for Life Cycle Impact
Assessment in the European context” (JRC-IES & European Commision, 2011) and according to their quality:
• Level I: Recommended and satisfactory
• Level II: Recommended, but in need of some improvements
• Level III: Recommended, but to be applied with caution
The full list of characterization factors (EC-JRC, 2017a) is available at this link
http://eplca.jrc.ec.europa.eu/LCDN/developer.xhtml
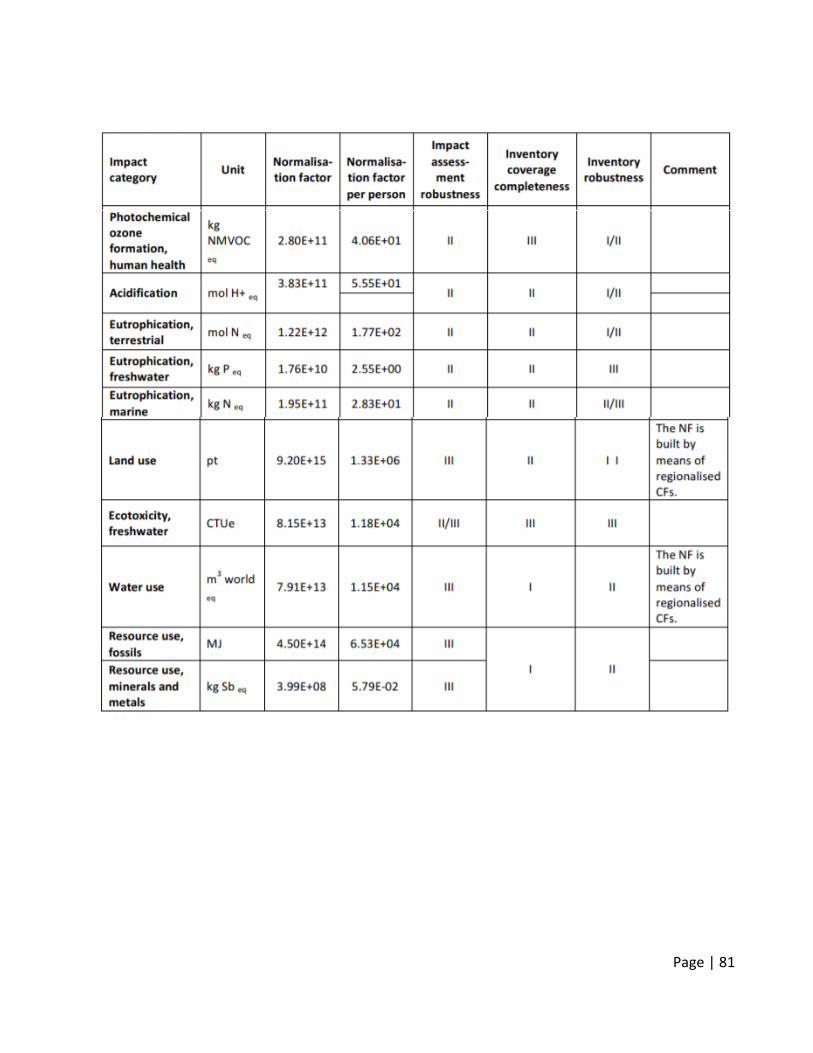
Page | 81
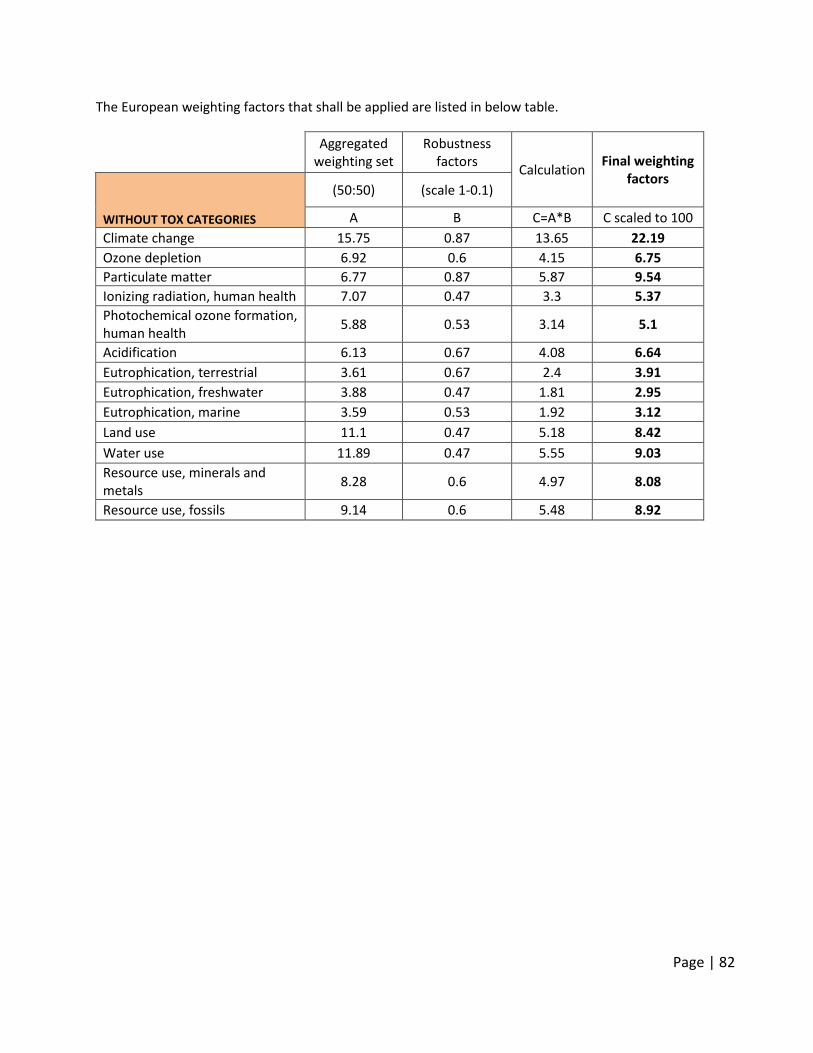
Page | 82
The European weighting factors that shall be applied are listed in below table.
Aggregated weighting set
Robustness factors
Calculation Final weighting
factors
WITHOUT TOX CATEGORIES
(50:50) (scale 1-0.1)
A B C=A*B C scaled to 100
Climate change 15.75 0.87 13.65 22.19
Ozone depletion 6.92 0.6 4.15 6.75
Particulate matter 6.77 0.87 5.87 9.54
Ionizing radiation, human health 7.07 0.47 3.3 5.37
Photochemical ozone formation, human health
5.88 0.53 3.14 5.1
Acidification 6.13 0.67 4.08 6.64
Eutrophication, terrestrial 3.61 0.67 2.4 3.91
Eutrophication, freshwater 3.88 0.47 1.81 2.95
Eutrophication, marine 3.59 0.53 1.92 3.12
Land use 11.1 0.47 5.18 8.42
Water use 11.89 0.47 5.55 9.03
Resource use, minerals and metals
8.28 0.6 4.97 8.08
Resource use, fossils 9.14 0.6 5.48 8.92
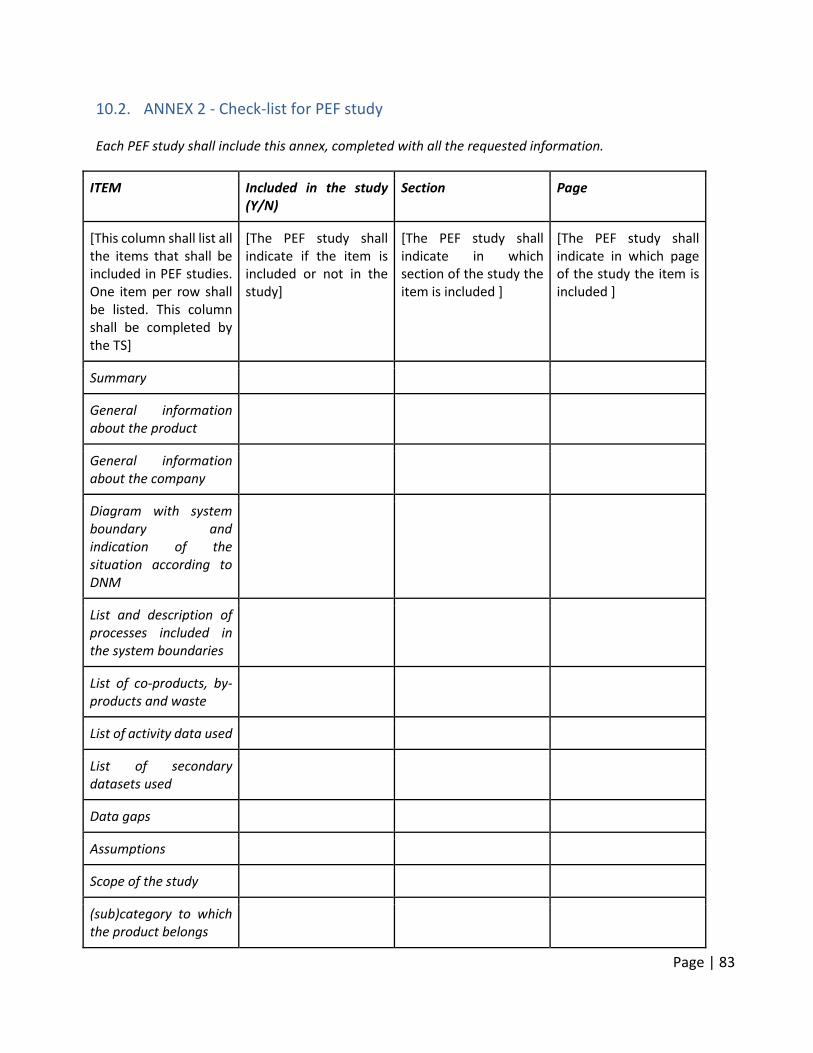
Page | 83
10.2. ANNEX 2 - Check-list for PEF study Each PEF study shall include this annex, completed with all the requested information.
ITEM Included in the study (Y/N)
Section Page
[This column shall list all the items that shall be included in PEF studies. One item per row shall be listed. This column shall be completed by the TS]
[The PEF study shall indicate if the item is included or not in the study]
[The PEF study shall indicate in which section of the study the item is included ]
[The PEF study shall indicate in which page of the study the item is included ]
Summary
General information about the product
General information about the company
Diagram with system boundary and indication of the situation according to DNM
List and description of processes included in the system boundaries
List of co-products, by-products and waste
List of activity data used
List of secondary datasets used
Data gaps
Assumptions
Scope of the study
(sub)category to which the product belongs

Page | 84
ITEM Included in the study (Y/N)
Section Page
DQR calculation of each dataset used for the most relevant processes and the new ones created.
DQR (of each criteria and total) of the study
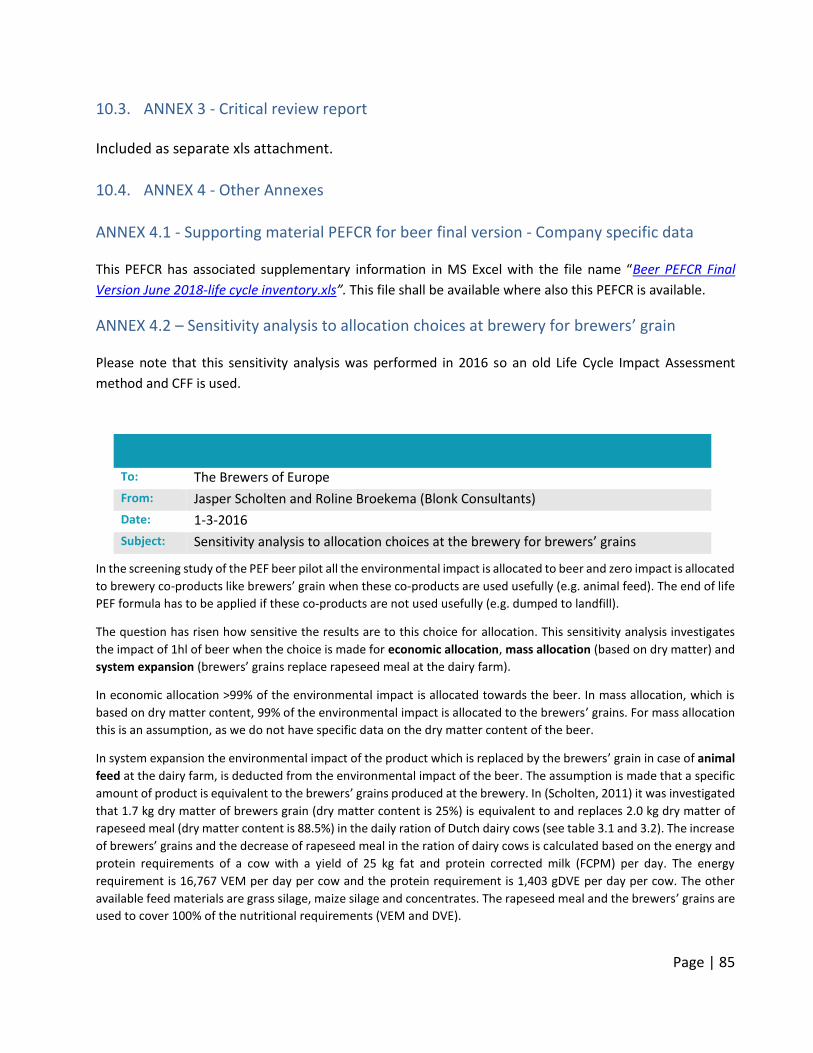
Page | 85
10.3. ANNEX 3 - Critical review report Included as separate xls attachment.
10.4. ANNEX 4 - Other Annexes
ANNEX 4.1 - Supporting material PEFCR for beer final version - Company specific data This PEFCR has associated supplementary information in MS Excel with the file name “Beer PEFCR Final
Version June 2018-life cycle inventory.xls”. This file shall be available where also this PEFCR is available.
ANNEX 4.2 – Sensitivity analysis to allocation choices at brewery for brewers’ grain Please note that this sensitivity analysis was performed in 2016 so an old Life Cycle Impact Assessment
method and CFF is used.
In the screening study of the PEF beer pilot all the environmental impact is allocated to beer and zero impact is allocated
to brewery co-products like brewers’ grain when these co-products are used usefully (e.g. animal feed). The end of life
PEF formula has to be applied if these co‐products are not used usefully (e.g. dumped to landfill).
The question has risen how sensitive the results are to this choice for allocation. This sensitivity analysis investigates
the impact of 1hl of beer when the choice is made for economic allocation, mass allocation (based on dry matter) and
system expansion (brewers’ grains replace rapeseed meal at the dairy farm).
In economic allocation >99% of the environmental impact is allocated towards the beer. In mass allocation, which is
based on dry matter content, 99% of the environmental impact is allocated to the brewers’ grains. For mass allocation
this is an assumption, as we do not have specific data on the dry matter content of the beer.
In system expansion the environmental impact of the product which is replaced by the brewers’ grain in case of animal
feed at the dairy farm, is deducted from the environmental impact of the beer. The assumption is made that a specific
amount of product is equivalent to the brewers’ grains produced at the brewery. In (Scholten, 2011) it was investigated
that 1.7 kg dry matter of brewers grain (dry matter content is 25%) is equivalent to and replaces 2.0 kg dry matter of
rapeseed meal (dry matter content is 88.5%) in the daily ration of Dutch dairy cows (see table 3.1 and 3.2). The increase
of brewers’ grains and the decrease of rapeseed meal in the ration of dairy cows is calculated based on the energy and
protein requirements of a cow with a yield of 25 kg fat and protein corrected milk (FCPM) per day. The energy
requirement is 16,767 VEM per day per cow and the protein requirement is 1,403 gDVE per day per cow. The other
available feed materials are grass silage, maize silage and concentrates. The rapeseed meal and the brewers’ grains are
used to cover 100% of the nutritional requirements (VEM and DVE).
To: The Brewers of Europe
From: Jasper Scholten and Roline Broekema (Blonk Consultants)
Date: 1-3-2016
Subject: Sensitivity analysis to allocation choices at the brewery for brewers’ grains
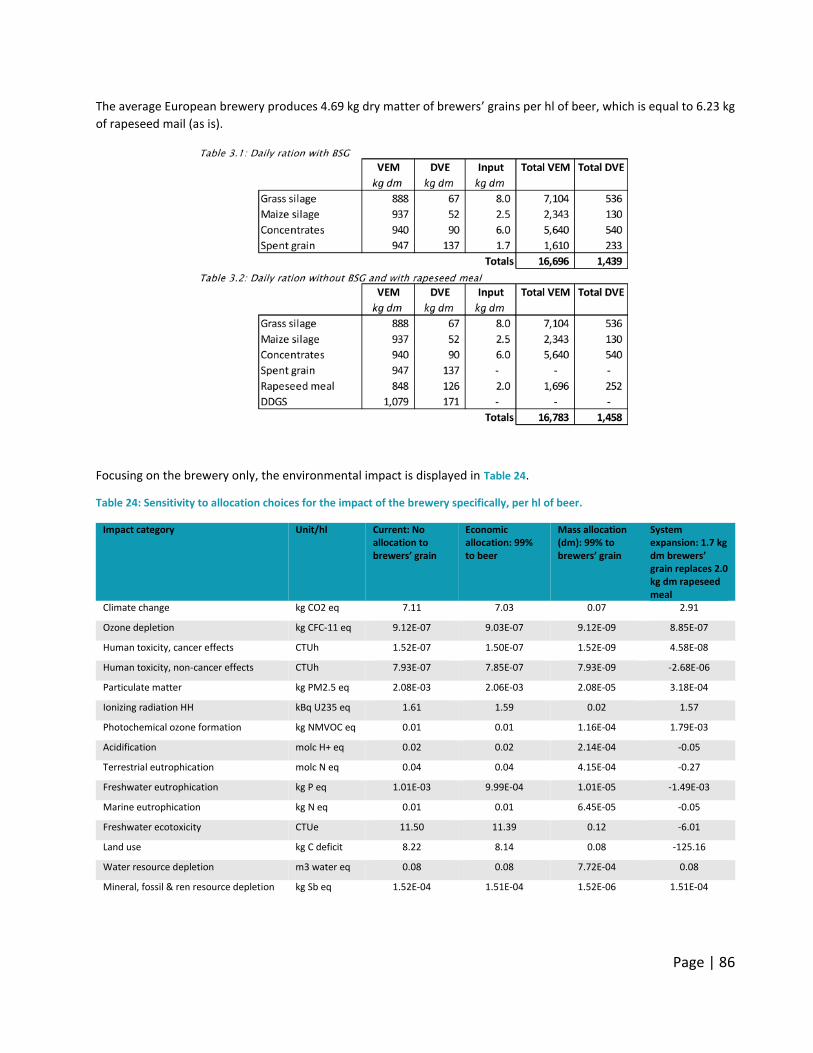
Page | 86
The average European brewery produces 4.69 kg dry matter of brewers’ grains per hl of beer, which is equal to 6.23 kg
of rapeseed mail (as is).
Focusing on the brewery only, the environmental impact is displayed in Table 24.
Table 24: Sensitivity to allocation choices for the impact of the brewery specifically, per hl of beer.
Impact category Unit/hl Current: No allocation to brewers’ grain
Economic allocation: 99% to beer
Mass allocation (dm): 99% to brewers’ grain
System expansion: 1.7 kg dm brewers’ grain replaces 2.0 kg dm rapeseed meal
Climate change kg CO2 eq 7.11 7.03 0.07 2.91
Ozone depletion kg CFC-11 eq 9.12E-07 9.03E-07 9.12E-09 8.85E-07
Human toxicity, cancer effects CTUh 1.52E-07 1.50E-07 1.52E-09 4.58E-08
Human toxicity, non-cancer effects CTUh 7.93E-07 7.85E-07 7.93E-09 -2.68E-06
Particulate matter kg PM2.5 eq 2.08E-03 2.06E-03 2.08E-05 3.18E-04
Ionizing radiation HH kBq U235 eq 1.61 1.59 0.02 1.57
Photochemical ozone formation kg NMVOC eq 0.01 0.01 1.16E-04 1.79E-03
Acidification molc H+ eq 0.02 0.02 2.14E-04 -0.05
Terrestrial eutrophication molc N eq 0.04 0.04 4.15E-04 -0.27
Freshwater eutrophication kg P eq 1.01E-03 9.99E-04 1.01E-05 -1.49E-03
Marine eutrophication kg N eq 0.01 0.01 6.45E-05 -0.05
Freshwater ecotoxicity CTUe 11.50 11.39 0.12 -6.01
Land use kg C deficit 8.22 8.14 0.08 -125.16
Water resource depletion m3 water eq 0.08 0.08 7.72E-04 0.08
Mineral, fossil & ren resource depletion kg Sb eq 1.52E-04 1.51E-04 1.52E-06 1.51E-04
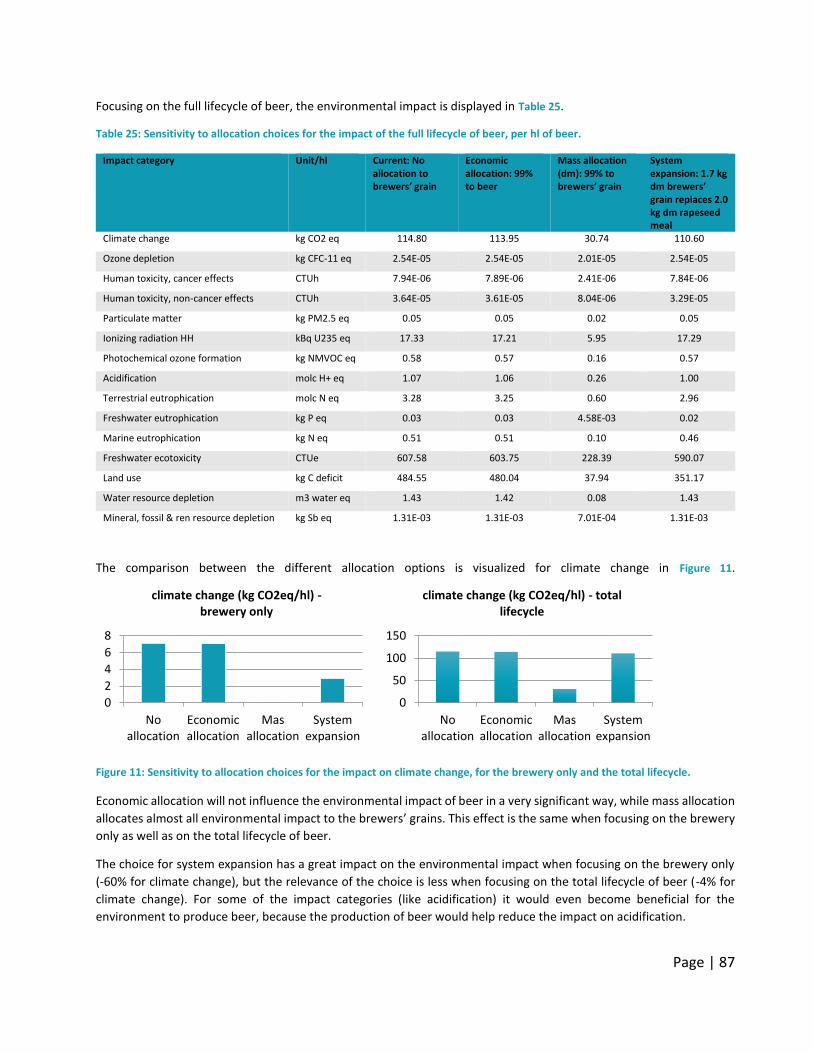
Page | 87
Focusing on the full lifecycle of beer, the environmental impact is displayed in Table 25.
Table 25: Sensitivity to allocation choices for the impact of the full lifecycle of beer, per hl of beer.
Impact category Unit/hl Current: No allocation to brewers’ grain
Economic allocation: 99% to beer
Mass allocation (dm): 99% to brewers’ grain
System expansion: 1.7 kg dm brewers’ grain replaces 2.0 kg dm rapeseed meal
Climate change kg CO2 eq 114.80 113.95 30.74 110.60
Ozone depletion kg CFC-11 eq 2.54E-05 2.54E-05 2.01E-05 2.54E-05
Human toxicity, cancer effects CTUh 7.94E-06 7.89E-06 2.41E-06 7.84E-06
Human toxicity, non-cancer effects CTUh 3.64E-05 3.61E-05 8.04E-06 3.29E-05
Particulate matter kg PM2.5 eq 0.05 0.05 0.02 0.05
Ionizing radiation HH kBq U235 eq 17.33 17.21 5.95 17.29
Photochemical ozone formation kg NMVOC eq 0.58 0.57 0.16 0.57
Acidification molc H+ eq 1.07 1.06 0.26 1.00
Terrestrial eutrophication molc N eq 3.28 3.25 0.60 2.96
Freshwater eutrophication kg P eq 0.03 0.03 4.58E-03 0.02
Marine eutrophication kg N eq 0.51 0.51 0.10 0.46
Freshwater ecotoxicity CTUe 607.58 603.75 228.39 590.07
Land use kg C deficit 484.55 480.04 37.94 351.17
Water resource depletion m3 water eq 1.43 1.42 0.08 1.43
Mineral, fossil & ren resource depletion kg Sb eq 1.31E-03 1.31E-03 7.01E-04 1.31E-03
The comparison between the different allocation options is visualized for climate change in Figure 11.
Figure 11: Sensitivity to allocation choices for the impact on climate change, for the brewery only and the total lifecycle.
Economic allocation will not influence the environmental impact of beer in a very significant way, while mass allocation
allocates almost all environmental impact to the brewers’ grains. This effect is the same when focusing on the brewery
only as well as on the total lifecycle of beer.
The choice for system expansion has a great impact on the environmental impact when focusing on the brewery only
(-60% for climate change), but the relevance of the choice is less when focusing on the total lifecycle of beer (-4% for
climate change). For some of the impact categories (like acidification) it would even become beneficial for the
environment to produce beer, because the production of beer would help reduce the impact on acidification.
0
2
4
6
8
Noallocation
Economicallocation
Masallocation
Systemexpansion
climate change (kg CO2eq/hl) -brewery only
0
50
100
150
Noallocation
Economicallocation
Masallocation
Systemexpansion
climate change (kg CO2eq/hl) - total lifecycle
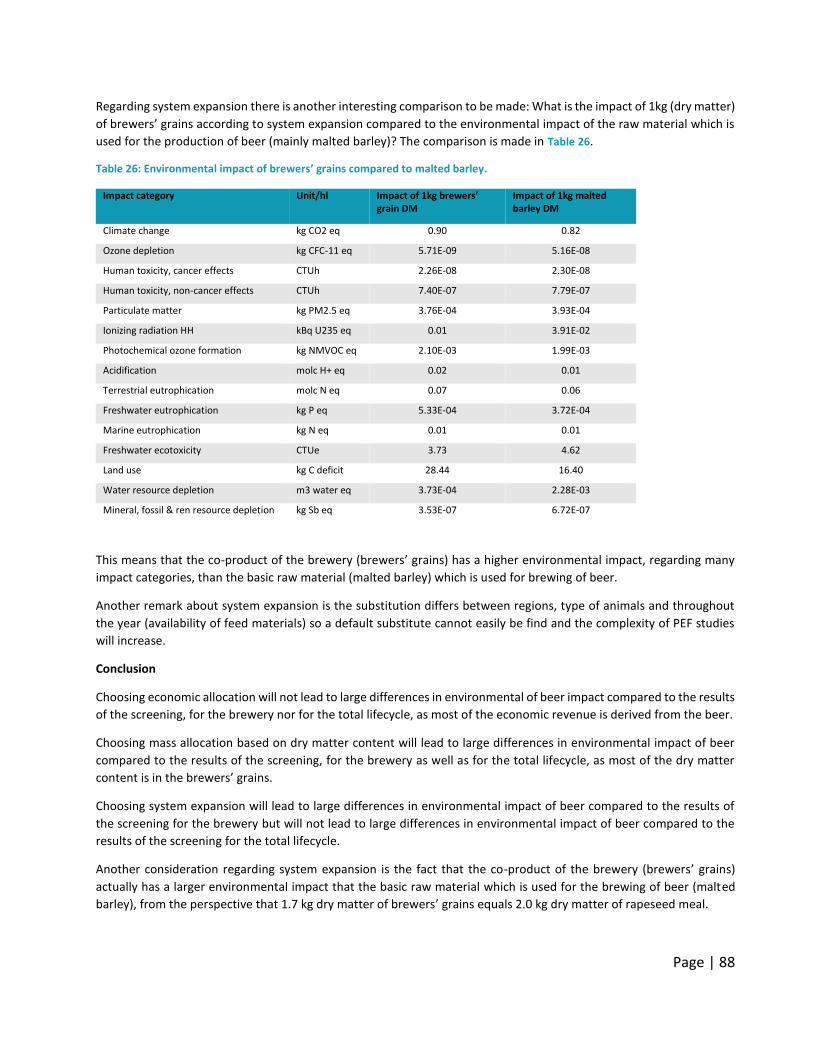
Page | 88
Regarding system expansion there is another interesting comparison to be made: What is the impact of 1kg (dry matter)
of brewers’ grains according to system expansion compared to the environmental impact of the raw material which is
used for the production of beer (mainly malted barley)? The comparison is made in Table 26.
Table 26: Environmental impact of brewers’ grains compared to malted barley.
Impact category Unit/hl Impact of 1kg brewers’ grain DM
Impact of 1kg malted barley DM
Climate change kg CO2 eq 0.90 0.82
Ozone depletion kg CFC-11 eq 5.71E-09 5.16E-08
Human toxicity, cancer effects CTUh 2.26E-08 2.30E-08
Human toxicity, non-cancer effects CTUh 7.40E-07 7.79E-07
Particulate matter kg PM2.5 eq 3.76E-04 3.93E-04
Ionizing radiation HH kBq U235 eq 0.01 3.91E-02
Photochemical ozone formation kg NMVOC eq 2.10E-03 1.99E-03
Acidification molc H+ eq 0.02 0.01
Terrestrial eutrophication molc N eq 0.07 0.06
Freshwater eutrophication kg P eq 5.33E-04 3.72E-04
Marine eutrophication kg N eq 0.01 0.01
Freshwater ecotoxicity CTUe 3.73 4.62
Land use kg C deficit 28.44 16.40
Water resource depletion m3 water eq 3.73E-04 2.28E-03
Mineral, fossil & ren resource depletion kg Sb eq 3.53E-07 6.72E-07
This means that the co-product of the brewery (brewers’ grains) has a higher environmental impact, regarding many
impact categories, than the basic raw material (malted barley) which is used for brewing of beer.
Another remark about system expansion is the substitution differs between regions, type of animals and throughout
the year (availability of feed materials) so a default substitute cannot easily be find and the complexity of PEF studies
will increase.
Conclusion
Choosing economic allocation will not lead to large differences in environmental of beer impact compared to the results
of the screening, for the brewery nor for the total lifecycle, as most of the economic revenue is derived from the beer.
Choosing mass allocation based on dry matter content will lead to large differences in environmental impact of beer
compared to the results of the screening, for the brewery as well as for the total lifecycle, as most of the dry matter
content is in the brewers’ grains.
Choosing system expansion will lead to large differences in environmental impact of beer compared to the results of
the screening for the brewery but will not lead to large differences in environmental impact of beer compared to the
results of the screening for the total lifecycle.
Another consideration regarding system expansion is the fact that the co-product of the brewery (brewers’ grains)
actually has a larger environmental impact that the basic raw material which is used for the brewing of beer (malted
barley), from the perspective that 1.7 kg dry matter of brewers’ grains equals 2.0 kg dry matter of rapeseed meal.