pefa in latin america: the experience so far eu workshop december 2012 pefa secretariat 1
TRANSCRIPT

PEFA in Latin America:
the experience so far
EU WorkshopDecember 2012
PEFA Secretariat
1

Agenda
Introduction
PEFA in LAC
Repeat assessments
Country comparisons
Sub-national assessments2

Agenda
Introduction
PEFA in LAC
Repeat assessments
Country comparisons
Sub-national assessments3

The PEFA Partners
4

Purpose of the PEFA FrameworkThe Framework provides:• a high level overview of all aspects of a country’s PFM
systems performance (including revenue, expenditure, procurement, financial assets/ liabilities): are the tools in place to help deliver the 3 main budgetary outcomes? (aggregate fiscal discipline; strategic resource allocation; efficient service delivery)
It does not provide an assessment of :• underlying causes for good or poor performance i.e.
the capacity factors• government fiscal & financial policies
5

What can countries use PEFA for?
• Inform PFM reform formulation, priorities• Monitor results of reform efforts• Harmonize information needs for external
agencies around a common assessment tool• Compare to and learn from peers
6

Adoption of the PEFA Framework
Very good progress – globally• 290+ assessments, covering 130+ countries• Since 2010, mostly Repeat & Sub-National assessments
High country coverage in many regions• Africa & Caribbean 90% of countries• Latin America, Eastern Europe, Asia Pacific 50-80%
Used in many Middle Income countries• Upper MICS: e.g. Brazil, Turkey, Belarus, South Africa• Lower MICS: e.g. India, Kazakhstan, Ukraine, Morocco
7

Global Roll-out of PEFA
8
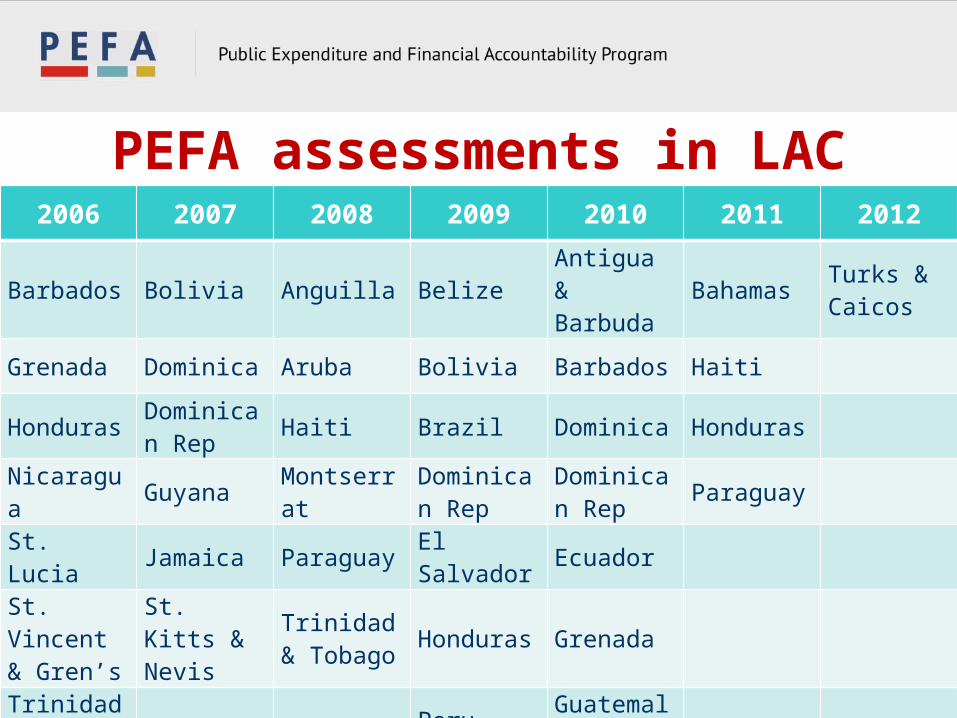
PEFA assessments in LAC2006 2007 2008 2009 2010 2011 2012
Barbados Bolivia Anguilla BelizeAntigua & Barbuda
BahamasTurks & Caicos
Grenada Dominica Aruba Bolivia Barbados Haiti
HondurasDominican Rep
Haiti Brazil Dominica Honduras
Nicaragua Guyana Montserrat Dominican Rep
Dominican Rep
Paraguay
St. Lucia Jamaica Paraguay El Salvador Ecuador
St. Vincent & Gren’s
St. Kitts & Nevis
Trinidad & Tobago
Honduras Grenada
Trinidad & Tobago
Peru Guatemala
St. Kitts & Nevis
Montserrat
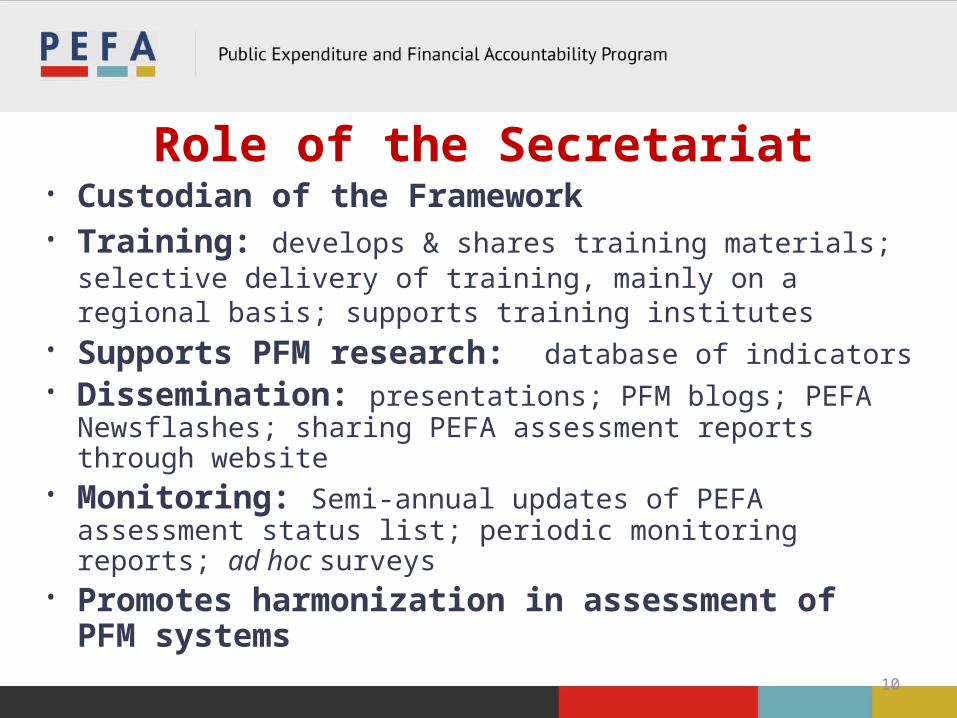
Role of the Secretariat• Custodian of the Framework• Training: develops & shares training materials;
selective delivery of training, mainly on a regional basis; supports training institutes
• Supports PFM research: database of indicators
• Dissemination: presentations; PFM blogs; PEFA Newsflashes; sharing PEFA assessment reports through website
• Monitoring: Semi-annual updates of PEFA assessment status list; periodic monitoring reports; ad hoc surveys
• Promotes harmonization in assessment of PFM systems 10

PEFA Secretariat Quality Review• On request, free of charge, rapid feedback (10 days) for
CNs/ToRs & Assessment Reports• Issues “PEFA Check” – process certification• Appraises adequacy of background info & application of
performance indicators: correctly interpreted, sufficient evidence, correct scoring method?
• Considers whether summary assessment brings out clear message, consistent with indicator analysis
• Follow-up review – evaluates responses
11

Agenda
Introduction
PEFA in LAC
Repeat assessments
Country comparisons
Sub-national assessments12

Structure of the indicator set
13

PEFA assessments in LAC2006 2007 2008 2009 2010 2011 2012
Barbados Bolivia Anguilla BelizeAntigua & Barbuda
BahamasTurks & Caicos
Grenada Dominica Aruba Bolivia Barbados Haiti
HondurasDominican Rep
Haiti Brazil Dominica Honduras
Nicaragua Guyana Montserrat Dominican Rep
Dominican Rep
Paraguay
St. Lucia Jamaica ParaguayEl Salvador
Ecuador
St. Vincent & Gren’s
St. Kitts & Nevis
Trinidad & Tobago
Honduras Grenada
Trinidad & Tobago
Peru Guatemala
St. Kitts & Nevis
Montserrat

LA: Credibility of the budget: PFM out-turns (1 –
4)% A B+, B C+, C D+, D NS
PI-1 27% 36% 25% 11% 0%PI-2 25% 20% 41% 14% 0%PI-3 77% 11% 5% 7% 0%PI-4 14% 39% 16% 14% 16%
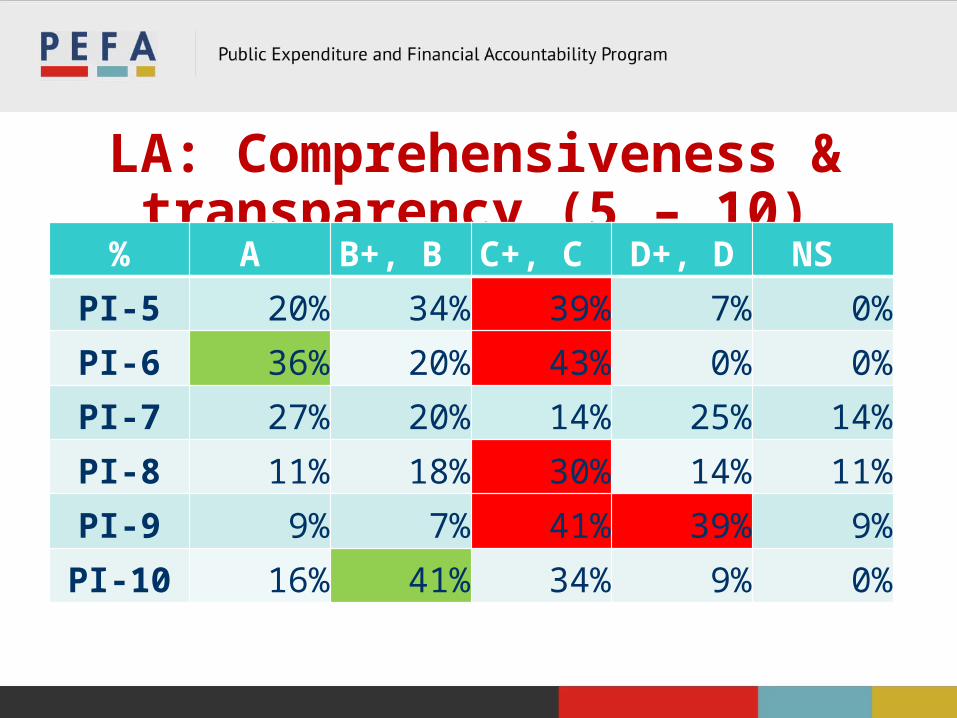
LA: Comprehensiveness & transparency (5 – 10)
% A B+, B C+, C D+, D NS
PI-5 20% 34% 39% 7% 0%PI-6 36% 20% 43% 0% 0%PI-7 27% 20% 14% 25% 14%PI-8 11% 18% 30% 14% 11%PI-9 9% 7% 41% 39% 9%
PI-10 16% 41% 34% 9% 0%
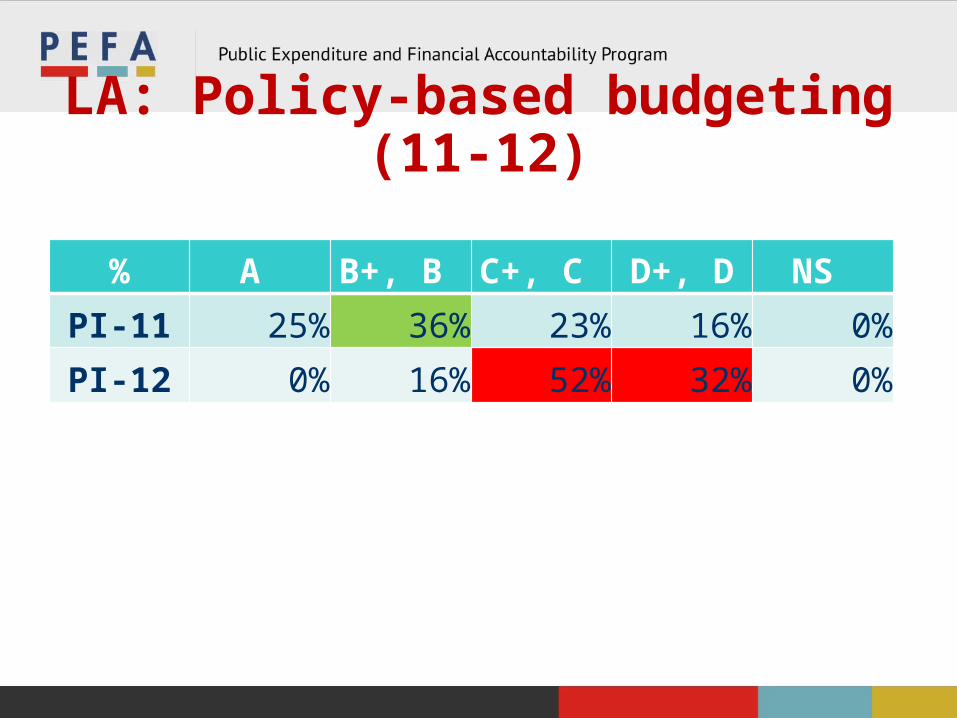
LA: Policy-based budgeting (11-12)
% A B+, B C+, C D+, D NS
PI-11 25% 36% 23% 16% 0%PI-12 0% 16% 52% 32% 0%
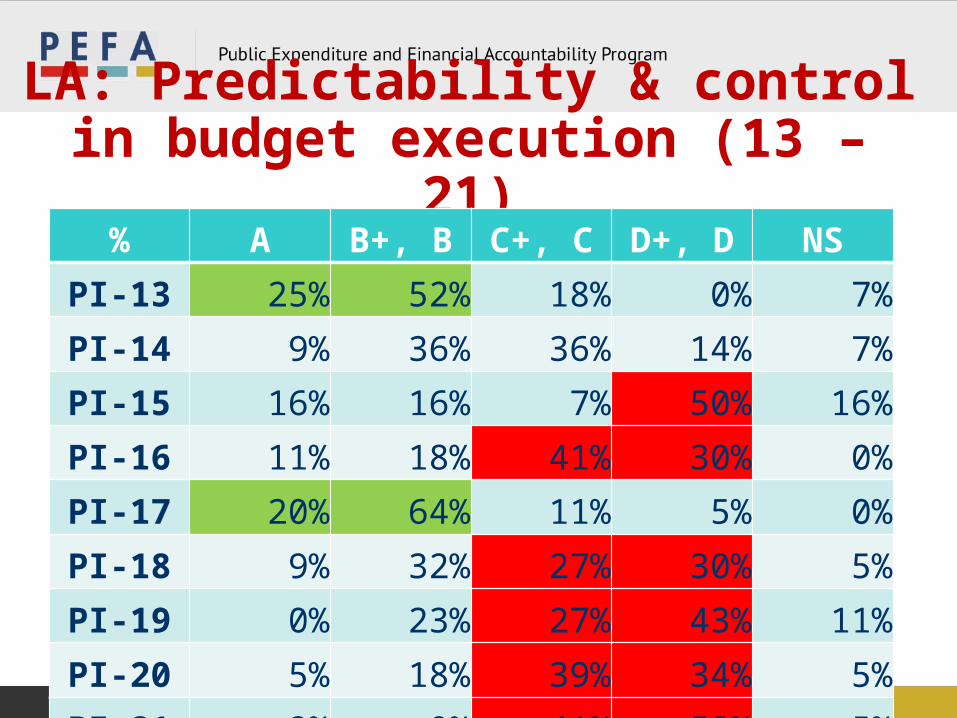
LA: Predictability & control in budget execution (13 – 21)
% A B+, B C+, C D+, D NS
PI-13 25% 52% 18% 0% 7%PI-14 9% 36% 36% 14% 7%PI-15 16% 16% 7% 50% 16%PI-16 11% 18% 41% 30% 0%PI-17 20% 64% 11% 5% 0%PI-18 9% 32% 27% 30% 5%PI-19 0% 23% 27% 43% 11%PI-20 5% 18% 39% 34% 5%PI-21 2% 0% 41% 52% 5%

LA: Accounting, recording & reporting (22 – 25)
% A B+, B C+, C D+, D NSPI-22 11% 36% 25% 20% 7%PI-23 14% 20% 9% 50% 7%PI-24 14% 30% 39% 18% 0%PI-25 11% 11% 32% 45% 0%

LA: External scrutiny & audit (26-28)
% A B+, B C+, C D+, D NSPI-26 0% 16% 25% 57% 2%PI-27 9% 11% 32% 43% 5%PI-28 0% 0% 11% 84% 7%

LA: Indicators of donor practices (D1-3)
% A B+, B C+, C D+, D NS
D-1 14% 7% 11% 27% 43%
D-2 9% 5% 16% 48% 22%
D-3 5% 2% 18% 50% 25%

PEFAs in LAC suggest that....Dimension Overview Relevant concerns
Credibility Reasonable Composition
Com’hensiveness Mixed Fiscal risks (EBFs SNGs)
Policy-based Very weak Forward links
Predictability Weak Predictability; Procurement & Payroll; Internal control, IA
Accounting Improving PI-23; Financial Statements
Oversight Very weak SAI independence; PAC; Follow-up
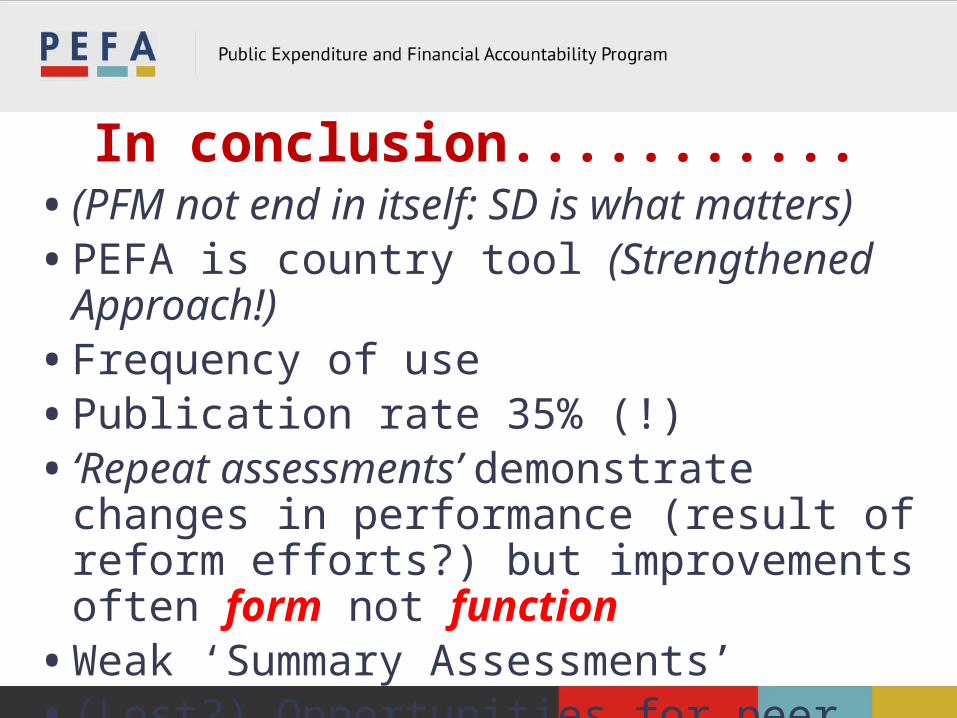
In conclusion...........• (PFM not end in itself: SD is what matters)• PEFA is country tool (Strengthened Approach!)• Frequency of use• Publication rate 35% (!)• ‘Repeat assessments’ demonstrate changes in
performance (result of reform efforts?) but improvements often form not function
• Weak ‘Summary Assessments’• (Lost?) Opportunities for peer learning

Agenda
Introduction
PEFA in LAC
Repeat assessments
Country comparisons
Sub-national assessments24

Repeat Assessments• At March 2012, 70+ repeat assessments
undertaken: 5 underway & many more planned over next year or so
• Expected to continue to increase i.e. 3-4 years after baseline assessment
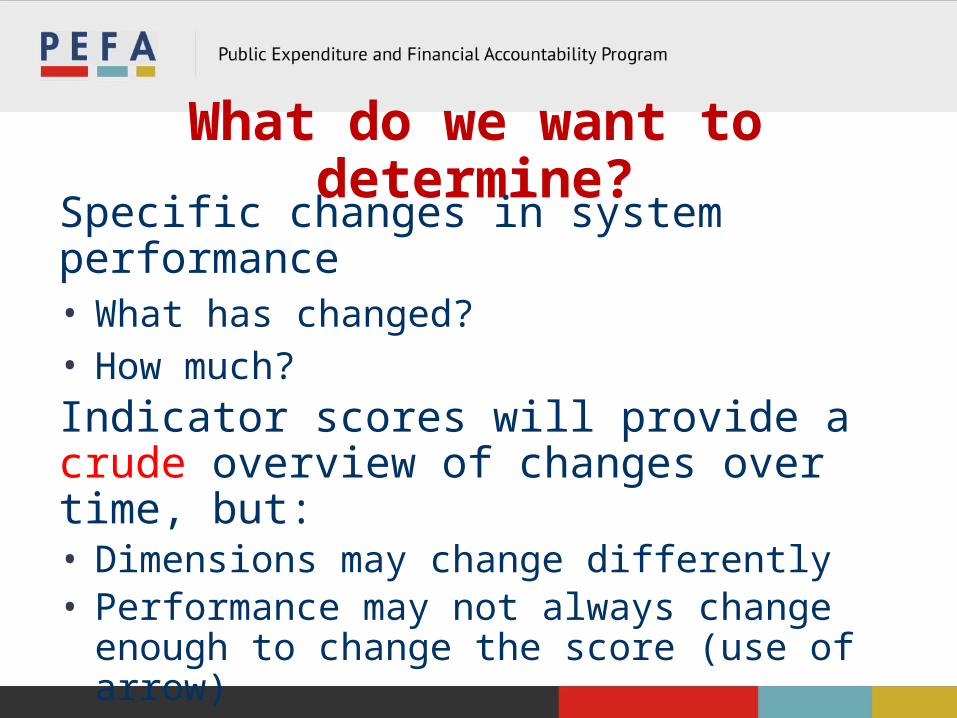
What do we want to determine?
Specific changes in system performance • What has changed?• How much?Indicator scores will provide a crude overview of changes over time, but:• Dimensions may change differently• Performance may not always change enough to
change the score (use of arrow)So more detailed explanation required

Non-performance reasons why scores may change
• Changes in definitions• Improved availability of or access to
information• Different sampling • Different interpretation in borderline cases • Scoring methodology mistakes in previous
assessment

If assessors find issues ...
Avoid temptation to re-rate previous assessment Explain that:• present & previous ratings are not comparable, & why• different view in previous assessment may have
influenced conclusions about direction

Reporting on progress made
• Explain all factors that impact a change in rating indicator-by-indicator
• Identify the performance change• Ensure that any reader can track the change
from the previous assessment – what performance change led to the change in a rating

Explain changesPI Score
2006Score 2010
Performance change
Other factors
PI-1 C B Performance appears improved based on 2006: last deviations 6%, 11%, 18%, 2010: 5%, 11%, 6%
Not clear if all external project funds excluded from 2006 data but may not be significant
PI-4 (i)
A C May not be worse, despite reported arrears increase from 1% in 2006 to 6% in 2010.
2006 assessment used data on pending payment orders only, not overdue invoices

Agenda
Introduction
PEFA in LAC
Repeat assessments
Country comparisons
Sub-national assessments31

Country ComparisonsPEFA Framework was developed to measure progress over time in one country – not for Country Comparisons• ‘Summary assessment’ to provide nuanced overview of
strengths & weaknesses as basis for reform prioritization• No method to derive measure for ‘overall performance’• No attempts to create global performance list
But: demand from Governments, Researchers & Donors
32

Country data and how to use it
Comparison of two countries must be done very cautiously:• Resembles comparison of assessments over time in
one country but more complex• Technical definitions may be different• Need to carefully read each report to understand
performance differences behind the scores• Consider country context, ensure comparison of like
with like
Comparing scores alone can be misleading 33

Comparing groups of countriesAggregation may be desirable: requires 3 decisions:• Conversion from ordinal to numerical scale• Weighting of indicators (generally & by country)• Weighting of countries (for country cluster analysis)
No scientifically correct/superior basis for conversion/weighting• Each user takes those decision on individual opinion
If aggregation is desired:• Be transparent on method used & discuss reasons• Sensitivity analysis to illustrate impact on findings
34

Agenda
Introduction
PEFA in LAC
Repeat assessments
Country comparisons
Sub-national assessments35

Sub-National AssessmentsPolitical & Admin Decentralization: • accountability; oversightFiscal decentralization: • Service obligations / Expenditure assignments (Central:
typically, defense; SNG: typically, primary services, e.g. health) but some services split between levels of govt: also, parallel structures
Financing• Revenue assignments (often not called ‘tax’ even if it is)• Shared revenue – collected by central or SN govt• Grants from higher level government• Borrowing
36

Structural Models• Almost every country has unique structure,
determined by historical/political circumstances
• Variations may relate to: • Federal vs Unitary states• Symmetrical vs Asymmetrical federalism• Federal units covering all vs part of a country• Francophone vs Anglophone decentralization
37

Definition of Sub-National Gov’tGFS manual: “to be treated as institutional units, they
must be entitled to own assets, raise funds, and incur liabilities by borrowing on their own account. They must also have some discretion over how such funds are spent, and should be able to appoint their own officers independently of external administrative control.”
PEFA follows this definition except for the ability to borrow on own account
38

39
Purpose of assessment: adaptationTwo types of SN Assessments• One SN entity - Primary Purpose: inform entity’s reform
formulation & track progress: unrelated to national assessment: Resource inputs high
• Sample of entities - Primary Purpose: inform national reform formulation & donor fiduciary needs: related to national assessment: Resource inputs are lower for each entity, but high in total
For use at SN level, modifications needed to• Indicator set • Performance report

40
Modifications to PIsAdditional indicator required: HLG-1 3 dims:• Annual deviation of actual total HLG transfers from
original total estimated amount provided by HLG to SN entity for inclusion in latter’s budget
• Annual variance between actual & estimated transfers of earmarked grants
• In-year timeliness of transfers from HLG (compliance with timetables for in-year distribution)
Audit & Legislature PIs need careful consideration to distinguish national/local oversight, & terminology aligned with local institutions

41
Modifications to PFM-PREssential to include careful description of :• Structure of general government, its levels & entities
• Legal & regulatory framework for SN government
• Intergovernmental relationship such as transfers, expenditure assignments and borrowing powers
• Institutional framework/structures at SN level
• Exact coverage of the SN level assessment

LAC SN: Credibility of the budget: PFM out-turns (1 –
4)% A B+, B C+, C D+, D NS
PI-1 17% 25% 25% 33% 0%PI-2 17% 17% 0% 33% 33%PI-3 33% 17% 0% 17% 33%PI-4 8% 8% 75% 8% 0%

LAC SN: Comprehensiveness & transparency (5 – 10)
% A B+, B C+, C D+, D NS PI-5 75% 8% 17% 0% 0%
PI-6 58% 17% 0% 25% 0%
PI-7 75% 17% 8% 0% 0%
PI-8 42% 0% 25% 0% 33%
PI-9 8% 8% 33% 25% 25%
PI-10 17% 50% 33% 0% 0%

LAC SN: Policy-based budgeting (11-12)
% A B+, B C+, C D+, D NS
PI-11 33% 50% 17% 0% 0%
PI-12 8% 0% 50% 42% 0%

LAC SN: Predictability & control in budget execution
(13 – 21)% A B+, B C+, C D+, D NS
PI-13 8% 33% 0% 0% 58%PI-14 8% 33% 0% 0% 58%PI-15 0% 8% 0% 33% 58%PI-16 8% 33% 25% 33% 0%PI-17 17% 83% 0% 0% 0%PI-18 8% 0% 92% 0% 0%PI-19 8% 33% 25% 0% 33%PI-20 8% 33% 42% 17% 0%PI-21 8% 0% 42% 50% 0%

LAC SN: Accounting, recording & reporting (22 –
25)% A B+, B C+, C D+, D NS
PI-22 25% 58% 17% 0% 0%PI-23 8% 25% 33% 33% 0%PI-24 33% 58% 8% 0% 0%PI-25 50% 8% 33% 8% 0%

LAC SN: External scrutiny & audit (26-28)
% A B+, B C+, C D+, D NS
PI-26 0% 33% 42% 25% 0%
PI-27 25% 8% 8% 25% 33%
PI-28 0% 25% 8% 33% 33%

LAC SN: Indicators of donor practices (D1-3) & HLG-1
% A B+, B C+, C D+, D NS
D-10% 0% 0% 0% 100%
D-20% 0% 0% 17% 83%
D-30% 0% 0% 25% 75%
HLG-1 0% 0% 8% 17% 75%

SN PEFA in LAC suggest that.....
Dimension Overview Relevant concerns
Credibility Mixed Arrears
Com’hensiveness Reasonable
Policy-based Weak Forward links
Predictability Weak (no scores); Payroll; internal control & audit
Accounting Mixed
Oversight Weak
Donors/HLG-1 Very weak Transfers

Observations on SN assessments• Difficulties in making appropriate distinction
between national & sub-national performance features
• Indicator HLG-1 not included
• Problems with scope of revenue indicators
• Misunderstanding scope of PI-8 & PI-9(ii)
• Local assessors/consultants with no prior PEFA experience 50

Thank you for your attention