pediatric multi-specialty clinic i nursing staff workload
TRANSCRIPT

I
Pediatric Multi-Specialty ClinicNursing Staff Workload Study
Program and Operations Analysis Department
Bree BowersoxKelly Cairns
Dennis Michelson
April 24, 1998

Executive Summary
This report is a study of the clinical time distribution of the Multi-Specialty ClinicPediatric Nursing Staff in Taubman Center. The study was conducted by a group of TOE481 students. Three teams, consisting of 17 nurses, were studied. The purpose of thisproject is to determine the nursing staff workload. Three areas of interest include:
• Proportion of time spent on clinical activities versus non-clinical activities.• Proportion of time spent performing each separate clinical activity.• Detailed information regarding the phone calls handled by the nursing staff.
Data was collected from February 10, 1998 through March 27, 1998. Workload andphone log studies were conducted for a duration of two weeks each. The project teamconducted interviews of the entire nursing staff and performed the observations of aselect group of nurses throughout the study.
The workload measurement data was analyzed to evaluate the distribution of work withinthe Pediatric Clinic. From this study, it was determined that there exists an imbalance inworkload distribution among divisions within the Pediatric Multi-Specialty Clinic. Keyfindings also include the following:
• The annualized Phone Care nursing minutes per patient visit ranged from 13.0to 58.2 minutes.
• The annualized nursing minutes per patient visit for Clinical Activities rangedfrom 14.5 to 64.6 minutes.
• Phone Care consumes the most Full Time Equivalents (FTE), atapproximately 4.5 FTE’s or 35% of all nurses.
The phone log study was conducted in order to identif,r the distribution of types of phonecalls, length of phone calls, and other relevant phone call information.
• For the Pediatric Clinic, the volume of calls is spread evenly throughout theday at approximately 28 calls per hour.
• 77% of calls are outgoing and 98% are routed appropriately.
• 48°/o of calls are to or from a patient or a patient’s parent.
The interview results were compared with the actual data findings in order to determinethe difference in subjective and objective data. It was found that the estimatedpercentage of Phone Care is higher than the actual percentage in all but one case Also,
— the estimated percent of time spent on Clinical Activities is higher or very close to theactual percentage in most cases Key findings trom the interview include

• 60% of nurses feel they cannot complete their work in a typical workday.
• Several activities which nurses feel they perform outside their job descriptioninclude clerical activities, clinic scheduling, and medical assistant procedures.
• The nurses suggested job improvements including the addition of newcomputers, more time for patient education, and rotation of clinic/ office days.Observations were conducted on 6 nurses for a period of approximately 2 hours each.During these periods, nurses were studied to identify inefficiencies in their normal workpatterns and daily activities. A list of general improvements was obtained from theseobservations. Key findings from the observations include nurses doing the following:
• Performing unnecessary clerical activities.• Calling patients from the waiting area.• Walking unnecessary distances to office equipment they need.• Writing chart summaries prior to seeing patients.
Several data barriers were encountered throughout the study. Two major barriers includemisuse of beepers and discrepancies in interpretations of workload and phone logdefinitions. Further discussion of these barriers can be found in the report.
The recommendations discussed in the report are:
• Reduce dictation time for Gastroenterology.• Reduce phone care time for Nephrology and Neurology.• Reduce non-clinical communication time for Neonatology, CN II’s,and CN Ill’s.• Reduce the amount of scheduling calls handled by nurses.
I

/Table of Contents
/
Introduction and Background
- ... IPurpose
1Scope
Approach and Methodok.gyProject Approach
.• 3Project Methodology
---.3Current SituationFindings/Conclusions
Workload Data Collection Findings
- - 4Phone Log Findings
7Phone! Workload Comparison
14Interview Findings
15Interview! Workload Comparison
17Observation Findings
17Data Barriers
I 8Reconuindatjons
18Appendices
20
1•E\ /

Introduction and Background
A steering committee was formed in July 1997 in order to manage a clinic reorganization
project for the Pediatric Multi-Specialty Outpatient Clinic in Taubman Center. One
phase took place during the Fall semester of 1997, which studied the clinical time
distribution of the Clerical Support Staff The project outlined in this report is another
phase of the clinic reorganization project. This phase, which takes place during the
Winter semester of 1998, studies the clinical time distribution of the Nursing Staff. The
study was conducted by a group of IOE 481 students mentored by the Program and
Operations Analysis department.
Purpose
The purpose of this project is to determine the nursing staff workload. Three areas of
interest include:
• Proportion of time spent on clinical activities versus non-clinical activities.
• Proportion of time spent performing each separate clinical activity.
• Detailed information regarding the phone calls handled by the nursing staff.

Scope
Three teams, consisting of 17 nurses, were studied within the Pediatric Multi-Specialty
Clinic. The breakdown of the nurses who were studied is:
Team Division Number of Nurses Number of FTE’s1 Gastoenterology 2 1.5
Infusion 1 0.3! Nephrology 2 2.0
Team 1 Subtotal 5 3.8
2 NeonatologyNeurology
Team 2 Subtotal
3 EndocrinologyPulmonary
Infusion!MyelodysplasiaTeam 3 Subtotal
I3 2.54 3.1
3
0.6
2.054 3.381 0.88 6.23
Peds Total 17 I 13.13
Note: One nurse from Team 1 and two nurses from Team 3 were not studied dueto unavailability. Therefore, 17 of the original 20 were studied.
The breakdown by nursing level is:
‘FTE = Full Time Equivalent
Note: Two nurses, from Endocrinology and Pulmonary, were not included in thephone log study. One of the nurses was on leave, and the other does notperform any phone care. Seventeen nurses were included in the workloadstudy.
Nursing Level Number of Nurses Total FTE’s1Clinical Nurse I (CN 1) 1 0.5Clinical Nurse II (CN II) 4 2.75Clinical Nurse III (CN III) 3 2.23Clinical Nurse Specialist (CNS) 3 2.35Clinical Care Coordinator (CCC) 3 2.6Pediatric Nurse Practitioner (PNP) 3 2.7

Approach and Methodology
Project Approach
The general approach used for this project include:
• Defining the purpose, scope, approach, methodologies, and project schedule
• Creating and revising data collection tools
• Executing data collection studies (workload and phone)
• Interviewing nursing staff
• Performing nursing observations
• Compiling and analyzing collected data
• Producing a report
• Presenting final results to the Pediatric Multi-Specialty Clinic Steering
Committee
Project Methodology
Data was collected from February 10, 1998 through March 27, 1998. The data collection
involved 17 nurses who recorded workload and phone data. The duration of each study
was two weeks. However, in the case of employee absences, or vacations, partial data
was collected for a minimum of one week. Therefore, data was collected throughout a
six-week period. The project team conducted interviews of each of the 17 nurses studied,
and performed observations of a select group of nurses throughout the study. The
following methods were implemented for data collection:
• In order to determine the workload distribution of the nursing staff, a
workload measurement study was performed. The percent of time each nurse
spends on the defined activities was determined by placing “hash” marks next
to the appropriate activity on the workload data sheet (see Appendix C). The
random time intervals used for placing “hash” marks were determined with
beeper alarms programmed for approximately 4 beeps per hour. The
workload study was conducted for 2 weeks.
3

• A phone log study provided detailed information concerning the phone calls
handled by the nursing staff The phone log identified the types of phone
calls, time at which they occurred, length of calls, and other relevant
information (see Appendix C). The statistics for each call were registered on
the phone log data sheet for a period of 2 weeks.
• In addition to the above methodologies, the project team conducted interviews
of all of the nursing staff participating in the study (see Appendix C). The
interviews were used to identify the staffs workload perceptions, which were
compared to the data collected in the workload and phone studies.
• A selected portion of the nursing staff was observed in clinic to identify
activities that were not represented in the workload study. Ineffective
activities in the clinical operations were noted, so suggestions for potential
improvements in the clinic could be made.
Current SituationCurrently, a perceived imbalance of nursing resources among the pediatric divisions
exists. The Steering Committee is interested in creating a more efficient and effective
clinic. This will be accomplished by examining each nurse’s role and determining how
each nurse may be best utilized in the clinic. Limited data has been collected up to now
and there is a lack of tools for on-going measurement. Therefore, a minimal
understanding exists of the actual type of work being performed by nurses. Workload
measurement and phone log studies are necessary to provide initial data for determining
how best to utilize nursing staff resources.
Findin2s/ Conclusions
Workload Data C’ollection Findings
The workload measurement data was analyzed to evaluate the distribution of work within
the pediatric clinic. From this evaluation, it was determined that there exists an
4

imbalance in workload distribution among divisions within the Pediatric Multi-SpecialtyClinic. The following are examples of this imbalance:
• The percentage of Phone Care ranged from 2% in Infusion to 61% in
Nepbrology and Neurology.
• The percentage of time spent on Clinical Coordination! Communication
ranged from 3.5% in Nephrology to 43% in Infusion.
• The percentage of time spent on Patient History! Assessment’ Education
ranged from 3.5% in Neurology to 25% in Infusion.
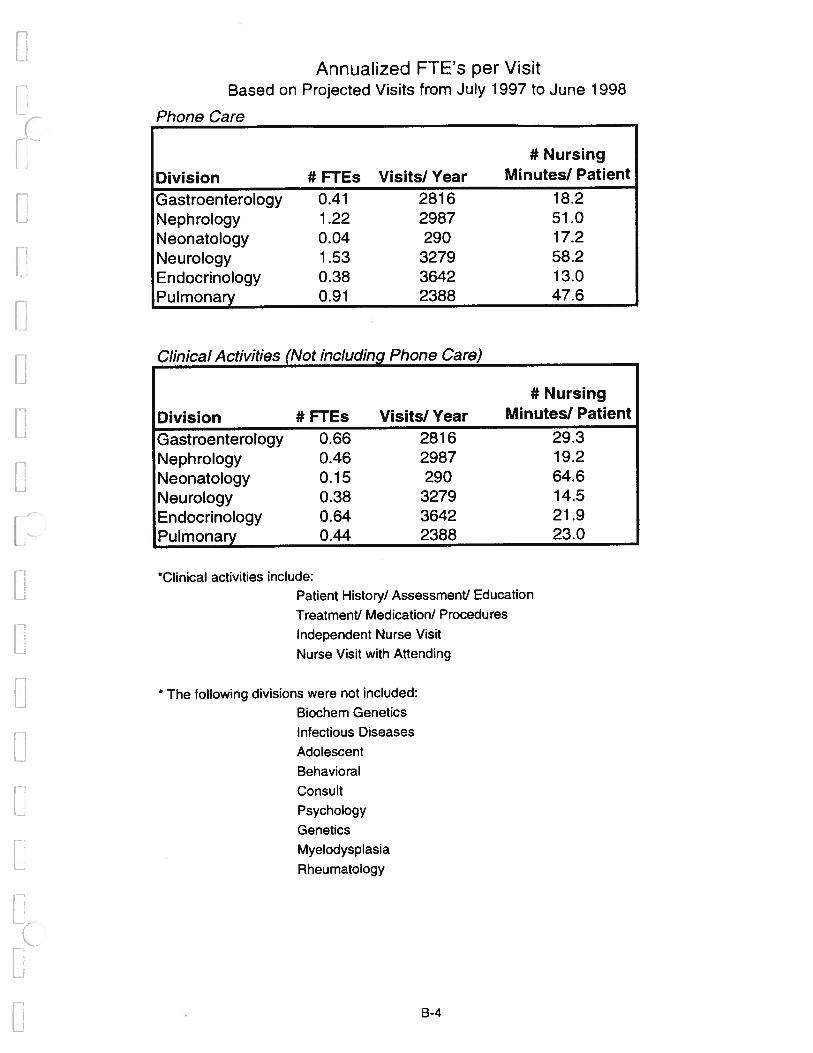
The Phone Care and Clinical Activities workload results were annualized in order to
examine the average number of nursing minutes each division spends per patient visit.
The breakout of each of the division’s nursing minutes can be seen in Appendix B-4.
• The Phone Care nursing minutes per patient visit ranged from 13.0 to 58.2
minutes. Endocrinology spent the least time at 13.0 minutes per patient visit.
Neurology spent the most time at 58.2 minutes per patient visit.
• The nursing minutes per patient visit for Clinical Activities ranged from 14.5
to 64.6 minutes. Neurology spent the least time at 14.5 minutes per patient
visit. Neonatology spent the most time at 64.6 minutes per patient visit.
Each division was also evaluated in order to compare divisional workload differences.
The clinical nursing level workloads were also compared to locate workload differences
between nursing levels. The results of the workload measurement study were broken
down into the weighted percentage of time spent on each of the activities and the number
of FTh’s spent on each activities (See Appendix A-i, A-2).
5
12
>. 10
0
0
LU4
2
0
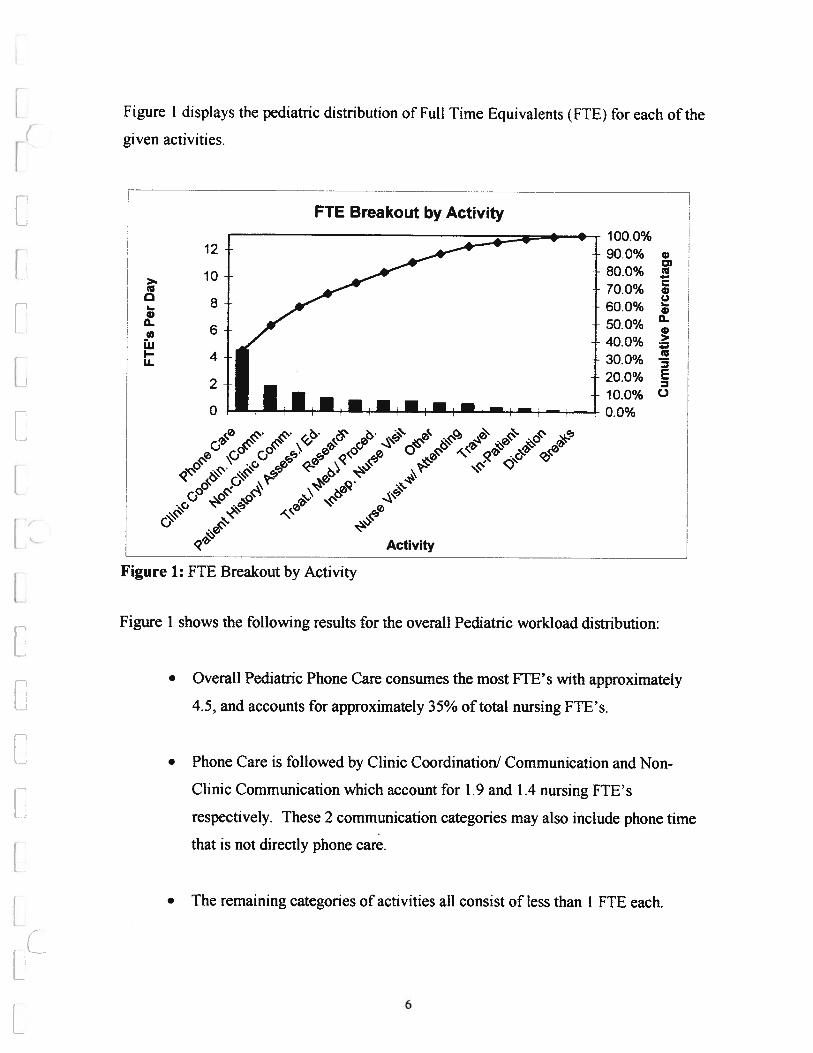
Figure 1: FTE Breakout by Activity
Figure 1 shows the following results for the overall Pediatric workload distribution:
a,
Cu
C Ia,0Ia’C
>
Cuz
C)
• Overall Pediatric Phone Care consumes the most FTE’s with approximately
4.5, and accounts for approximately 35% of total nursing FTh’s.
• Phone Care is followed by Clinic Coordination! Communication and Non-
Clinic Communication which account for 1.9 and 1.4 nursing FTE’s
respectively. These 2 communication categories may also include phone time
that is not directly phone care.
• The remaining categories of activities all consist of tess than I FTE each.
Figure 1 displays the pediatric distribution of Full Time Equivalents (FTE) for each of the
given activities.
FTE Breakout by ActivityI 00.0%90.0%80.0%70.0%60.0%50.0%40.0%30.0%20.0%10.0%0.0%
.P) >,
\O
6

The following team level findings were obtained (See Appendix A-I, A-2):
• Teams 1 and 2 have a high percentage of time spent on phone care (43.1 °/b and
50.8% respectively). The high percentage in Phone Care for Team I is due to
Nephrology, which spends 61% of their time on this activity. The high
percentage of Team 2’s Phone Care is a result of Neurology’s 61% Phone
Care time.
• Team 3 has a more even spread throughout the activities.
At the nursing level, the following information was gathered (See Appendix A-i, A-2):
• The CN I, CN II, CCC, and PNP nursing levels have phone care percentages
ranging from 43% to 54°/b.
• The CN III, and CNS nursing levels, however, have Phone Care percentages
ranging from 11% to 16%.
• The CCC and PNP nursing levels spend 42.9% and 47.0% respectively on
Phone Care. These nursing levels should have smaller phone care percentages
due to job descriptions entailing more clinical time with patients as opposed to
phone care time.
Phone Log Findings
The phone log data was evaluated in order to identify the distribution of types of phone
calls, length of phone calls, and other relevant phone call information. The data is shown
on the division level, team level, nursing level, and for the overall pediatric clinic (See
Summary Charts in Appendix A). This data is important because the phone call activity
was determined, in the workload study, to consume more FTE’s than any other activity.
This is consistent with the direction of health care. Nurses are handling more patient care
over the phone, as opposed to seeing the patients in clinic.
7

r. The average number of phone calls! day can be found in Appendix A-3. The number of
r calls Ibr each of the possible activities is weighted for each of the divisions by the
number of FTE’s each nurse worked. This means that a nurse with a higher FTE will begiven more weight when determining the divisional average.
• For the pediatric clinic as a whole, the percentage of time spent on each of the
activities is evenly allocated, except for case coordination and symptom type
phone calls (See Figure 2).
Volume of Call per Day by Type
250.0 100.0%90.0% ,nr rto,200.0 °•‘°
. 70.0%C..)f..r1foI150.0 OU.J/O
50.0%ioo.o 40.0%
30.0%Z 50.0 20.0% E
10.0% c30.0 0.0%
(F
Figure 2: Volume of Call per Day by Type
• From Appendix A-3, it can be seen that the Nephrology division has the
highest average volume of phone calls at 72.1 per day. This average is closely
followed by the Pulmonary division at 68.5 calls per day.
• Nephrology has a volume of 35 case coordination calls per day, which
accounts for the majority of this division’s phone calls. Nephrology’s large
Call Type
8

volume of case coordination calls at 35 per day skews the Team I percentage
to 40.8% and the overall pediatric clinic percentage to 27.8%, which is higher
than the other call type categories.
Evaluation at the nursing level displays the following:
• The PNP’s receive the highest volume of phone calls at 81.1 per day followed
by the CCC’s at 69.8 calls per day.
• The CN III’s have the lowest average daily volume of phone calls at 6.7 per
day.
According to job descriptions, the PNP’ s should have the lowest volume of phone calls
because the majority of their time should be spent in the clinic with patients. The
majority of the PNP’s calls are in regard to case coordination, while the majority of CN
l’s calls are in regard to scheduling. This shows a fundamental difference in the type of
phone calls that are handled by the different nursing levels, which is appropriate.
The average length of phone calls handled by the pediatric nurses can be seen in
Appendix A-4. The average length of phone calls is weighted by the volume of calls that
each nurse receives. Therefore, nurses with higher volumes will be weighted more in the
average length calculation. Standard deviations were calculated for call lengths between
each of the divisions in a team, each of the divisions within the clinic, and between the
nurses within each nursing level. Figure 3 depicts the average length of each type of call
for the overall Pediatric Clinic.
9

Figure 3: Length of Call by Type of Call
The length of the phone calls is relatively similar regardless of the type of call.
Test results calls have the longest average length; slightly less than 4 minutes.
Voice mail! paging calls have the shortest length; approximately 1.5 minutes.
• The standard deviation for Team I General Work calls is extremely high with
a value of 6.4 minutes. Gastroenterology causes this high deviation because
its average length of General Work calls is 12.5 minutes compared to 1 and 2-
minute average lengths for the other Team I divisions.
• Among the various nursing levels, the highest standard deviation is 7 minutes,
which occurs for the CNS General Work calls, This corresponds to the
deviation caused by Gastroenterology in the General Work calls.
Length of Call by Type of Call
100.0%90.0%80.0%70.0%60.0%50.0%40.0%30.0%20.0%10.0%0.0%
a)a)Cu
a)h..a)0a,>
EC-)
ece.
Call Type
I0

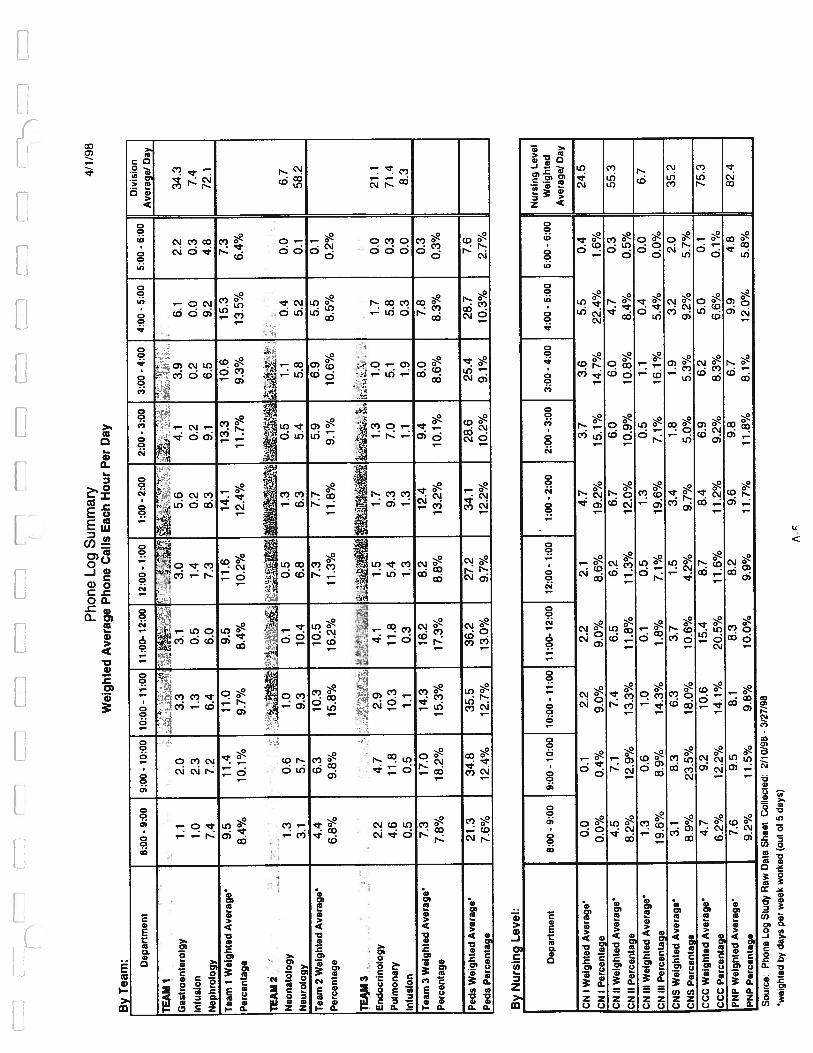
The phone call volume was broken down into the volume of calls received during each
hour of the day (See Figure 4). The times range from 8:00 a.m. until 6:00 p.m. The
volume of calls was weighted by the number of days each nurse works! week, which
allows for the volume to be weighted more for nurses who work more days. The average
number of calls per day during each hour can be seen in Appendix A-5.
Volume of Calls by Hour of Day
(UE0>
(U0
250.0
200.0
150.0
100.0
50.0
0.0
100.0%
90.0%
80.0%
70.0%
600%
50.0%
40.0%
30.0%
20.0%
10.0%
0.0%
(UC)(U
(U1(U0.(U
CU
0
8-9 9-10 10-11 11-12 12-1 1-2 2-3 3-4 4-5 5-6
Hour
Figure 4: Volume of Calls by Hour of Day
• The volume of calls is spread evenly throughout the day at both the divisional
and overall clinic levels.
• The volume of calls does not dramatically vary by the time of day for the
different nursing levels, either. The first hour and last hour of the day have
the lowest volumes because these are times when not all of the nurses are
typically at work.
Phone calls were also broken down into whom the nurse talked to on the phone. The
results of this breakdown can be found in Appendix A-6. Figure 5 illustrates the spread
II

of phone calls between each of the groups of people with whom nurses frequently are in
contact.
Volume of Calls To/From Whom Each Day
100.0% ,
250.0 90.0%80.0% ‘
200.0 700%60.0%
o 150.0>
0
ioo.o 40.0% .
C) 30.0% .
50.0 20.0%10.0%
0.0 0.0%
FigureS: Volume of Calls To/From Whom Each Day
At the overall Pediatric level, the following was true:
• The majority of phone calls, nearly 50%, were placed to or received from the
patient or the patient’s parent.
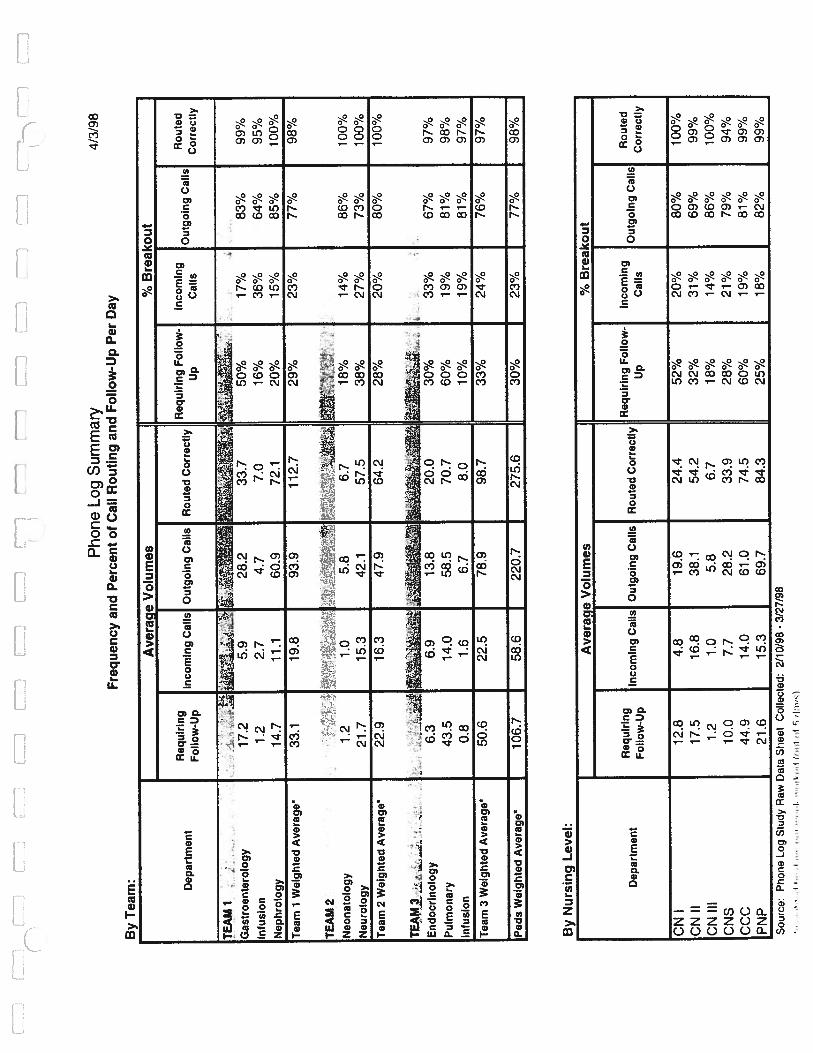
• 77% of phone calls are outgoing. The breakout of outgoing calls, correctly
routed calls, and calls requiring follow-up can be seen in Appendix A-7.
• The percentage of calls routed appropriately is 98% for the overall Pediatric
Clinic. Most of the calls that are not routed appropriately are due to the nurses
calling a wrong number when making a phone call.
Whom
12

The team level results are as follows:
• Team I and Team 2 have Patient calls in excess of 50%, while Team 3 has37% of its calls to Patients. Physician and Other phone calls are morefrequent in Team 3 than the other 2 teams, which causes the decrease inpatient calls for Team 3. Phone calls that were not documented to! fromwhom they regarded were placed in the Other category.
• Team 3 has the largest average number of calls per day requiring follow-up at51 calls per day, which is 33% of the calls.
• The percentage of outgoing calls is consistent between teams at approximately77%. The high percentage of outgoing calls is a result of nurses obtaining
most of their calls through voice mail or pages. Therefore, they must return
these calls.
The following are the divisional results:
• At the divisional level, Pulmonary must follow-up on 60% of their calls and
Gastroenterology requires follow-up on 50% of their calls.
• The Infusion division within Team I and the Endocrinology division within
Team 3 have the lowest percentage of outgoing calls at approximately 65%.
• The divisional percentages of calls routed appropriately range from 95% to
100%.
At the nursing level, the following findings were apparent:
• The CCC’s and the CN l’s have the highest percentages of calls requiring
follow-up (60% and 52% respectively). This corresponds to the Pulmonary
13

and Gastroenterology divisions, which have percentages of follow-up at 60%and 50%, respectively.
The nursing level percentages of calls routed appropriately range from 94% to100%.
Phone: Workload Comparison
The number of FTE’s that each division spends on the phone can be seen in Appendix B-3. This table compares the total phone time FTh’s obtained from the phone log study to
the Phone Care FTE’s obtained from the workload study.
• The workload study shows higher FTh’s spent on phone care than the phone
log’s total FTh’s for all divisions except for 1.
• Neurology has the largest variance with a workload phone care FTh of 1.5
and a phone log FTh of 0.6.
The following are reasons for the difference between Phone Log FTh’s and workload
Phone Care FTh’s:
• The workload study includes not only the time spent on the phone, but also
preparation and follow-up for the phone care call. However, the phone log
study indicates only the time spent on the phone.
• The workload study data includes only calls regarding patients, while the
phone log study includes all calls made or received.
• The workload study obtained Phone Care time by random beeper alarms. In
the Phone Log study, however, nurses estimated length of each phone call and
therefore, the total time spent on the phone.
‘4

Interview Findings
Every Pediatric nurse studied was interviewed in order to obtain subjective feedback.This feedback was compared to the objective results obtained through data collection inorder to identify discrepancies between the nurse’s workload perceptions and the actualworkload data. General comments relating to the workplace were also noted. Theinterview template used for personal interviews can be found in Appendix C.
Each nurse was asked to estimate the percentage of time that spent performing clinicalactivities and phone care activities during an average day. Many nurses feel that the
percentage varies depending on the day of the week. Clinical activities include:
• Patient history! assessment! education
• Treatment! medication! procedures
• Independent nurse visits
• Nurse visits with attending
• Clinic coordination! communication
Some nurses may have included Phone care as a clinical activity, which would explain
the large differences between the estimated and calculated values. An obvious instance
of this is notable when a nurse estimates a very high percentage of both clinical activities
and phone care. Instances where the estimated clinical activities and phone care
percentages add up to more than 100% indicate that the nurse included phone care in the
clinical activities.
The following is a list of types of phone calls placed or received by the nursing staff:
• Scheduling • Test Results • Prescription Refills• Medication changes • Referrals • Symptoms• Schools! community • Counseling! behavioral • Assessment! adjustment
outreach issues of regimen• Scheduling non-clinic • Stocking issues • Insurance
appointments
15

A breakout from all nurses on their perceptions of completrng their work within aworkday is:
Fully Complete — 12%
Mostly Complete — 29%
Do Not Complete 59%
Some general comments obtained regarding the ability to complete work in a typical dayinclude:
• Work variation depends on day of week and time of year.
• Many nurses work through their lunch period.
• Some nurses stay beyond the scheduled workday to complete necessary work.
• Minimal time exists for extra projects and program planning.
• Clinic time is demanding.
The following is a list of activities nurses are performing outside of their job descriptions:
• Clerical activities
• Disease management
• Tracking charts
• Clinic scheduling
• Medical Assistant procedures
• Coordinating in-services for fellows
• Cleaning staff rooms
• Covering staff absences
The nursing staff suggested the following job improvements:
• Add new computers! internet access.
• Create time for patient education (internal! external and material
development).
• Rotate clinic and office days intermittently (Friday clinic days make prompt
follow-up difficult).
16

• Add more nursing support.
• Utilize Infusion clinic to full potential.
buerview Workload Comparison
The comparison of interview findings to the actual data collected can be seen inAppendix B-i. The estimated percentage of time spent on phone care is higher than theactual percentage in all cases except for 1. This shows that nurses feel they are spendingmore time on phone care than they actually are. The estimated percentage of time spenton clinical activities is higher or very close to the actual percentage in most cases. Thereare a few cases where the estimated percentage is significantly lower than the actualpercentage.
Observation Findings
Six nurses were observed for a period of approximately 2 hours each. The observations
occurred between March 17 and March 25, 1998. During these periods, nurses were
studied to identify inefficiencies in their normal work patterns and daily activities. The
following is a list of some areas for potential improvements:
• Some nurses call their own patients from the waiting area and obtain patient
vital signs.
• Many nurses are required to walk to other office areas for office equipment
such as photocopiers, printers, etc.
• Some nurses are performing unnecessary clerical activities such as checking
patient status on the computer, filing, etc.
• The scheduling system produces additional work for nurses by randomly
assigning appointments to patients on the waitlist. These patients then call the
nurse if the appointment is unsatisfactory and needs to be rescheduled.
• Some nurses create additional work by reviewing charts and writing a
summary before seeing patients.
• Nurse workload is increased when medical assistants are absent and there are
no substitutes available.
17

Data Barriers
Several barriers to accurate data collection were encountered during the study. Some of
the more prominent barriers include:
• Beepers were not always worn, activated, or heard.
• The interpretation of workload and phone study definitions varied between
nurses.
• Nurse vacations were not identified at the beginning of the study, and
therefore, adjustments could not always be made.
• Communication to nurses regarding the study was sometimes ineffective (i.e.,
email was not always read).
• Due to a short time period for the study, a sense of trust and openness was not
created, which may have hindered some results (i.e. interview data).
• Student schedules prevented the project team from performing extended
observations.
• Some nurses chose not to record data on some days during the study, and
therefore, a smaller sample size was generated.
RecommendationsIn order to utilize the nursing staff to its full potential, the following recommendations
should be considered:
• Alleviate workload imbalance between divisions. The largest imbalance
occurred within Phone Care. Therefore, this area should be focused on first to
identify why the imbalance exists and how the problem could be redistributed.
• Reduce phone care time for Nephrology and Neurology. These divisions have
extremely high phone care percentages relative to the other divisions. The
nurses within Nephrology and Neurology cause the overall PNP and CCC
nursing levels to have high phone care percentages as well. These nurses
- 18

could be better utilized in non-Phone Care activities because of their upper job
levels.
• Reduce non-clinical communication time for Neonatology, CN II, and CN UI.
This type of communication is not directly related to patient care, and
therefore should be minimized.
• Reduce the amount of scheduling calls handled by nurses. Teams I and 2
have a significant percentage of scheduling phone calls each day which should
be filtered through the clerical staff before the nurse becomes involved.
• Reduce dictation time for Gastroenterology. This is the only division that has
a high percentage of dictation. A reduction of dictation would allow these
nurses to spend additional time in areas of higher priority.

Table of Appendices
Appendix A:Workload PercentagesWorkload FTEAverage Volume of Phone Calls! DayAverage Length of Phone CallsAverage Phone Calls/HourAverage Number of Calls To! From WhomCall Routing and Follow-Up
Appendix B:Interview Findings vs ActualGeneral InformationPhone FTE TotalsAnnualized FTE
Appendix C:Workload DefinitionsWorkload Data SheetPhone Log DefinitionsPhone Log Data SheetInterview Template
Appendix D:Workload Raw DataPhone Log Raw Data

——
——
——
——
—
cJ
‘ci

1.?
FE
[.
E—
.U
1E
.,
By
Tea
m:
Wor
kloa
dM
easu
rem
ent
Stud
ySu
mm
ary
Wei
ghte
dP
erce
nta
ge
ofA
ctiv
itie
s4/
5/98
.T
reat
i.
..
Phon
ePa
tient
His
tory
/In
dep.
Nur
seN
urse
Vis
itC
linic
Coo
rdin
.N
on-C
linic
Dep
artm
ent
Med
siD
icta
tion
Res
earc
hIn
-Pat
ient
Trav
elB
reak
sO
ther
Car
eA
sses
s.I
Ed.
Vis
itW
/A
ttend
ing
/Com
m.
Com
m.
Proc
ed.
TEA
M1
‘,,
Gas
troe
nter
olog
y27
.3%
6.4%
9.8%
24.6
%2.
8%16
.8%
1.1%
6.6%
0.0%
0.2%
2.3°
/o0.
3°/o
1.7%
Infu
sion
2.0%
25.0
%22
.0%
3.0%
2.0%
31.0
%6.
0%0.
0%1.
0%0.
0%0.
0%1.
0%7.
0%
Nep
hroi
ogy
61.2
%7.
2%5.
2%2.
8%7.
8%3.
5%5.
7%0.
0%5.
1%0.
0%1.
2%0.
3%0.
0%
Tea
mlW
eigh
tedP
erce
ntag
e43
.1%
8.3%
8.4%
11.4
%5.
4%10
.9%
3.9%
2.6%
2.7%
0.1%
1.5%
0.4%
1.2%
TE
AM
2:‘
:‘*
1
Neo
nato
logy
6.9%
11.0
%2.
8%0.
7%10
.3%
26.2
%22
.8%
0.0%
1.4%
1.4%
7.6%
0.0%
9.0%
Neu
rolo
gy61
.4%
3.5%
4.9%
3.9%
2.7%
4.7%
14.2
%0.
6%0.
9%0.
4%1.
2%0.
0%1.
5%
Tea
m2W
eigh
tedP
erce
ntag
e50
.8%
4.9%
4.5%
3.3%
4.2%
8.9%
15.9
%0.
5%1.
0%0.
6%2.
4%0.
0%3.
0%
TEA
M3
End
ocri
nolo
gy18
.4%
6.7%
3.8%
11.1
%9.
2%13
.2%
12.9
%1.
2%1.
5%11
.2%
4.7%
1.9%
4.1%
Pulm
onar
y26
.8%
8.3%
3.4%
0.0%
1.2%
17.1
%10
.4%
0.1%
18.2
%0.
4%0.
9%0.
7%12
.3%
Infu
sion
3.1%
11.6
%16
.3%
0.0%
0.8%
42.6
%15
.5%
0.0%
3.9%
0.0%
5.4%
0.8%
0.0%
Tea
m3W
eigh
tedP
erce
ntag
e21
.0%
8.2%
5.2%
3.7%
3.8%
19.1
%11
.9%
0.5%
10,9
%3.
9%2.
7%1.
1%8.
0%
Ped
sPer
cent
age
34.5
%7.
5%5.
9%5.
8%4.
3%14
.3%
10.5
%1.
1%6.
2%2.
0%2.
3%0.
6%4.
9%
By
Nur
sing
Lev
el:
Phon
ePa
tient
His
tory
lT
reat
iIn
dep.
Nur
seN
urse
Vis
itC
linic
Coo
rdin
.N
on-C
linic
Dep
artm
ent
.D
Icta
tion
Res
earc
hIn
-Pat
ient
Trav
elB
reak
sO
ther
Car
eA
sses
s./E
d.M
eds.
IV
isit
w/A
ttend
ing
/Com
m.
Com
m.
CN
I54
.0%
5.1%
6.6%
8.1%
1.0%
18.2
%1.
5%0.
0%0.
0%0.
0%2.
0%1.
0%2.
5%
CN
II45
.8%
7.9%
8.0%
1.0%
0.4%
15.9
%16
.6%
0.0%
1.2%
0.3%
1.8%
0.3%
0.8%
CN
III10
.9%
5.2%
2.6%
0.2%
5.1%
20.9
%11
.6%
0.0%
26.5
%6.
3%4.
3%0.
0%6.
5%
CN
S15
.5%
7.7%
7.5%
15.3
%5.
3%17
.5%
8.6%
4.2%
2.1%
4.3%
1.7%
0.3%
10.0
%
CC
C42
.9%
8.8%
5.9%
3.1%
4.2%
11.3
%9.
3%0.
7%1.
4%0.
7%2.
1%0.
9%8.
7%
PN
P47
.0%
7.8%
5.3%
9.4%
7.6%
6.8%
8.0%
0.9%
3.8%
0.0%
1.9%
1.5%
0.0%
Sou
rce:
Wor
kloa
dM
easu
rem
ent
Stu
dyR
awD
ata
She
etC
olle
cted
2/16
/98
-3/
27/9
8
wei
ghte
dby
FTE
A-i

fl
E—
r—i
(DL
:.
——
——
jn
Wor
kloa
dM
easu
rem
ent
Stud
ySu
mm
ary
4/5/
98FT
EB
reak
out
By
Act
ivit
yB
yT
eam
:P
atie
nt
.T
reat
iIn
dep.
Cli
nic
Phone
His
tory
!N
urs
eV
isit
.N
on-C
lini
cD
epar
tmen
tM
edJ
Nurs
eC
oo
rdin
.D
icta
tion
Res
earc
hIn
-Pat
ient
Tra
vel
Bre
aks
Oth
erT
otal
Car
eA
sses
s./
..
W/A
tten
din
gC
omm
.
Ed.
Pro
ced.
Vis
it/C
omm
.
TEA
M1
Gas
troen
tero
iog
y0.
410.
100.
150.
370.
040.
250.
020.
100.
000.
000.
030.
010.
031.
50
infu
sion
0.01
0.08
0.07
0.01
0.01
0.09
0.02
0.00
0.00
0.00
0.00
0.00
0.02
0.30
Nep
hro
iogy
1.22
0.14
0.10
0.06
0.16
0.07
0.11
0.00
0.10
0.00
0.02
0.01
000
2.00
Tot
al1.
640.
320.
320.
430.
200.
420.
150.
100.
100.
000.
060.
010.
053.
80
TEA
M2
.
Neo
nat
oio
gy
0.04
0.07
0.02
0.00
0.06
0.16
0.14
0.00
0.01
0.01
0.05
0.00
0.05
0.60
Neu
rolo
gy1.
530.
090.
120.
100.
070.
120.
360.
020.
020.
010.
030.
000.
042.
50
Tot
al1.
580.
150.
140.
100.
130.
280.
490.
020.
030.
020.
080.
000.
093.
10
TEA
MS
En
do
crin
olo
gy
0.38
0.14
0.08
0.23
0.19
0.27
0.27
0.03
0.03
0.23
0.10
0.04
0.09
2.05
Pulm
onar
y0.
910.
280.
120.
000.
040.
580.
350.
000.
620.
010.
030.
020.
423.
38
Infu
sion
0.02
0.09
0.13
0.00
0.01
0.34
0.12
0.00
0.03
0.00
0.04
0.01
0.00
0.80
Tot
al1.
310.
510.
320.
230.
241.
190.
740.
030.
680.
240.
170.
070.
506.
23
Ped
sTota
i4.
520.
980.
780.
760.
571.
881.
380.
140.
810.
270.
300.
080.
6413
.13
By
Nurs
ing
Lev
elP
atie
nt
.T
reat
.!In
dep.
..
Cli
nic
Phone
His
tory
!N
urs
eV
isit
.N
on-C
iini
cD
epar
tmen
tM
ed.!
Nu
rse
.C
oord
in.
Dic
tati
onR
esea
rch
In-P
atie
nt
Tra
vel
Bre
aks
Oth
erT
otal
Car
eA
sses
s.!
..
W/A
tten
din
gC
omm
.E
d.P
roce
d.
Vis
it/C
omm
.
CN
I0.
270.
030.
030.
040.
010.
090.
010.
000.
000.
000.
010.
01(1
010.
50
CN
II1.
260.
220.
220.
030.
010.
440.
460.
000.
030.
010.
050.
010.
022.
75
CN
III0.
240.
120.
060.
000.
110.
470.
260.
000.
590.
140.
100.
000.
142.
23
CN
S0.
370.
180.
180.
360.
120.
410.
200.
100.
050.
100.
040.
010.
242.
35
CC
C1.
110.
230.
150.
080.
110.
290.
240.
020.
040.
020.
050.
020.
232.
60
PN
P1.
270.
210.
140.
250.
210.
180.
210.
030.
100.
000.
050.
040.
002.
70
Sou
rce:
Wor
kloa
dM
easu
rem
ent
Stu
dyR
awD
ata
Sh
eet
Col
lect
ed:
2/16
/98
-3/
27/9
8
A-2

Ph
on
eL
ogS
un..
.ary
Ave
rage
Num
ber
ofP
hone
Cal
lspe
rD
ay
By
Tea
m:
4/1/
98
Div
isio
nal
Tt
I.
Ph
arm
acy
Voi
ceC
ase
Gen
eral
Wei
ghte
dD
epar
tmen
tS
ched
uli
ng
Tes
tR
esu
lts
.S
ym
pto
m.
..
.P
erso
nal
Oth
erD
ivis
iona
lR
efil
lsM
ail/
Pag
ing
Co
ord
inat
ion
Wor
kA
ver
agel
FT
Es
Day
TEA
M1
.
Gas
troen
tero
log
y4.
92.
41.
36.
40.
24.
90.
30.
01.
221
.51.
5
Infu
sion
0.2
0.0
1.1
0.1
1.1
0.5
1.8
0.2
0.7
5.5
0.3
Nep
hrol
ogy
2.1
11.4
5.6
7.4
0.6
35.0
4.0
0.0
5.9
72.1
2
team
1W
eig
hte
dA
vera
ge7.
113
.87.
913
.91.
840
.46.
10.
27.
83,
8
Tea
m1
Per
centa
ge
7.2%
14.0
%8.
0%14
.0%
1.8%
40.8
%6.
2%0.
2%7.
9%
!E..
U2
,
,
.A
’LN
eon
ato
log
y0.
70.
00,
50.
11.
61.
91.
20.
50.
26.
70.
6
Neu
rolo
gy0.
36.
57.
516
.40.
310
.80.
90.
08.
751
.42.
5
Tea
m2W
eighte
dA
ver
age
1.0
6.5
8.0
16.5
1.8
12.7
2.1
0.5
9.0
3.1
Tea
m2P
erce
nta
ge
1.7%
11.2
%13
.8%
28.3
%3.
2%21
.9%
3.6%
0.8%
15.4
%
Th
ÔM
L. .
“
En
do
crin
olo
gy
7.0
0.3
1.6
4.6
0.4
2.3
2.6
0.2
0.8
19.6
2.05
Pul
mon
ary
4.3
1.6
8.0
15.3
17.1
12.9
5.6
0.2
3.6
68.5
3.38
Infu
sion
0.0
0.3
0.3
0.0
0.5
2.1
5.1
0.0
0.0
8.3
0.8
Tea
m3W
elghte
dA
ver
age
11.3
2.1
9.8
19.8
18.0
17.2
13.3
0.4
4.4
6.23
Tea
m3P
erce
nta
ge
11.7
%2.
2%10
.2%
20.6
%18
.7%
17.9
%13
.8%
0.4%
4,5%
Ped
sWei
ghte
dA
ver
age
19
.422
.525
.750
.221
.670
.421
.51.
121
.2
Ped
sPer
cen
tag
e7.
7%8.
9%10
.1%
19.8
%8.
5%27
.8%
8.5%
0.4%
8.3%
3.1
3
By
Nur
sing
Lev
el:
Nu
rsin
gL
evel
Tot
al.
Ph
arm
acy
VoI
ceC
ase
Gen
eral
Dep
artm
ent
Sch
eduli
ng
Tes
tR
esu
lts
.S
ym
pto
m.
.P
erso
nal
Oth
erW
eigh
ted
Nur
sing
Ref
ills
Mai
l/P
agin
gC
oo
rdin
atio
nW
ork
Ave
rage
/L
evel
FTE
sD
ay
CN
lWei
ghte
dAve
rage
*3.
72.
00.
82.
60.
21.
40.
00.
01.
211.7
0.5
CN
lPer
cen
tag
e31
,2%
17.1
%6.
4%21
.8%
1.3%
12.0
%0.
0%0.
0%10
.3%
CN
llW
eig
hte
dA
ver
age
0.2
1.5
3.3
5.8
1.6
5.0
6.9
0.2
2.3
26.8
2.75
CN
llP
erce
nta
ge
0.9%
5.5%
12.2
%21
.7%
5.9%
18.6
%25
.6%
0.8%
8.7%
CN
lllW
eig
hte
dA
ver
age
0.7
0.0
0.5
0.1
1.6
1.9
1.2
0.5
0.2
6.7
2.23
CN
illP
erce
nta
ge
10.7
%0.
0%7.1
%1.
8%23
.2%
28.6
%17.9
°h7.
1%3.
6%
CN
SW
eighte
dA
ver
age’
8.9
0.6
1.1
6.2
3.3
9,5
1.3
0.0
3.4
34.1
2.35
CN
SP
erce
nta
ge
26.0
%1.
8%3.
2%18
.1%
9.5%
27.7
%3.
8%0.
0%9.8
%
CCC
Wei
ghte
dAve
rage
3.4
3.3
9.4
16.0
14.1
15.0
6.1
0.2
2.1
69.8
2.6
CC
CPe
rcen
tage
4.9%
4.8%
13.5
%23
.0%
20.3
%21
.5%
8.8%
0.3%
3.0%
PN
PW
eig
hte
dA
ver
ego
2.5
11.7
6.5
11.1
0.9
36.1
5.9
0.2
6.1
81.1
2.7
PN
PP
erce
nta
ge
3.1
%14.4
%8.
1%13
.7%
1.1%
44.5
%7.
3%0.
2%7.
5%
Sou
rce:
Pho
neL
ogS
tudy
Raw
Dat
aS
heet
Col
lect
ed:
2/10
/98
-3/
20/9
8
wei
ghte
dby
Full
Tim
eE
quiv
alen
t(F
TE
)A
-3

_
—
JC
ED
C
_
.1.
-.J
Th
—fl
—
By
Tea
m:
Pho
neLo
gSu
mm
ary
Wei
ghte
dA
vera
geL
engt
hof
Ph
on
eC
alls
Per
Day
4/8/
98
Ph
arm
acy
Voi
ceC
ase
Gen
eral
Dep
artm
ent
Sch
eduli
ng
Tes
tR
esult
sS
ym
pto
m.
Per
sonal
Oth
erR
efil
lsM
aill
Pag
ing
Coord
inat
ion
Wor
k
TEA
MI
‘‘
s
Gas
tro
ente
rolo
gy
2.7
2.1
2.1
4.0
1.0
4.0
12.5
-8.
0
Infu
sion
1.0
-1.
90.
51.
10.
81.
11.
31.
8
Nep
hrol
ogy
1.8
3.7
2.4
5.0
1.2
2.9
1.6
-2.
0
Tea
m1
Wei
gh
ted
Av
erag
e1.
82.
92.
23.
21.
12.
65.
11.3
4.0
Sta
nd
ardD
evia
tionB
etw
eenD
ivis
ions
0.88
1.16
0.25
2.35
0.08
1.59
6.44
0.00
3.5
1
TE
AII
2.
.
.;rc
Neo
nat
olo
gy
2.8
-1.
83.
01.
24.
82.
13.
51.
0
Neu
rolo
gy2.
01.
61.
43.
52.
51.
63.
6-
1.8
Tea
m2W
eighte
dA
ver
age
2.4
1.6
1.6
3.2
1.9
3.2
2.8
3.5
1.4
Sta
nd
ardD
evia
tionB
etw
eenD
lvls
lons
0.59
0.00
0.21
0.33
0.92
2.23
1.01
0.00
0.55
TEA
M3
En
do
crin
olo
gy
4.4
4.5
1.1
2.2
3.8
1.1
1.5
1.0
0.8
Pu
lmon
ary
1.4
1.3
2.4
2.7
0.5
1.6
1.2
2.5
1.0
Infu
sion
-10
.05.
0-
1.0
6.1
4.4
--
Tea
m3
Wei
gh
ted
Av
erag
e*2.
95.
32.
82.
51.
72.
92.
41.
80.
9
Sta
ndar
dD
evia
tionB
etw
eenD
ivis
ions
2.0
94.
391.
980.
331.
752.
741.
771.
060.
17
Ped
sWei
ghte
dA
ver
age
2.3
3.9
2.3
3.0
1.5
2.9
3.5
2.1
2.4
Sta
nd
ardD
evia
tionB
etw
eenD
ivis
ions
1.13
3.25
1.19
1.42
1.07
1.91
3.82
1.14
2.54
By
Nur
sing
Lev
el:
.P
har
mac
yV
oice
Cas
eG
ener
alD
epar
tmen
tS
ched
uli
ng
Tes
tR
esu
lts
Sym
pto
m.
.P
erso
nal
Oth
erR
efil
lsM
all/
Pag
Ing
Co
ord
inat
ion
Wor
k
CN
lWei
ghte
dAve
rage
4.1
3.5
1.9
3.8
1.0
1.7
--
8.0
Sla
nd
ard
Dev
iati
on
wit
hin
Lev
el0.
000.
000.
000.
000.
000.
000.
000.
000.
00
CN
llW
eig
hte
dA
ver
age*
0.8
4.6
2.6
3.1
1.0
2.3
2.2
1.3
2.2
Sta
ndar
dD
evia
tion
wit
hin
Lev
el0.
24.
81.
62.
30.
02.
61.
90.
001.
6
CN
lllW
eighte
dA
ver
age
2.8
-1.
83.
01.
24.
82.
13.
51.
0
Sta
nd
ard
Dev
iati
on
wit
hln
Lev
el0
.00
0.0
00.
000.
000.0
00.0
00.0
00.0
00.0
0
CN
SWei
ghte
dAve
rage
3.5
0.6
1.5
1.7
0.2
2.6
4.4
-1.
7
Sta
nd
ard
Dev
lati
on
wit
hin
Lev
el4.
20.
11.
22.
20.
003.1
7.0
0.00
0.7
CC
CW
eig
hte
dA
ver
age
2.7
1.5
1.8
3.1
1.3
2.3
3.2
2.5
0.5
Sta
nd
ard
Dev
iati
on
wit
hin
Lev
el0
.91.
41.
01.
61.
11.
92.4
0.00
0.3
PN
PW
eighte
dA
ver
age
1.3
4.0
2.2
4.6
2.5
2.3
1.9
1.0
1.5
Sta
nd
ard
Dev
latl
on
wit
hin
Lev
el0.
93.
31.
43.
51.
81.4
0.7
0.00
1.3
Sou
ice:
Pho
neL
ogS
tudy
Raw
Dat
aS
heet
Col
lect
ed:
2/10
/98
.3/
27/9
8
woi
ghte
dby
volu
me
ofca
lls
per
pers
on
A-4
flfl
EE
EE
flF
Efl
—.,.
EE
Dfl
Th
Pho
neLo
gSu
mm
ary
4/1/
98
Wei
ghte
dA
vera
geP
hone
Cal
lsE
ach
Hou
rP
erD
ay
By
Tea
m: Dep
artm
ent
8:00
-9:
009
:00
-10
:00
10:0
0-
11:0
011
:00-
12:0
012
:00
-1:
001:
00-
2:00
2:00
-3:
003:
00-
4:00
4:00
-5:
005:
00-
6:00
Div
isio
nA
vera
ge?
Day
TEAM
1-
.J
.
Gas
troen
tero
lgy
1.1
2.0
3.3
3.1
3.0
5.6
4.1
3.9
6.1
2.2
34.3
Infu
sion
1.0
2.3
1.3
0.5
1.4
0.2
0.2
0.2
0.0
0.3
7.4
Nep
hrol
ogy
7.4
7.2
6.4
6.0
7.3
8.3
9.1
6.5
9.2
4.8
72.1
Tea
m1
Wei
ghte
dA
vera
ge’
9.5
11.4
11.0
9.5
11.6
14.1
13.3
10.6
15.3
7.3
Per
centa
ge
8.4%
10.1
%9.
7%8.
4%10
.2%
12.4
%11
.7%
9.3%
13.5
%6.
4%
TE
AM
2..:..
jm:
......
,
Neo
nato
logy
1.3
0.6
1.0
0.1
0.5
1.3
0.5
1.1
0.4
0.0
6.7
Neu
rolo
gy3.
15.
79.
310
.46.
86.
35.
45.
85.
20.
158
.2
Tea
m2
Wel
ghte
dA
ver
ag&
4.4
6.3
10.3
10.5
7.3
7.7
5.9
6.9
5.5
0.1
Per
centa
ge
6.8%
9.8%
15.8
%16
.2%
11.3
%11
.8%
9.1%
10.6
%8.
5%0.
2%
T.M
3.-
..
..,
En
do
crin
olo
gy
2.2
4.7
2.9
4.1
1.5
1.7
1.3
1.0
1,7
0.0
21.1
Pul
mon
ary
4.6
11.8
10.3
11.8
5.4
9.3
7.0
5.1
5.8
0.3
71.4
Infu
sion
0.5
0.5
1.1
0.3
1.3
1.3
1.1
1.9
0.3
0.0
8.3
Tea
m3
Wei
ghte
dA
ver
age’
7.3
17.0
14.3
16.2
8.2
12.4
9.4
8.0
7.8
0.3
Per
centa
ge
7.8%
18.2
%15
.3%
17.3
%8.
8%13
.2%
10.1
%8.
6%8.
3%0.
3%
Ped
sWei
ghte
dA
ver
age’
21.3
34.8
35.5
36.2
27.2
34.1
28.6
25.4
28.7
7.6
Ped
sPer
centa
ge
7.6%
12.4
%12
.7%
13.0
%9.
7%12
.2%
10.2
%9.
1%10
.3%
2.7%
By
Nur
sing
Lev
el:
,
Nur
sing
Lev
el
Dep
artm
ent
8:00
-9:
009:
00-
10:0
010
:00
-11
:00
11:0
0-12
:00
12:0
0-
1:00
1:00
-2:
002:0
0-
3:00
3:00
-4:
004:
00-
5:00
5:00
-6:
00W
eigh
ted
Ave
rage
?D
ay
CN
lWei
ghte
dAve
rage
’0.
00.
12.
22.
22.
14.
73.
73.
65.
50.
424
.5
CN
lPer
centa
ge
0.0%
0.4%
9.0%
9.0%
8.6%
19.2
%15
.1%
14.7
%22
.4%
1.6%
CN
IIW
eigh
ted
Ave
rage
’4.
57.
17.
46.
56.
26.
76.
06.
04.
70.
355
.3
CN
llP
erce
nta
ge
8.2%
12.9
%13
.3%
11.8
%11
.3%
12.0
%10
.9%
10.8
%8.
4%0.
5%
CN
lllW
eighte
dA
ver
age
1.3
0.6
1.0
0.1
0.5
1.3
0.5
1.1
0.4
0.0
6.7
CN
UIP
erce
nta
ge
19.6
%8.
9%14
.3%
1.8%
7.1%
19.6
%7.
1%16
.1%
5.4%
0.0%
CN
SW
eig
hte
dA
ver
age’
3.1
8.3
6.3
3.7
1.5
3.4
1,8
1.9
3.2
2.0
35.2
CN
SP
erce
nta
ge
8.9%
23.5
%18
.0%
10.6
%4.
2%9.
7%5.
0%5.
3%9.
2%5.
7%
CC
CW
eigh
ted
Av
erag
e’4.
79.
210
.615
.48.
78.
46.
96.
25.
00.
175
.3
CcC
Per
centa
ge
6.2%
12.2
%14
.1%
20.5
%11
.6%
11.2
%9.
2%8.
3%6.
6%0.
1%
PNP
Wei
ghte
dA
vera
ge’
7.6
9.5
8.1
8.3
8.2
9.6
9.8
6.7
9.9
4.8
82.4
PN
PP
.rc.n
t.g.
9.2%
11.5
%9.
8%10
.0%
9.9%
11.7
%11
.8%
8.1%
12.0
%5.
8%
Sou
rce.
Pho
neL
ogS
tudy
Raw
Dat
aS
heet
Col
lect
ed.
2110
/98
-3/
27/9
8
wei
ghte
dby
days
per
wee
kw
orke
d(O
utof
Sda
ys)

flfl
,1.
fin
nfl
..
n—
.,
n=
.:E
F.
fin
.!
.—
By
Tea
m:
Pho
neLo
gSu
mm
ary
Wei
ghte
dA
vera
geN
umbe
rof
Cal
lsT
o!F
rom
Who
mP
erD
a4/
3/98
Div
isio
nal
Dep
artm
ent
Patie
ntlP
aren
tPh
ysic
ian
Phar
mac
ist
Lab
orat
ory
Pagi
ngN
oice
Mai
lN
urse
Secr
:tarY
/Sc
hool
Oth
er
Day
TEA
M1
..
..
.
Gas
troe
nter
olog
y20
.64.
21.
10.
31.
23.
70.
50,
32.
334
.1In
fusi
on0.
00.
61.
30.
41.
40.
81.
80.
01.
17.
4N
ephr
olog
y38
.58.
04.
94.
20.
62.
67.
20.
25.
871
.9T
eam
lWei
ghte
dAve
rage
*59
.112
.77.
34.
93.
27.
19.
50.
59.
111
3.3
Team
1Pe
rcen
tage
52.2
%11
.2%
6.5%
4.3%
2.8%
6.2%
8.3%
0.4%
8.1%
.
Neo
nato
logy
1.1
0.2
0.4
0.0
1.6
0.5
1.0
0.1
1.9
6.7
Neu
rolo
gy35
.91.
53.
82.
00.
03.
00.
60.
310
.157
.2
Tea
m2W
eigh
tedA
vera
ge37
.01.
74.
22.
01.
63.
51.
50.
412
.063
.9T
eam
2Per
cent
age
57.9
%2.
7%6.
6%3.
2%2.
4%5.
5%2.
4%0.
6%18
.8%
TEA
M3
End
ocri
nolo
gy11
.61.
41.
90.
10.
40.
52.
20.
22.
420
.7Pu
lmon
ary
22.4
12.4
5.8
1.8
11.9
1.8
3.6
0.2
11.2
71.0
Infu
sion
3.2
1.1
0.8
0.8
0.3
0.8
0.0
0.0
1.3
8.3
Tea
m3W
ight
edA
vera
ge*
37.2
14.9
8.5
2.7
12.5
3.1
5.8
0.4
14.9
100.
0T
eam
3Per
cent
age
37.2
%14
.9%
8.5%
2.7%
12.5
%3.
1%5.
8%0.
4%14
.9%
Peds
Wei
ghte
dAve
rage
*13
3.3
29.3
20.0
9.7
17.3
13.6
16.8
1.3
36.0
277.
2Pe
dsPe
rcen
tage
48.1
%10
.6%
7.2%
3.5%
6.2%
4.9%
6.0%
0.5%
13.0
%
By
Nur
sing
Lev
el:
Nur
sing
Leve
lD
epar
tmen
tPa
tient
lPar
ent
Phys
icia
nPh
arm
acis
tL
abor
ator
yPa
ging
Noi
ceM
ail
Nur
seec
rear
ySc
hool
Oth
erW
eigh
ted
Ave
rage
lD
ayC
NIA
vera
ge14
.61.
90.
60.
21.
23.
30.
50.
02.
024
.3C
NI
Per
centa
ge
60.1
%7.
8%2.
5%0.
8%4.
9%13
.6%
2.1%
0.0%
8.2%
CN
IIA
vera
ge26
.92.
64.
62.
81.
72.
91.
80.
311
.154
.7C
NII
Per
centa
ge
49.2
%4.
8%8.
4%5.
1%3.
0%5.
4%3.
3%0.
5%20
.2°/
aC
NIll
Ave
rage
1.1
0.2
0.4
0.0
1.6
0.5
1.0
0.1
1.9
6.7
CN
IllP
erce
nta
ge
16.1
%3.
6%5.
4%0.
0%23
.2%
7.1%
14.3
%1.
8%28
.6%
CN
SA
vera
ge15
.38.
51.
41.
50.
31.
62.
00.
53.
634
.6C
NS
Per
centa
ge
44.2
%24
.7%
4.0%
4.2%
.0.
8%4.
8%5.
8%1.
3%10
.4%
CC
CA
vera
ge32
.07.
96.
90.
911
.62.
43.
30.
29.
774
.8C
CC
Per
centa
ge
42.7
%10
.5%
9.2%
1.2%
15.5
%3.
1%4.
5%0.
3%12
.9%
PN
PA
vera
ge43
.58.
26.
24.
31.
02.
98.
20.
27.
082
.2P
NP
Per
centa
ge
52.9
%9.
9%7.
6%5.
2%1.
2%3.
5%9.
9%0.
2%9.
5%
EED
EE
ED
ffl
FED
EE
]E
D-
_fl
By
Tea
m:
Pho
neLo
gSu
mm
ary
Fre
quen
cyan
dP
erce
nt
of
Cal
lR
ou
tin
gan
dF
ollo
w-U
pP
erD
ay4/
3/98
Aver
age
Volu
mes
%B
reak
out
Req
uir
ing
Req
uir
ing
Fol
low
-In
com
ing
Route
dD
epar
tmen
tIn
com
ing
Cal
lsO
utg
oin
gC
alls
Route
dC
orr
ectl
yO
utg
oin
gC
alls
Fol
low
-Up
Up
Cal
lsC
orre
ctly
TEA
M1
Gas
troen
tero
log
y17
.25.
928
.233
.750
%17
%83
%99
%
Infu
sion
1.2
2.7
4.7
7.0
16%
36%
64%
95%
Nep
hro
log
y14
.711
.160
.972
.120
%15
%85
%10
0%
Tea
m1
Wei
ghte
dA
ver
age*
33.1
19.8
93.9
112.
729
%23
%77
%98
%
TE
AM
2•‘
.
Neo
nat
olo
gy
1.2
1.0
5.8
6.7
18%
14%
86%
100°
/o
Neu
rolo
gy
21.7
15.3
42.1
57.5
38%
27%
73%
100%
Tea
m2W
eighte
dA
ver
age
22.9
16.3
47.9
64.2
28%
20%
80%
100%
iE
ndocr
inolo
gy
6.3
6.9
13.8
20.0
30%
33%
67%
97%
Pulm
onar
y43
.514
.058
.570
.760
%19
%81
%98
%
Infu
sIon
0.8
1.6
6.7
8.0
10%
19%
81%
97%
Tea
m3
Wei
ghte
dA
vera
ge*
50.6
22.5
78.9
98.7
33%
24%
76%
97%
Ped
sWei
ghte
dA
ver
age*
106.
758
.622
0.7
275.
630
%23
%77
%98
%
By
Nurs
ing
Lev
el:
Ave
raci
eV
olu
mes
%B
reak
out
Req
uir
ing
..
Req
uiri
ngF
ollo
w-
Inco
min
gR
oute
dD
epar
tmen
tIn
com
ing
Cal
lsO
utg
oin
gC
alls
Route
dC
orr
ectl
yO
utg
oin
gC
alls
Fol
low
-Up
Up
Cal
lsC
orre
ctly
CN
I12
.84.
819
.624
.452
%20
%80
%10
0%
CN
II17
.516
.838
.154
.232
%31
%69
%99
%
CN
III1.
21.
05.
86.
718
%14
%86
%10
0%
CN
S10
.07.
728
.233
.928
%21
%79
%94
%
CC
C44
.914
.061
.074
.560
%19
%81
%99
%
PN
P21
.615
.369
.784
.325
%18
%82
%99
%
Sou
rce:
Pho
neL
ogS
tudy
Raw
Dat
aS
hee
tC
olle
cted
:((
iit
S
2/10
/98
.3/
27/9
8

——
——
—
__
__
——
fl
——
—-
‘ci
‘ci
1

nterview Findings vs. Data Findings
Department % Clinical Activities % Phone Care
Estimated Calculated Estimated Calculated
TEAM 1
Gastroenterology
Ronna Fogle 50% 39% 50% 11%Diane Kemp 90% 71% 19% 14%
70% 55% 35% 13%Infusion
Jennifer Steiner 50% 83% 10% 2%50% 83%
Nephroiogy
Cathy Brown 30% 23% 70% 68%Brenda Pontillo 25% 30% 75% 55%
28% 27% 73% 62%TEAM 2 4 - -
Neonatology
Anne latrow 33% 51% 25% 7%33% 51% 25% 7%
Neurology
Sue Armstrong 70% 47% 64% 36%Ann Marker 0% 7% 100% 80%Helen Murrel 100% 4% 88% 71%
57% 19% 84% 62%. .:r . .
TAM3: fEndocrinology
Kathy Clark 65% 66% 15% 7%Margy Fox 33% 39% 56% 21%Denise Garden 24% 27% 45% 27%
41% 44% 39% 18%Pulmonary
Phyllis Askew 19% 8% 29% 64%Julie Konkle 65% 51% 40% 23%Nancy Mcintosh 40% 41% 40% 13%Ermalinda Sakmar 40% 28% 0% 0%
41% 32% 27% 25%Infusion
Patricia Delameilleure 90% 71% 5% 3%nno/ 710/ ‘DO!7’J/O I I/O .J/O
*lnfusion time is included in clinical percentages.
LL
B-i

Pediatric Nursing Staff General Information
ScheduleName Level Clinic FTE Monday Tuesday Wednesday Thursday Friday
TEAM1Brown, Cathy PNP Nephrology 1.00 4 C 4 C 4 0 4 C 4 C
40 40 4C 40 40Fogle, Ronna CN I Gastroenterology 0.50 6 0 4 C ems 4 0 6 0 60
40 4CcmsKemp, Diane CNS Gastroenterology 1.00 8 0 8 C 4 0 4 0 4 0
4C 4C 4CPontillo, Brenda PNP Nephrology 1.00 4 C 4 C 4 C 4 C 4 C
40 40 40 40 40Steiner, Jennifer CN II Infusion 0.30 4 I off 8 I off off
4 off 4/mo._emsTEAM2Armstrong, Sue CCC Neurology 0.85 6 0 8 C 6 0 8 C 4 C
20latrow, Anne CN Ill Neonatology 0.60 off 8 0 4 0 off 8 0
4CMarker, Ann CN II Neurology 0.65 8 0 off 8 0
50 50Murrel, Helen CN II Neurology 1.00 8 0 8 0 8 0 8 0 8 0
••
Askew, Phyllis CCC Pulmonary 1.00 8 0 8 0 4 C 4 0 8040 4C
Clark, Kathy PNP Endocrinology 0.70 4 C 6 0 8 C off 8 C20
Delameilleure, Patricia CN II Infusion 0.80 4 C 8 I off 8 I 8 I41
Fox, Margy CNS Endocrinology 0.60 8 C off 8 diab. off 1 ems0,H 70,H
Garden, Denise CN III Endocrinology 0.75 8 C 8 0 off 8 0 2-3 04 Ed.
Konkle, Julie CCC Pulmonary 0.75 8 0 off 6 C 4 0 4 C20 4C 20
McIntosh, Nancy CNS Pulmonary 0.75 8 0 8 0 4 C 6 0 off40
Sakmar, Ermelinda CN III Pulmonary 0.88 8 Res. 8 Res. 9.2 C 4 Res. 6 C40
KEY: CN I = Clinical Nurse 1 0 = OfficeCN II = Clinical Nurse 2 C = ClinicCN III = Clinical Nurse 3 Res. = ResearchCNS = Clinical Nurse Specialist Ed. = EducationCCC = Clinical Care Coordinator I = InfusionPNP = Pediatric Nurse Practitioner H = Hospital
[1LLL

Pho
neL
ogvs
.W
orkl
oad
Pho
neC
are
4/10
/98
FTE
Tot
als
Dep
artm
ent
Tot
alFT
E’s
Pho
neL
ogFT
E’s
Wor
kloa
dP
hone
FTE
’s::
TE
AM
1.
Gas
troen
tero
logy
1.50
0.31
0.41
Infu
sion
0.30
0.00
0.01
Nep
hrol
ogy
2.00
0.77
1.22
Tea
m1
Tot
al3.
801.
081.
64
TE
AM
2.
:j
Neo
nato
logy
0.60
0.02
0.04
Neu
rolo
gy2.
500.
601.
53
Tea
m2T
ota
l3.
100.
621.
58
TE
AM
4N
’
End
ocri
nolo
gy2.
050.
190.
38
Pul
mon
ary
3.38
0.79
0.91
Infu
sion
0.80
0.07
0.02
Tea
m3
Tot
al6.
231.
051.
31
Ped
iatr
ics
13.1
32.
764.
52
Sou
rce:
Pho
neL
ogS
tudy
Raw
Dat
aS
hee
tC
olle
cted
:2/
10/9
8-
3/27
/98
B-3
Annualized FTE’s per VisitBased on Projected Visits from July 1997 to June 1998
Phone Care
# Nursing
Division # FTEs Visits/ Year Minutes/ Patient
Gastroenterology 0.41 2816 18.2Nephrology 1.22 2987 51.0Neonatology 0.04 290 17.2Neurology 1.53 3279 58.2Endocrinology 0.38 3642 13.0Pulmonary 0.91 2388 47.6
Clinical Activities (Not including Phone Care)
# Nursing
Division # FTEs Visits! Year Minutes! Patient
Gastroenterology 0.66 2816 29.3Nephrology 0.46 2987 19.2Neonatology 0.15 290 64.6Neurology 0.38 3279 14.5Endocrinology 0.64 3642 21.9Pulmonary 0.44 2388 23.0
*CIinicaI activities include:
Patient History! Assessment! Education
Treatment! Medication/ Procedures
Independent Nurse Visit
Nurse Visit with Attending
* The following divisions were not included:
Biochem Genetics
Infectious Diseases
Ado!escent
Behavioral
Consult
Psychology
Genetics
Myelodysplasia
Rheumatology
B4

Appendix C

irsing Vorlload Data Collection Detinitions
Phone Care: Time spent on the phone, preparation before the call, and documentationfollowing the call. Phone call may be with patient, physician, pharmacist.etc., regarding patient care.
Patient History! Assessment! Education: Documentation or discussion regarding thehistory, assessment, and education of the patient. excluding phone care.This may include interaction with the patient. physician, nurses. etc.
Treatment! Medication! Procedures: Administering, documenting, or discussingpatient treatment, medication, and procedures. excluding phone care. Thismay include interaction with the patient. physician, nurses. etc.
Independent Nurse Visit: All activities related to an independent nurse visit. Forexample: preparation, the visit, and post-visit documentation. Thisexcludes phone care.
Nurse Visit with Attending: All activities related to a nurse visit with an attending. Forexample: preparation, the visit, and post-visit documentation. Thisexcludes phone care.
Clinic Coordination! Communication: Activities related to maintaining the flow of theclinic. These activities include: clinic related communication (verbal,email, faxes, written letters), scheduling, rescheduling, physiciancoordination, tracking charts/labs, etc. Excluding dictation.
Non-Clinic Communication: All communication regarding non-clinical activities.Communication may be in the forms of verbal, email, faxes, written letters,etc.
Dictation: Self-explanatory.
Research: All activities related to research projects including related communication.
Tn-Patient: All activities related to in-patient care.
Travel: Time spent traveling from one location to another. For example: traveling
from the office to the Taubrnan Center.
Breaks: Time spent on break excluding lunch.
Other: All activities which are not defined above. Please list the activity in the
appropriate location on the data sheet.

Nursing Workload Data Collection
‘lame:______________________________ Time Begin:_________________
rite: Time End:_____________________
Lunch Begin:__________________
Lunch End:__________________
ease collect this information for 1 week. When the beeper sounds, make a hash mark under the frequency column
oorresponding to the activity you are currently performing. Thank you for your cooperation.
Direct Patient Carehone Care
. atient History! Assessment! Education
reatment! Medication! Procedures
‘9dependent Nurse Visit
Nurse Visit with Attending
nic Coordination/Communication
Jon-CIinic Communication
I Research
in-Patient
rravei
3reaks
Other
13.
Activity Frequency
L7.8.9.
10.

E.[ Length of Call: The approximate number of minutes the phone call lasted.
Route: Whether the phone call was incomingWoroutoin(O.
Call Type: The topic(s) of discussion during the phone conversation. A phone call canr contain more than one code if appropriate. The codes are listed at the
bottom of the data sheet. If Other (0) is used, please note the topic in thenote section.
1. Who Call: The person who is calling the nurse or being called by the nurse. Forexample: patient, physician, pharmacist, etc.
L. Appropriate Routing: Whether or not the call was routed appropriately (YIN).
[ Follow-Up Needed: Place an (x) in the box if additional action is required. Forexample: additional follow-up calls, discussion with physician, etc.
[ Call Type Codes:S=Scheduling-Any calls regarding the scheduling of patient visits.
[ TR=Test Results- Calls regarding obtaining and discussing patient test results.
PR=Pharmacy Refills-Any calls regarding refilling a prescription including follow-up with pharmacy.
SM=Symptom-Any calls regarding symptom inquiries or discussion.
VM=Voice Mail / Paging-Any non-specific checking of voice mail or returning a
[page. .
CCCase Coordination-Any non-symptom calls regarding patient coordination
p with patient or other personnel including consultations.
GW=General Work-Any type call regarding non-patient specific work, i.e.,
p computer problems, clinic forms, etc.
P=Personal-Any personal / non-work calls.
OOther-Any calls not included in the above categories (Please explain nature ofcalls in note column).
[ Note: Any additional information, which is necessa in understanding the nature of thecall.
L(
LL

PHONE TRA CKING DA TA COLLECTION
Please collect this int’ormation [or 2 eeks startin2 March 9, 1998 It is essential tor re\levIn
orkIoad distribution. Thanks t’or your help.
Route: llncomingO=Outgoi ng
Who Call: Patient/Physiciar
Pharmac I st/etc
Codes: S=SchedulingTRTest ResultsPRPharmacy Refills
SM=SvmptomVM=Voice Mail: Pa’n
CC Case Coordination
GWGeneral Work
PPersonal00the r
Name: Date:
Time of Length of Call Route Call Type Appropriate Follow-UpVv ho Call ote
Day (# of Mins) (110) (Codes) Routing? (Y/N) Needed (x)
Notes:

Li
Pediatric Multi-Specialty Clinic Interview Questions
Name___________________________________________ Date________________
I. What percentage of time do you spend performing clinical activities during anaverage day? Office activities? Inpatient activities?
2. What percentage of time do you spend performing phone care during an average day?
3. Does this list reflect the types of phone calls you receive or place?
SchedulingTest ResultsPrescription RefillsSymptomOther___________________
4. Do you feel that you can finish your work within a typical workday? Is there
variation between workdays? Please explain.
5. Do you feel that you are performing work outside of your job description? Please
explain.
6. Is there a specific area of your job that you feel could be improved? Please explain.

——
——
‘.
——
——
——
LçJ CD U

Wo
rklo
adM
easu
rem
ent
Stu
dy
Raw
Dat
aS
heet
4/8
/98
Pat
ient
Tre
ati
IInde
p.I
.I
Clin
ic
Dep
artm
ent
Res
earc
hIn
-Pat
ient
Tra
vel
Bre
aks
Oth
er
Gas
tro
ente
rolo
gy
Ron
naFo
gle
(3/9
)C
NI
173
10
00
00
00
00
0
Ron
riaF
ogle
(3/1
0)13
21
00
00
00
01
01
Ron
naFo
gle
(3/1
1)6
02
50
40
00
00
00
Ron
naFo
gle
(2/1
2)8
03
00
200
00
00
01
Ron
ria
Fogt
e(3
/13)
71
00
00
00
00
00
0
Ron
ria
Fogl
e(3
/16)
70
33
00
00
00
00
0
Ron
ria
Fogl
e(3
/17)
163
00
24
20
00
21
2
Ron
naF
ogle
(3/1
8)13
13
30
61
00
01
10
Ron
naFo
gle
(3/1
9)15
00
20
20
00
00
01
Ron
naFo
gle
(3/2
0)5
00
30
00
00
00
00
Ave
rage
Bee
psl
Day
10.7
1.0
1.3
1.6
0.2
3.6
0.3
0.0
0.0
0.0
0.4
0.2
0.5
Wei
ghte
dP
erce
nta
ge
ofT
ime
Spe
nt*
54.0
%5.
1%6.
6%8.
1%1.
0%18
.2%
1.5%
0.0%
0.0%
0.0%
2.0%
1.0%
2.5%
FTE
’sS
pen
t0.
270.
030.
030.
040.
010.
090.
010.
000.
000.
000.
010.
010.
01
Dia
neK
emp
(3/9
)C
NS
62
20
04
04
00
10
0
Dia
neK
emp
(3/1
0)
41
215
15
00
00
30
0
Dia
neK
emp
(3/1
1)4
13
153
100
60
02
00
Dia
neK
emp
(3/1
2)4
12
13.
13
311
00
00
0
Dia
neK
emp
(3/1
6)8
42
00
90
60
11
04
Dia
neK
emp
(3/1
7)3
44
183
50
30
01
00
Dia
neK
emp
(3/1
8)6
25
162
60
00
00
00
Dia
neK
emp
(3/1
9)4
39
182
80
10
00
00
Dia
neK
emp
(3/2
0)6
58
110
20
10
00
00
Av
erag
eBee
psl
Day
5.0
2.6
4.1
11.8
1.3
5.8
0.3
3.6
0.0
0.1
0.9
0.0
0.4
Wei
ghte
dP
erce
nta
ge
ofT
ime
Spe
nt*
13.9
%7.
1%11
.5%
32.8
%3.
7%16
.1%
0.9%
9.9%
0.0%
0.3%
2.5%
0.0%
1.2%
FT
E’s
Spe
nt0.
140.
070.
110.
330.
040.
160.
010.
100.
000.
000.
020.
000.
01
Div
isio
nA
ver
ageB
eeps/
Day
15.7
3.6
5.4
13.4
1.5
9.4
0.6
3.6
0.0
0.1
1.3
0.2
0.9
Div
isio
nW
eigh
ted
Per
centa
ge*
27.3
%6.
4%9.
8%24
.6%
2.8%
16.8
%1.
1%6.
6%0.
0%0.
2%2.
3%0.
3%1.
7%
Div
isio
nF
TE
’sS
pen
t0.
410.
100.
150.
370.
040.
250.
020.
100.
000.
000.
030.
010.
03
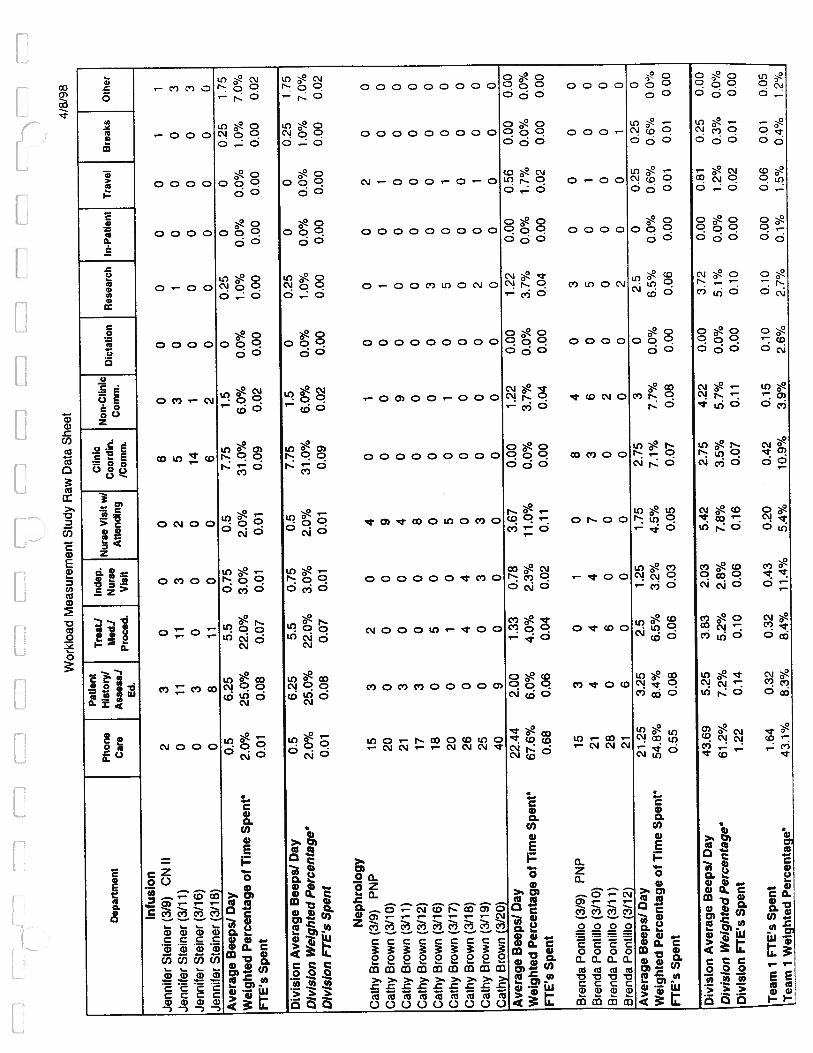
Wor
kloa
dM
easu
rem
ent
Stud
yR
awD
ata
She
et4/
8/98
Pat
ient
Tre
ati
Inde
p..
.C
linic
Pho
neH
isto
ry/
Nur
seV
isit
wI
.N
on-C
lini
cD
epar
tmen
tM
edJ
Nur
se.
Coo
rdin
.D
icta
tion
Res
earc
hIn
-Pat
ient
Tra
vel
Bre
aks
Oth
erC
are
Ass
essi
..
Att
endi
ngC
omm
.
Ed.
Pro
ced.
Vis
it/C
omm
.
Infu
sion
Jenn
ifer
Ste
iner
(3/9
)C
NII
23
00
06
00
00
01
1
Jenn
ifer
Ste
iner
(3/1
1)0
1111
32
53
01
00
03
Jenn
ifer
Ste
iner
(3/1
6)0
30
00
141
00
00
03
Jenn
ifer
Ste
iner
(3/1
8)0
811
00
62
00
00
00
Av
erag
eBee
psl
Day
0.5
6.25
5.5
0.75
0.5
7.75
1.5
00.
250
00.
251.
75
Wei
ghte
dP
erce
nta
ge
ofT
ime
Spe
nt*
2.0%
25.0
%22
.0%
3.0%
2.0%
31.0
%6.
0%0.
0%1.
0%0.
0%0.
0%1.
0%7.
0%
FT
E’s
Sp
ent
0.01
0.08
0.07
0.01
0.01
0.09
0.02
0.00
0.00
0.00
0.00
0.00
0.02
Div
isio
nA
ver
age
Bee
psl
Day
0.5
6.25
5.5
0.75
0.5
7.75
1.5
00.
250
00.
251.
75
Div
isio
nW
eigh
ted
Per
centa
ge*
2.0%
25.0
%22
.0%
3.0%
2.0%
31.0
%6.
0%0.
0%1.
0%0.
0%0.
0%1.
0%7.
0%
Div
isio
nF
TE
’sS
pen
t0.
010.
080.
070.
010.
010.
090.
020.
000.
000.
000.
000.
000.
02
Nep
hro
logy
Cat
hyB
row
n(3
/9)
PN
P15
32
04
01
00
02
00
Cat
hyB
row
n(3
/10)
200
00
90
00
10
10
0
Cat
hyB
row
n(3
/11)
213
00
40
90
00
00
0
Cat
hyB
row
n(3
/12)
173
00
80
00
00
00
0
Cat
hyB
row
n(3
/16)
180
50
00
00
30
00
0
Cat
hyB
row
n(3
/17)
200
10
50
10
50
10
0
Cat
hyB
row
n(3
/18)
260
44
00
00
00
00
0
Cat
hyB
row
n(3
/19)
250
03
30
00
20
10
0
Cat
hyB
row
n(3
/20)
409
00
00
00
00
00
0
Av
erag
eBee
psl
Day
22.4
42.
001.
330.
783.
670.
001.
220.
001.
220.
000.
560.
000.
00
Wei
ghte
dP
erce
nta
ge
ofT
ime
Spe
nt*
67.6
%6.
0%4.
0%2.
3%11
.0%
0.0%
3.7%
0.0%
3.7%
0.0%
1.7%
0.0%
0.0%
ET
Es
Sp
ent
0.68
0.06
0.04
0.02
0.11
0.00
0.04
0.00
0.04
0.00
0.02
0.00
0.00
Bre
nda
Pont
illo
(3/9
)P
NP
153
01
08
40
30
00
0
Bre
nda
Pont
illo
(3/1
0)21
44
47
36
05
01
00
Bre
nda
Pont
illo
(3/1
1)28
06
00
02
00
00
00
Bre
nda
Pont
illo
(3/1
2)21
60
00
00
02
00
10
Av
erag
eBee
ps/
Day
21.2
53.
252.
51.
251.
752.
753
02.
50
0.25
0.25
0
Wei
ghte
dP
erce
nta
geo
fTim
eSp
ent*
54.8
%8.
4%6.
5%3.
2%4.
5%7.
1%7.
7%0.
0%6.
5%0.
0%0.
6%06°/
00%
FT
E’s
Spen
t0.
550.
080.
060.
030.
050.
070.
080.
000.
060.
000.
010.
010
00
Div
isio
nA
ver
age
Bee
ps/
Day
43.6
95.
253.
832.
035.
422.
754.
220.
003.
720.
000.
810.
250.
00
Div
isio
nW
eigh
ted
Per
centa
ge
61.2
%7.
2%5.
2%2.
8%7.
8%3.
5%5.
7%0.
0%5.
1%0.
0%1.
2%0.
3%0.
0%
Div
isio
nF
TE
’sS
pen
t1.
220.
140.
100.
060.
160.
070.
110.
000.
100.
000.
020.
010.
00
Tea
m1
FTE
’sS
pen
t1.
640.
320.
320.
430.
200.
420.
150.
100.
100.
000.
060.
010.
05
Tea
miW
eIghte
dP
erce
nta
ge*
43.1
%8.
3%8.
4%11
.4%
5.4%
10.9
%3.
9%2.
6%2.
7%0.
1%1.
5%0.
4%12
%

EE
EE
..
fl
...
ri
J—
—‘
1—
—]
—
EE
]
Wor
kloa
dM
easu
rem
ent S
tudy
Raw
Dat
aSh
eet
4/8/
98
Dep
artm
ent
Res
earc
hIn
-Pat
ien
tT
rave
lB
reak
sO
ther
Ann
ela
trow
(3/1
1)C
NIII
00
00
911
30
00
20
0
Ann
ela
trow
(3/1
3)5
34
00
510
02
14
00
Ann
ela
trow
(3/1
7)3
20
00
104
00
00
03
Ann
ela
trow
(3/1
8)2
70
06
710
00
11
06
Ann
ela
trow
(3/2
0)0
40
10
56
00
04
04
Ave
rage
Bee
psl
Day
23.
20.
80.
23
7.6
6.6
00.
40.
42.
20
2.6
Wei
ghte
dP
erce
nta
ge
ofT
ime
Spe
nt*
6.9%
11.0
%2.
8%0.
7%10
.3%
26.2
%22
.8%
0.0%
1.4%
1.4%
7.6%
0.0
%9.
0%
FTE
’sS
pen
t0.
040.
070.
020.
000.
060.
160.
140.
000.
010.
010.
050.
000.
05
Div
isio
nA
ver
ageB
eeps/
Day
3.64
3.52
1.12
0.63
3.20
8.02
6.75
0.10
0.50
0.40
2.26
0.01
2.65
Div
isio
nW
eIghte
dP
erce
nta
ge*
6.9%
11.0
%2.
8%0.
7%10
.3%
26.2
%22
.8%
0.0%
1.4%
1.4%
7.6%
0.0%
9.0%
Div
isio
nF
TE
’sS
pen
t0.
040.
070.
020.
000.
060.
160.
140.
000.
010.
010.
050.
000.
05
Neu
rolo
gyS
ueA
rmst
rong
(3/9
)C
CC
100
20
00
12
00
00
0
Sue
Arm
stro
ng(3
/10)
151
72
17
10
21
10
5
Sue
Arm
stro
ng(3
/12)
82
37
71
31
10
30
1
Sue
Arm
stro
ng(3
/13)
63
36
46
11
00
10
3
Sue
Arm
stro
ng(3
/16)
102
20
00
10
00
00
0
Sue
Arm
stro
ng(3
/17)
102
25
03
10
00
00
0
Sue
Arm
stro
ng(3
/18)
90
20
05
00
00
00
0
Sue
Arm
stro
ng(3
/19)
40
30
66
30
30
10
1
Sue
Arm
stro
ng(3
/20)
80
21
02
00
00
00
0
Av
erag
eBee
psl
Day
8.89
1.11
2.89
2.33
2.00
3.33
1.22
0.44
0.67
0.11
0.67
0.00
1.11
Wei
ghte
dP
erce
nta
ge
ofT
ime
Spe
nt*
35.9
%4.
5%11
.7%
9.4%
8.1%
13.5
%4.
9%1.
8%2.
7%0.
4%2.
7%0.
0%4.
5%
FT
E’s
Spen
t0.
300.
040.
100.
080.
070.
110.
040.
020.
020.
000.
020.
000.
04
Ann
Mar
ker
(3/9
)C
NII
173
10
01
20
00
00
0
Ann
Mar
ker
(3/1
1)18
20
00
07
00
00
00
Ann
Mar
ker
(3/1
3)29
01
00
01
00
20
00
Ann
Mar
ker
(3/1
7)29
00
00
00
00
01
00
Ann
Mar
ker
(3/1
9)28
00
00
08
00
01
00
Ann
Mar
ker
(3/2
0)25
00
50
01
00
00
00
Aver
age
Bee
psl
Day
24.3
30.
830.
330.
830.
000.
173.
170.
000.
000.
330.
330.
000.
00
Weig
hte
dP
erc
enta
geofT
imeS
pent
80.2
%2.
7%1.
1%2.
7%0.
0%0.
5%10
.4%
0.0%
0.0%
1.1%
1.1%
0.0%
0.0%
FT
E’s
Sp
ent
0.52
0.02
0.01
0.02
0.00
0.00
0.07
0.00
0.00
0.01
0.01
0.00
0.00
TE
AL
2N
eona
tolo
gy—
-—
.-..,—
...

1.
EE
E...
—
_
—..
—-
.-
.1
Wor
kloa
dM
easu
rem
ent
Stud
yR
awD
ata
She
et4/
8/98
Pat
ient
Tre
ati
Inde
p..
.C
linic
Pho
neH
isto
ry!
Nur
seV
isit
wI
.N
on-C
linic
Dep
artm
ent
Med
JN
urse
.C
oord
in.
Dic
tatio
nR
esea
rch
In-P
atie
ntT
rave
lB
reak
sO
ther
Car
eA
ssess
i.
.A
tten
ding
Com
m.
Ed.
Pro
ced.
Vis
itIC
omm
.
Hel
enM
urie
l(3
/17)
CN
II27
10
00
00
00
00
00
Hel
enM
urie
l(3
/18)
105
30
00
00
00
00
0
Hel
enM
urie
l(3
/19)
150
00
00
70
00
00
0
Hel
enM
urie
l(3
/20)
220
00
00
120
00
00
0
Hel
enM
urre
l(3
/23)
120
00
00
50
00
00
0
Hel
enM
urre
l(3
/24)
150
00
00
20
00
00
0
Hel
enM
urre
l(3
/25)
120
00
00
50
00
00
0
Hel
enM
urie
l(3
/26)
140
00
00
60
00
00
0
Hel
enM
urie
l(3
/27)
110
00
00
110
00
00
0
Ave
rage
Bee
ps!
Day
15.3
30.
670.
330.
000.
000.
005.
330.
000.
000.
000.
000.
00000
Wel
ghte
dP
erce
nta
geo
fTlm
eSp
ent*
70.8
%3.
1%1.
5%0.
0%0.
0%0.
0%24
.6%
0.0%
0.0%
0.0%
0.0%
0.0%
0.0%
FTE
’sS
pen
t0.
710.
030.
020.
000.
000.
000.
250.
000.
000.
000.
000.
000.
00
Div
isio
nA
ver
ageB
eepsl
Day
48.5
62.
613.
563.
172.
003.
509.
720.
440.
670.
441.
000.
001.
11
Div
isio
nW
eigh
ted
Per
cent
age*
61.4
%3.
5%4.
9%3.
9%2.
7%4.
7%14
.2%
0.6%
0.9%
0.4%
1.2%
0.0%
1.5%
Div
isio
nF
it’s
Sp
ent
1.53
0.09
0.12
0.10
0.07
0.12
0.36
0.02
0,02
0.01
0.03
0.00
0.04
Tea
m2
FTE
’sS
pen
t1.
580.
150.
140.
100.
130.
280.
490.
020.
030.
020.
080.
000.
09
Tea
m2
Wei
ghte
dP
erce
nta
ge*
50.8
%4.
9%4.
5%3.
3%4.
2%8.
9%15
.9%
0.5%
1.0%
0.6%
2.4%
0.0%
3.0%

Wor
kloa
dM
easu
rem
ent
Stu
dyR
awD
ata
She
et4/
8/98
In-P
atie
nt
Tra
vel
Bre
aks
Oth
er
.M
i3
End
ocri
nolo
gyK
athy
Cla
rk(2
/16)
PNP
03
30
02
00
11
0
Kat
hyC
lark
(2)1
7)5
10
00
40
00
20
Kat
hyC
lark
(211
8)2
116
92
00
03
20
Kat
hyC
lark
(2)2
0)1
00
131
00
00
20
Kat
hyC
lark
(2/2
4)0
10
12
00
00
10
Kat
hyC
lark
(2)2
5)3
00
62
00
02
00
Kat
hyC
lark
(2/2
7)0
00
185
00
01
00
Av
erag
eBee
ps/
Day
1.57
2.29
1.29
6.71
1.71
3.86
3.43
0.86
0.00
0.00
1.00
1.14
0.00
We,g
hte
dp
erc
en
tag
eo
fTim
eS
pen
t*6.
6%9.
6%5.
4%28
.1%
7.2%
16.2
%14
.4%
3.6%
0.0%
0.0%
4.2%
4.8%
0.00
/o
FT
Es
Spen
t0.
050.
070.
040.
200.
050.
110.
100.
030.
000.
000.
030.
030.
00
Mar
gyFo
x(2
/16)
CN
S3
60
013
107
00
00
01
Mar
gyFo
x(2
/18)
180
00
03
40
20
20
0
Mar
gyFo
x(2
/20)
70
010
05
10
50
10
6
Mar
gyFo
x(2
/23)
20
00
159
20
00
00
0
Mar
gyFo
x(2
/25)
90
00
03
30
36
12
0
Mar
gyFo
x(2
/27)
20
00
01
00
025
10
4
Av
erag
eBee
ps/
Day
6.83
1.00
0.00
1.67
4.67
5.17
2.83
0.00
1.67
5.17
0.83
0.33
1.83
Wei
ghte
dP
erce
nta
ge
ofT
ime
Spe
nt*
21.4
%3.
1%0.
0%5.
2%14
.6%
16.1
%8.
9%0.
0%5.
2%16
.1%
2.6%
1.0%
5.7%
FT
E’s
Spen
t0.
130.
020.
000.
030.
090.
100.
050.
000.
030.
100.
020.
010.
03
Den
ise
Gar
den
(2/1
6)C
NIll
15
10
55
10
00
00
2
Den
ise
Gar
den
(2)1
7)11
00
00
02
00
132
03
Den
ise
Gar
den
(2/1
9)8
03
00
18
00
03
00
Aver
age
Bee
ps!
Day
6.67
1.67
1.33
0.00
1.67
2.00
3.67
0.00
0.00
4.33
1.67
0.00
1.67
Wei
ghte
dP
erce
nta
ge
ofT
ime
Spe
nt*
27.0
%6.
8%5.
4%0.
0%6.
8%8.
1%14
.9%
0.0%
0.0%
17.6
%6.
8%0.
0%6.
8%
FT
E’s
Spen
t0.
200.
050.
040.
000.
050.
060.
110.
000.
000.
130.
050.
000.
05
Div
isio
nA
ver
ageB
eeps/
Day
15.0
74.
952.
628.
388.
0511
.02
9.93
0.86
1.67
9.50
3.50
1.48
3.50
Div
isio
nW
eig
hte
dP
erce
nta
ge*
18.4
%6.
7%3.
8%11
.1%
9.2%
13.2
%12
.9%
1.2%
1.5%
11.2
%4.
7%1.
9%4.
1%
Div
isio
nF
TE
’sS
pen
t0.
380.
140.
080.
230.
190.
270.
270.
030.
030.
230.
100.
040.
09
Dep
artm
ent
2 5 4 3 0 9 4
2 9 3 2 3 5 0

E..
EE
Ffl
EE
EE
Wor
kloa
dM
easu
rem
ent
Stud
yR
awD
ata
She
et4/
8/98
Pat
ien
tT
reat
iin
dep
.C
lini
cP
ho
ne
His
tory
lN
urs
eV
isit
WI
.N
on-C
lini
cD
epar
tmen
tM
edJ
Nurs
e.
Coord
in.
Dic
tati
onR
esea
rch
in-P
atie
nt
Tra
vel
Bre
aks
Oth
erC
are
Ass
ess
i.
.A
tten
din
gC
omm
.E
d.P
roce
d.
Vis
itIC
omm
.
Pul
mon
ary
Phyl
lisA
skew
(2/1
6)C
CC
150
00
01
00
00
00
2
Phyl
lisA
skew
(2/1
7)9
00
00
02
00
00
01
Phyl
lisA
skew
(2/1
8)21
00
00
54
00
00
00
Phyl
lisA
skew
(2/1
9)6
90
00
00
10
00
03
Phyl
lisA
skew
(2/2
0)12
00
00
02
00
00
00
Phyl
lisA
skew
(2/2
3)14
00
00
04
00
00
09
Phyl
lisA
skew
(2/2
4)8
00
00
00
00
02
04
Phyl
lisA
skew
(2/2
6)23
00
00
32
00
00
22
Phyl
lisA
skew
(2/2
7)19
00
00
03
00
00
00
Phyl
lisA
skew
(3/2
)17
00
00
04
00
00
00
Phyl
lisA
skew
(3/5
)7
00
00
02
00
00
018
Ave
rage
Bee
ps/
Day
13.7
30.
820.
000.
000.
000.
822.
090.
090.
000.
000.
180.
183.
55W
eighte
dP
erce
nta
geo
fTlm
eSp
ent*
64.0
%3.
8%0.
0%0.
0%0.
0%3.
8%9.
7%0.
4%0.
0%0.
0%0.
8%0.
8%16
.5%
FT
E’s
Spen
t0.
640.
040.
000.
000.
000.
040.
100.
000.
000.
000.
010.
010.
17
Julie
Kon
kle
(2/1
6)C
CC
70
20
05
40
00
01
4
Julie
Kon
kle
(2/1
8)0
113
00
41
00
01
00
Julie
Kon
kle
(2/1
9)9
60
02
35
00
32
10
Juli
eK
onkl
e(2
/20)
214
40
45
10
01
20
0
Juli
eK
onkl
e(2
/23)
82
00
010
60
40
11
0
Juli
eK
onkl
e(2
/25)
110
20
15
10
00
00
0
Juli
eK
onki
e(2
/26)
58
20
35
80
00
01
2
Juli
eK
onkl
e(2
/27)
40
20
11
20
00
00
0
Aver
age
Bee
ps/
Day
5.75
5.13
1.88
0.00
1.38
4.75
3.50
0.00
0.50
0.50
0.75
0.50
07
5
Wei
ghte
dP
erce
nta
ge
ofT
ime
Spe
nt*
22.7
%20
.2%
7.4%
0.0%
5.4%
18.7
%13
.8%
0.0%
2.0%
2.0%
3.0%
2.0%
30%
FT
E’s
Spen
t0.
170.
150.
060.
000.
040.
140.
100.
000.
010.
010.
020.
010.
02
Nan
cyM
cint
osh
(2/1
6)C
NS
61
00
05
130
30
00
6
Nan
cyM
cint
osh
(2/1
7)2
42
00
31
00
00
05
Nan
cyM
cint
osh
(2/1
9)0
20
00
80
00
00
02
Nan
cyM
cint
osh
(2/2
3)0
51
00
22
00
00
04
Nan
cyM
cint
osh
(2/2
4)2
00
00
55
00
00
012
Nan
cyM
cint
osh
(2/2
5)6
33
00
20
00
00
02
Nan
cyM
cint
osh
(212
6)0
04
00
02
00
00
00
Av
erag
eBee
psl
Day
2.29
2.14
1.43
0.00
0.00
3.57
3.29
0.00
0.43
0.00
0.00
0.00
4.43
Wei
ghte
dP
erce
nta
ge
ofT
ime
Spe
nt*
13.0
%12
.2%
8.1%
0.0%
0.0%
20.3
%18
.7%
0.0%
2.4%
0.0%
0.0%
0.0%
25.2
%
FT
E’s
Spen
t0.
100.
090.
060.
000.
000.
150.
140.
000.
020.
000.
000.
000
19
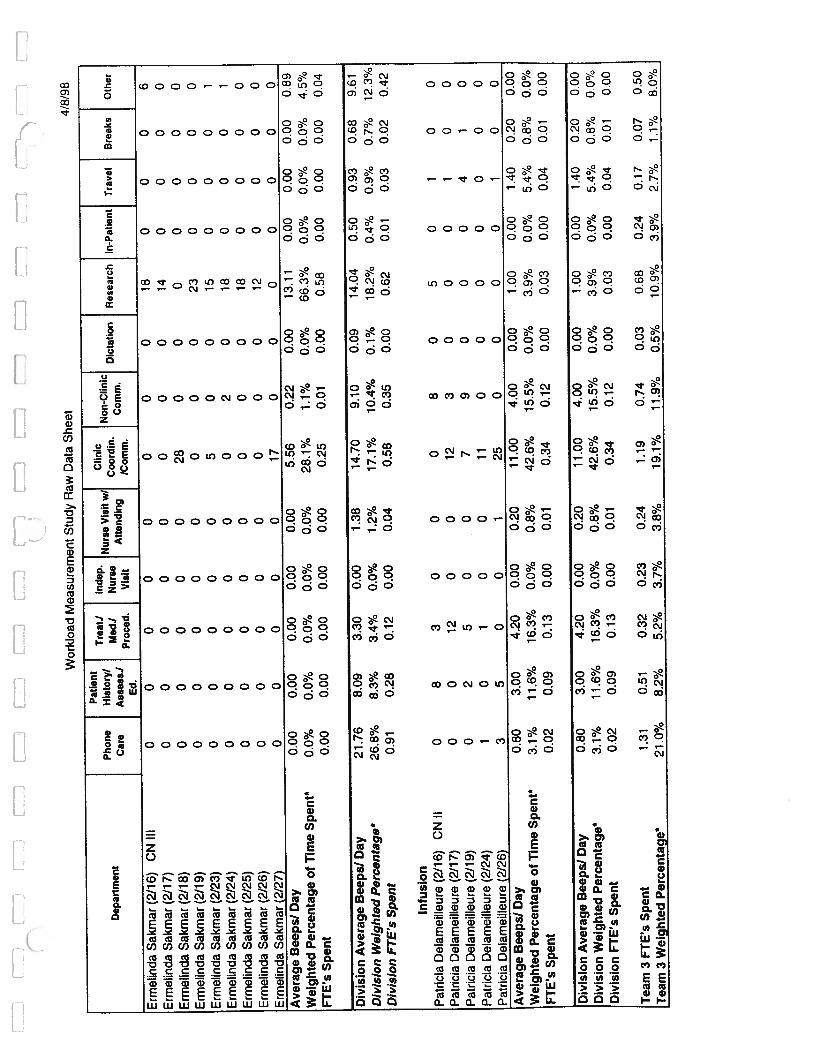
Wor
kloa
dM
easu
rem
ent
Stud
yR
awD
ata
She
et4/
8/98
Pat
ient
Tre
atJ
Inde
p..
.C
linic
Pho
neH
isto
ry!
Nur
seV
isit
w/
.N
on-C
lini
cD
epar
tmen
tM
edJ
Nur
se.
Coo
rdin
.D
icta
tion
Res
earc
hIn
-Pat
ient
Tra
vel
Bre
aks
Oth
erC
are
Ass
ess
i.
.A
tten
ding
Com
m.
Ed.
Pro
ced.
Vis
itlC
omm
.
Erm
elin
daS
akm
ar(2
/16)
CN
III0
00
00
00
018
00
06
Erm
elin
daS
akm
ar(2
117)
00
00
00
00
140
00
0
Erm
ehnd
aS
akm
ar(2
118)
00
00
028
00
00
00
0
Erm
elin
daS
akm
ar(2
119)
00
00
00
00
230
00
0
Erm
elin
daS
akm
ar(2
/23)
00
00
05
00
150
00
1
Erm
elin
daS
akm
ar(2
/24)
00
00
00
20
180
00
1
Erm
elin
daS
akm
ar(2
/25)
00
00
00
00
180
00
0
Erm
elin
daS
akm
ar(2
/26)
00
00
00
00
120
00
0
Erm
elin
daS
akm
ar(2
/27)
00
00
017
00
00
00
0
Ave
rage
Bee
psl
Day
0.00
0.00
0.00
0.00
0.00
5.56
0.22
0.00
13.1
10.
000.
000.
000.
89
Wei
ghte
dP
erce
nta
ge
ofT
ime
Spe
nt*
0.0%
0.0%
0.0%
0.0%
0.0%
28.1
%1.
1%0.
0%66
.3%
0.0%
0.0%
0.0%
4.5%
FTE
’sS
pent
0.00
0.00
0.00
0.00
0.00
0.25
0.01
0.00
0.58
0.00
0.00
0.00
0.04
Div
isio
nA
ver
ageB
eeps/
Day
21.7
68.
093.
300.
001.
3814
.70
9.10
0.09
14.0
40.
500.
930.
689.
61
Div
isio
nW
eIgh
ted
Per
cen
tag
e*26.8
%8.3
%3.
4%0.
0%1.
2%17
.1%
10.4
%0.
1%18
.2%
0.4%
0.9%
0.7%
12.3
%
Div
isio
nF
TE
’sS
pen
t0.
910.
280.
120.
000.
040.
580.
350.
000.
620.
010.
030.
020.
42
Infu
sion
Patr
icia
Del
amei
lleu
re(2
/16)
CN
II0
83
00
08
05
01
00
Patr
icia
Del
amei
lleu
re(2
/17)
00
120
012
30
00
10
0
Patr
icia
Del
amei
lleu
re(2
/19)
02
50
07
90
00
41
0
Patr
icia
Del
amei
lleu
re(2
/24)
10
10
011
00
00
00
0
Patr
icia
Del
amei
lleu
re(2
/26)
35
00
125
00
00
10
0
Av
erag
eBee
ps/
Day
0.80
3.00
4.20
0.00
0.20
11.0
04.
000.
001.
000.
001.
400.
200.
00
Wei
ghte
dP
erce
nta
ge
ofT
ime
Spe
nt*
3.1%
11.6
%16
.3%
0.0%
0.8%
42.6
%15
.5%
0.0%
3.9%
0.0%
5.4%
0.8%
0.0%
FTE
’sS
pen
t0.
020.
090.
130.
000.
010.
340.
120.
000.
030.
000.
040.
010.
00
Div
isio
nA
ver
ageB
eeps/
Day
0.80
3.00
4.20
0.00
0.20
11.0
04.
000.
001.
000.
001.
400.
200.
00
Div
isio
nW
eigh
ted
Per
cent
age*
3.1%
11.6
%16
.3%
0.0%
0.8%
42.6
%15
.5%
0.0%
3.9%
0.0%
5.4%
0.8%
0.0%
Div
isio
nF
TE
sS
pen
t0.
020.
090.
130.
000.
010.
340.
120.
000.
030.
000.
040.
010.
00
Tea
m3
FT
E’s
Spen
t1.
310.
510.
320.
230.
241.
190.
740.
030.
680.
240.
170.
070.
50
Tea
m3
Wei
ghte
dP
erce
ntag
e*21
.0%
8.2%
5.2%
3.7%
3.8%
19.1
%11
.9%
0.5%
10.9
%3.
9%2.
7%1.
1%8.
0°/o
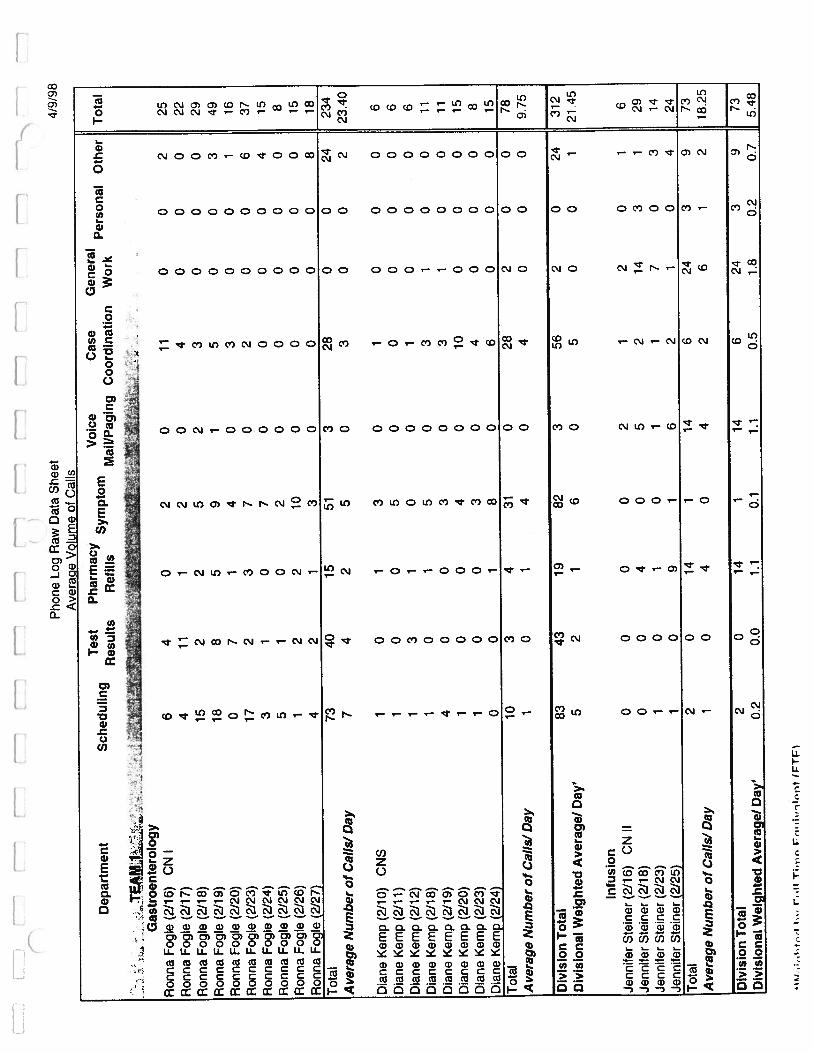
FI
Er.
EE
]:
E.;
...J
.J
Pho
neL
ogR
awD
ata
She
etA
vera
oeV
olum
eof
Cal
ls
Tes
tP
har
mac
yV
oice
Cas
eG
ener
alD
epar
tmen
tS
ched
uli
ng
Sym
pto
mR
esu
lts
Ref
ills
Mai
l/P
agin
gC
oord
inat
ion
Wor
k
TE
1
_______
jT
h4/
9/98
Per
son
alO
ther
Tot
al
Gas
tro
ente
rolo
gy
Ron
naF
ogle
(211
6)C
NI
64
02
011
00
225
Ron
naF
ogle
(211
7)4
111
20
40
00
22
Ron
naF
ogle
(211
8)15
22
52
30
00
29
Ron
naF
ogle
(2/1
9)18
85
91
50
03
49
Ron
naF
ogle
(2/2
0)0
71
40
30
01
16
Ron
naF
ogle
(2/2
3)17
23
70
20
06
37
Ron
naF
ogle
(2/2
4)3
10
70
00
04
15
Ron
naF
ogle
(2)2
5)5
10
20
00
00
8
Ron
naF
ogle
(2/2
6)1
22
100
00
00
15
Ron
naFo
cile
f2/2
74
21
30
00
08
18
Tot
al73
4015
513
280
024
234
Aver
age
Nu
mb
erof
Cal
ls!
Day
74
25
03
00
223
.40
Dia
neK
emp
(2/1
0)C
NS
10
13
01
00
06
Dia
neK
emp
(2/1
1)1
00
50
00
00
6
Dia
neK
emp
(2/1
2)1
31
00
10
00
6
Dia
neK
emp
(2/1
8)1
01
50
31
00
11
Dia
neK
emp
(2)1
9)4
00
30
31
00
11
Dia
neK
emp
(212
0)1
00
40
100
00
15
Dia
neK
emp
(2/2
3)1
00
30
40
00
8
Dia
neK
emp
(2/2
4)0
01
80
60
00
15
Tot
al10
34
310
282
00
78
Aver
age
Nu
mb
erof
Cal
ls!
Day
10
14
04
00
09.
75
Div
isio
nT
otal
8343
1982
356
20
2431
2
Div
isio
nal
Wei
ghte
dA
ver
age/
Day
52
16
05
00
121
.45
Infu
sion
Jenn
ifer
Ste
iner
(2)1
6)C
NII
00
00
21
20
16
Jenn
ifer
Ste
iner
(2/1
8)0
04
05
214
31
29
Jenn
ifer
Ste
iner
(2/2
3)1
01
01
17
03
14
Jenn
ifer
Ste
iner
(2/2
5)1
09
16
21
04
24
Tot
al2
014
114
624
39
73
Aver
age
Nu
mb
erof
Cal
ls!
Day
10
40
42
61
218
.25
Div
isio
nT
otal
20
141
146
243
973
DIv
isio
nal
Wel
ghte
dA
ver
age/
Day
0.2
0.0
1.1
0.1
1.1
0.5
1.8
0.2
0.7
5.48
r.ii
Th
,rç,,
(FT
F

.,.E
E.
CE
:..
..j
..
——
in
Pho
neL
ogR
awD
ata
She
et4/
9/98
Ave
rane
Vol
ume
ofC
alls
.T
est
Phar
mac
yV
oice
Cas
eG
ener
alD
epar
tmen
tS
ched
uli
ng
Sym
pto
mP
erso
nal
Oth
erT
otal
Res
ult
sR
efil
lsM
ail/
Pag
ing
Coord
inat
ion
Wor
k
Nep
hro
log
yC
athy
Bro
wn
(2/1
6)P
NP
013
50
041
10
060
Cat
hyB
row
n(2
/17)
06
310
012
00
031
Cat
hyB
row
n(2
/18)
86
17
010
00
032
Cat
hyB
row
n(2
/19)
01
04
017
00
022
Cat
hyB
row
n(2
/20)
014
510
036
00
065
Cat
hyB
row
n(2
123)
012
01
04
00
017
Cat
hyB
row
n(2
/24)
05
27
02
00
016
Cat
hyB
row
n(2
/25)
014
16
09
30
033
Cat
hyB
row
n(2
/26)
08
15
018
10
235
Cat
hyB
row
n(2
/27)
014
51
020
40
347
Tot
al8
9323
510
169
90
535
8
Aver
age
Nu
mb
erof
Cal
ls?
Day
19
25
017
10
135
.80
Bre
nda
Pont
illo
(211
7)P
NP
10
41
37
70
1134
Bre
nda
Pont
illo
(2/1
8)0
11
10
285
01
37
Bre
nda
Pont
illo
(2/1
9)5
32
41
222
08
47
Bre
nda
Pont
illo
(2/2
3)1
612
90
124
04
48
Bre
nda
Pont
illo
(2/2
4)0
12
10
170
01
22
Bre
nda
Pont
illo
(2/2
5)2
02
00
274
08
43
Bre
nda
Pont
illo
(2/2
6)0
40
00
140
05
23
Tot
al9
1523
164
127
220
3825
4
Av
erag
eN
um
ber
of
Cal
ls!
Day
12
32
118
30
536
.29
Div
isio
nT
otal
1710
846
674
296
310
4361
2
Div
isio
nal
Wei
ghte
dA
ver
age/
Day
211
67
135
40
672
.09
II
rr
.1..*
d

ED
EE
[j
Ci.
)_]
-•‘
--
nP
hone
Log
Raw
Dat
aS
heet
Ave
raqe
Vol
ume
ofC
alls
4/9/
98
.T
est
Ph
arm
acy
Voi
ceC
ase
Gen
eral
Dep
artm
ent
Sch
eduli
ng
Sym
pto
mP
erso
nal
Oth
erT
otal
Res
ult
sR
efil
lsM
ail/
Pag
ing
Coord
inat
ion
Wor
k
TEAM
2..
:3z
Neo
nat
olo
gy
Ann
ela
trow
(2/1
8)C
NIII
20
41
55
12
020
Ann
ela
trow
(2/2
0)0
00
03
18
10
13A
nne
latr
ow(2
/24)
30
00
37
11
217
Ann
ela
trow
(2/2
5)0
00
02
10
00
3A
nne
latr
ow(2
/27)
10
00
02
00
03
Tot
al6
04
113
1610
42
56A
ver
age
Num
ber
of
Cal
ls!
Day
10
10
33
21
011
20
Div
isio
nT
otal
60
41
1316
104
256
Div
isio
nal
Wei
ghte
dA
ver
age!
Day
s1
00
02
21
00
6.72
Neu
rolo
gy
Sue
Arm
stro
ng(2
/17)
CC
C1
52
60
81
02
25S
ueA
rmst
rong
(2/1
8)0
20
41
81
00
16S
ueA
rmst
rong
(2/1
9)0
20
10
41
02
10S
ueA
rmst
rong
(2/2
0)0
20
50
20
02
11S
ueA
rmst
rong
(2/2
3)0
23
30
121
02
23S
ueA
rmst
rong
(2/2
4)0
31
00
82
01
15S
ueA
rmst
rong
(2/2
5)0
16
10
42
02
16S
ueA
rmst
rong
(2/2
6)1
00
11
130
00
16S
ueA
rmst
rong
(2/2
7)0
43
31
140
02
27T
otal
221
1524
373
80
1315
9A
ver
age
Nu
mb
erof
Cal
ls!
Day
02
23
08
10
117
.67
Ann
Mar
ker
(2/1
6)C
NII
02
00
04
00
06
Ann
Mar
ker
(2/1
9)0
16
170
30
01
28A
nnM
arke
r(2
/20)
00
27
00
00
312
Ann
Mar
ker
(2/2
4)1
12
120
00
02
18A
nnM
arke
r(2
/25)
02
31
08
00
620
Ann
Mar
ker
(2/2
6)0
53
140
60
05
33A
nnM
arke
r(2
/27)
02
511
05
00
124
Tot
al1
1321
620
260
018
141
Aver
age
Num
ber
of
Cal
ls!
Day
02
39
04
00
320
.14
hr
r,,it
Tii
nF
ri,
Ii’’
9ln
nt
(ET
F
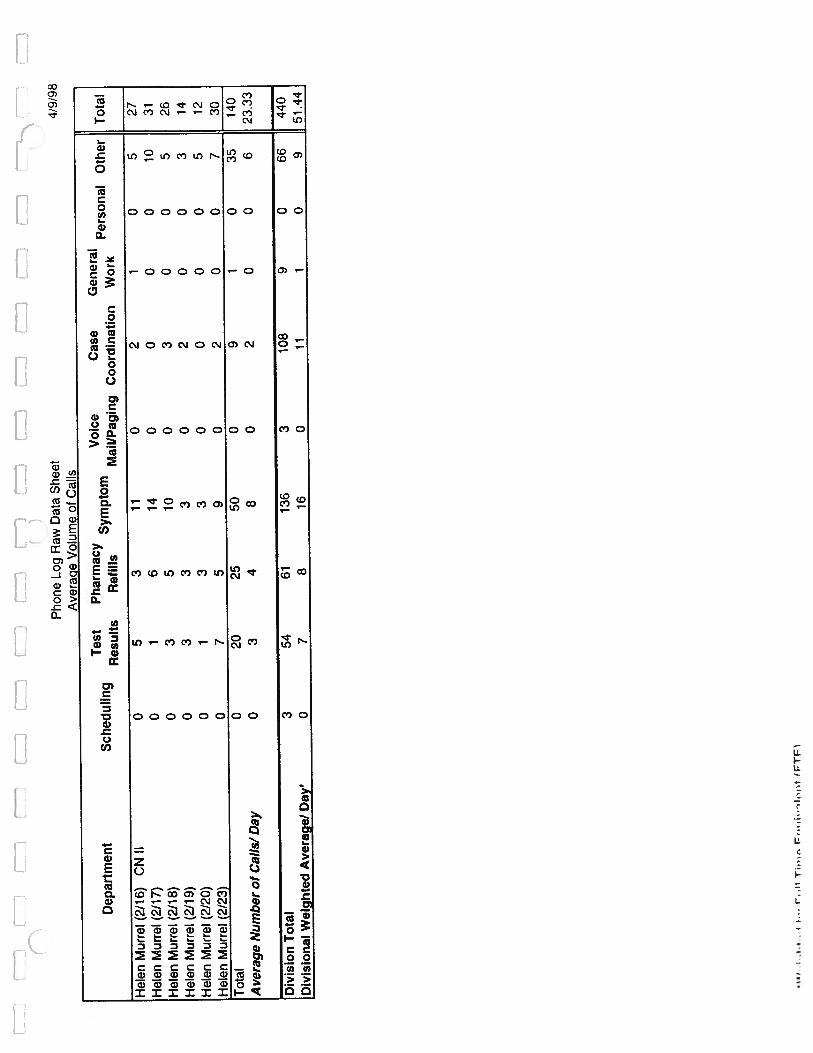
f\
Pho
neL
ogR
awD
ata
She
et4/
9/98
Ave
raci
eV
olum
eof
Cal
ls
Tes
tP
har
mac
yV
oice
Cas
eG
ener
alD
epar
tmen
tS
ched
uli
ng
Sym
pto
mP
erso
nal
Oth
erT
otal
Res
ult
sR
efil
lsM
ail/
Pag
ing
Co
ord
inat
ion
Wor
k
Hel
enM
urre
l(2
)16)
CN
Il0
53
110
21
05
27
Hel
enM
urre
l(2
117)
01
614
00
00
1031
Hel
enM
urre
l(2
118)
03
510
03
00
526
Hel
enM
urre
l(2
/19)
03
33
02
00
314
Hel
enM
urre
l(2
/20)
01
33
00
00
512
Hel
enM
urre
l(2
/23)
07
59
02
00
730
Tot
al0
2025
500
91
035
140
Aver
age
Nu
mb
erof
Cal
ls!
Day
03
48
02
00
623
.33
Div
isio
nT
otal
354
6113
63
108
90
6644
0
Div
isio
nal
Wel
ghte
dA
ver
age/
Day
07
816
011
10
951
.44
Ir,i$
IFT
F

1..
I,E
-T
h-
Pho
neL
ogR
awD
ata
She
et
Ave
raci
eV
olum
eof
Cas
4/9/
98
.T
est
Ph
arm
acy
Voi
ceC
ase
Gen
eral
Dep
artm
ent
Sch
edu
ling
Sym
pto
mP
erso
nal
Oth
erT
otal
Res
ult
sR
efil
lsM
ail/
Pag
ing
Co
ord
inat
ion
Wor
k
.,
TEA
M3
En
do
crin
olo
gy
Kat
hyC
lark
(3/9
)P
NP
00
26
02
10
011
Kat
hyC
lark
(3/1
0)0
10
140
07
10
23
Kat
hyC
lark
(3/1
1)0
02
10
51
11
11
Kat
hyC
lark
(3/1
3)1
00
40
00
00
5
Kat
hyC
lark
(3/1
6)0
06
31
01
00
11
Kat
hyC
lark
(3/1
7)3
01
61
27
00
20
Kat
hyC
lark
(3/1
8)1
20
91
14
00
18
Kat
hyC
lark
(3/2
0)0
00
01
20
01
4
Tot
al5
311
434
1221
22
103
Aver
age
Nu
mb
erof
Cal
ls!
Day
10
15
12
30
012
.88
Mar
gyFo
x(3
/13)
CN
S0
00
40
20
02
8
Mar
gyFo
x(3
/18)
140
00
02
20
119
Mar
gyFo
x19
03
00
22
00
26
Tot
al33
03
40
64
03
53
Aver
age
Num
ber
of
Cal
ls!
Day
110
11
02
10
117
.67
Div
isio
nT
otal
383
1447
418
252
515
6
Div
isio
nal
Wei
ghte
dA
ver
age/
Day
’7
02
50
23
01
19.6
1
Pulm
on
ary
Phyl
lisA
skew
(3/2
4)C
CC
63
68
80
10
133
Phyl
lisA
skew
(3/2
5)6
210
2012
19
02
62
Phyl
lisA
skew
(3/2
6)1
02
16
01
00
11
Phyl
lisA
skew
(3/2
7)0
02
22
11
00
8
Tot
al13
520
3128
212
03
114
Aver
age
Num
ber
of
Cal
ls!
Day
31
58
71
30
128
.50
Juli
eK
onkl
e(3
/11)
CC
C0
03
916
92
10
40
Juli
eK
onkl
e(3
/12)
00
16
715
10
030
Juli
eK
onkl
e(3
/13)
00
05
78
50
025
Juli
eK
onkl
e(3
/16)
00
76
69
31
032
Juli
eK
onkl
e(3
/18)
01
47
1310
60
142
Juli
eK
onkl
e(3
/19)
00
611
29
30
031
Juli
eKon
kle(
3/20
)0
07
1213
112
00
45
Tot
al0
128
5664
7122
21
245
Aver
age
Nu
mb
erof
Cal
ls!
Day
00
48
910
30
035
.00
rrr

Efl
EE
flE
__
Pho
neL
ogR
awD
ata
She
et4/
9/98
Ave
raae
Vol
ume
ofC
alls
.T
est
Phar
mac
yV
oice
Cas
eG
ener
alD
epar
tmen
tS
ched
uli
ng
Sym
pto
mP
erso
nal
Oth
erT
otal
Res
ult
sR
efil
lsM
ail/
Pag
ing
Coord
inat
ion
Wor
k
Nan
cyM
cint
osh
(3/1
6)C
NS
11
03
72
10
419
Nan
cyM
cint
osh
(3/1
7)3
00
05
140
04
26
Nan
cyM
cint
osh
(3/1
9)0
00
31
30
03
10
Tot
al4
10
613
191
011
55
Aver
age
Nu
mb
ero
fC
alls
)D
ay1
00
24
60
04
1833
Div
isio
nT
otal
177
4893
105
9235
215
414
Div
isio
nal
Wei
ghte
dA
ver
age/
Day
42
815
1713
60
468
.50
Infu
sion
Pat
rici
aD
elam
eill
eure
(3/2
7)C
NII
00
00
10
70
08
Pat
rici
aD
eiam
eiii
eure
(3/3
0)0
11
01
70
00
10
Pat
rici
aD
elam
eill
eure
(3/3
1)0
00
00
112
00
13
Tot
al0
11
02
819
00
31
Aver
age
Num
ber
of
Cal
ls/D
ay0.
00.
30.
30.
00.
72.
76.
30.
00.
010
Div
isio
nT
otal
01
10
28
190
031
Div
isio
nal
Wei
ghte
dA
ver
age/
Day
0.0
0.3
0.3
0.0
0.5
2.1
5.1
0.0
0.0
8.27
hn
htr
’rl
FiII
Tj,
uc
Fni
ivI’
nt
(FT
FI

fl
....
....
..-
-—
-m
--n
Pho
neL
ogR
awD
ata
She
et4/
9/98
Ave
rage
Len
gth
ofC
alls
(mm
.)
.T
est
Phar
mac
yV
oice
Cas
eD
epar
tmen
tS
ched
uli
ng
.S
ympt
om.
..
.G
ener
alW
ork
Per
sonal
Oth
erA
vera
geR
esult
sR
efil
lsM
aili
Pag
inC
oord
inat
ion
TE
AM
1-
Gas
tro
ente
rolo
gy
Ron
naF
ogle
(2/1
6)C
NI
6.8
2.3
-11
.0-
3.9
--
5.0
5.8
Ron
naF
ogle
(2/1
7)3.
05.
04.
5-
5.0
--
0.0
3.5
Ron
naF
ogle
(211
8)3.
14.
02.
03.
01.
01.
0-
--
2.3
Ron
naF
ogIe
(2/1
9)2.
94.
12.
46.
0-
2.2
--
36.0
8.9
Ron
naF
ogle
(2/2
0)-
1.9
2.0
3.0
-5.
0-
--
3.0
Ron
naF
ogle
(2/2
3)5.
84.
04.
33.
8-
3.0
--
3.5
4.1
Ron
naF
ogle
(2/2
4)4.
34.
0-
7.4
--
--
4.0
4.9
Ron
naF
ogle
(2/2
5)6.
02.
07.
0-
--
-5.
05.
0
Ron
naF
ogle
(2/2
6)5.
06.
51.
55.
0-
--
--
4.5
Ron
naF
ogle
(2/2
7)5.
33.
52.
010
.3-
--
2.6
4.7
Ave
rage
Len
gth
ofC
alls
4.7
3.7
2.4
6.1
1.0
3.3
--
8.0
Dia
neK
emp
(2/1
0)C
NS
10.0
-10
.018
.3-
15.0
--
-13
.3
Dia
neK
emp
(2/1
1)15
.0-
-18
.0-
--
--
16.5
Dia
neK
emp
(2)1
2)25
.010
.010
.0-
-15
.0-
--
15.0
Dia
neK
emp
(2/1
8)5.
0-
5.0
10.0
-18
.320
.0-
-11
.7
Dia
neK
emp
(2/1
9)5.
0-
-8.
3-
8.3
5.0
--
6.7
Dia
neK
emp
(2/2
0)5.
0-
-9.
3-
9.2
--
-7.
8
Dia
neK
emp
(2/2
3)15
.0-
-6.
7-
11.3
--
-11
.0
Dia
neK
emp
(2/2
4)-
-20
.07.
5-
10.3
--
-12
.6
Ave
rage
Len
gth
ofC
alls
11.4
10.0
11.3
11.2
-12
.512
.5-
-
Wei
gh
ted
Div
isio
nal
Ave
rage
s2.
72.
12.
14.
01.
04.
012
.5-
8.0
Infu
sion
Jenn
ifer
Ste
iner
(2/1
6)C
NII
--
--
1.0
1.0
1.0
-3.
01.
5
Jenn
ifer
Ste
iner
(2/1
8)-
-1.
00.
00.
81.
51.
21.
31.
01.
0
Jenn
ifer
Ste
iner
(2/2
3)1.
0-
-0.
50.
70.
31.
3-
2.4
1.0
Jen
nit
erS
tein
er(2
/25)
1.0
-2.
91.
01.
80.
61.
01.
01.
3
Ave
rage
Len
gth
ofC
alls
1.0
-1.
90.
51.
10.
81.
11.
31.
8
Wei
ghte
dD
ivis
iona
lA
vera
ge*
1.0
-1.
90.
51.
10.
81.
11.
31.
8
*Wel
ghte
dby
vo
lum
eof
call
sp
erp
erso
n,-
,IIo,t
cd
‘)I1
fll(
flth
rni,
nh
V97
IclR

fj
,.J
L1E
.:
]T
hfl
EF
.
Pho
neL
ogR
awD
ata
She
et4/
9/98
Ave
rage
Len
gth
ofC
alls
(mm
.)
.T
est
Phar
mac
yV
oice
Cas
eD
epar
tmen
tS
ched
uli
ng
Sy
mp
tom
..
..
Gen
eral
Wor
kP
erso
na)
Oth
erA
vera
geR
esult
sR
efil
lsM
aill
Pag
ing
Co
ord
inat
ion
Nep
hro
log
yC
athy
Bro
wn
(2/1
6)P
NP
-6.
56.
4-
-5.
32.
0-
-5.
1
Cat
hyB
row
n(2
/17)
-9.
012
.79.
6-
7.8
--
9.8
Cat
hyB
row
n(2
118)
2.8
9.0
5.0
10.7
-5.
6-
--
6.6
Cat
hyB
row
n(2
/19)
-10
.0-
11.3
-5.
5-
--
8.9
Cat
hyB
row
n(2
/20)
-7.
85.
89.
0-
5.8
--
-7.
1
Cat
hyB
row
n(2
/23)
-7.
9-
10.0
-6.
3-
--
8.1
Cat
hyB
row
n(2
/24)
6.6
7.5
15.7
12.5
--
-10
.6
Cat
hyB
row
n(2
/25)
-10
.75.
011
.3-
6.9
5.0
--
7.8
Cat
hyB
row
n(2
/26)
-8.
110
.012
.0-
5.3
5.0
-7.
58.
0
Cat
hyB
row
n(2
)27)
-6.
07.
010
.06.
93.
0-
12.7
7.6
Ave
rage
Len
gth
ofC
alls
2.8
8.2
7.4
11.1
-6.
83.
8-
10.1
Bre
nda
Pont
illo
(2/1
7)P
NP
3.0
-1.
89.
01.
35.
02.
9-
4.4
3.9
Bre
nda
Pont
illo
(2/1
8)-
2.0
1.0
5.0
-4.
73.
8-
2.0
3.1
Bre
nda
Pont
illo
(2/1
9)7.
81.
33.
07.
31.
04.
03.
0-
3.1
3.8
Bre
nda
Pont
illo
(2/2
3)3.
03.
32.
56.
34.
81.
5-
3.0
3.5
Bre
nda
Pont
illo
(2/2
4)-
5.0
3.0
4.0
-5.
6-
-3.
04.
1
Bre
nda
Pont
illo
(2/2
5)3.
0-
2.5
--
4.9
3.3
-2.
63.
2
Bre
nda
Pont
iNo
(2/2
6)-
3.3
--
-4.
0-
-4.
84.
0
Ave
rage
Len
gth
ofC
alls
4.2
3.0
2.3
6.3
1.2
4.7
2.9
-3.
3
Wei
ghte
dD
ivis
iona
lA
vera
g&1.
83.
72.
45.
01.
22.
91.
6-
2.0
Wel
ghte
dby
volu
me
ofca
lls
per
per
son
,$o
4‘)
f-j
,C1
Ith
rr,
,r,h
1197,g
R

..
EE:.r
.:
Pho
neL
ogR
awD
ata
She
et4/
9/98
Ave
rage
Len
gth
ofC
alls
(mm
.)
.T
est
Pha
rmac
yV
oice
Cas
eD
epar
tmen
tS
ched
ulin
g.
Sym
ptom
..
..
Gen
eral
Wor
kP
erso
nal
Oth
erA
vera
geR
esul
tsR
efil
lsM
aillP
ain
Coo
rdin
atio
n
TEA
M2
Neo
nat
olo
gy
Ann
ela
trow
(211
8)C
NIII
3.5
-1.
83.
01.
810
.22.
03.
5-
3.7
Ann
ela
trow
(212
0)-
--
-1.
03.
01.
42.
0-
1.8
Ann
ela
trow
(2/2
4)1.
0-
--
1.0
5.3
3.0
5.0
1.0
2.7
Ann
ela
trow
(2/2
5)-
•-
-1.
03.
0-
--
2.0
Ann
ela
trow
(2/2
7)4.
0-
--
-2.
5-
--
3.3
Ave
rage
Len
gth
ofC
aNs
2.8
-1.
83.
01.
24.
82.
13.
51.
0
Wei
gh
ted
Div
isio
nal
Ave
rage
’2.
8-
1.8
3.0
1.2
4.8
2.1
3.5
1.0
Neu
rolo
gy
Sue
Arm
stro
ng(2
/17)
CC
C-
5.5
2.0
7.7
-4.
516
.0-
3.0
6.4
Sue
Arm
stro
ng(2
/18)
-2.
5-
8.3
-3.
82.
0-
4.1
Sue
Arm
stro
ng(2
/19)
-1.
5-
6.0
-3.
38.
0-
3.5
4.5
Sue
Arm
stro
ng(2
/20)
-3.
0-
8.0
-3.
5-
4.0
4.6
Sue
Arm
stro
ng(2
/23)
-3.
51.
56.
7-
3.4
4.0
-1.
03.
3
Sue
Arm
stro
ng(2
/24)
-1.
75.
0-
4.0
7.5
-1.
03.
8
Sue
Arm
stro
ng(2
/25)
-3.
03.
317
.0-
5.8
3.0
-3.
05.
8
Sue
Arm
stro
ng(2
/26)
5.0
--
7.0
1.0
4.5
--
1.0
3.7
Sue
Arm
stro
ng(2
/27)
-2.
82.
76.
34.
03.
9-
-2.
53.
7
Ave
rage
Len
gth
otC
alls
5.0
2.9
2.9
8.4
2.5
4.0
6.8
-2.
4
Ann
Mar
ker
(2/1
6)C
Nii
-3.
5-
--
4.8
--
-4.
1
Ann
Mar
ker
(2/1
9)-
-4.
311
.9-
5.0
--
2.0
5.8
Ann
Mar
ker
(2/2
0)-
-4.
012
.4-
7.0
--
4.7
7.0
Ann
Mar
ker
(2/2
4)2.
07.
07.
315
.2-
--
-2.
36.
8
Ann
Mar
ker
(2/2
5)-
7.5
5.7
7.0
-9.
3-
-2.
26.
3
Ann
Mar
ker
(2/2
6)-
3.8
2.8
5.4
7.9
--
5.4
5.1
Ann
Mar
ker
(2/2
7)-
1.3
4.2
7.5
-6.
6-
-2.
04.
3
Ave
rage
Len
gth
ofC
alls
2.0
4.6
4.7
9.9
-6.
8-
-3.
1
WeI
gh
ted
byv
olu
me
ofca
lls
per
per
son
fli
l,rn
nrr
t(H
i‘)
!lfl
Iqth
rni
rhv
97
fq
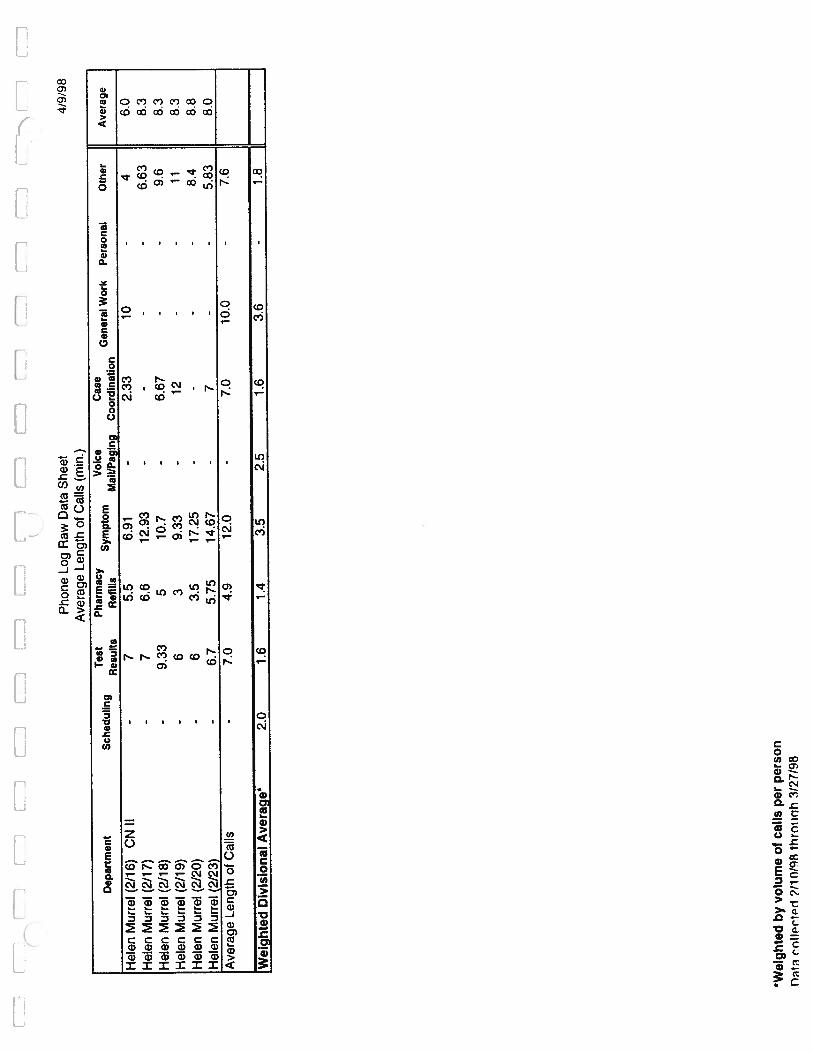
Pho
neL
ogR
awD
ata
Shee
t4)
9/98
Ave
rage
Len
gth
ofC
alls
(mm
.)
Tes
tP
harm
acy
Voi
ceC
ase
Dep
artm
ent
Sch
edul
ing
Sym
ptom
Gen
eral
Wor
kP
erso
nal
Oth
erA
vera
geR
esul
tsR
efil
lsM
ait/
Pag
ing
Coo
rdin
atio
n
Hel
enM
urie
l(2
/16)
CN
II-
75.
56.
91-
2.33
10-
46.
0
Hel
enM
urie
l(2
117)
-7
6.6
12.9
3-
--
6.63
8.3
Hel
enM
urie
l(2
/18)
-9.
335
10.7
-6.
67-
-9.
68.
3
Hel
enM
urre
l(2
/19)
-6
39.
33-
12-
-11
83
Hel
enM
urre
l(2
/20)
-6
3.5
17.2
5-
--
-8.
48.
8
Hel
enM
urie
l(2
/23)
-6.
75.
7514
.67
-7
--
5.83
8.0
Ave
rage
Len
gth
ofC
alls
-7.
04.
912
.0-
7.0
10.0
-7.
6
Wei
ghte
dD
ivis
iona
lA
vera
ges
2.0
1.6
1.4
3.5
2.5
1.6
3.6
-1.
8
aWei
ghte
dby
vo
lum
eof
call
spe
rp
erso
n
fla
troll
rtd
2110
198
thro
iiq
h31
2719
8

:E
E]
fl
Pho
neL
ogR
awD
ata
She
et4/
9/98
Ave
rage
Len
gth
ofC
alls
(mm
.)
.T
est
Pha
rmac
yV
oice
Cas
eD
epar
tmen
tS
ched
ulin
g.
Sym
ptom
.G
ener
alW
ork
Per
sona
lO
ther
Ave
rage
Res
ults
Ret
ills
Mai
UP
agin
Coo
rdin
atio
n
TEA
M3
En
do
crin
olo
gy
Kat
hyC
lark
(3/9
)P
NP
--
1.5
3.3
-1.
57.
0-
-3.
3
Kat
hyC
lark
(3/1
0)-
1.0
-2.
4-
-2.
71.
0-
1.8
Kat
hyC
lark
(3/1
1)-
-2.
04.
0-
1.8
2.0
1.0
1.0
2.0
Kat
hyC
lark
(3/1
3)2.
0-
-7.
0-
--
--
4.5
Kat
hyC
lark
(3/1
6)-
-2.
75.
74.
0-
1.0
--
3.3
Kat
hyC
lark
(3/1
7)3.
3-
2.0
4.5
2.0
1.5
3.1
--
2.7
Kat
hyC
lark
(3/1
8)4.
08.
0-
3.7
3.0
2.0
2.0
--
3.8
Kat
hyC
lark
(3/2
0)-
--
-6.
01.
5-
-1.
02.
8
Ave
rage
Len
gth
ofC
alls
3.1
4.5
2,0
4.4
3.8
1.7
3.0
1.0
1.0
Mar
gyFo
x(3
/13)
CN
S-
--
5.3
-2.
0-
-2.
03.
1
Mar
gyFo
x(3
/18)
10.4
--
--
5.0
4.5
-2.
05.
5
Mar
gyFo
x8.
9-
3.0
--
2.5
3.0
--
4.3
Ave
rage
Len
gth
ofC
alls
9.6
-3.
05.
3-
3.2
3.8
-2.
0
Wei
ghte
dD
ivis
iona
lA
vera
ges
4.4
4.5
1.1
2.2
3.8
1.1
1.5
1.0
0.8
Pu
lmo
nar
yP
hyll
isA
skew
(3/2
4)C
CC
5.4
2.7
6.0
5.1
1.0
-1.
0-
6.0
3.9
Phyl
lisA
skew
(3/2
5)1.
86.
02.
26.
71.
78.
053
-2.
04.
2
Phyl
lisA
skew
(3/2
6)1.
0-
4.0
22.0
1.7
-11
.0-
-7.
9
Phyl
lisA
skew
(3/2
7)-
-7.
02.
03.
518
.02.
0-
-6.
5
Ave
rage
Len
gth
ofC
alls
2.8
4.3
4.8
8.9
2.0
13.0
4.8
-4.
0
aWei
ghte
dby
vo
lum
eof
call
spe
rp
erso
n.
,.,
.I
.1I1flI
flf
lt),r,,,r,h
‘!‘)
7IC
)fl

n1.
F...
[—
—
Pho
neL
ogR
awD
ata
Shee
tA
vera
geL
engt
hof
Cal
ls(m
m.)
4/9
/98
.T
est
Pha
rmac
yV
oice
Cas
eD
epar
tmen
tS
ched
ulin
g.
Sym
ptom
..
.G
ener
alW
ork
Per
sona
lO
ther
Ave
rage
Res
ults
Ref
ills
Mai
l/P
agin
gC
oord
inat
ion
Juli
eK
onkl
e(3/
11)
CC
C-
-2.
09.
31.
16.
32.
02.
0-
3.8
Juli
eK
onkl
e(3
/12)
--
10.0
7.7
1.1
4.0
2.0
--
5.0
Juli
eK
onkl
e(3
/13)
--
-10
.81.
03.
92.
4-
-4.
5
Juli
eK
onkl
e(3
/16)
-4.
76.
01.
23.
42.
33.
0-
3.4
Juli
eK
onki
e(3
/18)
-2.
03.
06.
01.
24.
53.
3-
2.0
3.2
Juli
eK
onki
e(3
/19)
--
4.2
7.7
1.0
7.1
7.3
--
5.5
Juli
eK
onkl
e(3
/20)
--
4.6
7.8
1.9
6.8
2.5
--
4.7
Ave
rage
Len
gth
ofC
alls
-2.
04.
77.
91.
25.
23.
12.
52.
0
Nan
cyM
cInt
osh
(3/1
6)C
NS
3.0
4.0
-4.
31.
72.
02.
0-
3.0
2.9
Nan
cyM
cint
osh
(3/1
7)3.
3-
--
2.0
3.3
--
3.0
2.9
Nan
cyM
cint
osh
(3/1
9)-
--
6.0
1.0
3.0
--
3.0
3.3
Ave
rage
Len
gth
ofC
alls
3.2
4.0
-5.
21.
62.
82.
0-
3.0
Wei
ghte
dD
ivis
iona
lA
vera
ges
1.4
1.3
2.4
2.7
0.5
1.6
1.2
2.5
1.0
Pat
rici
aD
elam
eill
eure
(3/2
7)C
NII
--
--
1-
4.14
--
2.6
Pat
rici
aD
elam
eill
eure
(3/3
0)-
105
-1
7.14
--
-5.
8
Pat
rici
aD
elam
eill
eure
(3/3
1)-
--
-5
4.75
--
4.9
Ave
rage
Len
gth
ofC
alls
-10
.05.
0-
1.0
6.1
4.4
--
Wei
ghte
dD
ivis
iona
lA
vera
g&-
10.0
5.0
-1.
06.
14.
4-
-
*Wel
ghte
dby
volu
me
ofca
lls
per
per
son
r+.
.....ii
,‘!
flH
lflth
rr
‘I’)
7!q
R

—-
E-:r
—j
Pho
neL
ogR
awD
ata
She
et4/
9/98
Num
ber
ofC
alls
Eac
hH
our
Per
Day
Dep
artm
ent
8:00
-9:
009:
00-
10:0
010
:00
-11
:00
11:0
0-12
:00
12:0
0-
1:00
1:00
-2:
002:0
0-3
:00
3:00
-4:
004:
00-
5:00
5:00
-6:
00
Nep
hro
log
yC
athy
Bro
wn
(2/1
6)P
NP
07
69
67
115
63
Cat
hyB
row
n(2
/17)
25
55
65
21
00
Cat
hyB
row
n(2
/18)
104
20
00
44
62
Cat
hyB
row
n(2
/19)
00
10
00
62
76
Cat
hyB
row
n(2
120)
67
99
102
65
65
Cat
hyB
row
n(2
/23)
16
00
05
00
32
Cat
hyG
row
n(2
/24)
24
50
30
20
00
Cat
hyB
row
n(2
/25)
28
30
43
17
50
Cat
hyB
row
n(2
/26)
61
00
04
66
75
Cat
hyB
row
n(2
/27)
81
41
86
45
55
Ave
rage
Num
ber
ofC
alls
/Ho
ur
3.7
4.3
3.5
2.4
3.7
3.2
4.2
3.5
4.5
2.8
Bre
nda
Pont
illo
(2/1
7)P
NP
34
03
43
52
82
Bre
nda
Pont
illo
(2/1
8)1
25
11
77
66
1
Bre
nda
Pont
illo
(2/1
9)2
108
79
62
11
1
Bre
nda
Pont
illo
(2/2
3)5
30
62
116
49
2
Bre
nda
Pont
illo
(2/2
4)5
00
01
04
54
3
Bre
nda
Pont
illo
(2/2
5)4
16
75
62
25
5
Bre
nda
Pont
illo
(2/2
6)6
01
13
38
10
0
Ave
rage
Num
ber
of
Cal
ls/H
ou
r3.
72.
92.
93.
63.
65.
14.
93.
04.
72.
0
Wei
ghte
dD
ivis
iona
lA
vera
ge*
7.4
7.2
6.4
6.0
7.3
8.3
9.1
6.5
9.2
4.8
*Wei
ghte
dby
day
spe
rw
eek
wor
ked
(out
ot5
days
)D
ata
coll
ecte
d21
10/9
8th
roug
h3/
27/9
8

••L
.••i
,•,
n-
•J
Th
Pho
neL
ogR
awD
ata
She
et4/
9/98
Num
ber
ofC
afls
Eac
hH
our
Per
Day
Dep
artm
ent
8:0
0-
9:00
9:00
-10
:00
10:0
0-
11:0
011
:00-
12:0
012
:00
-1:
001
:00
-2:0
02:
00-
3:00
3:00
-4:
004:0
0-
5:00
5:0
0-6
:00
TEA
M1
Gas
troen
tero
logy
Ron
naF
ogle
(2/1
6)C
NI
01
76
02
14
60
Ron
naF
ogle
(2/1
7)0
00
00
76
17
1
Ron
naF
ogle
(2/1
8)0
00
18
55
36
0
Ron
naF
ogle
(211
9)0
012
115
64
56
2
Ron
naF
ogle
(2/2
0)0
00
00
51
19
1
Ron
naF
ogle
(2/2
3)0
03
45
74
68
0
Ron
naF
ogle
(2/2
4)0
00
03
23
52
0
Ron
naF
ogle
(2/2
5)0
00
00
62
40
0
Ron
naF
ogle
(2/2
6)0
00
00
42
37
0
Ron
naF
ogle
(2/2
7)0
00
00
39
44
0
Ave
rage
Num
ber
ofC
alls
/Ho
ur
00.
12.
22.
22.
14.
73.
73.
65.
50.
4
Dia
neK
emp
(2/1
0)C
NS
10
01
30
00
01
Dia
neK
emp
(2/1
1)2
21
00
01
00
0
Dia
neK
emp
(2/1
2)2
30
00
01
00
0
Dia
neK
emp
(2/1
8)0
22
24
00
00
1
Dia
neK
emp
(2/1
9)0
20
20
00
00
7
Dia
neK
emp
(2/2
0)2
51
00
10
05
1
Dia
neK
emp
(2/2
3)1
15
00
10
00
0
Dia
neK
emp
(2/2
4)1
00
20
51
20
4
Ave
rage
Num
ber
ofC
alls
/Ho
ur
1.1
1.9
1.1
0.9
0.9
0.9
0.4
0.3
0.6
1.8
Wei
ghte
dD
ivis
iona
lA
vera
ge*
1.1
2.0
3.3
3.1
3.0
5.6
4.1
3.9
6.1
2.2
Infu
sion
Jenn
ifer
Ste
iner
(2/1
6)C
NII
03
10
20
00
00
Jenn
ifer
Ste
iner
(2/1
8)4
67
18
10
10
1
Jenn
ifer
Ste
iner
(2/2
3)1
102
11
00
00
0
Jenn
ifer
Ste
iner
(2/2
5)5
43
33
12
10
2
Ave
rage
Num
ber
ofC
alls
/Ho
ur
2.5
5.8
3.3
1.3
3.5
0.5
0.5
0.5
0.0
0.8
Wei
ghte
dD
ivis
iona
lA
vera
ge*
1.0
2.3
1.3
0.5
1.4
0.2
0.2
0.2
0.0
0.3
*Wei
ghte
dby
day
sper
wee
kw
orke
d(o
utof
5day
s)
Dat
aco
llec
ted
2110
/98
thro
ugh
3/27
/98

D..
.:
..j
..]
Th
Pho
neLo
gR
awD
ata
She
et4/
9/98
Num
ber
ofC
alls
Eac
hH
our
Per
Day
Dep
artm
ent
8:00
-9:
009
:00
-10
:00
10:0
0-
11:0
011
:00-
12:0
012
:00
-1:
001:
00-
2:00
2:00
-3:
003:
00-
4:00
4:0
0-
5:00
5:00
-6:
00
-—
-JE
AM
2.
—-
____________________
-
Neo
nat
olo
gy
Ann
eIa
trow
(2/1
8)C
NII
I9
12
12
10
22
0
Ann
ela
trow
(2/2
0)0
24
02
20
21
0
Ann
ela
trow
(2/2
4)2
12
00
72
30
0
Ann
ela
trow
(2/2
5)0
10
00
00
20
0
Ann
ela
trow
(2/2
7)0
00
00
12
00
0
Ave
rage
Num
ber
ofC
alls
/Hour
2.2
11.
60.
20.
82.
20.
81.
80.
60
Wei
ghte
dD
ivis
iona
lA
vera
ge*
1.3
0.6
1.0
0.1
0.5
1.3
0.5
1.1
0.4
0.0
Neu
rolo
gy
Sue
Arm
stro
ng(2
/17)
CC
C0
15
40
44
65
0
Sue
Arm
stro
ng(2
/18)
02
33
62
00
00
Sue
Arm
stro
ng(2
/19)
00
23
10
03
10
Sue
Arm
stro
ng(2
/20)
00
14
51
00
00
Sue
Arm
stro
ng(2
/23)
02
89
41
00
00
Sue
Arm
stro
ng(2
/24)
00
54
30
03
00
Sue
Arm
stro
ng(2
/25)
04
74
01
00
00
Sue
Arm
stro
ng(2
/26)
12
55
30
00
11
Sue
Arm
stro
ng(2
/27)
02
36
82
25
00
Ave
rage
Num
ber
ofC
alls
/Ho
ur
0.1
1.4
4.3
4.7
3.3
1.2
0.7
1.9
0.8
0.1
Ann
Mar
ker
(2/1
6)C
NII
00
16
00
00
00
Ann
Mar
ker
(2/1
9)0
23
51
47
24
0
Ann
Mar
ker
(2/2
0)0
00
04
15
20
0
Ann
Mar
ker
(2/2
4)0
23
31
21
34
0
Ann
Mar
ker
(2/2
5)0
00
02
92
52
0
Ann
Mar
ker
(2/2
6)0
34
42
34
211
0
Ann
Mar
ker
(2/2
7)0
02
66
15
40
0
Ave
rage
Num
ber
ofC
alls
/Ho
ur
0.0
1.0
1.9
3.4
2.3
2.9
3,4
2.6
3.0
0.0
WeI
ghte
dby
day
sp
erw
eek
wor
ked
(out
of5
day
s)
Dat
aco
llec
ted
2110
/98
thro
ugh
3/27
/98

Pho
neL
ogR
awD
ata
She
et4/
9/98
Num
ber
ofC
alls
Eac
hH
our
Per
Day
Dep
artm
ent
8:0
0-9
:00
9:0
0-1
0:0
010:0
0-1
1:0
011
:00-
12:0
012:0
0-1
:00
1:0
0-2
:00
2:0
0-3
:00
3:0
0-4
:00
4:0
0-5
:00
5:0
0-6
:00
Hel
enM
urre
l(2
/16)
CN
II2
52
30
63
51
0
Hel
enM
urie
l(2
/17)
73
53
05
22
40
Hel
enM
urie
l(2
/18)
44
24
11
43
30
Hel
enM
urie
l(2
/19)
13
32
41
00
00
Hel
enM
urie
l(2
/20)
22
22
31
00
00
Hel
enM
urre
l(2
/23)
24
74
23
31
40
Ave
rage
Num
ber
ofC
aIIs
JH
our
3.0
3.5
3.5
3.0
1.7
2.8
2.0
1.8
2.0
0.0
Wei
ghte
dD
ivis
iona
lA
vera
ge*
3.1
5.7
9.3
10.4
6.8
6.3
5.4
5.8
5.2
0.1
awei
gh
ted
byday
sper
wee
kw
ork
ed(o
utof
5d
ays)
Dat
aco
llec
ted
2110
/98
thro
ugh
3/27
/98

Pho
neL
ogR
awD
ata
She
et4/
9/98
Num
ber
ofC
alls
Eac
hH
our
Per
Day
Dep
artm
ent
8:00
-9:
009:
00-
10:0
010
:00
-11
:00
11:0
0-12
:00
12:0
0-
1:00
1:00
-2:
002:
00-
3:00
3:00
-4:
004:
00-
5:00
5:0
0-
6:00
TA
IA
’.
‘.
;rm.
-_
L4
En
do
crin
olo
gy
Kat
hyC
lark
(3/9
)P
NP
23
01
03
20
00
Kat
hyC
lark
(3/1
0)0
65
00
74
10
0
Kat
hyC
lark
(3/1
1)0
11
41
20
02
0
Kat
hyC
lark
(3/1
3)0
31
10
00
00
0
Kat
hyC
lark
(3/1
6)0
41
60
00
00
0
Kat
hyC
lark
(3/1
7)0
23
95
10
00
0
Kat
hyC
lark
(3/1
8)0
25
22
01
15
0
Kat
hyC
lark
(3/2
0)0
21
01
00
00
0
Ave
rage
Num
ber
of
Cal
ls/H
ou
r0.
32.
92.
12.
91.
11.
60.
90.
30.
90.
0
Mar
gyFo
x(3
/13)
CN
S3
22
00
00
00
0
Mar
gyFo
x(3
/18)
48
30
00
23
00
Mar
gyFo
x3
21
93
21
15
0
Ave
rage
Num
ber
ofC
alls
/Ho
ur
3.3
4.0
2.0
3.0
1.0
0.7
1.0
1.3
1.7
0.0
Wei
ghte
dD
ivis
iona
lA
vera
ge*
2.2
4.7
2.9
4.1
1.5
1.7
1.3
11.
70
Pu
lmo
nar
yPh
yllis
Ask
ew(3
/24)
CC
C0
20
42
96
46
0
Phyl
lisA
skew
(3/2
5)6
98
64
68
69
0
Phyl
lisA
skew
(3/2
6)4
00
61
10
00
0
Phyl
lisA
skew
(3/2
7)0
03
50
00
00
0
Ave
rage
Num
ber
ofC
alls
!H
our
2.5
2.8
2.8
5.3
1.8
4.0
3.5
2.5
3.8
0.0
Julie
Kon
kle
(3/1
1)C
CC
17
58
56
05
20
Juli
eK
onkl
e(3
/12)
00
311
82
42
10
Juli
eK
onkl
e(3
/13)
15
19
90
00
00
Juli
eK
onkl
e(3
/16)
56
25
08
51
00
Juli
eK
onkl
e(3
/18)
314
96
43
30
00
Juli
eK
onkl
e(3
/19)
46
24
43
53
00
Juli
eK
onkl
e(3
/20)
46
95
26
75
10
Ave
rage
Num
ber
ofC
alls
/Ho
ur
2.6
6.3
4.4
6.9
4.6
4.0
3.4
2.3
0.6
0.0
Wei
gh
ted
byday
sp
erw
eek
work
ed(o
utof
5day
s)
Dat
aco
llec
ted
2110
198
thro
ugh
3/27
/98

Pho
neL
ogR
awD
ata
She
et4/
9198
Num
ber
ofC
alls
Eac
hH
our
Per
Day
Dep
artm
ent
8:0
0-9
:00
9:00
-10
:00
10:0
0-
11:0
011
:00-
12:0
012
:00
-1:
001:
00-
2:00
2:00
-3:
003:
00-
4:00
4:00
-5:
005:
00-
6:00
Nan
cyM
cint
osh
(3/1
6)C
NS
08
62
03
00
00
Nan
cyM
cint
osh
(3/1
7)0
67
20
50
06
0
Nan
cyM
cint
osh
(3/1
9)0
12
00
03
30
1
Ave
rage
Num
ber
ofC
alls
/Ho
ur
0.0
5.0
5.0
1.3
0.0
2.7
1.0
1.0
2.0
0.3
Wei
ghte
dD
ivis
iona
lA
vera
ge*
4.6
11.8
10.3
11.8
5.4
9.3
7.0
5.1
5.8
0.3
infu
sion
Pat
rici
aD
elam
eill
eure
(3/2
7)C
NII
02
10
02
11
10
Pat
rici
aD
elam
eill
eure
(3/3
0)0
00
02
23
30
0
Pat
rici
aD
elam
eill
eure
(3/3
1)2
03
13
10
30
0
Ave
rage
Num
ber
of
Cal
ls/H
ou
r0.
70.
71.
30.
31.
71.
71.
32.
30.
30.
0
Wei
ghte
dD
ivis
iona
lA
vera
ge*
0.5
0.5
1.1
0.3
1.3
1.3
1.1
1.9
0.3
0.0
Wei
gh
ted
byd
ays
per
wee
kw
orke
d(o
utof
5da
ys)
Dat
aco
llec
ted
2110
/98
thro
ugh
3/27
/98

‘.1
:,j
Pho
neL
ogR
awD
ata
She
et4/
9/98
Num
ber
ofC
alls
To/
Fro
mW
hom
Per
Day
Pag
ing
Noic
eS
ecre
tary
?D
epar
tmen
tP
atie
nt/
Par
ent
Phy
sici
anP
har
mac
ist
Lab
orat
ory
Mai
lN
urse
Cle
rkS
choo
lO
ther
TEA
M1
Gas
troen
tero
logy
Ron
naF
ogle
(2/1
6)C
NI
213
00
01
00
1
Ron
naF
ogle
(2/1
7)13
00
00
80
01
Ron
naF
ogle
(211
8)15
60
06
30
00
Ron
naF
ogle
(2/1
9)28
41
12
84
03
Ron
naF
ogle
(2/2
0)11
21
01
00
02
Ron
naF
ogle
(2/2
3)20
13
00
60
07
Ron
naF
ogle
(212
4)9
20
01
20
01
Ron
naF
ogle
(212
5)6
00
01
10
02
Ron
naF
ogle
(212
6)12
10
11
00
01
Ron
naF
ogle
(2/2
7)11
01
00
41
02
Ave
rage
Num
ber
ofC
alls
!D
ay14
.61.
90.
60.
21.
23.
30.
50
2
Dia
neK
emp
(2/1
0)C
NS
41
10
00
00
0
Dia
neK
emp
(2/1
1)5
00
00
10
00
Dia
neK
emp
(2/1
2)5
01
00
00
00
Dia
neK
emp
(2/1
8)7
31
00
00
00
Dia
neK
emp
(2/1
9)9
20
00
00
00
Dia
neK
emp
(2/2
0)6
60
10
10
01
Dia
neK
emp
(2/2
3)5
10
00
00
20
Dia
neK
emp
(2/2
4)7
51
00
10
01
Ave
rage
Num
ber
ofC
alls
!D
ay6.
02.
30.
50.
10.
00.
40.
00.
30.
3
Div
isio
nal
Wei
gh
ted
Av
erag
eCal
ls/D
ay*
20.6
4.2
1.1
0.3
1.2
3.7
0.5
0.3
2.3
Infu
sion
Jenn
ifer
Ste
iner
(2/1
6)C
NII
01
01
21
10
0
Jenn
ifer
Ste
iner
(2/1
8)0
04
24
38
08
Jenn
ifer
Ste
iner
(2/2
3)0
22
02
26
01
Jenn
ifer
Ste
iner
(2/2
5)0
37
16
23
02
Ave
rage
Num
ber
ofC
alls
!D
ay0.
01.
53.
31.
03.
52.
04.
50.
02.
8
Div
isio
nal
Wei
ghte
dA
ver
age
Cal
ls!
Day
*0.
00.
61.
30.
41.
40.
81.
80.
01.
1
aWei
ghte
db
yd
ays
per
wee
kw
ork
ed(o
utof
5d
ays)
Dat
aco
llec
ted
2110
/98
thro
ugh
3/27
/98

DE
EE
_
1
Pho
neL
ogR
awD
ata
She
et4/
9/98
Num
ber
ofC
alls
To/
Fro
mW
hom
Per
Day
Pag
ing/
Voi
ceS
ecre
tary
lD
epar
tmen
tP
atie
ntl
Par
ent
Phy
sici
anP
har
mac
ist
Lab
orat
ory
Mai
lN
urse
Cle
rkS
choo
lO
ther
Nep
hro
log
yC
athy
Bro
wn
(2/1
6)P
NP
329
38
06
21
0
Cat
hyB
row
n(2
/17)
222
33
01
00
0
Cat
hyB
row
n(2
/18)
195
11
01
30
2
Cat
hyB
row
n(2
/19)
127
00
00
00
3
Cat
hyB
row
n(2
/20)
3715
41
00
41
1
Cat
hyB
row
n(2
/23)
131
03
00
00
0
Cat
hyB
row
n(2
/24)
130
21
00
00
0
Cat
hyB
row
n(2
/25)
235
11
03
00
0
Cat
hyB
row
n(2
/26)
263
11
00
00
4
Cat
hyB
row
n(2
/27)
214
37
02
40
5
Ave
rage
Num
ber
ofC
aIIs
/D
ay21
.85.
11.
82.
60
1.3
1.3
0.2
1.5
Bre
nda
Pont
illo
(2/1
7)P
NP
41
50
32
130
6
Bre
nda
Pont
illo
(2/1
8)23
31
00
24
04
Bre
nda
Pont
illo
(2/1
9)20
42
31
58
04
Bre
nda
Pont
illo
(2/2
3)23
211
30
08
01
Bre
nda
Pont
illo
(2)2
4)17
31
00
00
01
Bre
nda
Pori
tillo
(2/2
5)19
62
00
07
09
Bre
nda
Pont
illo
(2/2
6)11
10
50
01
05
Ave
rage
Num
ber
ofC
alls
/D
ay16
.72.
93.
11.
60.
61.
35.
90.
04.
3
Div
isio
nal
Wei
ghte
dA
ver
age
Cal
ls/
Day
*38
.58.
04.
94.
20.
62.
67.
20.
25.
8
*Wei
ghte
dby
day
sp
erw
eek
wor
ked
(out
of5
day
s)D
ata
coll
ecte
d21
10/9
8th
rough
3/27
/98

rD.1
fl
Pho
neLo
gR
awD
ata
She
et4/
9/98
Num
ber
ofC
alls
To/
Fro
mW
hom
Per
Day
Pag
ingN
oice
Sec
reta
ry/
Dep
artm
ent
Pat
ient
lPar
ent
Phy
sici
anP
harm
acis
tL
abor
ator
yM
ail
Nur
seC
lerk
Scho
olO
ther
TE
AM
2N
eonat
olo
gy
Ann
ela
trow
(2/1
8)C
NII
I6
03
05
11
04
Ann
ela
trow
(212
0)0
00
03
31
06
Ann
ela
trow
(2/2
4)2
10
03
05
15
Ann
ela
trow
(2/2
5)0
00
02
00
01
Ann
ela
trow
(2/2
7)1
10
00
01
00
Ave
rage
Num
ber
ofC
alls
/D
ay1.
80.
40.
60
2.6
0.8
1.6
0.2
3.2
Div
isio
nal
Wei
ghte
dA
ver
age
Cal
ls!
Day
*1.
10.
20.
40.
01.
60.
51.
00.
11.
9
Neu
rolo
gyS
ueA
rmst
rong
(2/1
7)C
CC
200
00
08
00
0S
ueA
rmst
rong
(2/1
8)13
00
00
01
01
Sue
Arm
stro
ng(2
/19)
70
00
02
00
1S
ueA
rmst
rong
(2/2
0)6
30
00
00
02
Sue
Arm
stro
ng(2
/23)
161
22
01
00
1S
ueA
rmst
rong
(2/2
4)10
01
00
12
01
Sue
Arm
stro
ng(2
/25)
71
60
00
00
2S
ueA
rmst
rong
(2/2
6)14
00
00
20
02
Sue
Arm
stro
ng(2
/27)
170
32
01
20
3A
ver
age
Num
ber
ofC
alls
/D
ay12
.20.
61.
30.
40.
01.
70.
60.
01.
4
Ann
Mar
ker
(2/1
6)C
NII
40
02
00
00
0A
nnM
arke
r(2
119)
180
31
01
01
3A
nnM
arke
r(2
/20)
90
02
00
00
0A
nnM
arke
r(2
/24)
120
21
01
00
0A
nnM
arke
r(2
/25)
80
32
01
00
6A
nnM
arke
r(2
/26)
141
34
00
00
11A
nnM
arke
r(2
/27)
140
52
00
00
3A
ver
age
Num
ber
ofC
alls
/Day
11.3
0.1
2.3
2.0
0.0
0.4
0.0
0.1
3.3
awei
gh
ted
byd
ays
per
wee
kw
ork
ed(o
utof
5day
s)D
ata
coll
ecte
d2/1
0/9
8th
rough
3/27
/98

Pho
neL
ogR
awD
ata
She
et4/
9/98
Num
ber
ofC
alls
To/
Fro
mW
hom
Per
Day
Dep
artm
ent
Pat
ient/
Par
ent
Ph
ysi
cian
Ph
arm
acis
tL
abora
tory
Pag
ing/
Voi
ceN
urs
eS
ecr:
tary
/S
cho
ol
Oth
er
Hel
enM
urre
l(2
/16)
CN
II16
20
00
00
18
Hel
enM
urre
l(2
/17)
160
00
06
00
9
Hel
enM
urre
l(2
/18)
172
10
00
00
6
Hel
enM
urre
l(2
/19)
90
20
00
00
3
Hel
enM
urre
l(2
/20)
100
00
00
00
2
Hel
enM
urre
l(2
/23)
201
10
00
00
8
Ave
rage
Num
ber
ofC
alls
!D
ay14
.70.
80.
70.
00.
01.
00.
00.
26.
0
Div
isio
nal
Wei
ghte
dA
ver
age
Cal
ls!
Day
*35
.91.
53.
82.
00.
03.
00.
60.
310
.1
Wei
ghte
dby
day
spe
rw
eek
wor
ked
(out
of5
days
)D
ata
coll
ecte
d2/
10/9
8th
rough
3/27
/98

EE
EE
L.J
CE
.—
F.1
CE
.
Pho
neLo
gR
awD
ata
She
et4/
9/98
Num
ber
ofC
alls
To/
Fro
mW
hom
Per
Day
Pag
ing/
Voi
ceS
ecre
tary
/D
epar
tmen
tP
atie
nt/P
aren
tP
hysi
cian
Pha
rmac
ist
Lab
orat
ory
.N
urse
Sch
ool
Oth
erM
ail
Cle
rk
TA
}L3
*—
-
En
do
crin
olo
gy
Kat
hyC
lark
(3/9
)P
NP
80
20
00
00
1K
athy
Cla
rk(3
/10)
130
00
01
10
8K
athy
Cla
rk(3
/11)
20
20
02
20
3K
athy
Cla
rk(3
/13)
31
00
00
10
0K
athy
Cla
rk(3
/16)
50
50
10
00
0K
athy
Cla
rk(3
/17)
100
10
10
10
7K
athy
Cla
rk(3
/18)
91
31
10
20
1K
athy
Cla
rk(3
/20)
00
00
10
30
0A
ver
age
Num
ber
ofC
alls
!D
ay6.
30.
31.
60.
10.
50.
41.
30.
02.
5
Mar
gyFo
x(3
/13)
CN
S2
10
00
03
01
Mar
gyFo
x(3
/18)
113
00
01
21
1M
argy
Fox
202
30
00
10
0A
vera
geN
umbe
rof
Cal
ls!
Day
11.0
2.0
1.0
0.0
0.0
0.3
2.0
0.3
0.7
Div
isio
nal
Wei
gh
ted
Av
erag
eCal
ls/D
ay*
11.6
1.4
1.9
0.1
0.4
0.5
2.2
0.2
2.4
Pulm
on
ary
Phyl
lisA
skew
(3/2
4)C
CC
129
40
60
00
2Ph
yllis
Ask
ew(3
/25)
218
81
70
50
12Ph
yllis
Ask
ew(3
/26)
50
00
40
20
0Ph
yllis
Ask
ew(3
/27)
30
10
20
00
2A
vera
geN
umbe
rof
Cal
ls!
Day
10.3
4.3
3.3
0.3
4.8
0.0
1.8
0.0
4.0
Julie
Kon
kle
(3/1
1)C
CC
123
30
161
20
3Ju
lieK
onkl
e(3
/12)
105
00
75
30
1Ju
lieK
onkl
e(3
/13)
73
00
70
20
6Ju
lieK
onkl
e(3
/16)
113
30
40
00
11Ju
lie
Kon
kle
(3/1
8)12
73
213
01
13
Julie
Kon
kle
(3/1
9)17
16
02
00
14
Julie
Kon
kle
(3/2
0)14
55
011
01
09
Avera
geN
um
bero
fC
all
s/D
ay
11.9
3.9
2.9
0.3
8.6
0.9
1.3
0.3
5.3
*wel
ghte
dby
day
sp
erw
eek
work
ed(o
utof
5d
ays)
Dat
aco
llec
ted
2110
198
thro
ugh
3/27
/98

Pho
neL
ogR
awD
ata
She
et4/
9/98
Num
ber
ofC
alls
To/
Fro
mW
hom
Per
Day
Dep
artm
ent
Pat
ient/
Par
ent
Physi
cian
Ph
arm
acis
tL
abora
tory
Pag
ing
/Voic
eN
urs
eS
ecr:
tary
lS
cho
ol
Oth
er
Nan
cyM
cInt
osh
(3/1
6)C
NS
17
13
10
20
4
Nan
cyM
cint
osh
(3/1
7)7
80
20
21
05
Nan
cyM
cint
osh
(3/1
9)2
40
00
20
02
Ave
rage
Num
ber
ofC
alls
!D
ay3.
36.
30.
31.
70.
31.
31.
00.
03.
7
Div
isio
nal
Wei
gh
ted
Av
erag
eCal
ls/D
ay*
22.4
12.4
5.8
1.8
11.9
1.8
3.6
0.2
11.2
Infu
sion
Pat
rici
aD
elam
eill
eure
(3/2
7)C
NII
00
01
11
00
5
Pat
rici
aD
elam
eill
eure
(3/3
0)7
21
00
00
00
Pat
rici
aD
elam
eill
eure
(3/3
1)5
22
20
20
00
Ave
rage
Num
ber
ofC
alls
!D
ay4.
01.
31.
01.
00.
31.
00.
00.
01.
7
Div
isio
nal
Wei
ghte
dA
vera
geC
alls
!D
ay*
3.2
1.1
0.8
0.8
0.3
0.8
0.0
0.0
1.3
*Wel
ghte
dby
day
spe
rw
eek
wor
ked
(out
of5
days
)D
ata
coll
ecte
d21
10/9
8th
rough
3/27
198
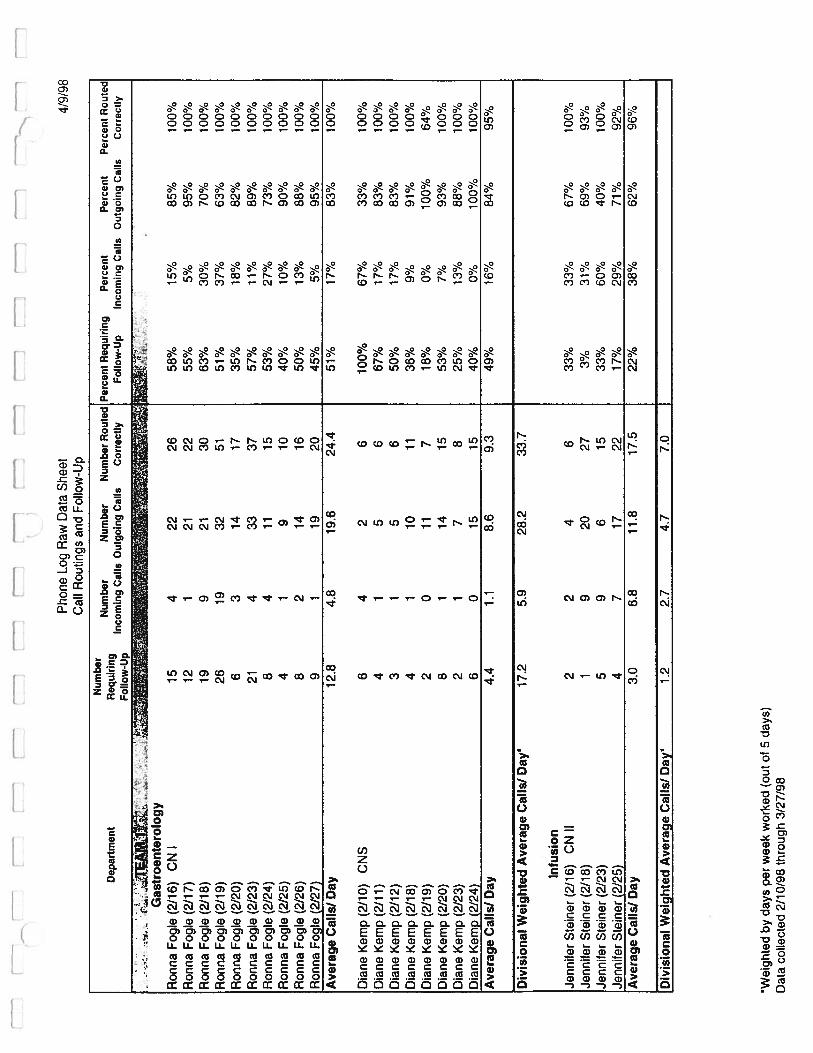
Pho
neLo
gR
awD
ata
She
etC
all
Rou
ting
san
dFo
llow
-Up
4/9/
98
Num
ber
.N
umbe
rN
umbe
rN
umbe
rR
oute
dP
erce
nt
Req
uiri
ngP
erce
ntP
erce
nt
Per
cen
tR
oute
dD
epar
tmen
tR
equi
ring
Fol
low
-Up
Inco
min
gC
alls
Out
goin
gC
alls
Cor
rect
lyF
ollo
w-U
pIn
com
ing
Cal
lsO
utgo
ing
Cal
lsC
orre
ctly
.4- G
astr
oen
tero
logy
Ron
naF
ogle
(2/1
6)C
NI
154
2226
58%
15%
85%
100%
Ron
naF
ogle
(2/1
7)12
121
2255
%5%
95%
100%
Ron
naF
ogle
(2/1
8)19
921
3063
%30
%70
%10
0%R
onna
Fog
le(2
/19)
2619
3251
51%
37%
63%
100%
Ron
naF
ogle
(2/2
0)6
314
1735
%18
%82
%10
0%R
onna
Fog
le(2
/23)
214
3337
57%
11%
89%
100’
/R
onna
Fog
le(2
/24)
84
1115
53%
27%
73%
100%
Ron
ria
Fog
le(2
/25)
41
910
40%
10%
90%
100%
Ror
ina
Fog
le(2
/26)
82
1416
50%
13%
88%
100%
Ron
naF
ogle
(2/2
7)9
119
2045
%5%
95%
100%
Ave
rage
Cal
ls!
Day
12.8
4.8
19.6
24.4
51%
17%
83%
100%
Dia
neK
emp
(2/1
0)C
NS
64
26
100%
67%
33%
100%
Dia
neK
emp
(2/1
1)4
15
667
%17
%83
%10
0%D
iane
Kem
p(2
/12)
31
56
50%
17°/a
83%
100%
Dia
neK
emp
(211
8)4
110
1136
%9%
91%
100%
Dia
neK
emp
(2/1
9)2
011
718
%0%
100%
64%
Dia
neK
emp
(2/2
0)8
114
1553
%7%
93%
100%
Dia
neK
emp
(2/2
3)2
17
825
%13
%88
%10
0%D
iane
Kem
p(2
/24)
60
1515
40%
0%10
0%100%
Ave
rage
Cal
ls!
Day
4.4
1.1
8.6
9.3
49%
16%
84%
95°/
a
Div
isio
nal
Wei
ghte
dA
vera
geC
alls
!D
ays
17.2
5.9
28.2
33.7
Infu
sion
Jenn
ifer
Ste
iner
(2/1
6)C
NII
22
46
33%
33%
67%
100%
Jenn
ifer
Ste
iner
(2/1
8)1
920
273%
31%
69%
93%
Jenn
ifer
Ste
iner
(2/2
3)5
96
1533
%60
%40
%10
0%Je
nnif
erS
tein
er(2
/25)
47
1722
17%
29%
71%
Av
erag
eCal
ls/D
ay3.
06.
811
.817
.522
%38
%62
%96
°/a
Div
isio
nal
Wei
ghte
dA
vera
geC
alls
!D
ays
1.2
2.7
4.7
7.0
*Wei
ghte
dby
days
per
wee
kw
orke
d(o
utof
5da
ys)
Dat
aco
llec
ted
2/10
/98
thro
ugh
3/27
/98

Pho
neLo
gR
awD
ata
She
et4/
9/98
Cal
lR
outi
ngs
and
Follo
W-U
p
Num
ber
..
Num
ber
Num
ber
Num
ber
Rou
ted
Per
cen
tR
equi
ring
Per
cen
tP
erce
nt
Per
cent
Rou
ted
Oep
artm
ent
Req
uiri
ng.
Fol
low
-Up
Inco
min
gC
alls
Out
goin
gC
alls
Cor
rect
lyF
ollo
w-U
pIn
com
ing
Cal
lsO
utgo
ing
Cal
lsC
orre
ctly
Nep
hrol
ogy
Cat
hyB
row
n(2
/16)
PN
P22
1050
6037
%l7
%83
%10
0%
Cat
hyB
row
n(2
)17)
107
2431
32%
23%
77%
100%
Cat
hyB
row
n(2
/18)
82
3032
25%
6%94
%10
0%
Cat
hyB
row
n(2
/19)
63
1922
27%
14%
86%
100%
Cat
hyB
row
n(2
120)
145
6065
22%
8%92
%10
0%
Cat
hyB
row
n(2
/23)
40
1717
24%
0%10
0%10
0%
Cat
hyB
row
n(2
/24)
83
1316
50%
19%
81%
100%
Cat
hyB
row
n(2
/25)
105
2833
30%
15%
85%
100%
Cat
hyB
row
n(2
/26)
98
2735
26%
23%
77%
100%
Cat
hyB
row
n(2
/27)
57
4047
11%
15%
85%
100%
Ave
rage
Cal
ls/D
ay9.
65
30.8
35.8
28%
14%
86%
100%
Bre
nda
Pont
illo
(2/1
7)P
NP
05
2934
0%15
%85
%10
0°/o
Bre
nda
Pont
illo
(2/1
8)8
631
3722
%16
%84
%10
0%
Bre
nda
Pont
illo
(2/1
9)9
740
4719
%15
%85
%10
0%
Bre
nda
Pont
illo
(2/2
3)2
741
484%
15%
85%
100%
Bre
nda
Pont
illo
(2/2
4)6
616
2227
%27
%73
%10
0%
Bre
nda
Pont
illo
(2/2
5)7
538
4316
%12
%88
%100%
Bre
nda
Pont
illo
(2/2
6)4
716
2317
%30
%70
%10
0%
Ave
rage
Cal
lsI
Day
5.1
6.1
30.1
36.3
15%
19%
81%
100%
Div
isio
nal
Wei
ghte
dA
vera
geC
alls
!D
ay*
14.7
11.1
60.9
72.1
Wei
ghte
dby
days
per
wee
kw
orke
d(o
utof
5da
ys)
Dat
aco
llec
ted
2/10
/98
thro
ugh
3/27
/98

Pho
neLo
gR
awD
ata
She
et4/
9/98
Cal
lR
outi
ngs
and
Follo
w-U
p
Num
ber
..
Num
ber
Num
ber
Num
ber
Rou
ted
Per
cent
Req
uiri
ngP
erce
nt
Per
cen
tP
erce
ntR
oute
dD
epar
tmen
tR
equi
ring
.
Fol
low
-Up
Inco
min
gC
alls
Out
goin
gC
alls
Cor
rect
lyF
ollo
w-U
pIn
com
ing
Cal
lsO
utgo
ing
Cal
lsC
orre
ctly
TEA
M2
Neo
nat
olo
gy
Ann
ela
trow
(2/1
8)C
NIII
32
1820
15%
10%
90%
100%
Ann
ela
trow
(2/2
0)1
112
138%
8%92
%10
0%A
nne
latr
ow(2
/24)
34
1317
18%
24%
76%
100%
Ann
ela
trow
(2/2
5)3
12
310
0%33
%67
%10
0%A
nne
latr
ow(2
/27)
00
33
0%0%
100%
100%
Ave
rage
Cal
lsI
Day
21.
69.
611
.228
%15
%85
%10
0%
Div
isio
nal
Wei
ghte
dA
vera
geC
alIs
iD
ay*
1.2
1.0
5.8
6.7
Neu
rolo
gyS
ueA
rmst
rong
(2/1
7)C
CC
1512
1628
54%
43%
57%
100%
Sue
Arm
stro
ng(2
/18)
60
1515
40%
0%10
0%10
0%S
ueA
rmst
rong
(2/1
9)1
19
1010
%10
%90
%10
0%S
ueA
rmst
rong
(212
0)4
38
1136
%27
°/a
73%
100%
Sue
Arm
stro
ng(2
/23)
92
2123
39%
9%91
%10
0%S
ueA
rmst
rong
(2/2
4)5
015
1533
%0%
100%
100%
Sue
Arm
stro
ng(2
/25)
13
1316
6%19
%81
%10
0%S
ueA
rmst
rong
(2/2
6)9
315
1850
%17
%83
%10
0%S
ueA
rmst
rong
(2/2
7)6
226
2821
%7%
93%
100%
Ave
rage
Cal
LsI
Day
6.2
2.9
15.3
18.2
32%
15%
85%
100%
Ann
Mar
ker
(2/1
6)C
NII
50
66
83%
0%10
0%10
0%A
nnM
arke
r(2
/19)
207
2128
71%
25%
75%
100%
Ann
Mar
ker
(2/2
0)0
211
130%
15%
85%
100%
Ann
Mar
ker
(2/2
4)4
315
1822
%17
%83
%10
0%A
nnM
arke
r(2
/25)
23
1720
10%
15%
85%
100%
Ann
Mar
ker
(2/2
6)13
231
3339
%6%
94%
100%
Ann
Mar
ker
(2/2
7)13
321
2454
%13
%88
%1
00
%A
ver
ageC
alls
lDay
8.1
2.9
17.4
20.3
40%
13%
87%
100%
Wei
ghte
dby
days
per
wee
kw
orke
d(o
utof
5da
ys)
Dat
aco
llec
ted
2/10
/98
thro
ugh
3/27
/98
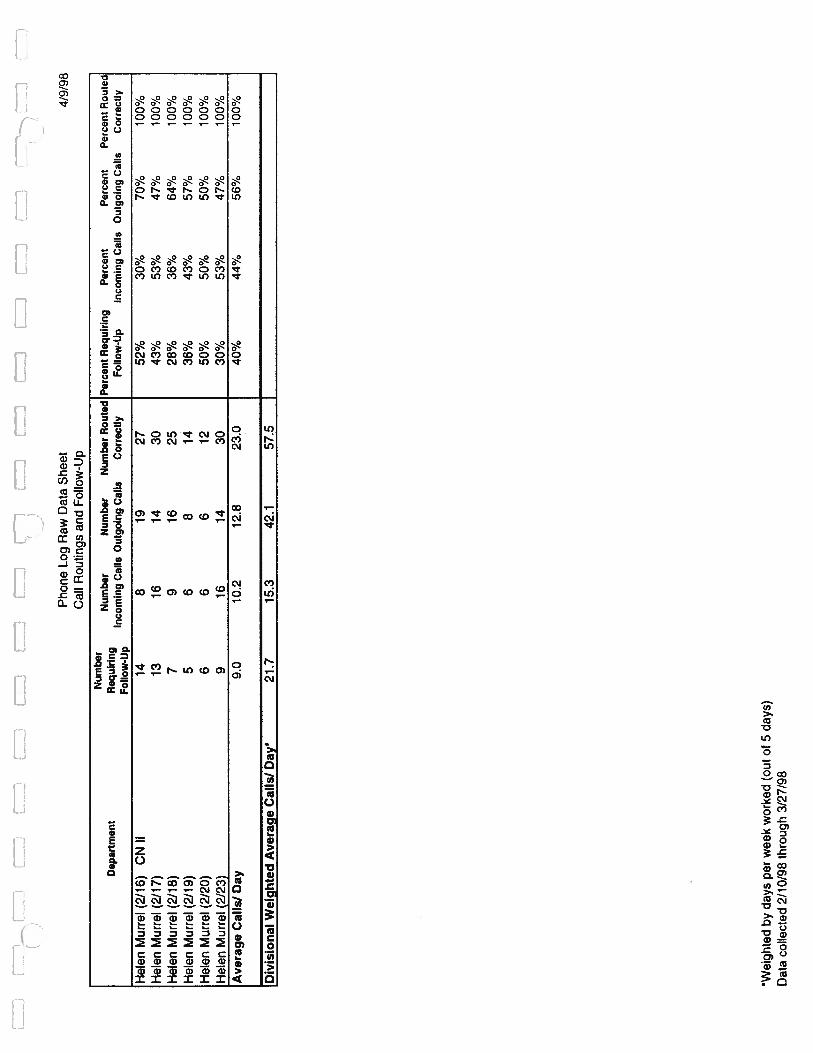
Ph
on
eL
og
Raw
Dat
aS
heet
4/9
/98
Cal
lR
outi
ngs
and
Fo
llo
w-U
p
Num
ber
..
Num
ber
Num
ber
Num
ber
Rou
ted
Per
cent
Req
uiri
ngP
erce
nt
Per
cen
tP
erce
ntR
oute
dD
epar
tmen
tR
equi
ring
Fol
low
-Up
Inco
min
gC
alls
Out
goin
gC
alls
Cor
rect
lyF
ollo
w-U
pIn
com
ing
Cal
lsO
utgo
ing
Cal
lsC
orre
ctly
Hel
enM
urr
el(2
/16)
CN
II14
81
927
52
%30%
70%
100%
Hel
enM
urr
el(2
/17)
13
16
14
30
43%
53%
47
%100%
Hel
enM
urr
el(2
/18
)7
91
625
28%
36%
64%
1000
/o
Hel
enM
urr
el(2
/19
)5
68
14
36
%43%
57%
100%
Hel
enM
uri
el(2
120)
66
61
25
0%
50%
50%
100%
Hel
enM
uri
el(2
/23
)9
16
14
30
30
%53%
47%
100%
Ave
rage
Cal
lsI
Day
9.0
10.2
12.8
23.0
40
%4
4%
56%
100%
Div
isio
nal
Wei
ghte
dA
vera
geC
alls
ID
ays
21.7
15.3
42.1
57.5
‘Wei
ghte
db
ydays
per
week
work
ed(o
ut
of5
day
s)
Dat
acoll
ecte
d2/
10/9
8th
rough
3/27
/98

:j
‘.
Pho
neLo
gR
awD
ata
She
et4/
9/98
Cal
lR
outi
ngs
and
Follo
w-U
pN
umbe
r.
.N
umbe
rN
umbe
rN
umbe
rR
oute
dP
erce
nt
Req
uiri
ngP
erce
nt
Per
cen
tP
erce
ntR
oute
dD
epar
tmen
tR
equi
ring
.V
Fol
low
-Up
Inco
min
gC
alls
Out
goin
gC
alls
Cor
rect
lyF
ollo
w-U
pIn
com
ing
Cal
lsO
utgo
ing
Cal
lsC
orre
ctly
-TE
AM
3E
ndocr
inolo
gy
Kat
hyC
lark
(3/9
)P
NP
85
611
73%
45%
55%
100%
Kat
hyC
lark
(3/1
0)13
518
2257
%22
%78
%96
%K
athy
Cla
rk(3
/11)
35
610
27%
45%
55%
91%
Kat
hyC
lark
(3/1
3)3
05
560
%0%
100%
100%
Kat
hyC
lark
(3/1
6)6
38
1155
%27
%73
%10
0%K
athy
Cla
rk(3
/17)
104
1619
50%
20%
80%
95%
Kat
hyC
lark
(3/1
8)10
810
1756
%44
%56
%94
%K
athy
Cla
rk(3
/20)
23
13
50%
75%
25%
75%
Ave
rage
Cal
ls!
Day
6.9
4.1
8.8
12.3
53%
35%
65%
94%
Mar
gyFo
x(3
/13)
CN
S1
25
714
%29
%71
%10
0%M
argy
Fox
(3/1
8)3
810
1717
%44
%56
%94
%M
argy
Fox
08
1927
0%30
%70
%10
0%A
vera
geC
alls
!D
ay1.
36.
011
.317
.010
%34
%66
%
Div
isio
nal
Wei
ghte
dA
vera
geC
alls
/D
ays
6.3
6.9
13.8
20.0
Pul
mon
ary
Phyl
lisA
skew
(3/2
4)C
CC
295
2833
88%
15°/
a85
%10
0%Ph
yllis
Ask
ew(3
/25)
4114
4861
66%
23%
77%
98%
Phyl
lisA
skew
(3/2
6)8
210
1267
%17
%83
%10
0%Ph
yllis
Ask
ew(3
/27)
60
88
75%
0%10
0%10
0%A
vera
geC
alls
!D
ay21
5.25
23.5
28.5
74%
14%
86%
100%
Juli
eK
onkl
e(3
/11)
CC
C29
931
4073
%23
°/a
78%
100%
Julie
Kon
kle
(3/1
2)20
822
2967
%27
%73
%97
%Ju
lieK
onkl
e(3
/13)
169
1625
64%
36%
64%
100%
Julie
Kon
kle
(3/1
6)17
626
3253
%19
°/o
81%
100%
Juli
eK
onkl
e(3
/18)
337
3542
79%
17%
83%
100%
Julie
Kon
kle
(3/1
9)19
229
3061
%6%
94%
97%
Julie
Kon
kle
(3/2
0)21
1035
4547
%22
%78
%10
0%A
vera
geC
alls
!D
ay22
.17.
327
.734
.763
%21
%79
%99
%
Wei
ghte
dby
days
per
wee
kw
orke
d(o
utof
5da
ys)
Dat
aco
llec
ted
2/10
/98
thro
ugh
3/27
/98
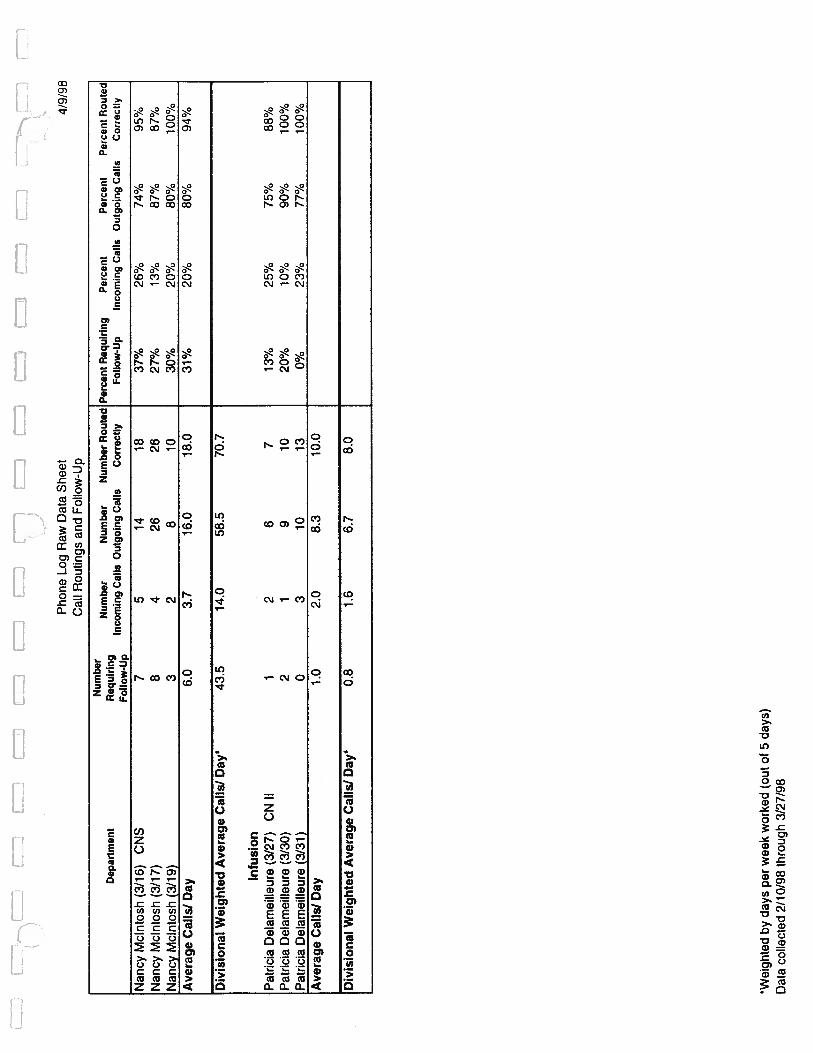
Pho
neLo
gR
awD
ata
She
et4/
9/98
Cal
lR
outi
ngs
and
Follo
w-U
p
Num
ber
..
Num
ber
Num
ber
Num
ber
Rou
ted
Per
cen
tR
equi
ring
Per
cen
tP
erce
ntP
erce
ntR
oute
dD
epar
tmen
tR
equi
ring
Fol
low
-Up
Inco
min
gC
alls
Out
goin
gC
alls
Cor
rect
lyF
ollo
w-U
pIn
com
ing
Cal
lsO
utgo
ing
Cal
lsC
orre
ctly
Nan
cyM
cint
osh
(3/1
6)C
NS
75
1418
37%
74%
95%
Nan
cyM
cint
osh
(3/1
7)8
426
2627
%13
%87
%87
%N
ancy
Mci
ntos
h(3
/19)
32
810
30%
200/
o80
%10
0%
Ave
rage
Cal
ls!
Day
6.0
3.7
16.0
18.0
31%
20%
80%
94%
Div
isio
nal
Wei
ghte
dA
vera
geC
aIls
ID
ays
43.5
14.0
58.5
70.7
Infu
sion
Pat
rici
aD
elam
eill
eure
(3/2
7)C
NII
12
67
13%
25%
75%
88%
Pat
rici
aD
elam
eill
eure
(3/3
0)2
19
1020
%10
0/0
90%
100%
Pat
rici
aD
elam
eill
eure
(3/3
1)0
310
130%
23%
77%
100%
Av
erag
eCal
ls!D
ay1.
02.
08.
310
.0
Div
isio
nal
Wei
ghte
dA
vera
geC
alls
!D
ays
0.8
1.6
6.7
8.0
Wei
ghte
dby
days
per
wee
kw
orke
d(o
utof
5da
ys)
Dat
aco
llec
ted
2/10
/98
thro
ugh
3/27
/98