pearson edexcel level 3 gce mathematics · in a factory, three machinists, amy, brad and ceri, are...
TRANSCRIPT

1
Pearson Edexcel Level 3 GCE Mathematics Advanced Level Paper 3: Statistics & Mechanics
Practice Paper I Time: 2 hours
Paper Reference(s) 9MA0/03
You must have: Mathematical Formulae and Statistical Tables, calculator
Candidates may use any calculator permitted by Pearson regulations. Calculators must not have the facility for algebraic manipulation, differentiation and integration, or have retrievable mathematical formulae stored in them. Instructions • Use black ink or ball-point pen. • If pencil is used for diagrams/sketches/graphs it must be dark (HB or B). • Answer all questions and ensure that your answers to parts of questions are clearly
labelled. • Answer the questions in the spaces provided – there may be more space than you need. • You should show sufficient working to make your methods clear. Answers without
working may not gain full credit. • Inexact answers should be given to three significant figures unless otherwise stated. Information • A booklet ‘Mathematical Formulae and Statistical Tables’ is provided. • There are 11 questions in this paper. The total is 100. • The for each question are shown in brackets – use this as a guide as to how much time to
spend on each question. Advice • Read each question carefully before you start to answer it. • Try to answer every question. • Check your answers if you have time at the end. • If you change your mind about an answer, cross it out and put your new answer and any
working underneath.

2
SECTION A: STATISTICS
Answer ALL questions.
1. The number of bacteria, n thousand per cm3, in a sample of liquid is measured over a period of time, t, in hours. The data is shown in the table.
t 3.9 5.5 6.8 8.5 10.6 11.5 13.3 14.7 16.5 17.8 n 10.1 13.1 14.6 20.7 27.9 31.5 40 49.9 64.7 75.6
The data is coded using the changes of variable x = t and y = log10 n. The regression line of y on x is found to be y = 0.7606 + 0.0635x. (a) Given that the data can be modelled by an equation of the form n = abt where a and b are
constants, find the values of a and b. (3)
(b) Give an interpretation of the constant a in this equation.
(1) (c) Explain why this model is not reliable for estimating the number of bacteria after 24 hours.
(1)
(Total 5 marks) _____________________________________________________________________________
3
2. In a factory, three machinists, Amy, Brad and Ceri, are used to sew shirts. Amy sews 40% of the shirts. Brad sews 35% of the shirts. Ceri sews the rest of the shirts. It is known that 5% of the shirts sewn by Amy are faulty, 2% of the shirts sewn by Brad are faulty and 3% of the shirts sewn by Ceri are faulty. (a) Draw a tree diagram to illustrate all the possible outcomes and associated probabilities.
(3) A shirt is selected at random. (b) Calculate the probability that the shirt is sewn by Brad and is not faulty.
(2) (c) Calculate the probability that the shirt is faulty.
(2) (d) Given that the shirt is faulty, find the probability that it was not sewn by Ceri.
(3)
(Total 10 marks) _____________________________________________________________________________________
3. The heights of a population of men are normally distributed with mean μ cm and standard deviation σ cm. It is known that 20% of the men are taller than 180 cm and 5% are shorter than 170 cm.
(a) Sketch a diagram to show the distribution of heights represented by this information.
(3) (b) Find the value of μ and σ.
(7) (c) Three men are selected at random, find the probability that they are all taller than 175 cm.
(2)
(Total 12 marks) _____________________________________________________________________________

4
4. The data and scatter diagram in Figure 1 show the population, p, in millions, of a country taken t years since their first census.
t 0 10 20 30 40 50 60 70 80 90 100
p 238.4 252.1 251.3 279 318.7 361.1 439.2 548.2 683.3 846.4 1028.7
Figure 1 (a) Give a reason why the data is coded using the changes of variable x = t and y = log10 p.
(1) (b) The product moment correlation coefficient for the coded data is r = 0.9735. Comment on r
for this model. (2)
(c) With reference to your answer to part (b), state whether a model in the form p = abt, where
a and b are constants, is a good fit for this data. (2)
(Total 5 marks) ____________________________________________________________________________________

5
5. A group of students were surveyed by a principal and were found to always hand in
assignments on time. When questioned about their assignments said they always start their
assignments on the day they are issued and, of those who always start their assignments on the
day they are issued, hand them in on time.
(a) Draw a tree diagram to represent this information.
(3)
(b) Find the probability that a randomly selected student (i) always start their assignments on the day they are issued and hand them in on time,
(2) (ii) does not always hand in assignments on time and does not start their assignments on
the day they are issued. (4)
(c) Determine whether or not always starting assignments on the day they are issued and
handing them in on time are statistically independent. Give reasons for your answer. (2)
(Total 11 marks) _____________________________________________________________________________
23
35
1120

6
6. A researcher wishes to investigate if there is a positive correlation between the number of vehicles and the number of road fatalities in European countries.
He selects a random sample of 10 European countries and records the number of vehicles, v per 1000 people, and the number of road fatalities, r per 100 000 population, for a particular year. These are shown in the table and scatter diagrams in Figure 2.
Country v r Austria 578 5.4 Belgium 559 6.7 France 578 5.1 Germany 572 4.3 Greece 624 9.1 Ireland 513 4.1 Italy 679 6.1 Luxembourg 739 8.7 Spain 593 3.7 UK 519 2.9

7
Figure 2 (a) What is the definition of a critical value?
(1) (b) The product moment correlaton coefficient for v and r is 0.714. Use this value to test for
positive correlation at the 5% significance level. Interpret your result in context. (3)
(c) The researcher wishes to predict the number of road fatalities for a country with 650
vehicles per 1000 people. Write down the regression model he should use. (1)
(d) State the dependent variable for the regression model in part (c).
(1)
(e) Monaco has 899 vehicles per 1000 people. Explain why the model stated in part (c) is not reliable for estimating the number of road fatalities in Monaco.
(1)
(Total 7 marks) _____________________________________________________________________________________

8
SECTION B: MECHANICS
Answer ALL questions.
7. An object has three different forces F1 N, F2 N and F3 N acting on its centre of mass.
F1 = and F2 = . The object is in equilibrium.
Find F3.
(Total 3 marks) _____________________________________________________________________________
8. A 0.1 kg inflatable ball floats on the surface of the sea. The current from the water underneath
the ball exerts a force C = N and the wind exerts a force of W = N on the ball.
(a) Find the resultant force exerted on the ball.
(2) (b) Calculate the acceleration of the ball.
(3)
Initially, the ball is at the origin and has velocity N m s−1.
(c) Find the x and y coordinates of the ball t s later.
(4) (d) Find the distance travelled by the ball when t = 10 s.
(5)
(Total 14 marks) ____________________________________________________________________________
÷÷ø
öççè
æ21
÷÷ø
öççè
æ-43
÷÷ø
öççè
æ12
÷÷ø
öççè
æ- 23
÷÷ø
öççè
æ11

9
9. Figure 3 shows Alice, who weighs 50 kg, sitting on the right-hand end of a light see-saw. Bob, who weighs 80 kg, stands on the opposite side at a distance x m from the end. The length of the see-saw is 4 m and it pivots about its centre.
Figure 3
(a) Draw a diagram showing the forces acting on the see-saw due to the two people. Label the
value of each force in newtons. (2)
(b) Write down the total clockwise moment about the centre in terms of x.
(5) (c) Find the value of x for which the see-saw is in equilibrium.
(2) (d) Given that Bob remains on the opposite side to Alice, describe with inequalities the range
of x for which the see-saw tilts towards Alice. (2)
(e) Describe one limitation of this model.
(1)
(Total 12 marks) _____________________________________________________________________________

10
10. A ball is launched from the origin with speed 1 m s−1. Its velocity vector makes an angle above the horizontal. It travels over flat ground and is modelled as a particle moving freely under gravity, as shown in Figure 4.
(In this question, take g = 10 m s−2.)
Figure 4
(a) Find the horizontal and vertical displacements of the particle at time t seconds. You should give your answer in terms of θ and t.
(4)
(b) Show that the horizontal distance travelled by the particle before it hits the ground is .
(5) (c) Find the value θ for which the horizontal distance travelled is a maximum.
(2) (d) Describe one limitation of this model.
(1)
(Total 12 marks) _____________________________________________________________________________
q
102sin θ
11
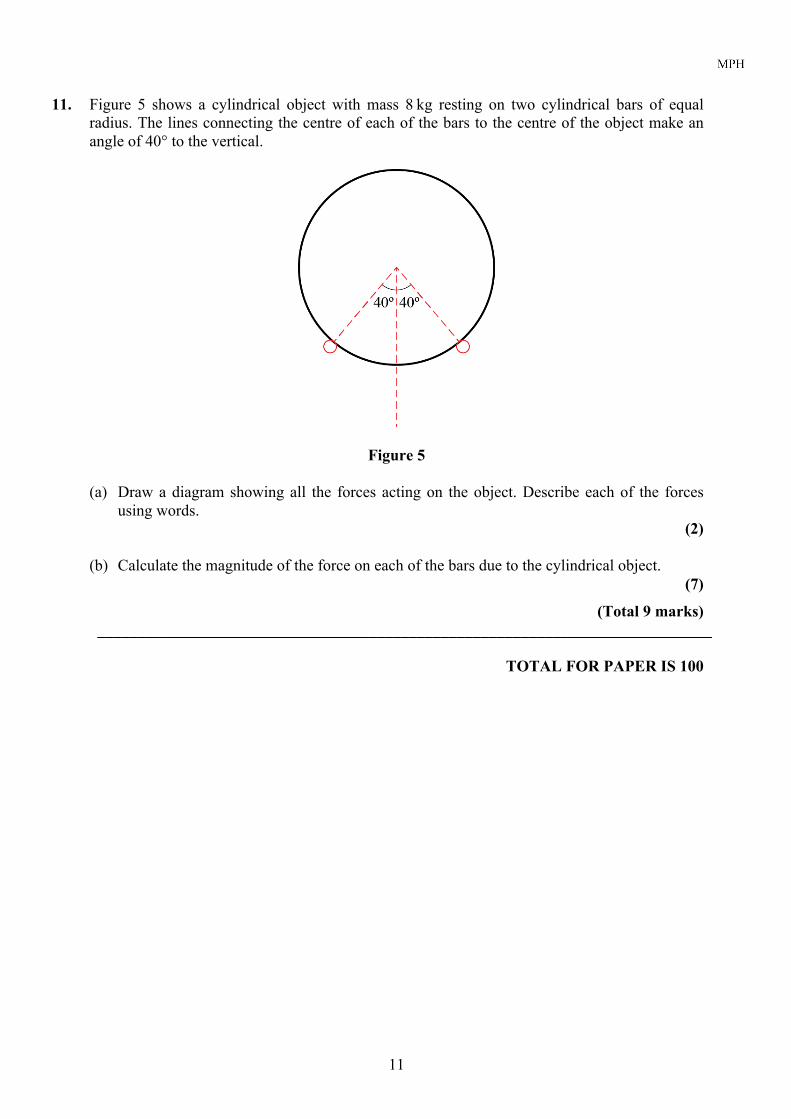
11. Figure 5 shows a cylindrical object with mass 8 kg resting on two cylindrical bars of equal radius. The lines connecting the centre of each of the bars to the centre of the object make an angle of 40° to the vertical.
Figure 5
(a) Draw a diagram showing all the forces acting on the object. Describe each of the forces using words.
(2) (b) Calculate the magnitude of the force on each of the bars due to the cylindrical object.
(7)
(Total 9 marks) _____________________________________________________________________________
TOTAL FOR PAPER IS 100

12
BLANK PAGE