peach market value chain profile commodity …nda.agric.za/docs/amcp/peachmvcp2009-2010.pdf ·...
TRANSCRIPT

COMMODITY PROFILE: PEACH
1. DESCRIPTION OF THE INDUSTRY Peaches are one of the most important deciduous fruits grown in South Africa, taking into consideration their foreign exchange earnings, employment creation and linkage with support institutions. In 2008, peaches contributed 11% of the total deciduous fruit. The South African peach industry relies heavily on the processing sector with over half of the peaches produced being absorbed by the processing market.
Figure 1: Total value of production, peaches
0
100000
200000
300000
400000
500000
600000
1998
/99
1999
/00
2000
/01
2001
/02
2002
/03
2003
/04
2004
/05
2005
/06
2006
/07
2007
/08
Years
R'00
0
Source: Agricultural Statistics The industry operates in a deregulated environment were prices are determined by the market forces of demand and supply. There has been a general increase on the total value of production particularly since 2005/06 with a 12% increase recorded in 2007/08. The increase was mainly due to amongst others increased exports and the weakening of the Rand against the Euro, Pound and the United States of America’s (USA). This is encouraging for the sector especially when one takes into consideration the lack of growth that characterized the industry between 2003/04 and 2005/06. That lack of growth was mainly due to amongst others severe droughts and floods in some areas of the Western Cape, major logistical problems and a sluggish demand in the United Kingdom and other European markets.
1
PEACH MARKET VALUE CHAIN PROFILE

1.1 Production areas South Africa’s main peach producing areas are Little Karoo, Wolseley/Tulbagh and Ceres (all in the Western Cape). Western Cape Province account for more than half of all the peaches produced in South Africa.
0
500
1000
1500
2000
2500
3000
3500
Hect
ares
Areas
Figure 2: Peach production areas in 2008
Dessert Peaches 135 147 265 3 5 177 7 164 182 8 33 253
Cling Peaches 3249 1110 1155 394 338 91 232 16 22 160 157 185
Little Karoo
Wolseley/ Tulbagh
Ceres Southern Cape
Worcester
Piketberg Villiersdorp
Limpopo Free State
Hex Valley
Langkloof East
Others
Source: Deciduous Fruit Producers Trust Tree Census 2008 Figure 2 shows that in terms of the area planted for peaches in hectares, the Little Karoo accounted for 3 384 ha (135 ha for dessert peaches and 3 249 ha for cling peaches), Wolseley/Tulbagh accounted for 1 257 ha (147 ha for dessert peaches and 1 110 ha for cling peaches) and Ceres accounted for 1 420 ha (265 ha for dessert peaches and 1 155 ha for cling peaches). Total production area for peaches in 2008 was 8490 hectares (ha). This represents a 2% decrease from the 2007 production year. 1.2 Production Peach production trends planted from 1998/99 to 2007/08 are presented in Figure 3.
2

Figure 3: Total South African peach production, 1998/99 – 2007/08
0
50000
100000
150000
200000
250000
300000
1998
/99
1999
/00
2000
/01
2001
/02
2002
/03
2003
/04
2004
/05
2005
/06
2006
/07
2007
/08
Years
Tons
Source: Agricultural Statistics Generally, peach production has maintained a relatively constant pattern over the past decade. Figure 3 shows that the total peach production decreased by 29% in 2003/04 after a steady increase from 2000/01 to 2002/03. That may have been due to unfavourable climatic conditions. 1.3 Cultivars grown in South Africa Figures 4 and 5 show the leading cultivars in South Africa for both dessert and cling peaches in 2008. South Africa’ main dessert peach cultivars are Experimental, Transvalia, Sun Pedro, Sunsweet and Fairtime. At the same time, South Africa’ main cling peach cultivars are Keisie, Kakamas, Oom Sarel and Prof Neethling.
3
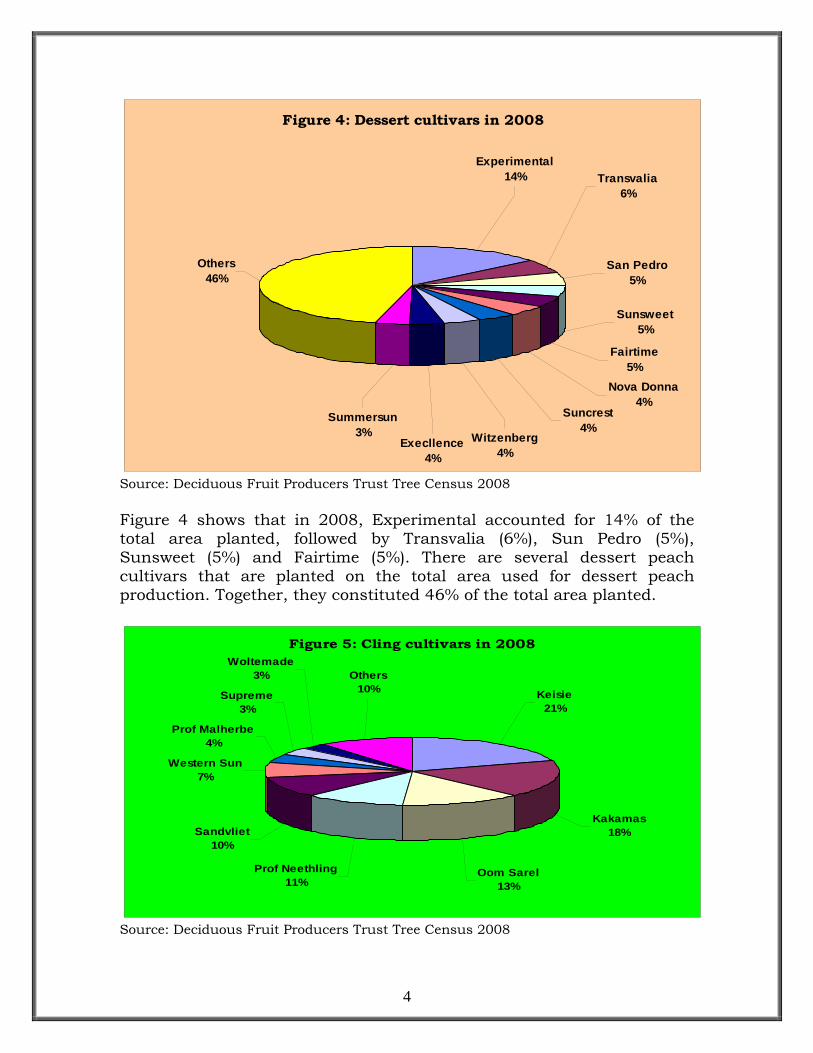
Figure 4: Dessert cultivars in 2008
Others46%
Summersun3%
Execllence4%
Witzenberg4%
Suncrest4%
Nova Donna4%
Fairtime5%
San Pedro5%
Sunsweet5%
Transvalia6%
Experimental14%
Source: Deciduous Fruit Producers Trust Tree Census 2008 Figure 4 shows that in 2008, Experimental accounted for 14% of the total area planted, followed by Transvalia (6%), Sun Pedro (5%), Sunsweet (5%) and Fairtime (5%). There are several dessert peach cultivars that are planted on the total area used for dessert peach production. Together, they constituted 46% of the total area planted.
Figure 5: Cling cultivars in 2008
Western Sun7%
Prof Malherbe4%
Supreme3%
Woltemade3%
Oom Sarel13%
Sandvliet10%
Prof Neethling11%
Others10% Keisie
21%
Kakamas18%
Source: Deciduous Fruit Producers Trust Tree Census 2008
4

Figure 5 shows that in 2008, Keisie accounted for 21% of the total area planted, followed by Kakamas (18%), Oom Sarel (13%) and Prof Neethling (11%). 1.4 Employment Full-time labourers employed on peach farms are primarily employed for a number of specialist tasks such as pruning and trellising of trees. Labour is also required to carry out thinning practices during blooming or during the first four weeks of fruit growth. Other tasks include harvesting, supervision, operational duties in the pack house, irrigation management, scouting for insects and diseases on a seasonal basis, tractor or forklift driving and grafting. Seasonal labour is employed on a contractual basis for a fixed period of time during harvesting the crop or fruit packing. The prescribed minimum wage is used as a baseline for determining basic wages in accordance with the legislation governing conditions of service. Much of this labour is drawn from the ranks of the unemployed persons in neighbouring towns. In some cases a system similar to the previous recruitment of migrant labourers continues to be used. The industry makes an important contribution to direct employment in the peach production and processing. It provides indirect employment for numerous support industries in the areas where peaches are grown. Direct employment within the industry was estimated at 10 217 people with 40 866 dependents in 2008.
5

2 MARKET STRUCTURE Figure 6 presents the distribution of the peach crop according to local market sales, the export market, dried fruit market, and the processing (canning) sector. It is clear from Figure 6 that between 70% and 80% of the total peach crop is being processed annually (canned). Peach processing is followed by the local market sales and dried market segments. Only a small percentage (3-5%) is being exported as fresh fruit.
Figure 6: Peach crop distribution, 1998/99 – 2007/08
020000400006000080000
100000120000140000160000180000200000
1998
/99
1999
/00
2000
/01
2001
/02
2002
/03
2003
/04
2004
/05
2005
/06
2006
/07
2007
/08
Years
Tons
Local Market Export Market Dried Processed
Source: Agricultural Statistics 2.1 Domestic markets and prices
6
Peach local market volumes and general price trends from 1998/99 to 2007/08 are represented by Figure 7 and Table 1.

Figure 7: Local peach sales and prices, 1998/99 – 2007/08
0
10000
20000
30000
40000
50000
60000
1998
/99
1999
/00
2000
/01
2001
/02
2002
/03
2003
/04
2004
/05
2005
/06
2006
/07
2007
/08
Years
Tons
0
1000
2000
3000
4000
5000
6000
7000
Ran
d/To
n
Local Market Average price in Rand/Ton
Source: Agricultural Statistics As illustrated in Figure 7, volumes of peaches at local markets have been generally stable from 1998/99 to 2007/08. The lack of growth in the local market may be due to a lack of coordinated marketing. The only significant increase experienced was a 43% increase in 2000/01. At the same time, local peach prices have been fluctuating, particularly from 2002/03. The general price trend has however been rising during the reference period. Table 1: Price trends of peaches, 1998/99 – 2007/08 Years Average price on
national markets in Rand/Ton
Export net realization in Rand/Ton
Processed average price in Rand/Ton
1998/99 R2 619.00 R6 429.12 R1 000.61 1999/00 R2 645.00 R8 802.85 R939.48 2000/01 R2 732.00 R6 753.85 R1 041.35 2001/02 R2 862.00 R7 526.53 R1 136.77 2002/03 R3 430.00 R8 625.93 R1 314.61 2003/04 R4 774.00 R10 957.66 R1 163.77 2004/05 R4 467.00 R8 256.77 R1 032.82 2005/06 R5 939.00 R7 943.19 R976.70 2006/07 R5 491.00 R9 102.00 R1 356.00 2007/08 R6 154.00 R10 188.00 R1 429.00
Source: Agricultural Statistics
7
As indicated in Table 1, South African peaches generally fetch high prices in the export markets. Price fluctuations in the past decade can be attributed to fluctuations in production volumes which occurred mainly

as a result of inconsistent weather conditions. Generally, real prices achieved particularly in exports did not improve that much. It is the weakening of the Rand against the Euro, Pound and the USA Dollar that contributed substantially to the better returns in 2007/08 when compared to 2006/07. 2.2 Exports South Africa is a relatively small peach grower in terms of global hectares. However, the country is a major volume exporter in global terms. Peaches sold in the export markets generate a greater unit price than that achieved on the local markets. Therefore a thorough understanding of the rules of the export markets is critical for success in peach production and marketing.
Figure 8: South African peach exports, 1998/99 – 2007/08
0
2000
4000
6000
8000
10000
12000
1998
/99
1999
/00
2000
/01
2001
/02
2002
/03
2003
/04
2004
/05
2005
/06
2006
/07
2007
/08
Years
Tons
0
2000
4000
6000
8000
10000
12000
Ran
d/To
n
Volume in tons Net Realisation in Rand/Ton
Source: Agricultural Statistics
8
The 2007/08 season saw an improvement in terms of both the price and volume exported when compared with the 2006/07 season. The impact of the 2005/2006 season’s drought in the Western Cape as well as unfavourable weather conditions during bloom, fruit set and fruit maturation is clearly visible in Figure 8. Total peach export volumes for 2007/08 increased when compared to both the 2006/07 and 2005/06 seasons, respectively. At the same time net realisation from exports has also been increasing. It went up by 11% when compared to the 2006/07

season and by 22% when compared to the 2005/06 season. The leading export destinations for South African peach exports are shown in Table 2.
Table 2: Export destinations for South African peaches in 2008
Importers Value exported in 2008 (US $ thousand)
Quantity exported in 2008 (Tons)
Unit value in US $
Share in South Africa’s exports, %
World 12 588 8 468 1 487 100 UK 5 218 3 299 1 582 41.5 Netherlands 2 650 1 151 2 302 21.1 UAE 2 512 2 705 929 20 Saudi Arabia 461 351 1 313 3.7 Switzerland 229 29 7 897 1.8 Mauritius 221 147 1 503 1.8 Belgium 124 68 1 824 1 France 105 73 1 438 0.8 Germany 86 58 1 483 0.7 Kenya 86 50 1 720 0.7
Source: International Trade Centre (ITC)
The United Kingdom (UK) and the Netherlands hold a bigger market share of South African peach exports according to Table 2. Together they constituted approximately 63% of South African peach exports in 2008. There are attempts to expand other markets like the Middle East countries such Saudi Arabia and United Arab Emirates (UAE). The aim is to increase the current 23.7% share. There are also attempts to increase fruits, fruit juices and fruit preparations since they qualify for duty free access under the African Growth and Opportunity Act (AGOA) to the United States of America (USA). Table 3: Leading peach exporters in 2008
9
Exporter Value exported in 2008 (US $) thousand
Quantity exported in 2008 (Tons)
Unit value in US $
Annual growth in value from 2004 – 2008, %
Annual growth in quantity from 2004 – 2008, %
Share in world exports, %
World 2149 189 1606 559 1 338 16 6 100 Spain 786 095 564 622 1 392 20 18 36.58 Italy 495 180 326 759 1 515 13 -6 23.04 USA 178 792 151 002 1 184 12 6 8.32 France 126 863 53 031 2 392 5 -6 5.9 Greece 117 520 102 968 1 141 17 -1 5.47 Chile 100 196 111 641 897 3 -2 4.66

Exporter Value exported in 2008 (US $) thousand
Quantity exported in 2008 (Tons)
Unit value in US $
Annual growth in value from 2004 – 2008, %
Annual growth in quantity from 2004 –
Share in world exports, %
2008, % Netherlands 44 190 21 372 2 068 17 2 2.06 Turkey 36 711 42 930 855 22 8 1.71 Belgium 34 336 17 457 1 967 20 10 1.6 Kyrgyzstan 24 008 14 039 1 710 267 216 1.12 Source: International Trade Centre (ITC) Table 3 shows that globally, Spain was the biggest exporter of peaches in 2008, exporting over US$786 million a year and accounting for 36.58% of world export market in peaches. Second was Italy with 23.04% market share followed by the USA (8.32%) and France (5.9%). Chile, ranked sixth in 2008, is the only significant peach exporter from the Southern hemisphere. In terms of annual growth between 2004 and 2008, peach exports from Kyrgyzstan increased by a staggering 267% and 216% in value and quantity, respectively. Another country that experienced high growth in both value and quantity is Turkey. The country increased its value and quantity by 22% and 8% respectively. Belgium increased its value and quantity by 20% and 10% respectively. It is important to note that majority of the EU countries such as Poland and Greece exports their peaches predominantly within the EU market. At the same time there were countries like Italy and France who both had a negative annual growth rate of 6% in quantity. 2.3 Provincial and district export values of South African peaches A review of provincial level trade data shows that the Western Cape Province is the major source of peaches destined for the export markets. The reason for that is the fact that the Western Cape Province is the major producer of peaches accounting for over half of total production. Secondly, the registered exporters are based in the province and thirdly, the province serves as an exit point for peach exports through the Cape Town harbour. Figure 9 depicts the value of peach exports from each province of the Republic of South Africa.
10

Figure 9: Value of peach exports by provinces, 1999 - 2008
0
100000000200000000
300000000
400000000
500000000600000000
700000000
800000000900000000
1000000000
Years
Ran
ds
Western Cape 515397343361274355449802464495994471518387850579350539540417429439964456644045211885674960
Eastern Cape 1605320 878299 335386 5679827 7162430 12223176 5635505 4576234 5000956 5194367
Northern Cape 0 653820 0 0 0 0 145405 0 0 950175
Free State 3767734 1956213 658250 563275 1740842 400 0 0 0 0
Kw azulu-Natal 459741 2567515 6204091 14059666 13413612 2719251 4310799 2335687 3816060 6852703
North West 0 0 17892 863763 0 339499 0 0 0 0
Gauteng 30441909 39845516 56842842 93296859 93889619 85221729 74468734 52254179 51096960 57964616
Mpumalanga 6719 0 0 83208 1416415 14115 36240 292 0 2826
1999 2000 2001 2002 2003 2004 2005 2006 2007 2008
Source: Quantec Easy data Highlights in Figure 9 were that the provinces of Western Cape and to a lesser extend Gauteng were consistently the top peach exporting provinces of South Africa over the last decade. Other provinces featured intermittently but usually registered minimal trade. Figures 10 to 18 show the value of peach exports from the various districts in the nine provinces of South Africa.
11

Figure 10: Value of peach exports by the Western Cape Province, 1999 – 2008
0
100000000
200000000
300000000
400000000
500000000
600000000
Years
Ran
ds
West Coast 13805377 5405396 16863384 26501491 13442783 19550445 7102861 9457147 22354642 21322107
Cape Winelands 25614124 50856108 99481571 159065004 187404375 225028602 232222841 144726634 179909499 337960924
Overberg 17046647 2735159 6532697 5313921 10317792 2496129 4802776 1803586 8826125 11377727
Eden 333432 925471 823214 1004149 842482 1546126 777710 387483 928818 453430
City Of Cape Tow n 458597764 301352221 326101599 304109906 306380418 330729238 295511242 283589605 432026127 514560773
1999 2000 2001 2002 2003 2004 2005 2006 2007 2008
Source: Quantec Easy data It is clear from Figure 10 that peach exports from the Western Cape province are mainly from the City of Cape Town and Cape Winelands municipalities. High export values for the leading districts were recorded in 2008 (for both the City of Cape Town and Cape Winelands). As mentioned earlier on, the use of the Cape Town harbour as an exit point may have played a major role in the metropolitan municipality being a leader in the export of peaches from the Western Cape.
Figure 11: Value of peach exports by Gauteng Province, 1999 – 2008
0
10000000
20000000
30000000
40000000
50000000
60000000
Years
Rand
s
Sedibeng 0 0 0 0 0 4094243 4590359 2325722 12296528 14527854
City Of Tshw ane 10981822 25006008 30087026 39799943 50953425 40372440 31254401 15711363 0 2495193
Metsw eding 0 0 0 0 0 0 0 1076312 967635 0
West Rand 3035611 0 555101 0 445817 0 1739553 0 3561779 4805414
Ekurhuleni 4510218 7622981 17482730 33011956 20191841 17808068 12201545 13314784 15939301 14565301
City Of Johannesburg 11914258 7216527 8717985 20484960 22298536 22946977 24682876 19825998 18331716 21570854
1999 2000 2001 2002 2003 2004 2005 2006 2007 2008
Source: Quantec Easy data
12

In the Gauteng province, the leading role players in the export of peaches for the past ten years have been the City of Johannesburg, City of Tshwane and Ekurhuleni metropolitan municipalities. High export values of the leading municipalities were recorded in 2002 (for Ekurhuleni), 2003 (for the City of Tshwane) and in 2005 (for the City of Johannesburg).
Figure 12: Value of peach exports by the Kwa-Zulu Natal Province, 1999 – 2008
0
5000000
10000000
15000000
Years
Rand
s
Ugu 0 0 0 0 0 1164475 0 0 0 0
Umgungundlovu 0 0 0 191843 0 0 0 0 0 0
Amajuba 0 0 0 0 32502 0 0 0 0 0
Uthungulu 0 0 11726 491 0 1208 1962 0 0 0
Ilembe 0 0 839710 0 0 0 0 0 0 0
Ethekw ini 459741 2567515 5352655 13867332 13381110 1553568 4308837 2335687 3816060 6852703
1999 2000 2001 2002 2003 2004 2005 2006 2007 2008
Source: Quantec Easy data It is clear from Figure 12 that peach exports from the Kwa-Zulu Natal province are mainly from Ethekwini metropolitan municipality. High export value for the leading municipality was recorded in 2002. The use of the Durban harbour as an exit point may have played a major role in the metropolitan municipality being a leader in the export of peaches from Kwa-Zulu Natal.
13

Figure 13: Value of peach exports by the Eastern Cape Province, 1999 – 2008
0100000020000003000000
4000000500000060000007000000
8000000
Years
Rand
s
Cacadu 1605320 843299 194666 1698427 2514337 6885083 1565751 0 1091275 1058882
Amatole 0 0 0 0 362721 0 0 0 0 0
Nelson Mandela 0 35000 140720 3981401 4285372 5338093 4069754 4576234 3909681 4135485
1999 2000 2001 2002 2003 2004 2005 2006 2007 2008
Source: Quantec Easy data It is clear from Figure 13 that peach exports from the Eastern Cape Province are mainly from Cacadu and Nelson Mandela municipalities. High export values for the leading municipalities were recorded in 2004 (for both Cacadu and Nelson Mandela). The export value of Cacadu has dropped drastically from the 2004 peak.
Figure 14: Value of peach exports by the Free State Province, 1999 – 2008
0
500000
1000000
1500000
2000000
2500000
3000000
Years
Ran
ds
Motheo 0 0 0 151577 0 400 0 0 0 0
Lejw eleputsw a 1073141 1938137 0 411698 1740842 0 0 0 0 0
Thabo Mofutsanyane 2694593 18076 658250 0 0 0 0 0 0 0
1999 2000 2001 2002 2003 2004 2005 2006 2007 2008
Source: Quantec Easy data
14

In the Free State Province, there have been fluctuations on the peach export values for the past ten years. The leading role players in peach exports are Lejweleputswa and Thabo Mofutsanyane district municipalities. High export values for both municipalities were recorded in 1999 (for Thabo Mofutsanyane) and 2000 (for Lejweleputswa). Generally, all the district municipalities in the Free State have been decreasing their export values, particularly from 2004 (in case of Lejweleputswa) and from 2002 (in case of Thabo Mofutsanyane).
Figure 15: Value of peach exports by the Northern Cape Province, 1999 - 2008
0100000200000300000400000500000600000700000800000900000
1000000
Years
Rand
s
Siyanda 0 653820 0 0 0 0 145405 0 0 950175
1999 2000 2001 2002 2003 2004 2005 2006 2007 2008
Source: Quantec Easy data It is clear from Figure 15 that peach exports from the Northern Cape province are from Siyanda district municipality. High export value for the district municipality was recorded in 2008.
15

Figure 16: Value of peach exports by the Limpopo Province, 1999 – 2008
0
1000000
2000000
3000000
4000000
5000000
6000000
7000000
Years
Rand
s
Mopani 267 50993 0 0 0 0 0 936891 0 1834209
Vhembe 0 0 0 0 6726 0 0 4898 0 0
Waterberg 0 0 0 0 0 0 0 0 3131324 6149319
1999 2000 2001 2002 2003 2004 2005 2006 2007 2008
Source: Quantec Easy data It is clear from Figure 16 that peach exports from the Limpopo province are mainly from Mopani and Waterberg district municipalities. High export values for the leading district municipalities were recorded in 2008 (for both Mopani and Waterberg).
Figure 17: Value of peach exports by the North West Province, 1999 – 2008
0100000200000300000400000500000600000700000800000900000
1000000
Years
Rand
s
Bojanala Platinum 0 0 17892 863763 0 339499 0 0 0 0
1999 2000 2001 2002 2003 2004 2005 2006 2007 2008
Source: Quantec Easy data
16

It is clear from Figure 17 that peach exports from the North West province are mainly from Bojanala district municipality. High export value for the leading district municipality was recorded in 2002.
Figure 18: Value of peach exports by the Mpumalanga Province, 1999 – 2008
0
200000
400000
600000
800000
1000000
Years
Rand
s
Gert Sibande 0 0 0 0 828391 0 0 0 0 0
Nkangala 6719 0 0 81197 582516 14115 0 0 0 2826
Ehlanzeni 0 0 0 2011 5508 0 36240 292 0 0
1999 2000 2001 2002 2003 2004 2005 2006 2007 2008
Source: Quantec Easy data It is clear from Figure 18 that peach exports from Mpumalanga province are mainly from Nkangala and Ehlanzeni district municipalities. High export values for the leading municipalities were recorded in 2003 (for Nkangala) and 2005 (for Ehlanzeni). Gert Sibande only recorded high export value for the province in 2003. 2.4 Share Analysis Table 4 is an illustration of provincial share towards national peach exports for the years 1999 to 2008. It shows that Western Cape together with Gauteng Province (to a lesser extend) have commanded the greatest share of peach exports for the past ten years. As explained earlier, this means that the leading export provinces (Western Cape and Gauteng) derive their advantage from the fact that the registered exporters are based in their provinces and they also have exit points for peach exports.
17

Table 4: Share of provincial peach exports to the total RSA peach exports (%), 1999 – 2008 Years Province
1999
2000
2001
2002
2003
2004
2005
2006
2007
2008
Western Cape
93.4 88.7 87.5 81.2 81.5 85.2 86.4 88.0 91.1 91.8
Eastern Cape
0.3 0.2 0.1 0.9 1.1 1.8 0.9 0.9 0.7 0.5
Northern Cape
0 0.2 0 0 0 0 0.1 0 0 0.1
Free State 0.7 0.5 0.1 0.1 0.3 0 0 0 0 0 Kwa Zulu Natal
0.1 0.6 1.2 2.3 2.1 0.4 0.7 0.5 0.5 0.7
North West 0 0 0 0.1 0 0.1 0 0 0 0 Gauteng 5.5 9.8 11.1 15.3 14.8 12.5 11.9 10.4 7.2 6.0 Mpumalanga 0 0 0 0.1 0.2 0 0 0 0 0.1 Limpopo 0 0 0 0 0 0 0 0.2 0.5 0.8 South Africa 100 100 100 100 100 100 100 100 100 100 Source: Calculated from Quantec Easydata The accompanying tables (Table 5 to 13) show shares of the various districts’ peach exports to the various provincial peach exports. Table 5: Share of district peach exports to the total Western Cape provincial peach exports (%), 1999 – 2008 Years District
1999
2000
2001
2002
2003
2004
2005
2006
2007
2008
West Coast
2.7 1.5 3.7 5.3 2.6 3.4 1.3 2.1 3.5 2.4
Cape Winelands
4.9 14.1 22.1 32.1 36.1 38.8 43.0 32.9 27.9 38.1
Overberg 3.3 0.8 1.5 1.1 2.0 0.4 0.9 0.4 1.4 1.3 Eden 0.2 0.2 0.2 0.2 0.2 0.3 0.1 0.2 0.1 0.1 City of Cape Town
88.9 83.4 72.5 61.3 59.1 57.1 54.7 64.4 67.1 58.1
Western Cape
100 100 100 100 100 100 100 100 100 100
Source: Calculated from Quantec Easydata Table 5 presents the shares of district peach exports to the total Western Cape provincial peach exports for the years 1999 to 2008. The leading peach export districts in the Western Cape are the City of Cape Town and the Cape Winelands. Together, the two districts accounted for over 96% to total Western Cape provincial peach exports in 2008.
18

Table 6: Share of district peach exports to the total Eastern Cape provincial peach exports (%), 1999 – 2008 Years District
1999
2000
2001
2002
2003
2004
2005
2006
2007
2008
Cacadu 100 96.0 58.0 29.9 35.1 56.3 27.8 0 21.8 20.4 Amatole 0 0 0 0 5.1 0 0 0 0 0 Nelson Mandela
0 4.0 42.0 70.1 59.8 43.7 72.2 100 78.2 79.6
Eastern Cape
100 100 100 100 100 100 100 100 100 100
Source: Calculated from Quantec Easydata The shares of district peach exports to the total Eastern Cape provincial peach exports are presented in Table 6. The Nelson Mandela district is the leading municipality in terms of peach exports from the Eastern Cape, accounting for over three quarters (79.6%) of total Eastern Cape peach exports in 2008. Table 7: Share of district peach exports to the total Mpumalanga provincial peach exports (%), 1999 – 2008 Years District
1999
2000
2001
2002
2003
2004
2005
2006
2007
2008
Gert Sibande
0 0 0 0 58.5 0 0 0 0 0
Nkangala 100 0 0 97.6 41.1 100 0 0 0 100 Ehlanzeni 0 0 0 2.4 0.4 0 100 100 0 0 Mpumalanga 100 0 0 100 100 100 100 100 0 100 Source: Calculated from Quantec Easydata In 2008 the Nkangala district was the only contributor to all peach exports recorded from the Mpumalanga district (see Table 7). Table 8: Share of district peach exports to the total Free State provincial peach exports (%), 1999 – 2008 Years District
1999
2000
2001
2002
2003
2004
2005
2006
2007
2008
Motheo 0 0 0 26.9 0 100 0 0 0 0 Lejweleputswa 28.5 99.1 0 73.1 100 0 0 0 0 0 Thabo Mofutsanyane
71.5 0.9 100 0 0 0 0 0 0 0
Free State 100 100 100 100 100 100 0 0 0 0 Source: Calculated from Quantec Easydata
19

The Free State province never reported any exports of peaches since 2005 (see Table 8). Table 9: Share of district peach exports to the total Gauteng provincial peach exports (%), 1999 – 2008 Years District
1999
2000
2001
2002
2003
2004
2005
2006
2007
2008
Sedibeng 0 0 0 0 0 4.8 6.2 4.5 24.1 25.1 City of Tshwane
36.1 62.8 52.9 42.7 54.3 47.4 42.0 30.1 0 4.3
Metsweding 0 0 0 0 0 0 0 2.0 1.9 0 West Rand 10.0 0 1.0 0 0.5 0 2.3 0 6.9 8.3 Ekurhuleni 14.8 19.1 30.8 35.4 21.5 20.9 16.4 25.5 31.2 25.1 City of Johannesburg
39.1 18.1 15.3 21.9 23.7 26.9 33.1 37.9 35.9 37.2
Gauteng 100 100 100 100 100 100 100 100 100 100 Source: Calculated from Quantec Easydata In the Gauteng province, the contributions of the various districts to total provincial peach exports are distributed between three main districts (see Table 9). In 2008, the leading district was the City of Johannesburg with 37.2% share. It was followed by Sedibeng and Ekhuruleni districts (both at 25.1% share). Table 10: Share of district peach exports to the total North West provincial peach exports (%), 1999 – 2008 Years District
1999
2000
2001
2002
2003
2004
2005
2006
2007
2008
Bojanala Platinum
0 0 100 100 0 100 0 0 0 0
North West 0 0 100 100 0 100 0 0 0 0 Source: Calculated from Quantec Easydata The North West province never reported any exports of peaches since 2005 (see Table 10). Table 11: Share of district peach exports to the total Limpopo provincial peach exports (%), 1999 – 2008 Years District
1999
2000
2001
2002
2003
2004
2005
2006
2007
2008
Mopani 100 100 0 0 0 0 0 99,5 0 23.0 Vhembe 0 0 0 0 100 0 0 0.5 0 0 Waterberg 0 0 0 0 0 0 0 0 100 77.0 Limpopo 100 100 0 0 100 0 0 100 100 100 Source: Calculated from Quantec Easydata
20

The shares of district peach exports to the total Limpopo provincial peach exports are presented in Table 11. In 2008, the Waterberg district contributed over three quarters (77.0%) to total Limpopo provincial peach exports. The remainder were from the Mopani district. Table 12: Share of district peach exports to the total Northern Cape provincial peach exports (%), 1999 – 2008 Years District
1999
2000
2001
2002
2003
2004
2005
2006
2007
2008
Siyanda 0 100 0 0 0 0 100 0 0 100 Northern Cape
0 100 0 0 0 0 100 0 0 100
Source: Calculated from Quantec Easydata In 2008 all exports of peaches recorded in the Northern Cape Province were from the Siyanda district (see Table 12). Table 13: Share of district peach exports to the total Kwa-Zulu Natal provincial peach exports (%), 1999 – 2008 Years District
1999
2000
2001
2002
2003
2004
2005
2006
2007
2008
Ugu 0 0 0 0 0 42.8 0 0 0 0 Umgungun dlovu
0 0 0 1.4 0 0 0 0 0 0
Amajuba 0 0 0 0 0.3 0 0 0 0 0 Uthungulu 0 0 0.2 0 0 0.1 0.1 0 0 0 Ilembe 0 0 13.5 0 0 0 0 0 0 0 Ethekwini 100 100 86.3 98.6 99.7 57.1 99.9 100 100 100 Kwa-Zulu Natal
100 100 100 100 100 100 100 100 100 100
Source: Calculated from Quantec Easydata All recorded exports of peaches in the Kwa-Zulu Natal province in 2008 were from the Ethekwini district (see Table 13). 2.5 Processing
Peaches can be dried, canned, made into jams, jellies, and preserves, used as filling for desserts, and used as an ingredient in many other dishes, from appetizers to entrees.
21
Fresh peaches are highly perishable. Even when unripe, they spoil easily. Peaches that are greenish in colour were probably picked too early and should be avoided. Sweetness does not increase after picking, so ripe-picked fruit is always the tastiest.
22
3 MARKET INTELIGENCE 3.1 Competitiveness of South African peach exports
Competitiveness is described as an industry’s capacity to create superior value for its customers and improved profits for the stakeholders in the value chain. The driving force in sustaining a competitive position is productivity that is output efficiency in relation to specific inputs with regard to human, capital and natural resources. In 2008 South African peach exports represented 0.59% of world exports and its ranking on the world exports was number 15.

Figure 19: Growth in demand for the South African peaches in 2008
23
Source: TradeMap of the International Trade Centre

24
As depicted on the Figure 19 above, South African peach exports are growing faster than the world imports in Oman and Mozambique markets. South Africa’s performance in those markets can be regarded as gains in dynamic markets. South African peach exports are growing while the world imports are declining in Switzerland, Portugal, Italy, Kenya, United Kingdom, Mauritius, and Saudi Arabia markets. South Africa’s performance in those markets can be regarded as gains in declining markets and should be viewed as achievement in adversity. At the same time South African peach exports have declined faster than the world imports in France, Germany, Bahrain and Angola markets. South Africa’s performance in those markets can be regarded as a loss in a declining market. South African peach exports are declining while the world imports are growing in Qatar, the Netherlands and Kuwait markets. These markets are dynamic and South Africa’s performance should be regarded as an underachievement.

Figure 20: South African peaches prospect for market diversification in 2008
25
Source: TradeMap of the International Trade Centre

Figure 20 illustrates prospects for market diversification by South African peach exporters. UK, Netherlands and UAE hold a bigger market share of South African peach exports. In terms of market size, Germany was the largest peach importer in 2008 with just over $460 million worth of peach imports, or roughly 20.45% of the world peach market. Second was France with just over $209 million worth of peach imports, or roughly 9.31% market share followed by the UK with just over $140 million worth of peach imports, or roughly 6.25% market share. Whilst three countries dominate world peach imports, it is interesting to note that countries like Qatar, together with Mozambique and Kuwait have experienced higher annual growth rate in terms of peach imports from 2004 – 2008. Qatar experienced an annual growth rate of 52%. Second was Mozambique with 28% annual growth rate followed by Kuwait (21%). It is important to note that growth by all these mentioned countries has been off a relatively low base. These countries represent possible lucrative markets for South African peach producers. It is also important to note that peach imports from the world to countries such as Turkey, Mauritius, Iran and Bahrain have declined from 2004 – 2008 and as a result those countries have recorded a negative growth rate in peach imports. 3.2 South Africa vs. Southern hemisphere production in 2008 Figure 21 presents Southern Hemisphere production of peaches. It is clear that South Africa was the fourth largest producer of peaches (16.64% in 2008) in the Southern Hemisphere after Argentina, Chile and Brazil. Majority of these countries are vying for the lucrative North American and European markets. The fact that a country can produce a large output does not necessarily mean it will be a big net exporter – this depends on the size of the domestic market and whether excess produce is harvested. In the case of Argentina, the largest producer of peaches in the Southern hemisphere in 2008, their domestic market is so large that the country exports relatively little. Argentina contributed 9.1% to the total Southern hemisphere peach exports in 2008 (see Table 14). In the case of Brazil, the third largest producer of peaches in the Southern hemisphere, their domestic market is so large that the country exports relatively nothing. Brazil contributed 0% to the total Southern hemisphere peach exports in 2008.
26

Figure 21: Southern hemisphere production of peaches and nectarines, 1998 - 2008
0
50000
100000
150000
200000
250000
300000
350000
Years
Tons
Argentina 261648 240000 209634 257768 211922 255785 272442 272500 260000 270000 270000
Australia 87564 93459 112000 107703 117474 126983 99489 130171 110000 115000 130916
Brazil 140047 131300 182460 222616 218292 220364 235720 235471 199719 238500 199900
Chile 206300 252600 260000 290000 293000 304000 311000 315000 320000 330000 268000
New Zealand 14024 17000 17000 14792 11015 7326 9261 8602 8700 8800 8200
South Africa 214040 231549 223069 173868 189647 249290 183652 172631 166955 180000 175088
1998 1999 2000 2001 2002 2003 2004 2005 2006 2007 2008
Source: FAOSTAT 3.3 South Africa vs. Southern hemisphere exports in 2008 Table 14 presents Southern Hemisphere export of peaches for 2008. South Africa’s main competitor from the Southern Hemisphere in the EU market for peaches is Chile. Chile is by far the largest peach exporter from the Southern hemisphere with approximately 80.5% market share in 2008 (see Table 14). Historically, Chile has been exporting to the USA but recently, it has been increasing its share in the EU market. The main impact of the Chilean peaches into the EU market is that it drives prices down. Historically, Chile has been exporting to the USA but recently, it has been increasing its share in the EU market and as a result, South Africa has been experiencing a fierce competition. In future this competition will probably increase and will also depend on the early/late timing of fruit arrivals, influenced by weather conditions. If South Africa is late and Chile is early it will have a severe negative impact on South African prices for peaches.
27
Argentina exports primarily within the South American markets (particularly Brazil). Australia primarily exports to the Far East markets (particularly Hong Kong, Taiwan and Singapore). Brazil and New Zealand produces primarily for local markets and exports very little. All these

countries with the exception of Chile pose no serious threat in the European markets. Table 14: Southern hemisphere exports of peaches, 2008 Country Export - Quantity in
Metric Tons (MT) Contribution to Southern Hemisphere Exports (%)
World exports 1 606 559 Southern Hemisphere
138 463 100
Chile 111 641 80.5 Argentina 12 591 9.1 Australia 5 659 4.1 South Africa 8 468 6.1 New Zealand 104 0.1
Source: Trade Map of the International Trade Centre (ITC)
28

4 MARKET ACCESS Barriers to trade can be divided into tariff barriers (including quotas, ad valorem tariffs, specific tariffs and entry price systems) and non tariff barriers (sanitary and phytosanitary measures, labels, etc). The main markets for fruit (including peaches and nectarines) employ various measures, both tariff and non tariff to protect the domestic industries. Whilst many of the non tariff measures can be justified under the auspices of issues such as health and standards, the tariff measures are increasingly under the scrutiny of the World Trade Organization (WTO), and as such are gradually being phased out. Nevertheless, exporters need to be aware of all the barriers that they may encounter when trying to get their produce onto foreign shelves. 4.1 Tariffs, quotas and the price entry system Tariffs are either designed to earn government revenue from products being imported or to raise the price of imports so as to render local produce more competitive and protect domestic industries. Quotas can be used to protect domestic industries from excessive imports originating from areas with some form of competitive advantage (which can therefore produce lower cost produce). Tariffs and quotas are often combined, allowing the imports to enter at a certain tariff rate up to a specified quantity. Thereafter, imports from that particular region will attract higher tariffs, or will not be allowed at all. This phenomenon is referred to as tariff-rate quotas (TRQs). The entry price system, which is used in many northern hemisphere markets, makes use of multiple tariff rates during different periods when domestic producers are trying to sell their produce, and lower the tariffs during their off-season. Alternatively, the tariff rate can be a function of a market price – if the produce enters at a price which is too low (and therefore likely to be too competitive), it qualifies for a higher tariff schedule. Whilst tariff regulations can be prohibitive and result in inferior market access, it is often the non tariff barriers that restrict countries like South from successfully entering the large developed markets. Many of these barriers revolve around different types of standards, including sanitary and phytosanitary standards (SPS), food health and safety issues, food labelling and packaging, organic produce certification, quality assurance and other standards and grades. Table 15 presents tariffs applied by various export markets to peaches originating from South Africa.
29

Table 15: Tariffs applied by various export markets to peaches from South Africa
30
COUNTRY & TRADE REGIME DESCRIPTION
PRODUCT DESCRIPTION
APPLIED TARIFFS
ESTIMATED TOTAL AD VALOREM EQUIVALENT TARIFF
APPLIED TARIFFS
ESTIMATED TOTAL AD VALOREM EQUIVALENT TARIFF
2008
2009
EU (Preferential tariff for South Africa)
Fresh peaches, excluding nectarines
7.70% 7.70% 1.70% 1.70%
Russia (Preferential tariff for GSP countries)
Fresh peaches, incl. nectarines: Fresh nectarine
3.75% 3.75% 3.75% 3.75%
Norway (Preferential tariff for GSP countries)
Apricots, cherries, peaches (including nectarines), plums and sloes, fresh: Peaches from 16 May to 15 August
0.00% 0.00% 0.00% 0.00%
Switzerland (MFN duties)
Fresh peaches, excluding nectarines
31.50$/Ton 1.12% 2.11% 2.11%
USA (Preferential tariff for AGOA countries)
Peaches, including nectarines, fresh, if entered during the period from 1 June through November 30, inclusive
0.00% 0.00% 0.00% 0.00%
Canada (Preferential tariff for GSP countries)
Fresh peaches, including nectarines: peaches not including nectarines for processing
5.00% 5.00% 5.00% 5.00%
Canada (Preferential tariff for GSP countries)
Fresh peaches, including nectarines: Imported during such period specified by order of the Minister of National Revenue or the Commissioner of Customs and
8.00% 8.00% 8.00% 8.00%

COUNTRY & TRADE REGIME DESCRIPTION
PRODUCT DESCRIPTION
APPLIED TARIFFS
ESTIMATED TOTAL AD VALOREM EQUIVALENT TARIFF
APPLIED ESTIMATED TARIFFS TOTAL AD
VALOREM EQUIVALENT TARIFF
2008 2009
31
Revenue, not exceeding 14 weeks in any 12 months period ending 31st March
Canada (Preferential tariff for GSP countries)
Fresh peaches, including nectarines: Other
5.00% 5.00% 5.00% 5.00%
Mexico (MFN duties)
Fresh peaches, including nectarines
20.00% 20.00% 20.00% 20.00%
Taiwan (General tariff)
Fresh peaches 20.00% 20.00% 20.00% 20.00%
Hong Kong (MFN duties)
Apricots, cherries, peaches (including nectarines), plums and sloes, fresh: Peaches, including nectarines
0.00% 0.00% 0.00% 0.00%
Malaysia (MFN duties)
Fresh peaches, incl. nectarines
5.00% 5.00% 5.00% 5.00%
Singapore (MFN duties)
Peaches incl. nectarines fresh
0.00% 0.00% 0.00% 0.00%
Saudi Arabia (General tariff)
Apricots, cherries, peaches (including nectarines), plums and sloes, fresh.: Peaches, including nectarines
0.00% 0.00% 0.00% 0.00%
Qatar (MFN duties)
Apricots, cherries, peaches (including nectarines), plums and sloes, fresh.: Peaches, including
0.00% 0.00% 0.00% 0.00%

COUNTRY & TRADE REGIME DESCRIPTION
PRODUCT DESCRIPTION
APPLIED TARIFFS
ESTIMATED TOTAL AD VALOREM EQUIVALENT TARIFF
APPLIED ESTIMATED TARIFFS TOTAL AD
VALOREM EQUIVALENT TARIFF
2008 2009
32
nectarines UAE (MFN duties)
Apricots, cherries, peaches (including nectarines), plums and sloes, fresh.: Peaches, including nectarines
0.00% 0.00% 0.00% 0.00%
Syria (General tariff)
Fresh peaches 30.00% 30.00% 50.00% 50.00%
Kuwait (MFN duties)
Apricots, cherries, peaches (including nectarines), plums and sloes, fresh.: Peaches, including nectarines
0.00% 0.00% 0.00% 0.00%
Mozambique (MFN duties)
Apricots, cherries, peaches (including nectarines), plums and sloes, fresh.: Peaches, including nectarines
20.00% 20.00% 0.00% 0.00%
Angola (MFN duties)
Apricots, cherries, peaches (including nectarines), plums and sloes, fresh.: Peaches, including nectarines
10.00% 10.00% 10.00% 10.00%
Ghana (MFN duties)
Fresh peaches, incl. nectarines
20.00% 20.00% 20.00% 20.00%
DRC (MFN duties)
Fresh peaches, incl. nectarines
20.00% 20.00% 20.00% 20.00%
Kenya Fresh peaches, 25.00% 25.00% 25.00% 25.00%

COUNTRY & TRADE REGIME DESCRIPTION
PRODUCT DESCRIPTION
APPLIED TARIFFS
ESTIMATED TOTAL AD VALOREM EQUIVALENT TARIFF
APPLIED ESTIMATED TARIFFS TOTAL AD
VALOREM EQUIVALENT TARIFF
2008 2009
(MFN duties)
incl. nectarines
Zimbabwe (MFN duties)
Fresh peaches, incl. nectarines
40.00% 40.00% 40.00% 40.00%
Australia (MFN duties)
Fresh peaches, incl. nectarines
0.00% 0.00% 0.00% 0.00%
New Zealand (MFN duties)
Fresh peaches, incl. nectarines
0.00% 0.00% 0.00% 0.00%
Brazil (MFN duties)
Apricots, cherries, peaches (including nectarines), plums and sloes, fresh.: Peaches, including nectarines
10.00% 10.00% 10.00% 10.00%
Source: Market Access Map South Africa has a preferential trading agreement (PTA) with the EU. Furthermore, South Africa has access to the USA market under the AGOA which significantly lowers the tariff barriers for peaches originating from South Africa. Canada Norway and Russia also have a GSP system in place, for which South Africa qualifies. In reality, the tariffs are likely to be far lower for South Africa when considering the preferential agreements, but at the same time, most tariff structures are particularly complex, with quotas, seasonal tariffs and specific tariffs (an amount per unit rather than a percentage of value) all contributing to many different tariff lines and often higher duties payable than one might have anticipated initially. One must also bear in mind that most tariffs are designated to protect domestic industries, and as such are likely to discriminate against those attempting to compete with the domestic producers of that country.
33
One can also see that certain countries wishing to protect their local industries (presumably in which they feel vulnerable or where large number of farmers are employed) will raise tariffs to prohibitive levels. African countries such as Kenya, Zimbabwe, Democratic Republic of Congo (DRC), and Ghana, Middle East countries such as Syria, North

American countries such as Mexico and Asian countries such as Taiwan have reasonably high tariff for peaches originating from South Africa. 4.2 European Union (EU) The EU has a seasonal tariff structures which are highest during the European peak harvesting seasons (the price entry system), quotas and specific tariffs, and various policies that allow, amongst other things, government organizations to purchase produce should supply rise too quickly (and thereby maintain prices), and then release this excess back onto the market as and when supply drops again. The immediate implication of these policies for South Africa is that an opportunity exists to supply apples to the European market in the off season periods, as the produce will not compete directly with the European producers and thus would not be liable to a whole array of tariffs and other protective mechanisms. There are other non-tariff barriers, including the phytosanitary and food health regulations laid down by the EU legislation, marketing standards and certificates of conformity, and the ever changing demand patterns of the EU consumers. 4.2.1 Tariff barriers. The EU applies a system known as entry price system. With this system, the EU establishes an ‘entry price’ at which produce may enter the EU market, which is not only based on the market price for the current year (demand and supply) and for previous years, but also on the prices of the domestic producers (prices they need to maintain profitability). It is calculated by the regulatory authorities so that it can be used in combination with tariffs and quotas to aid EU’s attempts at protecting its agricultural system. The entry price is the minimum price at which produce may enter the market. If the price of the produce is lower than its calculated price, it is liable to have duties imposed upon it over and above any duties/quotas it might originally attract. Agricultural duties are applied as follows:
• When the value of the imported party is between 92% and 94% of the entry price, 8% of the entry price will be added to the normal customs duty.
34
• When the value of the imported party is between 94% and 96% of the entry price, 6% of the entry price will be added to the normal customs duty.

• When the value of the imported party is between 96% and 98% of the entry price, 4% of the entry price will be added to the normal customs duty.
• When the value of the imported party is between 98% and 100% of the entry price, 2% of the entry price will be added to the normal customs duty.
There are tariffs applicable over and above the entry price tariffs, depending on the produce, where it originates from and whether that country has any preferential trading agreements with the EU. 4.2.2 Non tariff barriers. Non tariff barriers can be divided into those that are mandatory and laid out in the EU Commission’s legislature and those that are a result of consumers, retailers, importers and other distributors’ preferences. 4.2.2.1 Legal requirements i) Product legislation: quality and marketing There are number of pieces of EU legislation that govern the quality of produce that may be imported, marketed and sold within the EU. They are as follows: General Food Law which covers matters in procedures of food safety and hygiene (micro-biological and chemical), including provisions on the traceability of food (for example, Hazard Analysis and Critical Points, or HACCP), and it is laid out under regulation EC 178/2002. EU Marketing Standards which govern the quality and labelling of fruit are laid out in the Common Agricultural Policy (CAP) framework under regulation EC 2200/96. These regulations include diameter, weight and class specifications, and any produce that does not comply with these standards will not be sold on the EU markets. Certificate of Conformity must be obtained by anyone wishing to export and sell fruits in the EU, if that fruit falls under the jurisdiction of the EU marketing standards. Certificate of Industrial Use must be obtained if the fruit is to be used in further processing. Maximum Residue Limits (MRL) of various pesticides allowed.
35

ii) Product legislation: phytosanitary regulations The international standard for phytosanitary measures was set up by the International Plant Protection Committee (IPPC) to protect against spreading of diseases or insects through the importation of certain agricultural goods. The EU has its own particular rules formalized under EC 2002/89, which attempts to prevent contact of EU of crops with harmful organisms from elsewhere in the world. The crux of the directive is that it authorizes the Plant Protection Services to inspect large number of fruit products upon arrival in the EU This inspection consist of physical examination of a consignment deemed to have a level of phytosanitary risk, identification of any harmful organisms and certification of the validity of any phytosanitary certificate covering the consignment. If the consignment does not comply with the requirements, it may not enter the EU although certain organisms can be fumigated at the expense of the exporter. iii) Product legislation: packaging The EU Commission lays down rules for materials that come into contact with food and which may endanger people’s health or bring about an unacceptable change in the composition of the foodstuffs. The framework legislation for this is EC 1935/2004. Recycling packaging materials are also emphasized under 94/62/EC, whereby member states are required to recycle between 50% and 65% of packaging waste. If exporters do not ship produce in packaging which is reusable, they may be liable for the costs incurred by the importing companies. Wood packaging is subject to phytosanitary controls and may need to undergo heat treatment, fumigation, etc. 4.2.2.2 Non-legal requirements To access the market, importers must not only comply with legal requirements set out above, but must also with market requirements and demands. For the most part, these revolve around quality and the perception of European consumers about environmental, social, health and safety aspects of both the products and the production techniques. Whilst supplying fruit that complies with these issues may not be mandatory in the legal sense, they are becoming increasingly important in Europe and cannot be ignored by existing or potential exporters.
36
i) Social accountability is becoming important in the industry, not only amongst consumers, but also for retail outlets and wholesalers. The Social Accountability 8000 (SA 8000) certification is a management system based on International Labour Organization (ILO) conventions,

and deals with issues such as child labour, health and safety, and freedom of association, and requires an on-site audit to be performed annually. The certificate is seen as necessary tool for accessing any European market successfully. ii) Environmental issues are becoming increasingly important with European consumers. Consumer movements are lobbying against purchasing non-environmentally friendly or non-sustainable produce. To this end, both governments and private partners have created standards (such as ISO 14001 and EUREGAP) and labels to ensure that produce adhere to particular specifications. Although eco-labels (for example, the EU Eco-label, the Netherlands Milieukeur, the German Blue Angel and the Scandinavian White Swan) are voluntary, they can afford an exporter a marketing edge, as consumers wishing to purchase environmentally sound produce demand products that are easily recognizable. Another important emerging label is Fairtrade, and includes those labels offered by Max Haavelaar Foundation, TransFair International and the FLO (Fairtrade Labelling Organization). Recently a ‘universal’ logo was adopted based on international fair trade standards developed by FLO, which covers amongst other things, minimum quality and price, various processing requirements, compensation of small farmers that covers sustainable production and living standards, and contracts that allow for long term planning and development. 4.2.2.3 Consumer health and safety requirements Increasing consumer conscience about health and safety issues has prompted a number of safety initiatives in Europe, such as EUREPGAP on good agricultural practices (GAP) by the main European retailers, the international management system of HACCP, which is independently certified and required by legislation for European producers as well as food imported into Europe (EC 852/2004), and the ISO 9000 management standards system (for producers and working methods) which is certified by the International Standards Organization (ISO). 4.3 United States of America (USA) 4.3.1 Tariff barriers.
37
South African exporters have completely free access to the USA markets under the Generalized System of Preference (GSP), the GSP for LCDs (Least Developed Countries) or the African Growth and Opportunity Act (AGOA). South African exporters must always compare with what Chile

(the main supplier of fruit to the USA and South Africa’s potential rival) must pay in terms of tariff duties when exporting fruit to the USA. Chile’s access to the USA fruit market is considered to be highly preferential under its own Preferential Trade Agreement (PTA). 4.3.2 Non tariff barriers. The USA’s phytosanitary regulation is conducted by Animal and Plant Health Inspection Service (APHIS), which is divided into nine sub-sections. Plant Protection and Quarantine (PPQ) and Veterinary Services (VS) are responsible for issuing permits for commodities and determining whether a commodity can be imported. The Policy and Program Development (PPD) division works with both these divisions in determining long term plans and procedures. Some products can get pre-clearance from international Services (IS) personnel stationed in the country of origin, either at exporting terminals of site inspections. The PPQ’s main focus is to prevent the spread of diseases and pests into the USA’s agriculture resources, and it has personnel stationed at all airports, seaports and border stations that check imported cargo and oversee the quarantine process. Exporters or importers must make a request to export/import a commodity, provide as much information as possible on the product, its region of origin and its status that is whether there are restrictions or regulations governing that particular product from that particular region before a permit is issued, along with the conditions of importation (disinfestations treatment) or mitigation measures. Denials can be challenged and governments and companies can request a change in the status of a prohibited commodity (an investigation must be performed by the PPQ scientific team), as long as sufficient conditions have changed or a risk assessment has not been conducted within the last 10 years. Most approved commodities can enter with inspection alone, but some may have to undergo mitigating measures including post-harvest treatments (hot/cold temperature treatments, irradiation or fumigation, depending on the requirements and which particular treatment is least harmful). The establishment of specifically and maintained pest-free areas in a country (which obviously requires extensive co-operation between the country’s plant health services and APHIS IS division) or systems approaches (field surveys, random inspections or various on site treatments.
38
In addition to phytosanitary regulations, the USDA Food Safety Inspection Services (FSIS) regulates sanitary practices in the packing of food products, while the Food and Drug Administration (FDA), which is part of the US Department of Health, regulates packaging and labelling.

The HACCP protocol is used extensively. The USDA quality standards for fruits and vegetables provide basis for domestic and international trade and promote efficiency in marketing and procurement. 4.4 Japan Japan’s agricultural sector is heavily protected, with calculations from the Organization for Economic Co-operation and Development (OECD) estimating that almost 60% of the value of Japan’s farm production comes from trade barriers or domestic subsidies. Japan uses tariff rate quotas (TRQ) to protect its most sensitive products, and reserves the right for trading many of these products (within the quota) for one or two state trading enterprises. However, these extremely protective measures apply only to some products; others are able to compete more effectively with outside competition, often on the grounds of higher quality. Perhaps the biggest barrier to trade with Japan in fruit markets is its strict phytosanitary requirements, which have often been challenged in the WTO as having little or no scientific justification. Other measures that are being challenged include Japan’s use of fumigation on agricultural products when cosmopolitan pests (already found in Japan) are detected. Japan is also increasing its labelling requirements. It now requires fresh food, including fruit, to be labelled with the place of origin, whilst new technological (‘smart’) labels that have embedded semi-conductors and information on just about everything are being adopted in various agricultural sectors. Food containing genetically modified organisms (GMOs) need to be assessed for environmental food safety by the MAFF or the Ministry of Health, Labour and Welfare (MHLW). At the same time, the MHLW tests food imports for maximum residue levels from pesticides and as of May 2006, any food with pesticides not on approved list, regardless of the residue levels, are not allowed entry. Japanese organic definitions changed in 2001 (they roughly corresponded to world standard definitions), and any foreign producers wishing to enter the Japanese market must be certified under the Japanese standards (not general world standards). 4.5 China
39
China has a massive system of government support for farmers and generally rural dwellers (who are lagging behind urban dwellers). To this end, most of the agricultural sectors are protected and promoted through

a series of subsidies, tax cuts and infrastructure spending policies (as well as low cost loans, research, land use protection, market stabilization measures, etc). Part of the protection of its massive farming population, which for most part consists of small farmers not benefiting from economies of scale, necessarily occurs in the form of high tariffs and other restrictions. However China is obliged to reduce tariff levels as a condition of being a member of WTO. It therefore remains to be seen just what policies will be adopted going forward, but the general consensus is that it is a vitally important market to watch, and endeavour to enter.
40

5 DISTRIBUTION CHANNELS There are roughly three distinct sales channels for exporting fruits. One can sell directly to an importer with or without the assistance of an agent (usually larger, well established commercial operations). One can supply fruits combined, which will then contract out importers/marketers and try to take advantage of economies of scale and increased bargaining power. At the same time combined fruits might also supply large retail chains. One can also be a member of a private or cooperative export organization which will find agents or importers and market the produce collectively. Similar to combined fruits, an export organization can either supply wholesale market or retail chains, depending on particular circumstances. Export organizations will wash, sort and package the produce. They will also market the goods under their own name or on behalf of the member, which includes taking care of labelling, bar-coding, etc. Most of the time, export organizations will enter into collective agreements with freight forwarders, negotiating better prices and services (more regular transport, lower peak season prices, etc). Some countries have institutions that handle all the produce (membership compulsory) and sell only to a restricted number of selected importers. Agents will establish contacts between producers/export organizations and buyers in the importing country, and will usually take between 2% and 3% commission. In contrast, an importer will buy and sell his/her own capacity, assuming the full risk (unless on consignment). They will also be responsible for clearing the produce through customs, packaging and assuring label/quality compliance and distribution of the produce. Their margins lie between 5% and 10%. The contract importers of fruit combines market and distribute the produce of the combines, clear it through customs and in some cases treat and package it. Only few exporters have long term contracts with wholesale grocers who deliver directly to retail shops, but with the increasing importance of standards (EurepGap, etc) and the year round availability of fruit, the planning of long term contractual relationship is expected to increase.
41

6 LOGISTICS 6.1 Mode of transport The transport of fruits falls into two categories namely ocean cargo and air cargo. Ocean cargo takes much longer to reach the desired location but costing considerably less. The choice of transportation method depends, for most parts on the fragility of the produce and how long it can remain relatively fresh. With the advent of technology and container improvements, the feasibility, cost and attractiveness of sea transport have improved considerably. With the increased exports by South Africa, the number and the regularity of maritime routes have increased. These economies of scale could benefit South Africa if more producers were to become exporters and take advantage of the various ports which have special capabilities in handling fruit produce (for example Durban new fruit terminal). 6.2 Cold chain management Cold chain management is crucial when handling perishable products, from the initial packing houses to the refrigerated container trucks that transport the produce to the shipping terminals, through to the storage facilities at these terminals, onto actual shipping vessels and containers, and finally on to the importers and distributors that must clear the produce and transport it to the markets/retail outlets. For every 10 Degree Celsius increase above the recommended temperature, the rate of respiration and ripening of produce can increase twice or even thrice. Related to this are increasing important traceability standards which require an efficient controlled supply chain and internationally accepted business standards. 6.3 Packaging Packaging can also play an important role in ensuring safe and efficient transport of a product and conforming to handling requirements, uniformity recyclable material specifications, phytosanitary requirements, proper storage needs and even attractiveness for marketing purposes.
42

7 ORGANIZATIONAL ANALYSIS 7.1 Producer and associated organizations Grower participation and control of their interests in the industry are structured by means of fruit type producer associations (Section 21 companies), as illustrated in Figure 22. Figure 22: Structure of the producer interest in the deciduous fruit industry
43
Canned Fruit Producers Association
PRODUCERS
SAAPPA (Section 21 Company)
SAT (Section 21 Company)
SASPA (Section 21 Company)
DTD (Section 21 Company)
Fresh Produce Exporters Forum (FPEF)
Deciduous Fruit Producers Trust (DFPT)
DFPT Management Service (Pty) Ltd
Research Management (Section 21 Company)
Deciduous Fruit Industry Dev Trust
Statutory funding
DFPT FIN (Section 21 Company)
South African Plant Improvement Organization Trust
Joint Marketing Forum

The main association responsible for the peach industry is the South African Stone Fruit Producers’ Association (SASPA). It is a Section 21 company and its objectives are as follows:
• To promote the common interest and specific needs of the stone fruit producers in South Africa and to act as their official representative.
• To rationalize and promote the production and marketing of stone fruits and stone fruit products.
• To encourage and pursue constructive dialogue and mutual cooperation with government and other role players.
• To foster mutual trust and long term relationships among role players and stakeholders.
• To establish and promote a reciprocal information system to enable stakeholders to make informed market decisions.
7.2 Strengths, Weaknesses Opportunities and Threat analysis Some of the strengths, weaknesses, threats and opportunities of the peach production sector in South Africa are as follows:
44
Strengths
Weaknesses
• The industry’s export operations and leading players are well established.
• An efficient export infrastructure exists and market access has been improved.
• The South African fruit industry is known for excellent overall quality for fruit (strong reputation in major international markets).
• Sound communication mechanisms to majority of industrial participants.
• High level of investment in current technology within pack houses and cold chain facilities.
• Production is largely dependent on climatic conditions which can only be partially manipulated by man through irrigation.
• Deteriorating research infrastructure and capacity may limit new technology development in the future.
• Saturation of traditional export markets.
• Reliance on the UK and EU as main export market.
• Relatively high input and capital costs.
• An element of fragmentation in the industry.

• Industry has all traceability systems in place, as required by accreditation protocols.
• Lengthy supply chain beyond the pack house.
• Lack of industry control on efficiency and productivity in supply chain beyond farm gate and pack house door.
• Poor skills and knowledge of the new entrants.
• Delays due to degradation of the supporting infrastructure within the supply chain (handling facilities at ports, roads and energy supply).
Threats
Opportunities
• Increased competition from the Southern Hemisphere counterparts like Chile, Brazil, Argentina and Australia.
• Oversupply of fruit into established export markets.
• Availability and cost of irrigation water.
• Impact of climate change especially in the Western Cape.
• Inflation rate with regard to cost of labour and farming and also packing prerequisites.
• Currency variability.
• Market access initiatives to the Middle East, Asia (India, Indonesia) and China.
• Increasing demand for fresh apples in Africa.
• Potential for increased local market consumption.
7.3 Strategic challenges 7.3.1 Labour markets The critical need for labour at harvest time offers seasonal work to unemployed persons in the immediate vicinity of plantations. In most countries, workers migrate from one region to another as the harvest season progresses from early to late. However, in the local scenario, labourers lack mobility as well as skills to find work outside crop harvesting.
45
A major challenge in terms of labour is the lack of skilled labour. At the same time, farm wage levels do not attract skilled or qualified people to undertake menial and hard work. Smaller producers, who pay

comparatively lower wages, are more exposed than the larger producers to the threat of labour shortages. 7.3.2 Infrastructure Some of the infrastructural challenges are as follows:
• Lack of storage capacity at certain times of the year, when stone fruit and other fruits are being harvested (mid January until end of February).
• Hygiene and micro-bacterial quality of water available for use in pack houses and domestic purposes on farms.
• Poor or no communication between the agricultural sector and service providers in terms of planning and future expansion on issues such as energy and transport.
• Transport from the pack house to the market – road, ship or rail. • Logistical systems which are not applied at full efficiency. • Inefficient handling operations at South African ports, giving rise
to costly delays and breaks in the cold chain. 7.3.3 Other challenges Producers are being confronted with more regulations to control the production from farm to fork. These include regulating soil, air, water, chemical, labelling and safety. On the retailing side pressure mounts to introduce measures for increased traceability of products. The consumer wants a safe product produced with socially acceptable and environmentally friendly production methods. Combined with this many consumers are up in arms about GMO’s and the USA government is introducing a bio terrorism act that will put even more pressure on exporters to the USA. Competition for scarce natural resources (land and water) is putting continued pressure on good farmland that can otherwise be used for agricultural purposes. There is a threat of climate change particularly in the Western Cape Province. Production of apples and other fruits could be adversely affected by the warming of the winter season due to rising average temperatures and subsequent loss in chilling hours. Lack of winter chilling gives rise to delayed foliation and the problem of small fruit of poor quality. Increased average maximum temperatures in January and February may result in poor colour development. The risk of sunburn is also increased.
46

7.4 Opportunities The promotion of the consumption of peaches and other fruits should be implemented. Per capita consumption of peaches at 4kg, in comparison to Asia’s 13.25kg and the EU’s 17.6kg highlights the scope for possible increase in sales in the local market. 7.5 Empowerment issues and transformation in the sector According to Fruit South Africa, progress in this area has been slower than expected mainly because of lack of understanding on how the Black Economic Empowerment (BEE) strategy should be applied. Attempts to establish BEE owned companies have failed and that has impacted negatively on the perceptions of the future participants in the industry.
47

48
8 PEACH SUPPLY VALUE CHAIN The supply value chain is a complex linkage of various production and operational role-players (see Figure 23). Other key stakeholders are the producer organizations, organized labour, NGOs, financial institutions and government.

49
Figure 23: Peach supply value chain
Research Breeding Plant development
Nursery
Orchard Production
Packing
Fresh local market
Processing
Chutney Canning Juice Dried
Process M k ti
Local market
Export market
Fresh produce markets
Retailer/ Informal markets
Consumer
Cold storage
Export market
Sea freight Air freight
Cold stores, Terminals & Depots
Containerized, Conventional Shipping
Cold stores, terminals & depots
Importer Receiver
Distribution
Shelf
Distribution, Pre-packing
Consume

9. ACKNOWLEDGEMENTS The following industries/organizations are acknowledged. 9.1 Deciduous Fruit Producers Trust (DFPT) P. O. Box 163 Paarl 7622 Tel: (021) 870 2900 Fax: (021)870 2915 www.dfpt.co.za 9.2 National Department of Agriculture, Forestry and Fisheries Directorate: Agricultural Statistics Private X 246 Pretoria 0001 Tel (012) 319 84 54 Fax (012) 319 8031 www.nda.agric.za 9.3 Optimal Agricultural Business Systems (OABS) P. O. Box 163 Paarl 7622 Tel: (021) 890 2953 Fax: (021) 890 2915 www.oabs.co.za 9.4 Trade and Industrial Policy Strategies (TIPS) P. O. Box 11214 Hatfield 0028 Tel (012) 431 7900 Fax (012) 431 7910 www.tips.org.za 9.5 National Agricultural Marketing Council (NAMC) Private Bag X 935 Pretoria 0001 Tel (012) 341 1115 Fax: (086) 626 4769 www.namc.co.za
50

9.6 International Trade Centre www.intracen.org 9.7 Food and Agriculture Organisation www.faostat.fao.org Disclaimer: This document and its contents have been compiled by the Directorate Marketing of the Department of Agriculture, Forestry and Fisheries for the purpose of detailing the peach industry. Anyone who uses this information does so at his/her own risk. The views expressed in this document are those of the Department of Agriculture, Forestry and Fisheries with regard to agricultural industry, unless otherwise stated. The Department of Agriculture, Forestry and Fisheries therefore, accepts no liability that can be incurred resulting from the use of this information.
51