marianne kah conocophillips chief economist i bohai phase ii yuzhno khylchuyu libya suban ii...
TRANSCRIPT
2/27/06 – Slide 1
Marianne KahConocoPhillips Chief Economist
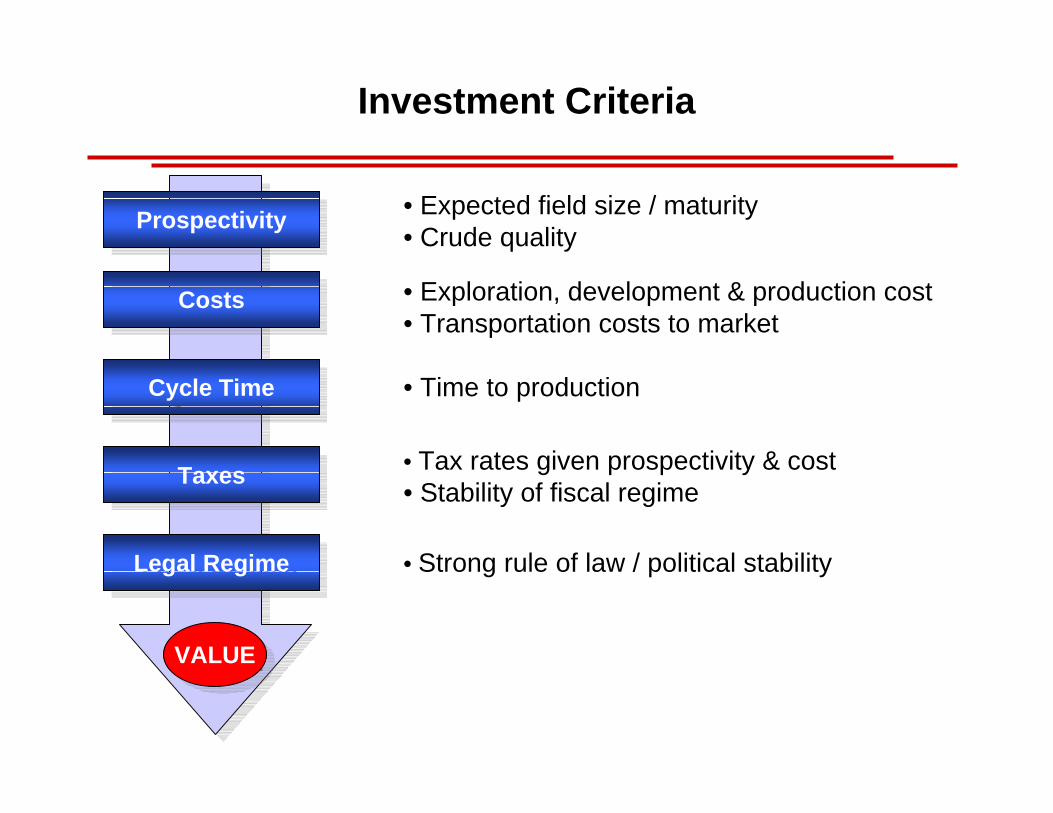
Investment Criteria
ProspectivityProspectivity • Expected field size / maturity• Crude quality
• Exploration, development & production cost• Transportation costs to market
• Tax rates given prospectivity & cost• Stability of fiscal regime
• Strong rule of law / political stability
CostsCosts
TaxesTaxes
Legal RegimeLegal Regime
Cycle TimeCycle Time • Time to production
VALUEVALUE

• Small expected field size• Lower value heavy & high sulfur crude
Investment Criteria - Alaska Rating
• High explor., develop. & production cost• High transportation costs to market
• High tax rates given prospectivity & cost• Recent concern about stability of fiscal regime
• Strong rule of law / political stability• Concern about changing tax rate withoutgrandfathering recent investment
ProspectivityProspectivity
CostsCosts
TaxesTaxes
Legal RegimeLegal Regime
Cycle TimeCycle Time
VALUEVALUE
• Long lead times
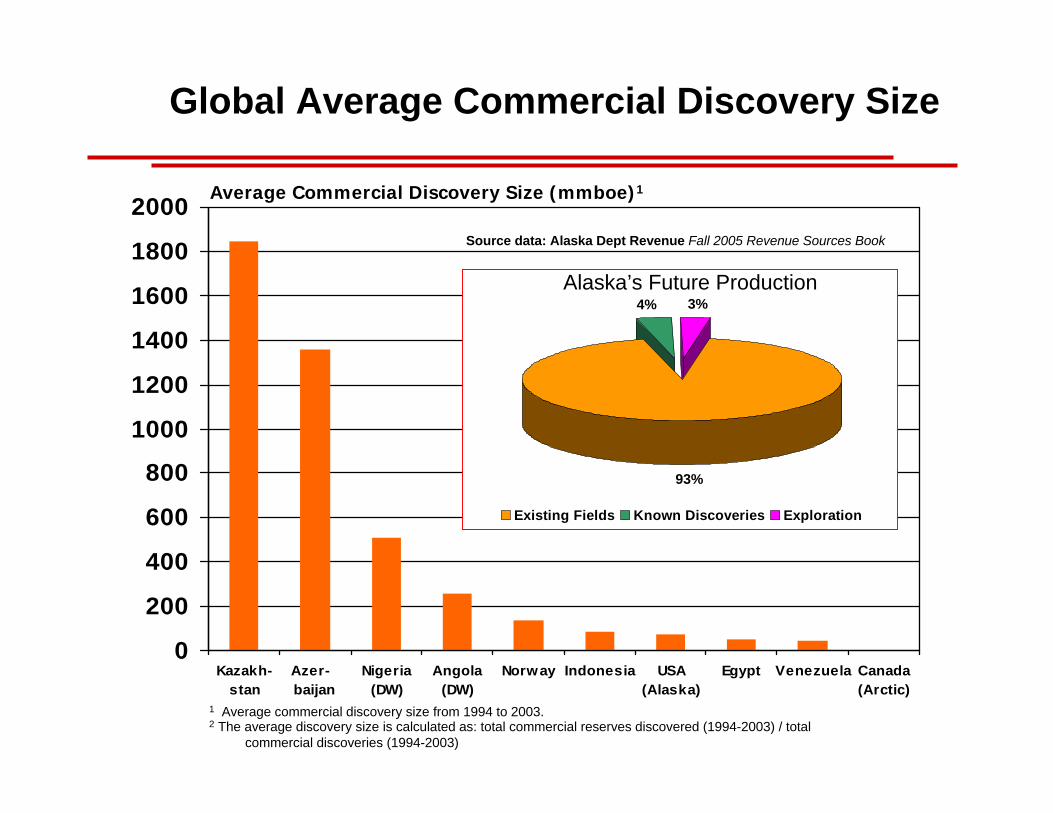
Global Average Commercial Discovery Size
1 Average commercial discovery size from 1994 to 2003.2 The average discovery size is calculated as: total commercial reserves discovered (1994-2003) / total
commercial discoveries (1994-2003)
Average Commercial Discovery Size (mmboe)1
0
200
400
600
800
1000
1200
1400
1600
1800
2000
Kazakh-stan
Azer- baijan
Nigeria(DW)
Angola(DW)
Norway Indonesia USA(Alaska)
Egypt Venezuela Canada(Arctic)
93%
4% 3%
Existing Fields Known Discoveries Exploration
Source data: Alaska Dept Revenue Fall 2005 Revenue Sources Book
Alaska’s Future Production
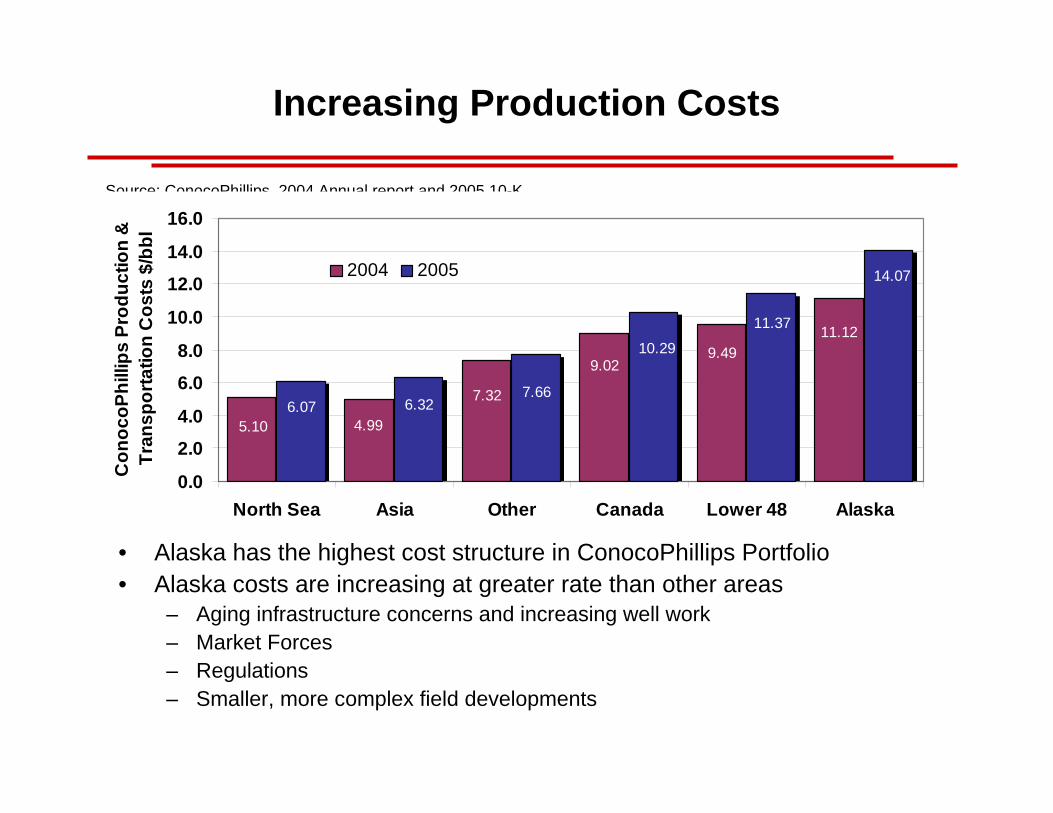
Increasing Production Costs
• Alaska has the highest cost structure in ConocoPhillips Portfolio• Alaska costs are increasing at greater rate than other areas
– Aging infrastructure concerns and increasing well work– Market Forces– Regulations– Smaller, more complex field developments
Source: ConocoPhillips 2004 Annual report and 2005 10-K
11.129.49
7.32
4.99
9.02
5.10
14.07
11.37
10.29
7.666.326.07
0.0
2.0
4.0
6.0
8.0
10.0
12.0
14.0
16.0
North Sea Asia Other Canada Lower 48 Alaska
Con
ocoP
hilli
ps P
rodu
ctio
n &
Tr
ansp
orta
tion
Cos
ts $
/bbl
2004 2005
Argentina
Australia (offshore)
Bangladesh
Bolivia
Canada (East Coast)
Italy
Malaysia-Thailand JDA
Netherlands (offshore)Netherlands (onshore)
New Zealand
Peru
UK (shelf)UK (Southern Gas Basin)
USA (GoM deepwater)
Trinidad & TobagoAngola (shelf)
Brazil (shelf)
Canada (Arctic)
Denmark
Ecuador
Egypt
GabonNigeria (deepwater)
Alaska ELF
Nigeria (shelf)
Norway
Oman
QatarSyria Yemen
30%
40%
50%
60%
70%
80%
90%
100%
0.0 2.0 4.0 6.0 8.0 10.0 12.0 14.0 16.0
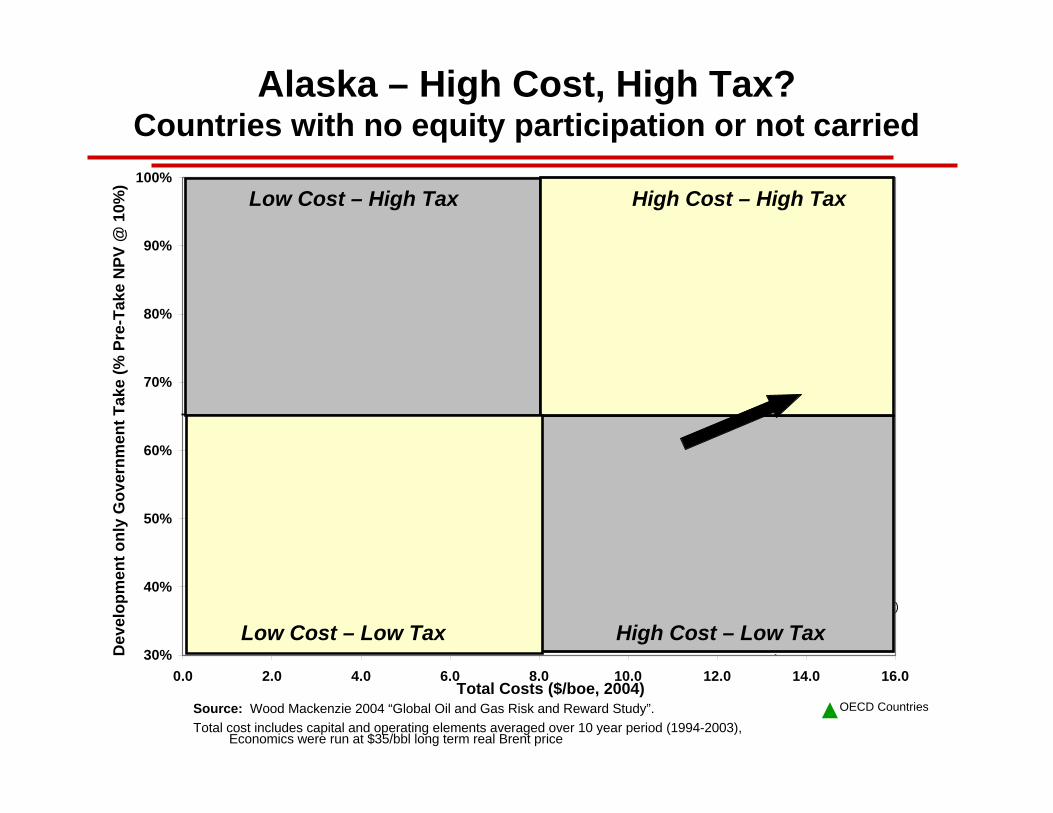
Alaska – High Cost, High Tax?Countries with no equity participation or not carried
Source: Wood Mackenzie 2004 “Global Oil and Gas Risk and Reward Study”.Total cost includes capital and operating elements averaged over 10 year period (1994-2003),
Economics were run at $35/bbl long term real Brent price
High Cost – High TaxLow Cost – High Tax
High Cost – Low TaxLow Cost – Low Tax
Dev
elop
men
t onl
y G
over
nmen
t Tak
e (%
Pre
-Tak
e N
PV @
10%
)
Total Costs ($/boe, 2004)OECD Countries
Syria
Qatar
Oman
Norway
USA (Alaska)
Nigeria (deepwater)
Egypt
Denmark
Canada (Arctic)
Trinidad & Tobago
USA (GoM deepwater)
UK (Southern Gas Basin) UK (shelf)
New ZealandNetherlands (onshore)
Netherlands (offshore)
Malaysia-Thailand JDA
Italy
Canada (East Coast)
Bolivia
Bangladesh
Australia (offshore)
Argentina
Libya
Papua New Guinea
Kazakhstan
IndonesiaVietnam
VenezuelaMalaysia
Colombia
Brunei
Azerbaijan
Angola (deepwater)
Algeria
Pakistan
Cote d'IvoireIndia
Congo (Brazzaville)
China (offshore)
30%
40%
50%
60%
70%
80%
90%
100%
0.0 2.0 4.0 6.0 8.0 10.0 12.0 14.0 16.0
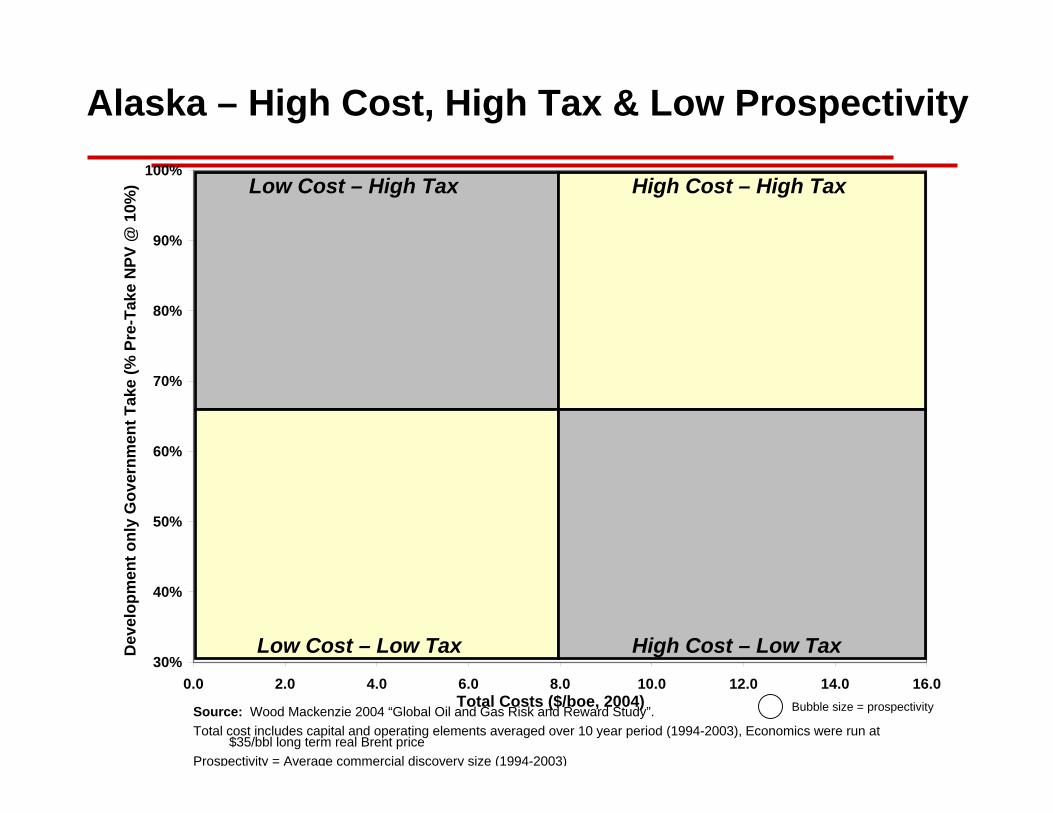
Alaska – High Cost, High Tax & Low Prospectivity
Source: Wood Mackenzie 2004 “Global Oil and Gas Risk and Reward Study”.Total cost includes capital and operating elements averaged over 10 year period (1994-2003), Economics were run at
$35/bbl long term real Brent priceProspectivity = Average commercial discovery size (1994-2003)
High Cost – High TaxLow Cost – High Tax
High Cost – Low TaxLow Cost – Low TaxDev
elop
men
t onl
y G
over
nmen
t Tak
e (%
Pre
-Tak
e N
PV @
10%
)
Total Costs ($/boe, 2004) Bubble size = prospectivity
Higher Taxes Will Reduce Investment
• Reduces after-tax cash flow available for investment
• Adversely changes risk / reward balance
• Capital goes elsewhere to:
– Other countries
– Other energy sources
– Other industries
Dr. Margo Thorning, American Council on Capital Formation
“If You Tax Something, You Will Get Less of It”
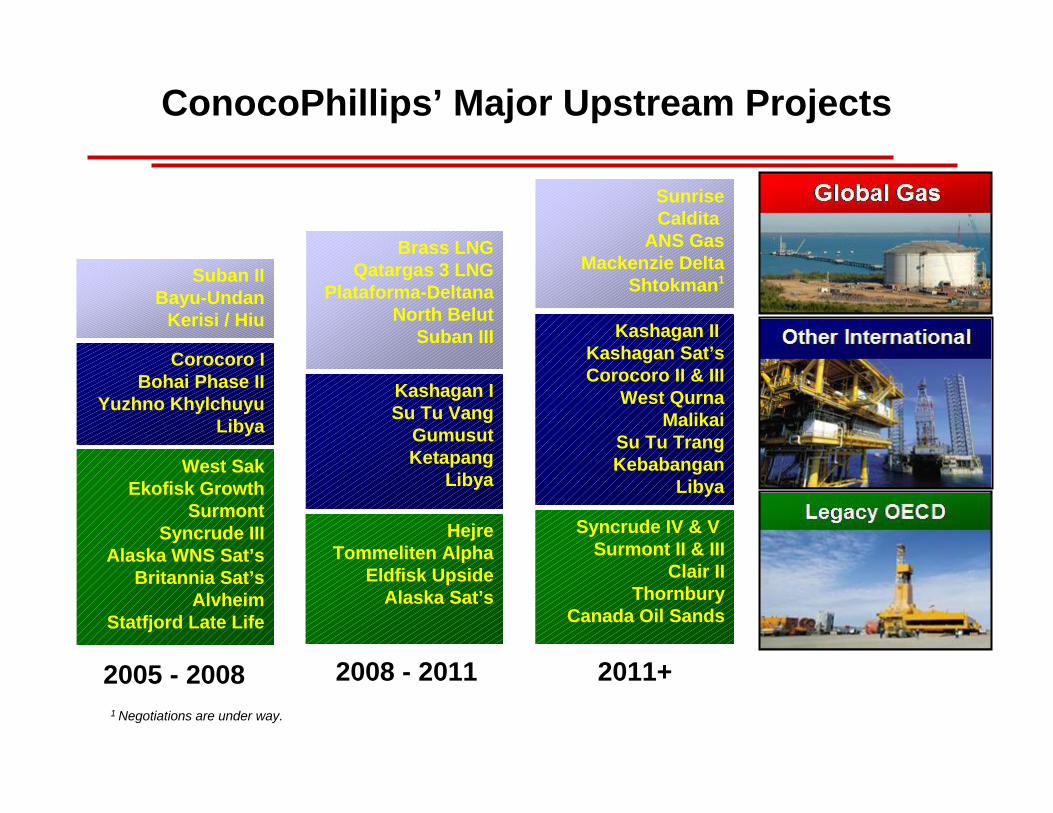
ConocoPhillips’ Major Upstream Projects
West SakEkofisk Growth
SurmontSyncrude III
Alaska WNS Sat’sBritannia Sat’s
AlvheimStatfjord Late Life
Corocoro IBohai Phase II
Yuzhno KhylchuyuLibya
Suban IIBayu-Undan
Kerisi / Hiu
HejreTommeliten Alpha
Eldfisk UpsideAlaska Sat’s
Kashagan ISu Tu Vang
GumusutKetapang
Libya
Brass LNGQatargas 3 LNG
Plataforma-DeltanaNorth Belut
Suban III
Syncrude IV & V Surmont II & III
Clair IIThornbury
Canada Oil Sands
Kashagan II Kashagan Sat’sCorocoro II & III
West QurnaMalikai
Su Tu TrangKebabangan
Libya
SunriseCaldita
ANS GasMackenzie Delta
Shtokman1
2008 - 2011 2011+2005 - 20081 Negotiations are under way.
00.250.5
0.751
1.251.5
1.752
Alaska
1
Alaska
2
Alaska
3Downstre
am 1Alte
rnati
ve E
nergy 1
Upstream
1
Upstream
2
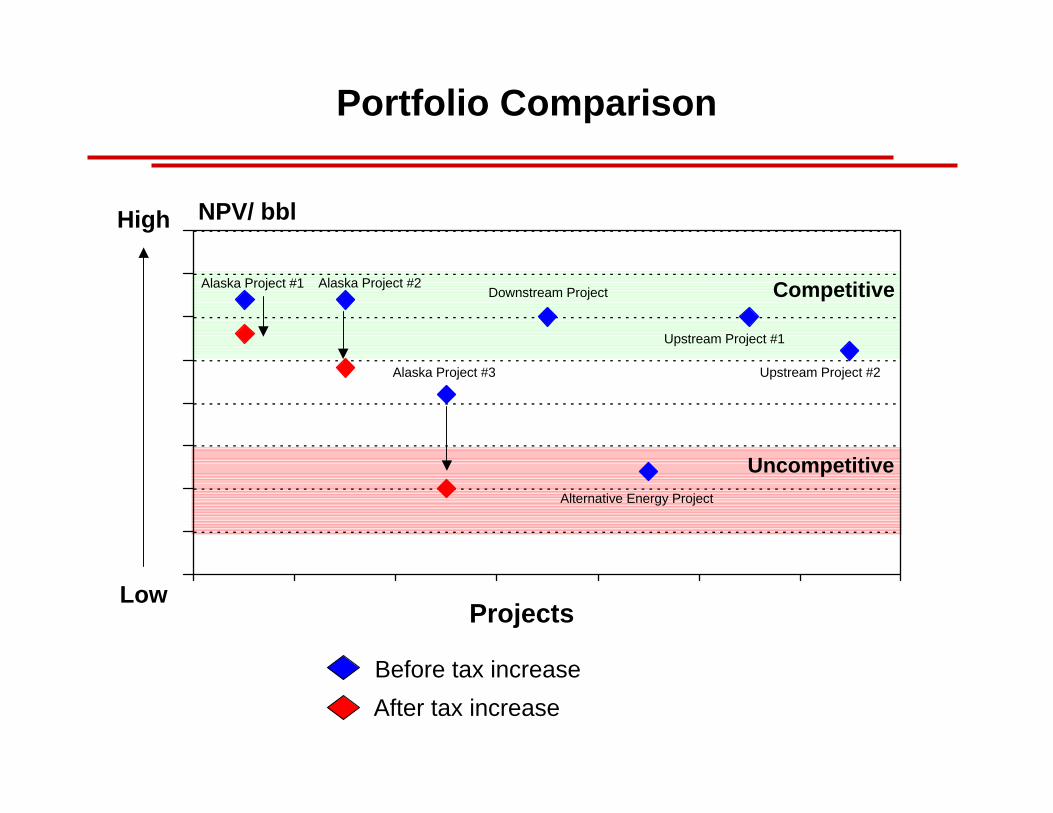
Portfolio Comparison
Alaska Project #1 Alaska Project #2
Alaska Project #3
Downstream Project
Upstream Project #1
Upstream Project #2
Alternative Energy Project
High
Low
NPV/ bbl
Competitive
Uncompetitive
Before tax increaseAfter tax increase
Projects
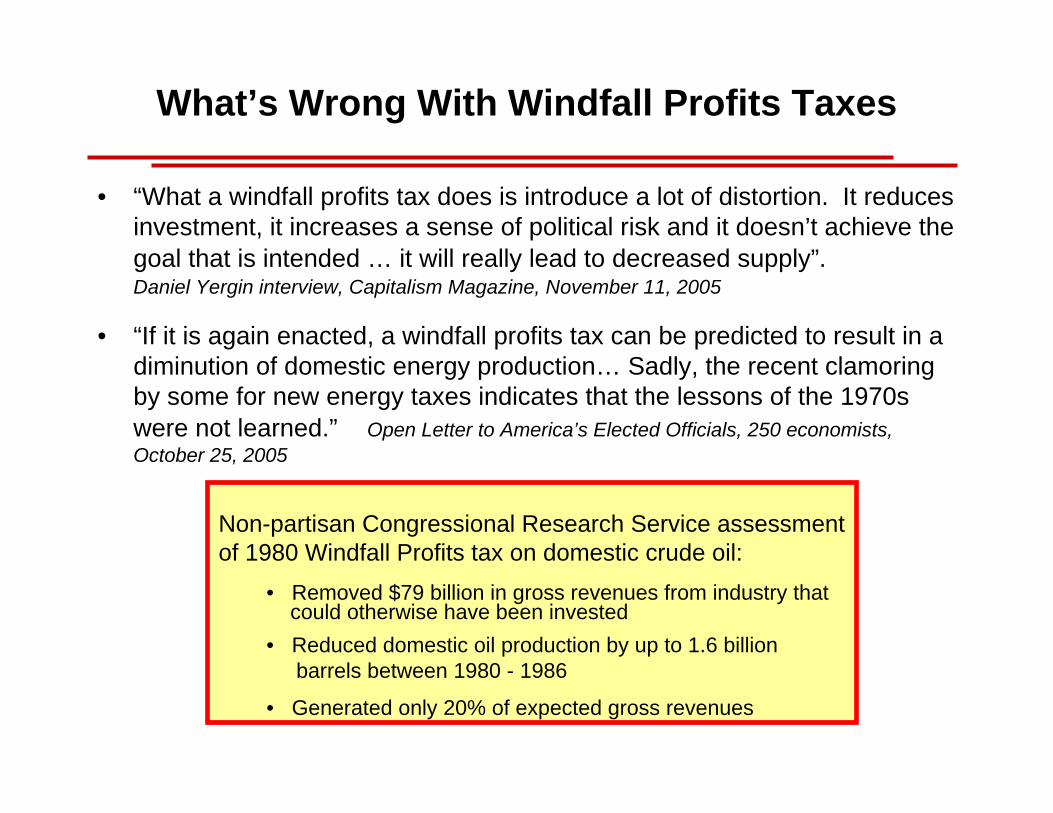
What’s Wrong With Windfall Profits Taxes
• “What a windfall profits tax does is introduce a lot of distortion. It reduces investment, it increases a sense of political risk and it doesn’t achieve the goal that is intended … it will really lead to decreased supply”.Daniel Yergin interview, Capitalism Magazine, November 11, 2005
• “If it is again enacted, a windfall profits tax can be predicted to result in a diminution of domestic energy production… Sadly, the recent clamoring by some for new energy taxes indicates that the lessons of the 1970s were not learned.” Open Letter to America’s Elected Officials, 250 economists, October 25, 2005
Non-partisan Congressional Research Service assessmentof 1980 Windfall Profits tax on domestic crude oil:
• Removed $79 billion in gross revenues from industry thatcould otherwise have been invested
• Reduced domestic oil production by up to 1.6 billion barrels between 1980 - 1986
• Generated only 20% of expected gross revenues
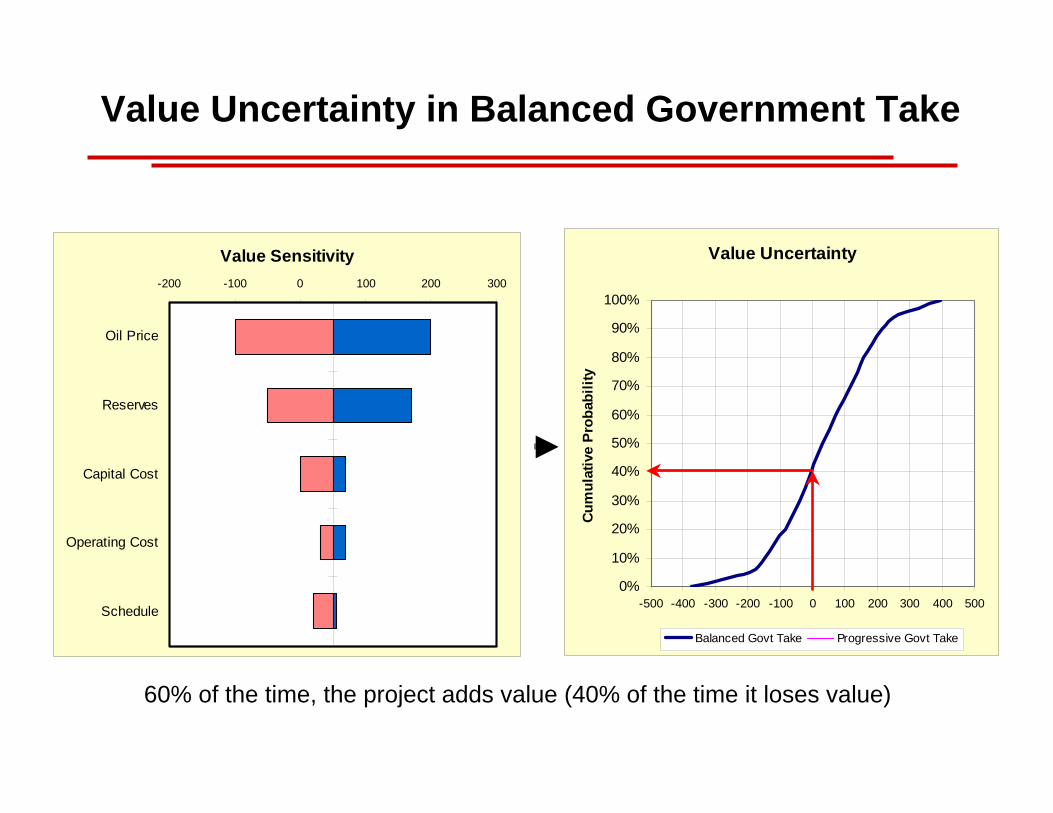
Value Uncertainty
0%
10%
20%
30%
40%
50%
60%
70%
80%
90%
100%
-500 -400 -300 -200 -100 0 100 200 300 400 500Cu
mul
ativ
e Pr
obab
ility
Balanced Govt Take Progressive Govt Take
Value Sensitivity-200 -100 0 100 200 300
Oil Price
Reserves
Capital Cost
Operating Cost
Schedule
Value Uncertainty in Balanced Government Take
60% of the time, the project adds value (40% of the time it loses value)
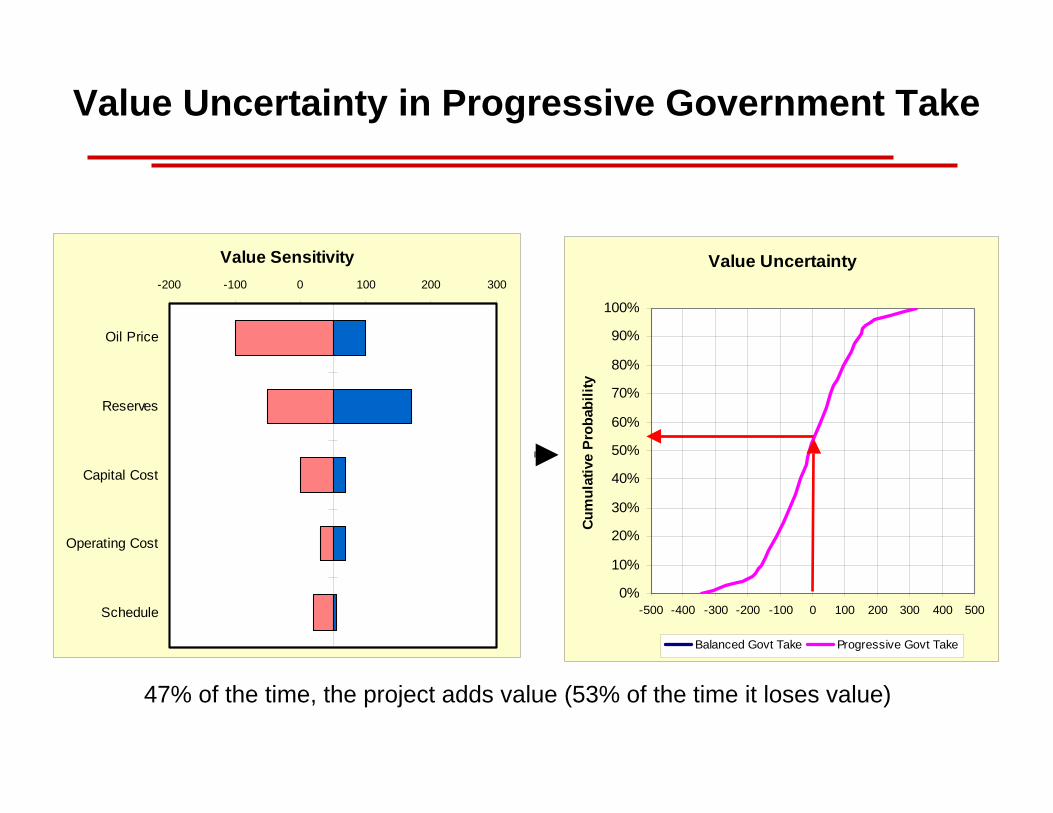
Value Sensitivity-200 -100 0 100 200 300
Oil Price
Reserves
Capital Cost
Operating Cost
Schedule
Value Uncertainty
0%
10%
20%
30%
40%
50%
60%
70%
80%
90%
100%
-500 -400 -300 -200 -100 0 100 200 300 400 500
Cum
ulat
ive
Prob
abili
ty
Balanced Govt Take Progressive Govt Take
Value Uncertainty in Progressive Government Take
47% of the time, the project adds value (53% of the time it loses value)

Value Uncertainty
0%
10%
20%
30%
40%
50%
60%
70%
80%
90%
100%
-500 -400 -300 -200 -100 0 100 200 300 400 500
Cum
ulat
ive
Pro
babi
lity
Balanced Govt Take Progressive Govt Take
53% Chance of
Losing Money
40% Chance of
Losing Money
Balanced and Progressive Value Uncertainty Comparison
In this example:
• Under a balanced government take the project would be developed
• Under the progressive government take the project would not go forward.

Finding, Development & Production Costs
$0
$4
$8
$12
$16
$20
1999 2000 2001 2002 2003 2004 2005
ProductionF&D
2006 Dollars per Barrel of Oil Equivalent
More than Doubled Since 1999
Source: J.S. Herold
Excludes all government take ($20-25/bbl), adjustment for the time value of money &
a cost of capital return
Key Messages from Corporate Perspective
• Current tax rate already uncompetitive given cost & prospectivity
• Proposed tax increases will reduce investment & production in Alaska
• U.S. federal windfall profits taxes lowered production and failed to produce expected revenues

2/27/06 – Slide 17
Jim BowlesPresident
ConocoPhillips Alaska

Summary
• Higher taxes will reduce investments– 20% strikes the right balance– Increased Tax rate and windfall profits surcharge
decreases project value
• Recognition of transition investments is fair
• Reasonable start date