indo-bangla trade: composition, trends and way … asia meeting 2...1 revised draft indo-bangla...
TRANSCRIPT

Revised dRaft
Indo-Bangla Trade: Composition, Trends
and Way Forward
Md Abul Basher
AprIl 2013

1
REVISED DRAFT
Indo-Bangla Trade: Composition, Trends and Way Forward
Md. Abul Basher
April 2013
The author is Senior Research Fellow, Bangladesh Institute of Development Studies, Dhaka, Bangladesh. This paper has been prepared at the request of the Commonwealth Secretariat. The study is being made available in the form and language in which it was received. Any shortcomings and views expressed in this paper are those of the author and do not necessarily reflect those of the Commonwealth Secretariat.
While the technical analysis and results presented here are finalised, this version of the report has not been copyedited.

2
Executive Summary South Asia has become one of the most vibrant economic regions of the world with its rising share in global output. India accounts for more than fourth-fifths of the region’s total GDP. Its sustained high economic growth has increased the potential for intra-regional trade. Despite the shared objective of promoting bilateral trade, Bangladesh has largely failed to increase its exports to the Indian market. The two neighbors have has striking trade profiles. While Bangladesh’s global exports are dominated by labor-intensive manufactured commodities, its export to India is dominated by primary commodities. The shares of manufactured goods in Bangladesh’s export outlay were about 92 and 91 percent in 2001 and 2011 respectively in comparison with the corresponding shares in total exports destined to India as 51 and 45 percent respectively. Equally perplexing is the share of high skill intensive products in Bangladesh’s export to India: it stood at about 21 percent in 2011 as against of only 2.46 percent for the rest of the world. The dominance of primary commodities in Bangladesh’s imports from India is also observed. The composition of bilateral trade between these two countries (both exports and imports) has been changing over time which is marked by (i) inclusion of new products and extinction of some of the traditional ones, and (ii) change in the relative significance of different goods. An assessment on the basis of different quantitative indices namely, the revealed symmetric comparative advantage index, trade specialization index, bilateral trade index, intra-industry trade index, and trade complementary index seems to suggest that these two economies are more of competing nature. The relative significance of Bangladesh as a bilateral trade partner is diminishing due to faster integration of India with the rest of the world. However, due to India’s growing significance as source of imports, Bangladesh’s bilateral trade intensity has increased over time. Bangladesh’s export to India is small in absolute terms although it is rising over time. The rise can be explained by Bangladesh’s enhanced competitiveness and the growth of the Indian economy. Along with economic growth, India’s export composition is changing making it move up the ladder of comparative advantage across various product ranges. At the same time, it creates market openings for other countries down the ladder. The Indo-Bangla bilateral trade statistics indicate that India is changing from being a competitor to a market for some Bangladeshi exports. As long as Indian economy continues to grow, such opportunities for Bangladesh will expand. Given the emerging trends, Bangladesh does not have to reinvent the wheel to increase its export to India. Taking care of the usual suspects that limit country’s overall manufacturing and other trade-related competitiveness will suffice. A three-tier approach to tackle the obstacles to export at the border, behind the border and over the border will be needed. More than half of the bilateral trade between India and Bangladesh took place through land ports and it is more likely to increase with the implementation of transit facilities provided to India, Nepal and Bhutan by Bangladesh. Although 16 land ports are operating between India and Bangladesh, Benapole-Petrapole is by far the most important one. The users of this port identify a number of areas for improvements that include, amongst others,

3
construction of more sheds and cold storage facilities for perishables; procurement of new cranes and forklifts; construction of a bypass road to reduce the traffic jam in the port; construction of link road to be used exclusively used by the passengers vehicles and passengers entering into and exiting from Bangladesh; and streamlining and modernization of customs facilities. Infrastructure deficits and deficiencies have been a perennial problem in Bangladesh as reflected from its low level of value-addition which has been hovering at around 11 percent of GDP since 1980s. Three most important areas of infrastructure that need immediate actions are power generation, road connectivity, and management of ports. Manufacturing capacity and competitiveness of Bangladesh is seriously affected by skill shortages, which have driven real wages of skilled labourers by about 30 percent. Despite the huge demand, its supply suffers from market failures, requiring public actions to mitigate the problems. Bangladesh needs to improve its poor regulatory and business environment to attract adequate foreign investment in manufacturing and service sectors. An improvement in the country’s overall business environment will augment its external competitiveness and export penetration into other economies, including India. Finally, several non-tariff barriers (NTBs) seriously affect Bangladesh’s exports to India. The two neighboring governments need to work closely to overcome these over the border problems.
4
Indo-Bangla Trade: Composition, Trends and Way Forward
I. Introduction Over the last twenty-five years, South Asia has grown twice as fast as the rest of the world.1Most of the countries in the region embarked upon a more systematic and persistent trade liberalization measures since the early 1990s and on the whole such policy stance has been maintained. This change in policy orientation contributed to improved trade performance of the region, coinciding with accelerated economic and per capita income growth (annex A.1). All SAARC member countries managed to maintain the growth momentum notwithstanding different various natural as well as policy shocks, raising their shares in global output (annex A.2). Nevertheless, the performance of individual South Asian countries differ significantly reflecting their positions at different rungs of the ladder of comparative advantage, and thus providing economic basis for intra-regional trade.2Enhanced outward orientation and improved growth performance also provide the potential for increased regional trade and economic cooperation. In reality, however, South Asia is still one of the least-integrated regions of the world. Ideally, it should involve less time and financial resources for a South Asian country to export to its neighbors compared to those markets such as in Europe and North America. However, trade flows within South Asia more often face stricter barriers in the region than elsewhere. The intra-regional trade accounts for just about 5 percent of the total trade of the region, in comparison with most recent estimates of global average of intra-regional trade of 35 percent and region-specific comparable figures of 70 percent for the EU, 49 percent for NAFTA, 25 percent for ASEAN, 16 percent for CARICOM, and 10 percent for COMESA (Razzaque 2012). Increased integration with rest of the world while step-siding own neighbors is unique to South Asia – a South Asian Conundrum. Like any other South Asian countries, Bangladesh also needs to think about expanding regional trade as a source of economic growth. Policymakers both in Bangladesh and India are concerned about the meager bilateral trade and keen to bring dynamism to it, as reflected in their continued dialogues and efforts. The sixth Five Year Plan of Bangladesh attaches special importance to regional cooperation and the signing of the South Asian Free Trade Area (SAFTA) agreement by SAARC member countries also indicates their shared objectives for closer economic integration. According to trade theories export potentials of any country are not omnipresent. Therefore, in its efforts to realize the above shared objectives, countries should look for the areas of their comparative advantage to maximize the gains from any policy support measures. At the same time, it is important to recognize that the comparative advantage could change over time.
1South Asia comprises eight economies- Afghanistan, Bangladesh, Bhutan, India, Maldives, Nepal, Pakistan and
Sri Lanka. Seven of them, excluding Afghanistan, formed the South Asian Association for Regional
Cooperation (SAARC). 2India is the main economic powerhouse of the region accounting for 2.79 percent of world GDP and about 82.1
percent of total GDP of SAARC countries in 2011.

5
Against the above backdrops, this paper examines the trade prospects between India and Bangladesh with emphasis on how the later, faced with a growing bilateral trade-deficit, can expand its exports to the former. It reviews the trade policy of Bangladesh, composition and trends of bilateral trade between Bangladesh and India, analyzes trade data to ascertain the trade complementarities between the two countries. It also discusses the non-tariff barriers that hinder Bangladesh’s export to India and provides some policy recommendations.
II Bangladesh’s trade policies and implications for Indo-Bangla trade
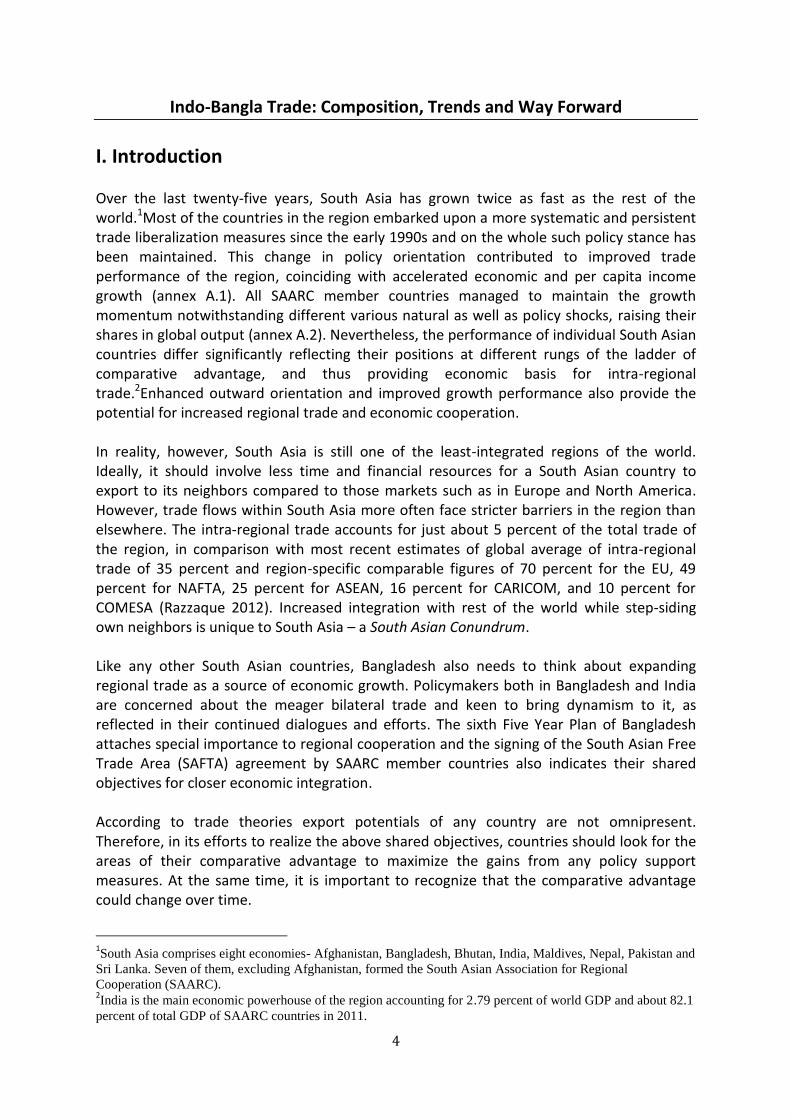
Gradual changes of Bangladesh’s trade policies provide an opportunity for enhanced Indo-Bangla trade. Three distinct phases can be identified in Bangladesh’s trade policy regimes. The first phase (1972-75) was distinguished for heavy controls on export and import, and pervasive price control. The second phase (1976-1990) was marked by a move towards market-based economy, beginning of de-nationalization, modest downward adjustment of tariffs, partial elimination of quantitative restriction, and policy support to the RMG export. The third phase (1990-to date) approached trade liberalization in a more concerted manner. Major progress made so far includes substantial scaling down and rationalization of tariffs, removal of trade-related quantitative restriction, unification of exchange rates and move to a managed floating exchange rate regime. Despite the frequent skids from its path, the trade liberalization agenda continues to make overall progress over time. The overall (trade-weighted) real exchange rate of the country also has moved within a fairly small band of about 8% around its trend since the adoption of floating system. It showed a depreciating trend from FY04 to FY07, followed by a modest appreciation since then. The nominal rate of protection, measured as the unweighted sum of average rate of tariffs and para tariffs declined from 59.74 percent in FY92 to 26.51 percent in FY12 (annex A.3). The enhanced outward policy orientation is also reflected in country’s overall trade outcome, which is not matched by Indo-Bangla bilateral trade statistics. Openness of Bangladesh economy, as measured by the ratio of export-plus-imports-to-GDP, increased from 16 percent on average in the ’80s to 40 percent in the ’00s (WB, 2012). Exports as a share of GDP grew from 6.7 percent in FY91 to 20.6 percent in FY11. Whatever impact the liberalized regime has on Indo-Bangla bilateral trade is predominantly unidirectional, favoring to Indian exports to Bangladesh. It may also have impacted the informal trade between these two countries, which, if fully taken into account, may contradict this characterization. However, no recent information is available to assess the impact of trade liberalization on informal trade between India and Bangladesh. Bangladesh maintained a robust growth of exports through concentrating on a few markets which excludes India. During this decade, export of most of the top 15 products of Bangladesh grew at a faster rate than the growth of world export of these products (Figure 1). The vertical axis in Figure 1 represents the average growth rate of exports of the top 15 products by Bangladesh during 2001-11 and the horizontal axis represents the average growth of world exports of the same commodities during the same period. The figure
6
implies consolidation of Bangladesh’s export strength in the existing products which did not have notable presence in Indian market. As a result, India as a destination market accounted for only about 2 percent while the EU and USA together accounted for about two-thirds of Bangladesh’s total export. Figure 1: Growth of Bangladesh’s top-15 exports vis-à-vis the rest of the world during 2001-11
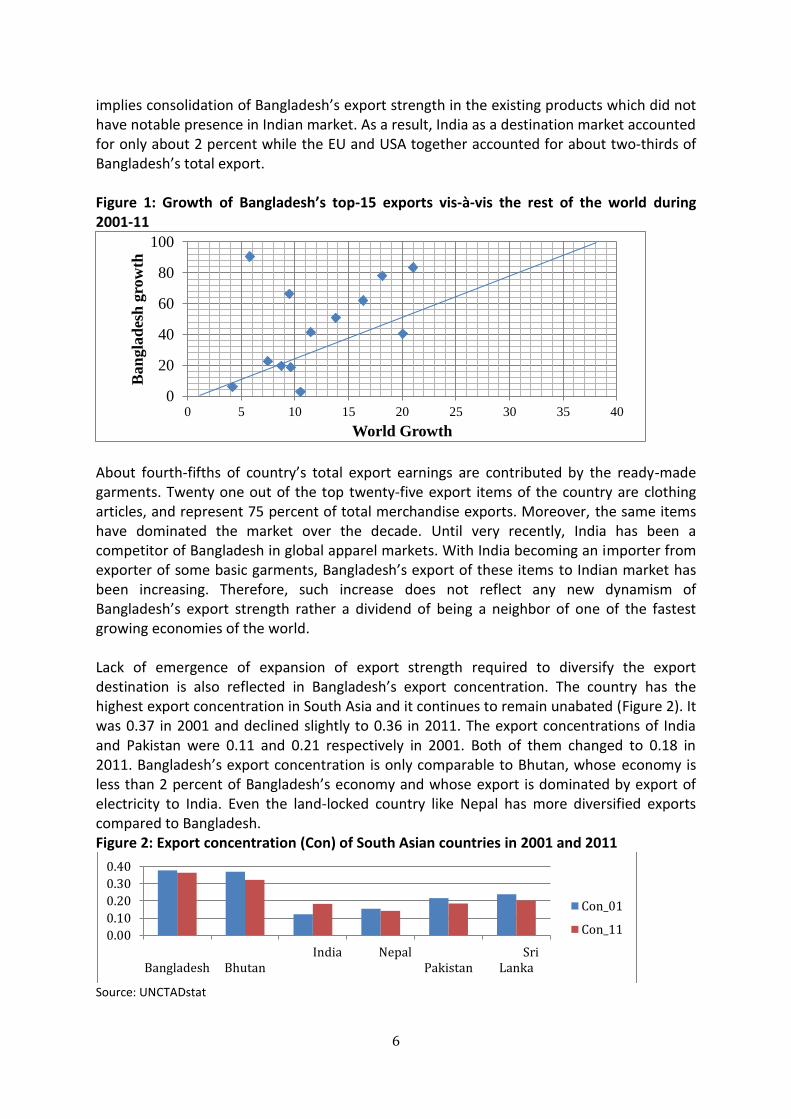
About fourth-fifths of country’s total export earnings are contributed by the ready-made garments. Twenty one out of the top twenty-five export items of the country are clothing articles, and represent 75 percent of total merchandise exports. Moreover, the same items have dominated the market over the decade. Until very recently, India has been a competitor of Bangladesh in global apparel markets. With India becoming an importer from exporter of some basic garments, Bangladesh’s export of these items to Indian market has been increasing. Therefore, such increase does not reflect any new dynamism of Bangladesh’s export strength rather a dividend of being a neighbor of one of the fastest growing economies of the world. Lack of emergence of expansion of export strength required to diversify the export destination is also reflected in Bangladesh’s export concentration. The country has the highest export concentration in South Asia and it continues to remain unabated (Figure 2). It was 0.37 in 2001 and declined slightly to 0.36 in 2011. The export concentrations of India and Pakistan were 0.11 and 0.21 respectively in 2001. Both of them changed to 0.18 in 2011. Bangladesh’s export concentration is only comparable to Bhutan, whose economy is less than 2 percent of Bangladesh’s economy and whose export is dominated by export of electricity to India. Even the land-locked country like Nepal has more diversified exports compared to Bangladesh. Figure 2: Export concentration (Con) of South Asian countries in 2001 and 2011
Source: UNCTADstat
0
20
40
60
80
100
0 5 10 15 20 25 30 35 40
Ban
gla
des
h g
row
th
World Growth
0.00
0.10
0.20
0.30
0.40
Bangladesh Bhutan India Nepal
Pakistan SriLanka
Con_01
Con_11
7
The South Asian Free Trade Area (SAFTA) agreement, which was signed by the member countries of SAARC in January 2004 to promote regional trade, is yet to make a notable impact on Indo-Bangla trade.3A number of studies evaluated the potential effects of the full implementation of SAFTA on bilateral trade flows and the findings are mixed.4
III Composition and trend of Indo-Bangla trade
Some stylized facts and recent trends Bangladesh and Indian economies are different, perhaps not so much in terms of the overall level of development but more in terms of recent growth dynamics. The former has started off a slow but persistent acceleration of growth whereas the later has maintained one of the highest growth rates of GDP in the world for more than a decade. In terms of composition of domestic outputs, there is no striking difference between these two economies. Both of them are dominated by the activities in the service sector which contributes to about 53 and 50 percent of total output in India and Bangladesh, respectively followed by the industry sector which contributes around 29 percent of GDP in both economies. As neighbors, both countries have established strong bilateral relations in political, economic, social and cultural areas since the independence of Bangladesh. The political relation had its usual undulations but the economic relation always remained strong and grew over time. Two-way trade flows between Bangladesh and India was nearly US$5.07 billion in 2011, a notable increase from US$1.12 billion in 2001, registering an average annual growth of about 26 percent. However, India’s exports to Bangladesh dominated and the resultant trade gap increased over time: to about US$2.78 billion in 2011 from about US$1.01 billion in 2001. Indo-Bangla bilateral trade flows demonstrate significant fluctuations. The growth of Bangladesh’s export to India accelerated until 2005 and started decelerating since then until 2009. During the year followed by the global economic and financial crises of 2008, Bangladesh’s export to India declined in absolute terms. It recovered strongly in 2010 resuming its earlier growth trajectory. Growth of imports from India had accelerated until it dipped in 2004, but recovered quickly. After a massive decline in 2009, it again recovered. Despite the peaks and troughs, the overall Indo-Bangla trade has increased over time, especially Bangladesh’s imports from India. Bangladesh’s export receipts from the Indian market had increased from US$0.005 billion in 1991 to US$0.51 billion in 2011. The share of
3 According to the trade liberalization program (TLP), one of the core elements of SAFTA, all non-LDC member
countries of SAARC- India, Pakistan and Sri Lanka-, shall reduce their existing tariffs to 20 percent in two years from the date of coming into the force of the treaty, and thereafter to 0-5 percent over a five year period (i.e., by 2013). However, Sri Lanka, because of its smaller size than India and Pakistan, has been allowed an extended period of six years to achieve such levels (i.e., by 2014). The LDC member countries- Bangladesh, Bhutan, Maldives, and Nepal- shall reduce the existing tariffs to 30 percent within the first two years from the date of coming into force of the treaty, and thereafter 0-5 percent in eight years (i.e., by 2016). 4 The findings of these studies are mixed. Rodriguez-Delgado (2007) predicted that SAFTA will have ‘minor
effect’ on regional trade flow. Raihan and Razzaque (2007) found that if all SAARC countries eliminate their intra-regional tariffs while keeping them intact with rest of the world, Bangladesh will gain a positive effect from trade creation which will be surpassed by the negative effect of trade diversion. Raihan (2008) found that under SAFTA Bangladesh’s export to India will increase to the tune of US$78 million. Raihan (2008), observes that “… there are some special and differential provisions for the LDC members in the SAFTA Agreement. However,… most of these provisions are rather ‘vague’ in nature and thus require substantial clarification and revision so that Bangladesh and other LDC members can effectively take advantage of these provisions.’

8
earnings from India in Bangladesh’s overall exports fell from 0.33 percent in 1991 to 0.31 in 2001, but then registered a rise to 1.88 percent in 2011 (annex A.4). Figure 3: Growth of bilateral trade between Bangladesh and India during 2001-2010
India’s exports to Bangladesh increased from US$0.2 billion in 1991 to 0.89 billion in 2001, and further to 4.56 billion in 2011. Nevertheless, the proportion of export receipts from Bangladesh in India’s overall export earnings declined from 2.42 percent in 2001 to 1.13 percent in 2011, implying a relatively faster growth of India’s overall export to the rest of the world. Bangladesh’s trade deficit is notably high with India compared to the rest of the world. The overall trade deficit of the country accounted for about 24 percent of its total imports and 32 percent of total exports in 2001. These shares remained unchanged in 2011. But Bangladesh’s trade deficit with India in 2001 was 95 of its total import from and 1925 percent of total export to it respectively. These shares declined to 82 and 448 percent respectively in 2011, yet imply that India is predominantly a source country for imports rather than a destination market for exports of Bangladesh. According to the latest information available from Bangladesh Bank, India is the second largest source of Bangladesh’s overall imports and accounted for 15.1 percent of total import of the country. Table 1: Trade deficit of Bangladesh as percentage of total imports and exports
Year With World India
With India
Import Export Import Export
2001 24.39 32.26 95.06 1,925.23
2011 24.41 32.29 81.74 447.59
Source: Computed from UNCTADstat
India’s relative significance as a bilateral trade partner is second only to China, which was the source for about 21.5 percent of Bangladesh’s total imports. Other important import sources for Bangladesh are South Korea, Singapore, Japan, Malaysia, Indonesia, Brazil, Kuwait, and Thailand with the most recent shares (in 2012) of 5.0, 4.7, 4.7, 4.4, 3.9, 3.8, 2.9 and 2.7, respectively.
-40
-20
0
20
40
60
80
100
2001 2002 2003 2004 2005 2006 2007 2008 2009 2010 2011
Bangladesh export to India Bangladesh import from India Total

9
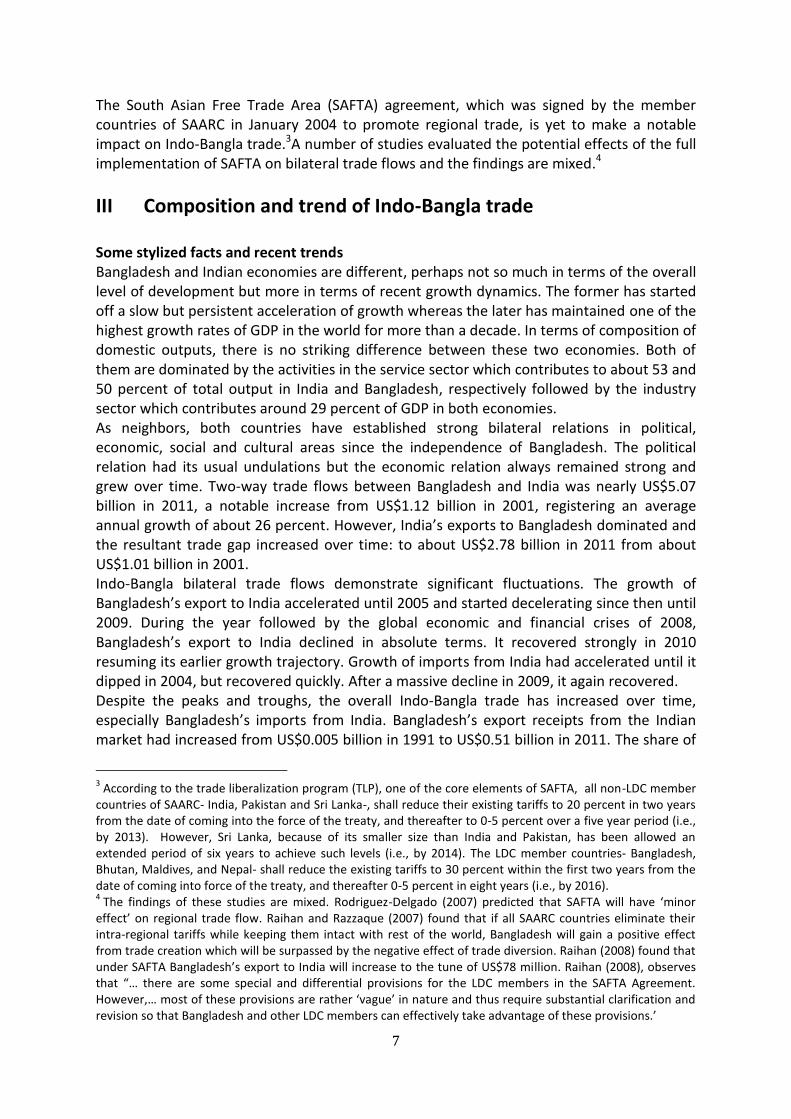
Despite being the second largest source for imports, India is the only Asian country to emerge as one of the top ten export destinations of Bangladesh. The USA is by far the largest destination for Bangladesh’s exports with a share of about one-fifth in country’s total export followed by Germany (16.4 percent), the UK (10.3 percent) France (6.6 percent), Spain (4.6 percent), Italy (4.4 percent), Canada (3.9 percent), Netherlands (3.1 percent and Belgium (2.9 percent). India’s share in Bangladesh’s overall exports was 2.7 percent in 2012. However, Bangladesh’s export to India and China has grown at an average annual rate of 28 percent compared to 14 percent for the USA and the EU respectively. This suggests that the relative significance of India as well as China as Bangladesh’s major export destinations is likely to grow in the future. The growth both in Bangladesh and India is, to a large extent, due to services. Compared to many other countries, they seem to have a much bigger share of service in GDP relative to their level of GDP per capita (Ghani, 2010) with India is emerging as a global leader in service exports. However, Indo-Bangla bilateral trade in services is insignificant. India’s export of services is dominated by modern impersonal services like information technology and information technology enabled services, while Bangladesh services are dominated by traditional personal services like movement of natural persons which brings remittances. Both countries have their niche markets elsewhere and as a result trade in services between them is yet to mark a visible increase. Dynamics of compositional change of export basket of Bangladesh to India Contrasting with overall export structure of the country, Bangladesh’s exports to India is dominated by primary not manufactured commodities (annex A.5).The shares of manufactured goods in Bangladesh’s export to global markets were about 92 and 91 percent in 2001 and 2011 respectively. During the same years, their shares in total export to India were about 51 and 45 percent respectively. Primary commodities accounted for about 35 percent of Bangladesh’s total exports to India in 2001, and 57 percent in 2011. They accounted for only 7.41 and 8.24 percent in Bangladesh’s total export to global markets during the same years. Agricultural raw materials accounted for less than 2 percent of country’s total exports to global markets both in 2001 and 2011. But they hovered around 27 percent of country’s total export to India during the same years. Bangladesh’s exports of manufactured goods to India contain a puzzling feature. While labor-intensive commodities, with a 87 percent share, dominated in Bangladesh’s total export to global markets in 2011, they accounted for only about 22 percent of total exports to India in the same year.5Similarly, the share of high skill intensive products, which accounted for 2.46 percent of country’s total exports to global markets as against of 21 percent of country’s total export to India.
5According to UNCTAD’s classification, labor intensive commodities include clothing, fabrics, yarn, apparel
and clothing accessories etc. High skill intensive commodities include leather products, footwear, textile fiber,
chemical products, fertilizers, machineries and transport equipments etc.
10
Figure 4: Share (in%) of different product groups in Bangladesh’s exports to India during 2001 and 2011
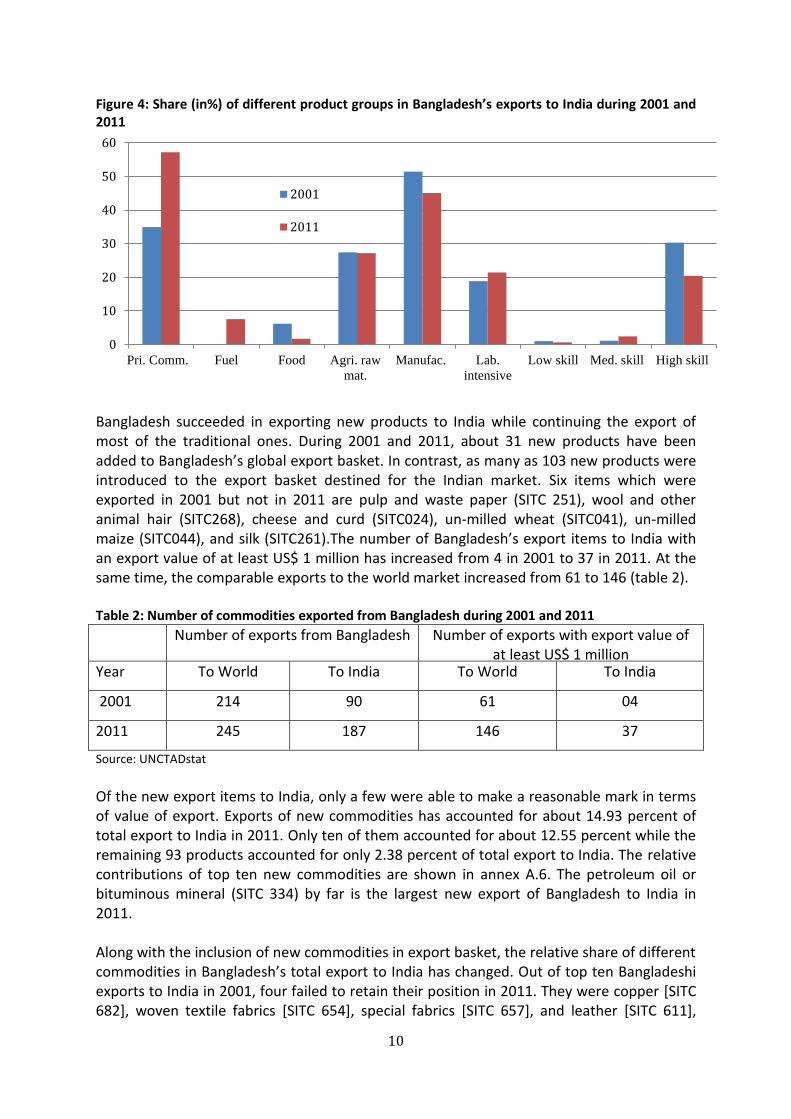
Bangladesh succeeded in exporting new products to India while continuing the export of most of the traditional ones. During 2001 and 2011, about 31 new products have been added to Bangladesh’s global export basket. In contrast, as many as 103 new products were introduced to the export basket destined for the Indian market. Six items which were exported in 2001 but not in 2011 are pulp and waste paper (SITC 251), wool and other animal hair (SITC268), cheese and curd (SITC024), un-milled wheat (SITC041), un-milled maize (SITC044), and silk (SITC261).The number of Bangladesh’s export items to India with an export value of at least US$ 1 million has increased from 4 in 2001 to 37 in 2011. At the same time, the comparable exports to the world market increased from 61 to 146 (table 2). Table 2: Number of commodities exported from Bangladesh during 2001 and 2011
Number of exports from Bangladesh Number of exports with export value of at least US$ 1 million
Year To World To India To World To India
2001 214 90 61 04
2011 245 187 146 37
Source: UNCTADstat
Of the new export items to India, only a few were able to make a reasonable mark in terms of value of export. Exports of new commodities has accounted for about 14.93 percent of total export to India in 2011. Only ten of them accounted for about 12.55 percent while the remaining 93 products accounted for only 2.38 percent of total export to India. The relative contributions of top ten new commodities are shown in annex A.6. The petroleum oil or bituminous mineral (SITC 334) by far is the largest new export of Bangladesh to India in 2011. Along with the inclusion of new commodities in export basket, the relative share of different commodities in Bangladesh’s total export to India has changed. Out of top ten Bangladeshi exports to India in 2001, four failed to retain their position in 2011. They were copper [SITC 682], woven textile fabrics [SITC 654], special fabrics [SITC 657], and leather [SITC 611],
0
10
20
30
40
50
60
Pri. Comm. Fuel Food Agri. raw
mat.
Manufac. Lab.
intensive
Low skill Med. skill High skill
2001
2011

11
which were replaced by non-ferrous base metal and scrap [SITC 288], fruits and nuts [SITC 057], petroleum oils or bituminous minerals [SITC 334], and cotton [SITC 263]. Top ten exports of 2001 accounted for 52.77 and 43.29 percent of total Bangladeshi exports to India in 2001 and 2011 respectively. Similarly, top ten commodities of 2011 accounted for 48.33 and 65.23 percent of total exports in 2001 and 2011 respectively. Annex A.7 shows the relative importance of top ten commodities in Bangladesh’s total export to India during 2001 and 2011. The correlation between the ranking of these commodities in 2001 and 2011 is 0.06, implying a significant change in the composition of top ten exports of Bangladesh to India. The correlation between the percentage share of these commodities in 2001 and 2011 in the corresponding total export is 0.35 only, and reiterates the change in the composition of the main exports of Bangladesh to India during last decade. Being a developing country, total imports of Bangladesh is understandably dominated by manufactured goods. However, Bangladesh’s import from India is heavily dominated by primary commodities and food instead of manufactured goods (annex A.8). This coupled with our earlier findings that Bangladesh’s export to India also dominated by primary commodities indicates the dominance of intra-industry trade in their bilateral economic relationship. The nature of Indo-Bangla relationship is analyzed in detail in section IV. Bangladesh’s reliance on India for primary commodities, food, and agricultural raw materials is increasing over time (figure 5). Figure 5: Share (in%) of different groups of commodities in total import from India by Bangladesh during 2001 and 2011
Source: UNCTADstat
India’s importance to Bangladesh as a source of imports has increased overtime not only in terms of value of imports but also in terms of number of imported commodities. Total number of commodities imported by Bangladesh from India increased from 212 in 2001 to 241 in 2011. Three commodities imported in 2001 but not in 2011 were wood particles and waste (SITC 246), meat of bovine animals (SITC 011), and fuel wood (SITC 245). The number of commodities with import value at least US$ 1million has also increased from 98 in 2001 to 213 in 2011. To put them in context, the number of commodities imported from world markets increased from 235 in 2001 to 252 in 2011, and the number of imports from the same markets with an import value of at least US$ 1 million increased from 139 to 239 during the same period. The share of the new commodities added in Bangladesh’s import basket from India in 2011in total import (from India) is not significant and accounted for only about 0.23
0
10
20
30
40
50
60
70
Pri.
Comm.
Food Agri. raw
mat.
Manufac. Lab.
intensive
Low skill Med. skill High skill
20012011

12
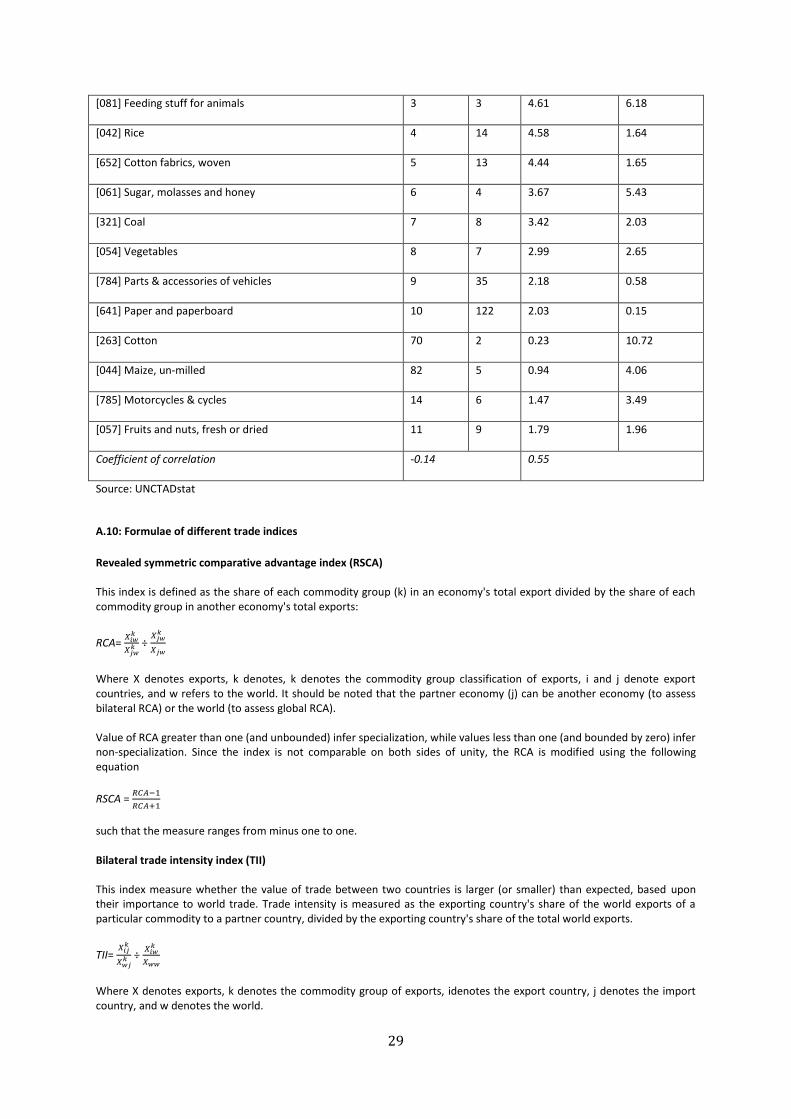
percent of total import from India. Only five commodities accounted for about 85 percent of total value of all new imports. They are; natural gas (SITC 343), sulphur and unroasted iron pyrites (SITC 274), hides and skins (SITC 211), meat (SITC017), and cereal meal and flour (SITC047). Although the new imports did not seem important in terms of their relative share, the relative importance of the existing imports changed during 2001-11. Out of top ten imports of Bangladesh from India in 2001, four failed to retain their position in 2011. They were rice [SITC 042], cotton fabrics [SITC 652], parts and accessories of ] [SITC 784, and paper and paper board [SITC 641], which were replaced by cotton [SITC 263], maize [SITC 044], motorcycles and cycles [SITC 785], and fruits and nuts [SITC 057] in2011. Top ten imports of 2001, accounted for 50.55 and 39.77 percent of Bangladesh’s total import from India in 2001 and 2011 respectively. Similarly, top ten imports of 2011, accounted for 41.76 and 55.92 percent of Bangladesh’s total import from India in 2001 and 2011 respectively. Annex A.9 shows the relative importance of top ten commodities in Bangladesh’s total export to India during these two years. The correlation between the ranking of these commodities in 2001 and 2011 is -0.14, implying a significant change in the composition of top ten imports of Bangladesh from India. However, the correlation between the percentage share of these commodities in 2001 and 2011 in the corresponding total export is 0.55.
IV Explaining Indo-Bangla trade
The Indo-Bangla trade relation appears to be concentrated in a few commodities, mostly in the domain of primary commodities.When viewed through global lenses, Bangladesh’s export strength does not seem to lie in the area of primary commodities. Therefore, it raises a question about Bangladesh’s export complementarity with India. Complementary trading partners, in many ways, are characterized by the differences in the goods and services produced and consumed. Economies that are structurally different from one another and produce different basket of goods and services have greater potential for gains from trade. To assess the degree to which Bangladesh and Indian economies can be considered as complementary rather competing, several indices are constructed.6 They are: (i) revealed symmetric comparative advantage (RSCA) index (ii) trade specialization index (TSI), (iii) bilateral trade intensity index (BTII), (iv) intra-industry trade index (IITI), and (v) trade complementary index (TCI). These indices are constructed using Standard International Trade Classification (SITC) 3- digit level data as published by UNCTAD.7 Different trade indices Revealed symmetric comparative advantage (RSCA) index Annex A.11 presents the RSCA indices for top fifteen exports of Bangladesh and India in 2011 to assess their export competitiveness both bilaterally and globally. Nine commodities are part of the top fifteen exports of both countries, which to some extent provide primary indication that these two countries are competing on the same turf in the global market for
6One has to bear in mind that each of these indices contains certain limitations. The indices themselves cannot
explain why trade takes place in the first place. They also fail to identify the problems that constrain exports. 7The formulae used to estimate these indices are provided in annex A.10.

13
their exports. The RSCA ranges from -1 to 1, where a value greater than (less than) zero reveals a country’s comparative advantage (disadvantage) in the export of a good. While it is possible for Bangladesh and India to each have comparative advantage (disadvantage) in one commodity relative to the world markets, only one of them will have comparative advantage relative to the other country in that particular commodity. The commodities, in which both countries have comparative advantage relative to the world markets, may not be suitable candidates for bilateral trade as both countries will be better off by exporting them in the world markets. The ideal candidates for Bangladesh to increase its export to India will be the commodities in which it has clear comparative advantage and India has comparative disadvantage not only relative to Bangladesh but to world markets as well. Out of the twenty one commodities listed in annex A.11, Bangladesh has comparative advantage relative to India in case of fourteen commodities. Most notables of these commodities are different categories of readymade garments and leather products. However, out of these fourteen commodities, India has comparative advantage relative to the world markets in case of thirteen of them. Both countries compete with each other in case of these thirteen commodities in the world market. The only commodity in which Bangladesh has clear advantage and can potentially increase its exports to India is fertilizers [SITC 562]. However, Bangladesh has limited installed production capacity in this commodity. Out of the one hundred and eighty seven commodities exported to India in 2011, Bangladesh has clear advantage over India in only sixteen (Bangladesh has comparative advantage over India and India has comparative disadvantage relative to world markets). The combined export value of these commodities accounted only for 2.5 percent of Bangladesh’s total export. India has comparative advantage relative to Bangladesh in the export of seven commodities. Bangladesh has comparative disadvantage in case of six of them relative to world market giving India a clear advantage to increase the export of these six commodities to Bangladesh. They are petroleum oils and bituminous [SITC 334], medicaments [SITC 542], rice [SITC 042], ships, boats and floating structure [SITC 793], telecommunication parts and equipments [SITC 764], and iron ore and concentrates [SITC 281]. Out of the two hundred and forty one commodities exported by India to Bangladesh in 2011, India has clear advantage (India has comparative advantage over Bangladesh and Bangladesh has comparative disadvantage relative to world) in case of one hundred and ninety five commodities. Total export value of these commodities accounted for about 85.1 percent of India’s total export. Trade Specialization Indices (TSI) The trade specialization index analyzes the bilateral competitiveness by comparing the net flow of goods (exports minus imports) to the total flow (exports plus imports) for Bangladesh and India. A positive value indicates that a country exports more than it imports of a commodity. The maximum value of this index could be 1, which would mean export specialization, where the minimum value could be -1, which would mean import specialization. A total of 35, out of the 254 commodities that Bangladesh exports globally, have positive TSI, implying that Bangladesh specializes in their production and export. However, India also
14
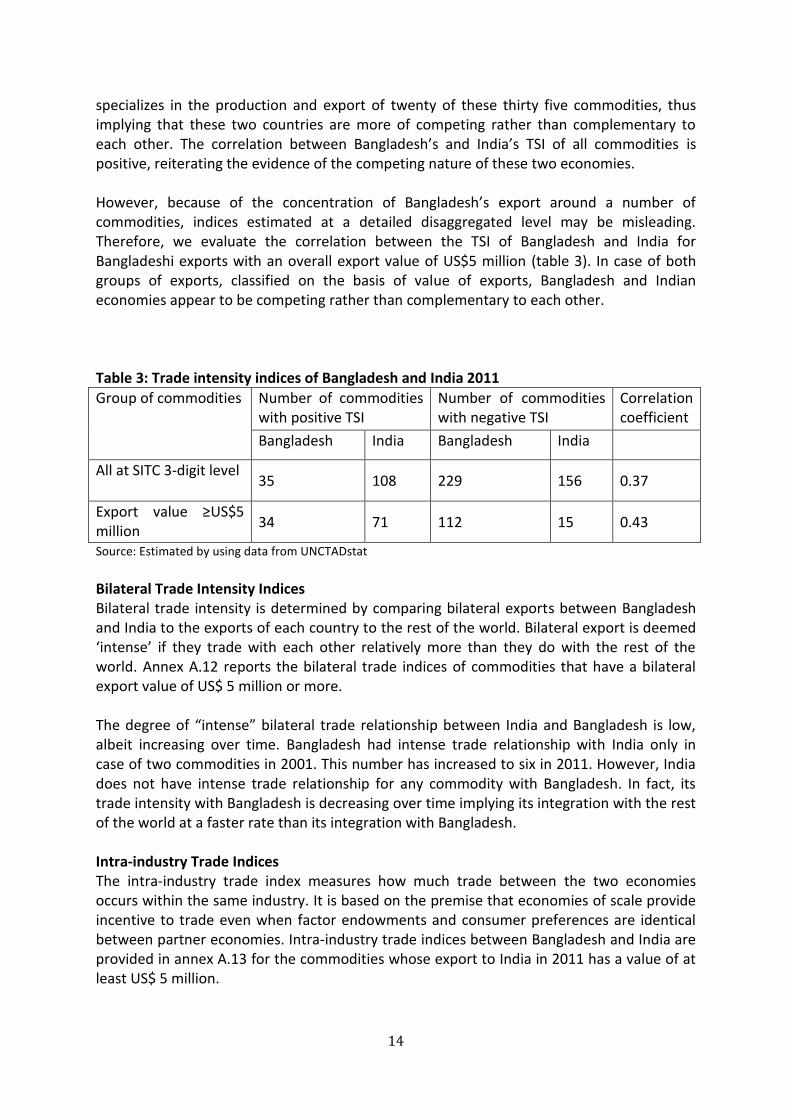
specializes in the production and export of twenty of these thirty five commodities, thus implying that these two countries are more of competing rather than complementary to each other. The correlation between Bangladesh’s and India’s TSI of all commodities is positive, reiterating the evidence of the competing nature of these two economies. However, because of the concentration of Bangladesh’s export around a number of commodities, indices estimated at a detailed disaggregated level may be misleading. Therefore, we evaluate the correlation between the TSI of Bangladesh and India for Bangladeshi exports with an overall export value of US$5 million (table 3). In case of both groups of exports, classified on the basis of value of exports, Bangladesh and Indian economies appear to be competing rather than complementary to each other. Table 3: Trade intensity indices of Bangladesh and India 2011
Group of commodities Number of commodities with positive TSI
Number of commodities with negative TSI
Correlation coefficient
Bangladesh India Bangladesh India
All at SITC 3-digit level 35 108 229 156 0.37
Export value ≥US$5 million
34 71 112 15 0.43
Source: Estimated by using data from UNCTADstat
Bilateral Trade Intensity Indices Bilateral trade intensity is determined by comparing bilateral exports between Bangladesh and India to the exports of each country to the rest of the world. Bilateral export is deemed ‘intense’ if they trade with each other relatively more than they do with the rest of the world. Annex A.12 reports the bilateral trade indices of commodities that have a bilateral export value of US$ 5 million or more. The degree of “intense” bilateral trade relationship between India and Bangladesh is low, albeit increasing over time. Bangladesh had intense trade relationship with India only in case of two commodities in 2001. This number has increased to six in 2011. However, India does not have intense trade relationship for any commodity with Bangladesh. In fact, its trade intensity with Bangladesh is decreasing over time implying its integration with the rest of the world at a faster rate than its integration with Bangladesh. Intra-industry Trade Indices The intra-industry trade index measures how much trade between the two economies occurs within the same industry. It is based on the premise that economies of scale provide incentive to trade even when factor endowments and consumer preferences are identical between partner economies. Intra-industry trade indices between Bangladesh and India are provided in annex A.13 for the commodities whose export to India in 2011 has a value of at least US$ 5 million.

15
Annex A.13 shows the intra industry trade indices for commodities in which Bangladesh has an export value of US$ 5 million or more in 2011. Bangladesh had significant relationship in case of five of them in 2001. This number has increased to seven in 2011. India on the other hand had significant trade relation with Bangladesh in case of six commodities in 2001. This number has decreased to four in 2011, implying diminishing importance of Bangladesh as a trade partner. Trade Complementraity Indices The trade complementarity index (TCI) assesses how well the export structure of one country matches the import structure of the other country. The critical value of TCI is 40, meaning any value less than this level means lack of trade complementarity. The trade complementarity indices for Bangladesh and India has been constructed for each year from 2001 to 2011 by using the bilateral trade information (export and import) of these two countries disaggregated at SITC 3-digit level. As evident from table 4, India has clear export complementarity with Bangladesh since 2001. India being the second largest import source for Bangladesh, this result is quite expected. Bangladesh, on the other hand, clearly lacks the export complementarity with India. Its export complementarity is less than ten for the whole decade and shows no sign of any improvement. Table 4: Export complementarity between Bangladesh and India in different years
Year Bangladesh India
2001 9.21 45.04
2002 8.66 45.99
2003 8.50 46.84
2004 8.34 45.29
2005 9.60 45.95
2006 8.24 44.60
2007 8.93 46.28
2008 9.85 48.48
2009 8.31 28.91
2010 9.50 43.16
2011 9.17 44.12
Source: Estimated using data from UNCTADstat
Impact of real exchange rate on export of Bangladesh to India It is difficult to identify any sizable complemenatrity between the economies of Bangladesh and India on the basis of different trade indices. Nevertheless, Bangladesh’s export to India is growing over time, even at a faster rate than its growth to traditional export markets such as the US and EU. Therefore, it is important to see what explains this growth. It is postulated that in an open economy, two main determinants of exports of a country are the real exchange rate and foreign (destination country) income. In fact, the main target of exchange rate policy of the country is to foster exports and remittances. Although introduced a “floating” exchange rate policy in 2003, the de-facto exchange rate regime in
16
Bangladesh has been a managed one with a dominant role played by the central bank in determining value of taka. The real exchange rate of Bangladesh with India is estimated as:
, (1)
where PI and PB represent the price levels (measured in terms of consumer price index) in India and Bangladesh, e is the nominal exchange rate (equivalence of one Indian rupee in terms of Bangladeshi taka). Thus, this estimate of the real exchange rate shows to what extent Indian products are expensive vis-à-vis Bangladeshi products. Based on the above formulation, a rise in the real exchange rate would mean increase of Bangladesh’s competitiveness vis-à-vis India and vice versa. It emerges from our econometric exercises (e.g. from Granger causality tests) that the real exchange rate and GDP of India affect the exports of Bangladesh to India. While statistically one can reject the hypothesis that real exchange rate does not cause exports of Bangladesh to India, we fail to reject the hypothesis that exports of Bangladesh to India does not affect the real exchange rate. The real exchange rate is a useful summary of external competitiveness of a country vis-à-vis its export destination. Thus the results of causality test imply that all else remaining unchanged, Bangladesh can increase its exports to India by improving its competitiveness, conforming the fundamental recipe for export promotion. Similarly, the hypothesis that GDP of India does not Granger cause Bangladesh’ export to India can be rejected at the conventional levels of statistical significance but we fail to reject that Bangladesh’s export does not affect economic activities (as reflected in GDP) of India. This implies all else remaining unchanged; Bangladesh’s exports to India will change with the growth of the Indian economy. To analyze the direction of the relationship between the real exchange rate, GDP of India and Bangladesh’s export to India, a linear specification as (2) is empirically evaluated, where XB is Bangladesh’s export to India, YI is GDP of India. In evaluating the above specification, we use the annual data for the period of 1990-2011. Keeping the analysis limited to this period is justified by the fact that Bangladesh economy was more or less closed before the 1990s. Based on the results from the unit roots and cointegration analysis, it is possible to confirm a valid long-run relationship among these variables in equation (2). The signs associated with all the estimated parameters of the long-run relationship turns out as expected. The findings seem to suggest that while Bangladesh’s exports to India will continue to increase as a result of growth the latter’s economy all else remaining unchanged, Bangladesh can also accelerate its exports by improving its competitiveness.8
8We use a VEC model to evaluate the speed of adjustment parameters α(y) at which y(t) converges to the long-
run equilibrium relationship and fail to get a meaningful result due to inadequacy of data. In particular, we had
only 19 observations to estimate 24 parameters in VEC.

17
The empirical results also imply that Bangladesh’s exports to India are highly responsive to changes in the competitiveness of the country as reflected in real exchange rate movements. All else remaining unchanged; a one percent increase in competitiveness is likely to increase Bangladesh’s export to India by about 8 percent. A one percent increase of Indian GDP is found to be associated with0.8 percent rise in Bangladesh’s exports to India. These results indicate that improved competitiveness matter for exports. While policy induced measures such as exchange rate management can be a difficult option, enhanced external competitiveness can be achieved through tackling supply side hindrances.
V. Non-tariff trade barriers between Bangladesh and India
As discussed in section IV, both growth in Indian economy and enhanced external competitiveness of Bangladesh are significant determinant of country’s exports to India. Since Indian economy is expected to continue its growth momentum, opportunities for Bangladesh to increase its export to India are likely to continue. One of the main hindrances to take the full advantage of the full potential is the non-tariff barriers that hinder bilateral trade between India and Bangladesh. It has been estimated that only about 30 percent of Bangladesh’s import needs are being sourced from the region despite the potential of the region’s being able to supply all the import requirements of the country. In the case of the inputs of Bangladesh’s main export sector- readymade garments (RMG), only $147 million (18.3 percent of the total need of the country) is imported from the region while the region’s total exports of the same inputs are almost $2.7 billion in 2011(Razzaque 2012). Intermediate inputs when imported from a neighbouring country to produce the final export goods for the global market can potentially reduce the lead time. However, a plethora of non-tariff measures severely constrain bilateral trade. The trade between these two countries also suffers from a poor state of trade facilitation and high transaction costs associated with cross-border exchanges. An overwhelming majority of the non-tariff barriers faced by SAARC countries is related to sanitary and phytosanitary measures (SPS) and technical barriers to trade (TBT), which according to an Asian Development Bank study (ADB, 2008), accounts for about 86 percent of all such constraints. Bangladesh also faces a number of SPS and TBT related trade barriers in promoting its export to India. Lack of clarity and transparency about sanitary & phytosanitary standards of India affects Bangladeshi exports to its market. As discussed earlier, Bangladesh’s exports to India is dominated by primary and agricultural products. India requires an approved risk analysis of agricultural imports in biosecurity and sanitary & phytosanitary categories in order to protect the human, animal and plant life. Nearly all livestock, agricultural, and food imports require sanitary & phytosanitary (SPS) certificates and import permits from India‘s Ministry of Agriculture. The process of getting these certificates and permits lacks transparency, which in turn affects Bangladesh’s exports to India. Bangladesh’s products are sent to Indian standards testing laboratories (Bureau of Indian Standards) for certificates on quality, adding another layer of bureaucratic hassle and delay.
18
The Indian Food Adulteration (Prevention) Act 1954 requires the shelf life of processed foods to be not less than 60 percent of the original shelf life at the time of import. While this objective is fine, the process of determining shelf life is often arbitrary and non-transparent. India’s Prevention of Food Adulteration Rules 1955, are complicated. Just one rule, number 32, has 30 provisions with further sub-provisions. It also cross-references other rules prescribing content, size and design of labels, display panel specifications, details of colors and flavors, trade names, and so on. No certificate from the country of origin is accepted. The results of laboratory tests cannot be challenged. Separate regulations exist for various food types. To export textile and textile products to India, exporters must obtain a pre-shipment inspection certificate from a textile testing laboratory accredited to the National Accreditation Agency of the country of origin. In some cases, even certificates issued by EU-accredited labs are rejected by Indian customs authorities. The Benapole land port is the main gateway for Indo-Bangla trade. The current traffic in this crossing is 300-500 loaded trucks entering Bangladesh each day and 100-200 loaded trucks exiting. The Indian trucks are allowed to proceed up to 500 yards of the zero point inside Bangladesh without checking, but the Bangladeshi trucks are allowed to go up to the No-man’s land where the goods are transferred to an Indian truck using a back-to-back operation. This is a cumbersome procedure since the area is very small, about 0.2 hectares only. Poor services at land ports and arbitrary decision taken by custom officials are mentioned as a problem in promoting Bangladeshi exports to India. Poor logistic facilities of most of the Indian land ports, restrictions of commodities that can pass through land ports, cumbersome customs requirements, manual clearance, excessive inspection in the name of security, no customs cooperation or joint inspection, no harmonisation of standards, lack of warehouse facilities in most of the Indian land ports, no testing facilities in any Indian land port bordering Bangladesh, etc. are some of the major hurdles mentioned by the exporters of Bangladesh in the way of smooth movement of goods exported by Bangladesh to India9. Lack of coordination between central and state government’s rules and regulations also affects Bangladesh’s export to India. The Directorate General of Foreign Trade (DGFT) of India is not the only authority to impose rules and regulations regarding exports from Bangladesh to India. Even, various state agencies impose different barriers on their own. For example, the state customs departments (tariff agencies) sometimes ban different imports from Bangladesh. The customs authority of West Bengal at Kolkata once banned the import of soap from Bangladesh. DGFT claimed complete ignorance of the matter.
9 One exporter of fruit juice from Bangladesh to India claims that the customs authorities of India frequently
change their positions about where to print the expiry date of the juice on the bottom of the bottle or on the label
of the bottle. Such changed rules increase the cost of production. He further claims that he needed 40-50 days to
get the results of testing of the products from the Indian authority.
19
VI. Conclusions and policy recommendations
South Asia is emerging as one of the most vibrant economic regions of the world. Within the region, India is by far the leading as well as the fastest growing economy. Growth of Indian markets provides potential for increased intra-region trade. Yet the intra-regional trade is very low in this region. In particular, bilateral trade between India and Bangladesh is not only low but also dominated by one-way traffic of commodities, from India to Bangladesh making the former the second largest source for imports of the latter. Bangladesh and India have an unusual trade profile compared to their overall trade with the rest of the world. While Bangladesh’s export to rest of the world is dominated by labor-intensive manufactured commodities, its export to India is dominated by primary commodities and agricultural raw materials. A skill-puzzle is also observed in case of whatever manufacturing commodities are exported to India by Bangladesh. The low skill and labor intensive commodities dominate in Bangladesh’s overall export but such dominance is not observed in case its export to India Bangladesh’s import from India also represents a notable departure from its overall import structure. Being a developing country, total import of the country is understandably dominated by manufactured goods. But its import from India is heavily dominated by primary commodities and food, not by manufactured goods. This coupled with the fact that Bangladesh’s export to India also dominated by primary commodities indicates the dominance of intra-industry trade in their bilateral economic relationship. Trade between Bangladesh and India exhibited dynamism both in terms consolidating the trade of the existing commodities and diversifying into new commodities. The composition of top ten exports to Bangladesh has changed between 2001 and 2011. Similar compositional change also observed in case of imports from India. Trade between Bangladesh and India cannot be explained by the trade complementarity between these two economies. An evaluation by using five trade indices, namely, revealed symmetric comparative advantage index, trade specialization index, bilateral trade index, intra-industry trade index, and trade complementary index, shows that these two economies are more of competing nature. The lack of trade complementarity of these two economies is attributable to their similar economic and production structure, with both countries having a large service sector (with about 53 and 50 percent of GDP in India and Bangladesh respectively), followed by the industry sector (with about 29 percent of GDP in both countries). In many cases, both Bangladesh and India have comparative advantage in same commodities in regard to the world export markets. Despite both countries being a story of service-led growth, service trade is conspicuously absent in their bilateral economic relationship. Bangladesh’s export to India can be explained by two factors: (i) increase of external competitiveness of Bangladesh vis-à-vis other countries including India and (ii) growth of Indian markets as represented by growth of Indian GDP. With growth of per capita income,
20
India is moving up the value chain of a product or industrial ladder, favoring its neighbors including Bangladesh not only through lessening the intensity of competition but also by becoming a market for them. This is why the World Bank (2011a) argues that India and China “are now changing from competitors to markets for Bangladeshi exports (p-8)”. As long as Indian economy continues to grow, the scope for Bangladesh to increase export to Indian market will increase. In such a situation, it is imperative for Bangladesh to increase its competitiveness to take full advantage of the emerging opportunities. Bangladesh does not have to reinvent the when to do that. Taking care of the usual suspects that limit country’s manufacturing growth will suffice. A three-level intervention would be needed to eliminate the obstacles at the border, behind the border and over the border. Bangladesh needs to increase the efficiency at the border in order to increase its export to India. About half of the bilateral trade between India and Bangladesh takes place through land ports. There are sixteen land ports between operating between these two countries10. But beanpole is by far the most important land port of the country. Restructuring Benapole crossing to allow cross-docking (unloading of materials from an incoming carrier directly onto outbound carriers, with little or no storage in between) and electronic processing of declaration at border needs to be introduced. The users of the Benapole port identified a number of actions to improve the efficiency of the port. They include: (a) construction of more sheds and a cold storage for perishables, (b) procurement of new cranes and forklifts, (c) expediting the completion of the by-pass road to reduce the traffic jam, and (d) construction of a new link road to be used exclusively by the passenger vehicles and passengers entering into and exiting from Bangladesh (WB 2011a, p-18). A number of reports identified the main behind the border problems that reduces the external competitiveness of Bangladesh. The sixth five year plan (SFYP) also identified the areas for improvements to increase country’s manufacturing as well as external competitiveness. The cross-cutting action areas are infrastructure, human development and business regulatory environment.
Infrastructure: Infrastructure deficiencies have been a perennial problem in Bangladesh. The share of value-added of infrastructure services in total GDP has remained mostly unchanged at around 11 percent since 1980s with very insignificant changes among different forms of infrastructure (annex A.16), while the economic structure has become more and more infrastructure service-intensive. As concluded in a World Bank report (WB 2012), it is important to forge “partnership with domestic and private investors to increase power generation, raise public spending on road maintenance, improve the management of Chittagong port”.
Human development: According to World Bank (WB 2012), skill shortages in Bangladesh have driven the real wages by 30 percent, meaning the country can significantly improve its external competitiveness vis-à-vis the rest of the world including India by improving its skill situation. It is puzzling that the rising skill gaps
10
They are: 1. Benapole, Jessore, 2. Banglabandha, Panchaghar, 3. Bhurimari, Lalmonirhat, 4. Hilli, Dinajpur,
5. Sonamasjid,ChapaiNawabgonj, 6. Tamabil, Sylhet, 7. Akhaura, Bhahmanbaria, 8. Nakugaon, Sherpur, 9.
Haluaghat, Mymensingh, 10. Darshana, Chuadanga, 11. Birol, Dinajpur, 12. Bhomra, Satkhira, 13. Teknaf,
Cox'sbazar, 14. Bibirbazar, Comilla, 15. Bilonia, Feni, and 16. Gobrakura and Karaitoli, Mymensingh
21
and shortages so far failed to incentivize the private sector to impart training indicating a market failure in the provision of adequate skills. This warrants active public actions including trainee and employer targeted financing to impart training. In first case, government can introduce “training voucher” for interested trainees to finance part of their training cost. To minimize the moral hazard problem11, government can make the vouchers redeemable only after the trainee has found a suitable job. It emerged from the discussion with the exporters and also from different anecdotes that job-hopping of skilled or trained workers is one of the reasons why the employers are reluctant to impart on-the-job training in Bangladesh. To solve this problem, government of Bangladesh undertake a levy scheme, as already undertaken by 30 different countries, under which employers pay a levy of a certain percentage of their wage bills and are eligible to claim a certain portion of allowable cost from this fund to train their employees. This can be topped up with government funding, at least until the time that sufficient funds are collected from the employers.
Being a labor-abundant and capital-scarce country, Bangladesh should be an ideal candidate for global foreign direct investment (FDI). But the poor regulatory and difficult doing business environment are the major hindrance to FDI. According to World Bank’s Doing Business Report 2012, Bangladesh ranks 122 out of 183 countries, with property registration typically taking 245 days, compared with 44 days in India, 57 days in Vietnam, 22 days in Indonesia, and only 2 days in Thailand. Government of Bangladesh needs to make measure to improve its poor governance and property rights.
Government of Bangladesh should work closely with its Indian counterpart to overcome the over the border problems. The main over the border problems that seriously affect Bangladesh’s export to India are discussed in section V of this report. A joint effort by Bangladesh and Indian governments would be required to solve these problems and promote bilateral trade between these two countries.
11
Introduction of training vouchers may encourage the private training institutions to enroll fake students to
redeem their vouchers and share apportion of the money with them, with leaving the students leaving the
program incomplete.

22
References
Bandara, J.S. and W. Yu (2003). How Desirable Is the South Asian Free Trade Area? A
Quantitative Economic Assessment‘, in D.S. Greenaway (ed.), World Economy: Global Trade
Policy 2003. Blackwell Publishing, Oxford, U.K.
Bhat (2011), Structural change in India's foreign trade, Institute for studies in industrial
development.
Coulibaly, S. (2004). ‗On the Assessment of Trade Creation and Trade Diversion Effects of
Developing RTAs‘. Paper presented at the Annual Meeting 2005 of the Swiss Society of
Economics and Statistics on Resource Economics, Technology, and Sustainable Development.
Available athttp://www.wif.ethz.ch/resec/sgvs/078.pdf.
DeRosa, D.A. and K. Govindan (1995). ‗Agriculture, Trade, and Regionalism in South Asia‘.
Food, Agriculture, and the Environment Discussion Paper No. 7, International Food Policy
Research Institute, Washington, D.C.
Ghani, E. (2010). The Service Revolution in South Asia, Oxford University Press, New Delhi,
India
Govindan, K. (1994). ‗A South Asian Preferential Trading Arrangement: Implications for
Agricultural Trade and Economic Welfare‘. Mimeo, World Bank, Washington, D.C.
Hirantha, S.W. (2004). ‗From SAPTA to SAFTA: Gravity Analysis of South Asian Free
Trade‘. Paper presented at the European Trade Study Group (ETSG) 2004 Programme,
Nottingham.
Nahar, B. And M. Siriwardana (2009) ―Impact of Trade Liberalization on Poverty in
Bangladesh: A Quantitative Assessment‖, South Asia Economic Journal, 10(2), pp. 325-369
Pigato, M., C. Farah, K. Itakura, K. Jun, W. Martin, K. Murrell, and T.G. Srinivasan (1997).
South Asia‘s Integration into the World Economy.‘ World Bank, Washington, D.C.
Pursell, G. (2004). ‗An India–Bangladesh Free Trade Agreement? – Some Potential
Economic Costs and Benefits‘. Mimeo, World Bank, Washington, D.C.
Rahman, Md. M. (2003). ‗A Panel Data of Bangladesh‘s Trade: The Gravity Model
Approach‘. Paper presented at the European Trade Study Group (ETSG) 2003 Programme,
Madrid. Available athttp://www.etsg.org/ETSG2003/papers/rahman.pdf
Raihan, S. and A. Razzaque (2007). ‗Regional Trading Arrangements (RTAs) in South Asia:
Implications for the Bangladesh Economy‘, in S. Raihan and A. Razzaque (eds.), WTO and
Regional Trading Arrangement: Quantitative Assessment of Potential Implications for
Bangladesh. PathakSamabesh, Dhaka.
Raihan (2008), " SAFTA and the Bangladesh economy: Assessments of potential
implications", Commonwealth secretariat.
Razzaque (2012), "Promoting supply chains in south Asia: The case of textiles and
clothing sector", Commonwealth secretariat. Available at
http://summit.sdpi.org/contents/ppts/B8%20-
%20Mohammad%20A.%20Razzaque.pdf
Rodríguez-Delgado, J.D. (2007). SAFTA: Living in a World of Regional Trade Agreements.‘
IMF Working Paper 07/23, International Monetary Fund (IMF), Washington, D.C.

23
Sikdar (2006), "Prospect of bilateral trade between India and Bangladesh." Foreign trade
review : quarterly journal of Indian Institute of Foreign Trade. - New Delhi :Sagar Print. &
Publ., ISSN 0015-7325, ZDB-ID 8626509. - Vol. 41.2006, 1, p. 27-45
Srinivasan, T.N. and G. Canonero (1995). ‗Preferential Trading Arrangements in South Asia:
Theory, Empirics and Policy.‘ Yale University, New Haven. Unpublished manuscript.
Hassan, M.K. (2001). ―Is SAARC a Viable Economic Block? Evidence from Gravity
Model‖, Journal ofAsian Economics, 12(2), pp. 263–290.
Tumbarello, P. (2006). ‗Are Regional Trade Agreements in Asia Stumbling or Building
Blocks? Some Implications for the Mekong Countries‘. Paper Prepared for the Seminar on
Accelerating Development in the Mekong Region – The Role of Economic Integration. Siem
Reap, Cambodia, June 26–27, 2006.
World Bank (2006). India–Bangladesh Bilateral Trade and Potential Free Trade Agreement‘
BangladeshDevelopment Series Paper No. 13, World Bank, Dhaka.
World Bank (2011a), Consolidating and accelerating export in Bangladesh, Bangladesh
development series, Paper no- 29, World Bank, Dhaka.
World Bank (2011b), Concept note on diagnostic trade integration study (DTIS), mimeo
World Bank (2012), Bangladesh: Towards accelerating, inclusive sustainable growth-
opportunities and challenges, Bangladesh development series, Report no-67991

24

25
Annexes
A.1: Growth of GDP of South Asian countries during 1981-1991, 1992-2002, and 2003-2011
Country 1981-1991 1992-2002 2003-2011
GDP Export Import GDP Export Import GDP Export Import
India 5.16 15906 21941 5.78 45207 54711 8.08 240580 290209
Bangladesh 3.69 1374 3120 4.94 5169 7489 6.13 15360 21207
Pakistan 6.18 4730 8008 3.61 9790 12743 4.83 22190 34368
Nepal 4.93 350 642 4.42 1041 1556 4.25 1439 3927
Bhutan 9.09 54 120 5.66 109 164 8.59 462 665
Sri Lanka 4.24 1732 2467 4.55 5009 6183 6.43 9239 12908
Source: UNCTADstat
A.2: Share in world GDP of South Asian countries in 1981, 1991, and 2012
1991 2001 2011
GDP (in billion US$)
% share in world GDP
GDP (in billion US$)
% share in world GDP
GDP (in billion US$)
% share in world GDP
India 289.68 1.2448 482.97 1.5046 1944.07 2.79
Bangladesh 30.07 0.1292 45.43 0.1415 107.48 0.15
Pakistan 51.93 0.2232 67.98 0.2118 209.32 0.30
Nepal 3.47 0.0149 5.89 0.0184 18.16 0.03
Bhutan 0.24 0.0010 0.48 0.0015 1.65 0.002
Sri Lanka 9.24 0.0397 16.05 0.0500 59.16 0.08
Total 384.63 1.6529 618.80 1.9278 2339.83 3.36
Source: UNCTADstat

26
A.3: Nominal rate of protection (in %) in Bangladesh during FY92-12
Fiscal years Nominal Protection Rate Average Tariff Average para Tariff
91-92 59.74 57.23 2.51
92-93 49.35 47.14 2.20
93-94 37.86 35.83 2.03
94-95 28.46 25.95 2.51
95-96 24.99 22.46 2.53
96-97 24.48 21.87 2.60
97-98 25.95 21.10 4.85
98-99 25.33 20.52 4.81
99-00 22.43 17.12 5.30
00-01 21.82 13.41 8.41
01-02 20.92 12.51 8.41
02-03 21.65 16.49 5.15
03-04 24.59 15.65 8.94
04-05 21.63 13.54 8.09
05-06 20.90 12.51 8.39
06-07 19.28 12.21 7.07
07-08 17.81 13.44 4.37
08-09 20.08 13.69 6.39
09-10 23.88 13.67 10.21
10-11 23.74 13.57 10.17
11-12 26.51 13.55 12.96
Source: UNCTADstat
A.4: Trade between India and Bangladesh in different years
Year BD’s export to India (million $)
BD’s export to India as % of BD’s total export
BD’s export to India as % of India’s total import
BD’s import from India (million $)
BD’s import from India as % of BD’s total import
BD’s import from India as % of total export of India
1991 5.49 0.33 0.03 199.85 6.37 1.12
2001 16.51 0.31 0.03 889.59 11.06 2.03
2011 512.51 1.88 0.11 4560.00 12.06 1.51
Source: UNCTADstat

27
A.5: Value of different exports (in million US$) of Bangladesh to India during 2001 and 2011
Commodities 2001 2011
Primary commodities 18.34 355.77
Food 3.26 10.75
Agricultural raw materials 14.39 169.06
Total manufacturing 34.01 261.42
Labor intensive and resource based manufacturing 9.91 133.36
Low skill- and technology-intensive manufacturing 0.55 4.04
Medium skill- and technology-intensive manufacturing 0.58 15.14
High skill- and technology-intensive manufacturing 15.91 127.23
Source: UNCTADstat
A.6: Top 10 new exports to India from Bangladesh in 2011
Commodities with [SITC] code Value of Export (in thousand US $)
Share in total export value of new commodities (%)
Share in total export value all exports in 2011 (%)
[784] Parts & accessories of vehicles 1165.9 1.3 0.2
[686] Zinc 1316.2 1.4 0.2
[269] Worn clothing and other textile articles
1873.5 2.0 0.3
[081] Feeding stuff for animals 2296.0 2.5 0.4
[842] Women's clothing of textile fabrics
2989.5 3.2 0.5
[571] Polymers of ethylene, in primary forms
3180.6 3.4 0.5
[231] Natural rubber & similar gums, in primary forms
5323.5 5.7 0.9
[422] Vegetable fats & oils, crude and refined
6229.8 6.7 1.0
[273] Stone, sand and gravel 10333.5 11.1 1.7
[334] Petroleum oils or bituminous minerals
43316.9 46.7 7.0
Total 78025.4 84.1 12.5
Source: UNCTADstat

28
A.7: Ranking and relative share of ten exports of Bangladesh to India in 2001 and 2011
Commodities with [SITC] code Rank % share in total export
2001 2011 2001 2011
[522] Inorganic chemical elements 1 6 22.59 6.82
[658] Made-up articles of textile materials 2 4 11.53 7.60
[562] Fertilizers 3 1 7.21 11.85
[034] Fish 4 3 3.98 7.76
[611] Leather 5 19 1.86 0.71
[841] Men's clothing of textile fabrics 6 9 1.62 1.73
[657] Special yarn 7 20 1.06 0.68
[654] Woven textile fabrics 8 15 1.04 0.93
[682] Copper 9 18 0.95 0.81
[651] Textile yarn 10 8 0.90 4.42
[288] Non-ferrous base metal waste & scrap 71 10 0.001 1.69
[057] Fruits and nuts 16 7 0.35 5.60
[334] Petroleum oils or bituminous minerals n.a12
5 0 6.97
[263] Cotton 12 2 0.12 10.81
Coefficient of correlation 0.06 0.35
Source: UNCTADstat
A.8: Share of different imports by Bangladesh from India and world in 2011
Commodities India Global
Primary commodities 57.21 30.14
Food 36.02 20.42
Agricultural raw materials 10.30 6.48
Total manufacturing 42.79 60.93
Labor intensive and resource based manufacturing 14.43 21.53
Low skill- and technology-intensive manufacturing 8.74 7.94
Medium skill- and technology-intensive manufacturing 8.45 12.29
High skill- and technology-intensive manufacturing 10.64 18.10
Source: UNCTADstat
A9: Ranking and relative share of ten imports of Bangladesh from India in 2001 and 2011
Commodities with [SITC] code Rank % share in total import
2001 2011 2001 2011
[651] Textile yarn 1 1 13.94 17.47
[041] Wheat, un-milled 2 10 8.51 1.87
12
Export of this commodity in 2001 was zero.
29
[081] Feeding stuff for animals 3 3 4.61 6.18
[042] Rice 4 14 4.58 1.64
[652] Cotton fabrics, woven 5 13 4.44 1.65
[061] Sugar, molasses and honey 6 4 3.67 5.43
[321] Coal 7 8 3.42 2.03
[054] Vegetables 8 7 2.99 2.65
[784] Parts & accessories of vehicles 9 35 2.18 0.58
[641] Paper and paperboard 10 122 2.03 0.15
[263] Cotton 70 2 0.23 10.72
[044] Maize, un-milled 82 5 0.94 4.06
[785] Motorcycles & cycles 14 6 1.47 3.49
[057] Fruits and nuts, fresh or dried 11 9 1.79 1.96
Coefficient of correlation -0.14 0.55
Source: UNCTADstat
A.10: Formulae of different trade indices
Revealed symmetric comparative advantage index (RSCA) This index is defined as the share of each commodity group (k) in an economy's total export divided by the share of each commodity group in another economy's total exports:
RCA=
÷
Where X denotes exports, k denotes, k denotes the commodity group classification of exports, i and j denote export countries, and w refers to the world. It should be noted that the partner economy (j) can be another economy (to assess bilateral RCA) or the world (to assess global RCA). Value of RCA greater than one (and unbounded) infer specialization, while values less than one (and bounded by zero) infer non-specialization. Since the index is not comparable on both sides of unity, the RCA is modified using the following equation
RSCA =
such that the measure ranges from minus one to one. Bilateral trade intensity index (TII) This index measure whether the value of trade between two countries is larger (or smaller) than expected, based upon their importance to world trade. Trade intensity is measured as the exporting country's share of the world exports of a particular commodity to a partner country, divided by the exporting country's share of the total world exports.
TII=
÷
Where X denotes exports, k denotes the commodity group of exports, idenotes the export country, j denotes the import country, and w denotes the world.

30
The trade intensity index takes values from zero, with no upper bound. Values greater than one infers that trade between the exporting and partner country are intense relative to their trade with the rest of the world. Trade specialization index (TSI) The TSI is the most widely-used measure to assess bilateral competitiveness. It compares the net flow of goods to the total flow of goods between two countries.
=
Where X denotes exports, M denotes imports, k denotes the commodity group of export, and i and j denote the export and import countries respectively. The simple correlation coefficient can be used to summaries the TII of each commodity group to provide an overall measure of complimentary of trading partners' economies;
= ∑
√∑
Where ( is the trade specialisation index for country i (j) with partner country j (i), and TII is the average of
across all commodities. A negative correlation infers that the two economies do not, on the whole, specialise in the same commodities, which makes them complementary trading partners. Conversely, a positive correlation coefficient infers that the economies specialise in the same commodities, and are therefore competitors on the global market. Intra-Industry trade (ITT) The intra-industry trade index is used to measure the extent of trade between two country within a particular industry.
=1- ∑ |
|
∑
Where X and M denotes exports and imports respectively, k denotes the commodity group of exports, and i and j denotes the exports and imports countries respectively. The IIT index ranges in value from zero to one, where values greater than one indicate intra-industry trade. This index is vulnerable to the level of aggregation of the data used. The greater the extent of aggregation, the greater the bias towards finding intra-industry trade. Trade complementary index The TCI is a summary measure of the complementary of two economies, based upon how well the structure of one country's exports matches the import of another country.
= 100- ∑|
|
Where , (
) is country i's (j's) exports (imports) of commodity k as a share of country i's (j's) total exports (imports). It is
expressed algebraically as:
=
and
=
Where subscripts iw and jw denotes the exports from country i to the world and imports into country j from the world, respectively.

31
The TCI can also be constructed to assess how well the imports of one country match the exports of another. The measure of import complementary is constructed as above, but import and export countries are reserved.
A.11: Revealed symmetric comparative indices of Bangladesh and India, 2011
Commodities with [SITC] code RSCA of Bangladesh relative to
RSCA of India relative to
India World Bangladesh World
[845] Articles of apparel, of textile fabrics 0.90 0.97 -0.90 0.53
[841] Men's clothing of textile fabrics 0.92 0.98 -0.92 0.55
[842] Women's clothing, of textile fabrics 0.69 0.94 -0.69 0.73
[843] Men's or boy's clothing, of textile, knitted 0.82 0.97 -0.82 0.69
[844] Women's clothing, of textile, knitted 0.82 0.94 -0.82 0.49
[658] Made-up articles, of textile materials 0.45 0.92 -0.45 0.80
[036] Crustaceans, and aquatic invertebrates 0.53 0.93 -0.53 0.79
[651] Textile yarn 0.08 0.85 -0.08 0.82
[611] Leather 0.56 0.89 -0.56 0.67
[562] Fertilizers 0.96 0.69 -0.96 -0.78
[851] Footwear 0.12 0.49 -0.12 0.39
[652] Cotton fabrics, woven 0.24 0.80 -0.24 0.69
[848] Articles of apparel, clothing access 0.18 0.70 -0.18 0.59
[334] Petroleum oils or bituminous minerals -0.95 -0.72 0.95 0.76
[034] Fish, fresh, chilled or frozen 0.13 0.42 -0.13 0.31
[263] Cotton -0.59 0.61 0.59 0.88
[542] Medicaments (incl. veterinary medicaments) -0.86 -0.65 0.86 0.47
[793] Ships, boats & floating structures -0.90 -0.61 0.90 0.65
[764] Telecommunication equipment & parts -0.90 -0.89 0.90 0.08
[042] Rice -0.94 -0.17 0.94 0.91
[281] Iron ore and concentrates -0.99 -0.96 0.99 0.56
Maximum value 1
Minimum value -1
Critical point Comparative advantage = > 0
Source: Estimated by using data from UNCTADstat
A.12: Bilateral trade intensity indices of Bangladesh and India
Commodities Bangladesh India
BTI in 2001 BTI in 2011 BTI in 2001 BTI in 2011
[682] Copper 5.02 0.41 0.0002 0.0011
[231] Natural rubber - 0.82 - 0.000013

32
[652] Cotton fabrics, woven 0.01 0.02 0.0471 0.0382
[654] Other textile fabrics, woven 0.01 0.05 0.0014 0.0056
[778] Electrical machinery 0.16 0.38 0.0033 0.0072
[422] Vegetable fats & oils 7.08 0.0020 0.0001
[282] Ferrous waste 0.09 0.28 0.0043 0.0008
[661] Lime, cement, fabricant 0.04 74.08 0.0168 0.0035
[273] Stone, sand and gravel 0 39.40 0.0201 0.0448
[288] Non-ferrous base metal waste 0.01 0.26 0.0001 0.0117
[841] Men's clothing of textile fabrics 0.001 0.002 0.0002 0.0022
[651] Textile yarn 0.01 0.04 0.0351 0.1318
[057] Fruits and nuts 0.39 1.52 0.0181 0.0492
[522] Inorganic chemical elements 1.63 1.66 0.0051 0.0183
[334] Petroleum oils or bituminous minerals 0 0.45 0.0000014 0.0009
[658] Made-up articles of textile materials 0.03 0.04 0.0002 0.0004
[034] Fish 0.13 0.56 0.0124 0.0025
[263] Cotton 0.20 2.11 - 0.0183
[562] Fertilizers 0.11 0.26 0.0670 0.0211
Explanatorynotes
Maximum value Unbounded
Minimum value 0
Critical point Intense = >1
Source: Estimated by using data from UNCTADstat
A.13: Intra-industry trade indices of Bangladesh and India
Commodities
Bangladesh India
ITI in 2001 ITI in 2011 ITI in 2001 ITI in 2011
[682] Copper 0.67 0.64 0.69 0.34
[231] Natural rubber 0.79 0.84
[652] Cotton fabrics, woven 0.008 0.14 0.01 0.12
[654] Other textile fabrics, woven 0.76 0.10 0.79 0.51
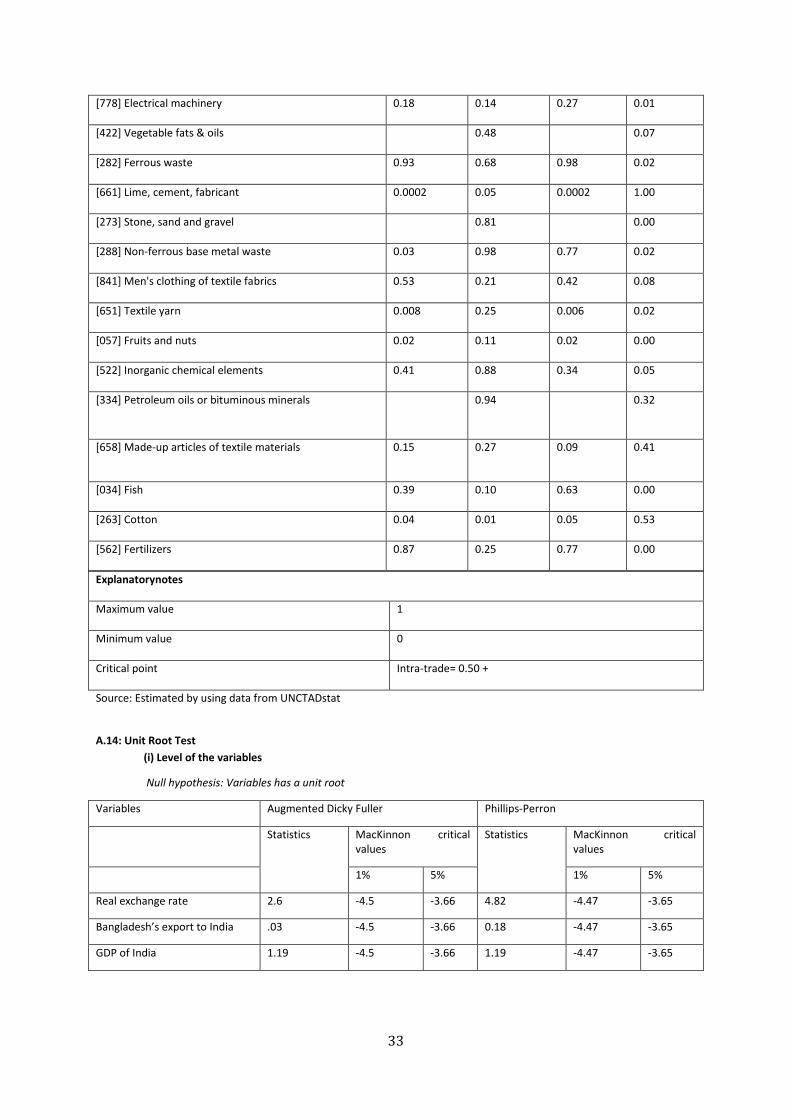
33
[778] Electrical machinery 0.18 0.14 0.27 0.01
[422] Vegetable fats & oils 0.48 0.07
[282] Ferrous waste 0.93 0.68 0.98 0.02
[661] Lime, cement, fabricant 0.0002 0.05 0.0002 1.00
[273] Stone, sand and gravel 0.81 0.00
[288] Non-ferrous base metal waste 0.03 0.98 0.77 0.02
[841] Men's clothing of textile fabrics 0.53 0.21 0.42 0.08
[651] Textile yarn 0.008 0.25 0.006 0.02
[057] Fruits and nuts 0.02 0.11 0.02 0.00
[522] Inorganic chemical elements 0.41 0.88 0.34 0.05
[334] Petroleum oils or bituminous minerals 0.94 0.32
[658] Made-up articles of textile materials 0.15 0.27 0.09 0.41
[034] Fish 0.39 0.10 0.63 0.00
[263] Cotton 0.04 0.01 0.05 0.53
[562] Fertilizers 0.87 0.25 0.77 0.00
Explanatorynotes
Maximum value 1
Minimum value 0
Critical point Intra-trade= 0.50 +
Source: Estimated by using data from UNCTADstat
A.14: Unit Root Test
(i) Level of the variables
Null hypothesis: Variables has a unit root
Variables Augmented Dicky Fuller Phillips-Perron
Statistics MacKinnon critical values
Statistics MacKinnon critical values
1% 5% 1% 5%
Real exchange rate 2.6 -4.5 -3.66 4.82 -4.47 -3.65
Bangladesh’s export to India .03 -4.5 -3.66 0.18 -4.47 -3.65
GDP of India 1.19 -4.5 -3.66 1.19 -4.47 -3.65

34
ii. 1st
difference of the variables
Null hypothesis: Variables has a unit root
Variables Augmented Dicky Fuller Phillips-Perron
Statistics MacKinnon critical values
Statistics MacKinnon critical values
1% 5% 1% 5%
Real exchange rate -3.71 -4.53 -3.67 -7.56 -4.5 -3.67
Bangladesh’s export to India
-4.62 -4.53 -3.67 -2.87 -4.5 -3.67
GDP of India -3.96 -4.53 -3.67 -5.32 -4.5 -3.67
A.15: Johansen Cointegration Test
Dependent variable: Log of Bangladesh’s Export to India
Variables Model 1 Model 2
Constant -1.11 2.25
Log of real exchange rate - 8.1
Log of GDP of India 0.79 -
A.16: Value-Addition of infrastructure services
(percent of GDP)
1981-90 1991-00 2001-05 2006 2007 2008 2009 2010 2011
Electricity, Gas & Water Supply 1.08 1.44 1.33 1.3 1.18 1.11 1.06 1.04 0.98
Electricity 0.95 1.22 1.11 1.07 0.97 0.91 0.86 0.84 0.8
Gas 0.08 0.16 0.15 0.14 0.14 0.13 0.13 0.13 0.12
Water supply 0.05 0.06 0.07 0.08 0.08 0.07 0.07 0.07 0.07
Transport, Storage and communication 9.48 8.88 9.82 10.39 10.35 10.43 10.46 10.35 10.67
Transport 8.92 7.94 8.52 8.77 8.61 8.62 8.6 8.5 8.77
Storage 0.26 0.32 0.34 0.3 0.3 0.29 0.29 0.28 0.26
Communication 0.3 0.61 0.96 1.32 1.44 1.52 1.57 1.57 1.64
Total Infrastructure 10.56 10.31 11.14 11.69 11.53 11.54 11.52 11.39 11.65
Source: Bangladesh Bureau of Statistics
InternatIonal trade & regIonal Co-operatIon (ItrC) SeCtIon at the Commonwealth SeCretarIat
Established in 1965, the Commonwealth Secretariat is the main intergovernmental agency of the Commonwealth – an association of 54 independent states, comprising large and small, developed and developing, land-locked and island economies, facilitating consultation and co-operation among member governments and countries in the common interest of their peoples and in the promotion of international consensus building.
The ITRC Section of the Economic Affairs Division (EAD) of the Commonwealth Secretariat is entrusted with the responsibilities of undertaking policy-oriented research and analysis on trade and development issues and providing informed inputs into the related discourses involving Commonwealth members.
The work of the ITRC involves:
• promoting policy initiatives and actions that foster international trade taking into account the special circumstances of our capacity constrained developing member countries
• supporting Commonwealth developing members in their negotiation of multilateral and regional trade agreements that promote development friendly outcomes, notably their economic growth through expanded trade
• undertaking policy research and consultations to enhance the understanding of changing international trading environment and of policy options for successful adaptation
• contributing to the processes involving multilateral and bilateral trade regimesthatadvancethemorebeneficialparticipationofCommonwealthdeveloping country members, particularly small states and LDCs
• helping inform, through policy advice and other forms of assistance, national and regional strategies and policies that promote regional and multilateral trade and economic cooperation
Contact details
International Trade & Regional Co-operation (ITRC), Economic Affairs Division, Commonwealth Secretariat, Marlborough House, Pall Mall, London SWIY 5HX, United Kingdom, Tel: +44 (0)207 747 6261, Fax:+44 (0)207 747 6235