(626 kb)
TRANSCRIPT
Progress In Electromagnetics Research M, Vol. 50, 117–128, 2016
Comparative Analysis of Electromagnetic Field Exposure Levelsand Determination of the Minimum Safe Distances from
Mobile-Phone Base Stations in Urban Areas
Enver Hamiti, Mimoza Ibrani*, Luan Ahma, Vlerar Shala, and Rreze Halili
Abstract—Theoretical, software-computed and experimental evaluations of the exposure levels toelectromagnetic fields generated by GSM 900, GSM 1800 and 3G base stations in urban areas, includingdetermination of the minimum safe distances for population and occupational exposure, are presented.Using the software package SPECTRAemc with the P.1546 propagation wave model and a topographicdigital map, the electromagnetic field levels were assessed considering the height of the receiving antennato be at the height of human. At a few locations in the direction of maximum radiation intensity, in situmeasurements of the electric field strength were performed. The base station power densities measuredat a few exposure sites were in the range of 0.11 (µW/cm2) to 6.73 (µW/cm2). The results of Kosovoexperimental survey are compared with surveys done in 21 countries in five continents. The powerdensity values obtained in Kosovo are higher, but many times below the safety standard limits.
1. INTRODUCTION
The tremendous ongoing growth in the use of cellular communication services requires the installationof an increasing number of base station transmitters. The installation of base station transmitters isaccompanied by concerns about possible adverse biological and health effects to both the populationliving near base stations and workers.
Wireless communication technologies have been shown to account more than 65% of exposure toradio frequency radiation, with mobile phones being identified as the dominant contributor [1].
The epidemiological evidence of health impacts from base station exposure has been reviewed [2],while a recent cross-sectional case control study has analysed possible genetic damage in individualsresiding in the vicinity of base stations [3].
The widely used human exposure safety standards announced by the International Commission onNon-Ionizing Radiation Protection (ICNIRP) for the general population and workers gives two typesof exposure limitations that can be used in compliance assessment: basic restrictions that limit thespecific absorption rates (SARs) for mobile-communication frequencies, and reference levels that limitthe electric and/or magnetic field strength and power density [4].
Measurements of occupational exposure to electromagnetic fields generated by base stations andtheir comparison with ICNIRP guidelines for rooftop positions have been reported [5]. The resultsindicate that the reference levels for workers and the general public may be exceeded in front of atransmitting antenna at distances up to 1 and 2m, respectively.
To prevent citizens from entering exposure zones where ICNIRP safety limits are exceeded,minimum safe distances to mobile-communication base stations should be determined.
The relationship between the base station antenna input power required to reach the ICNIRP SARlimit and that required to reach the ICNIRP power density limit has been given [6].
Received 25 July 2016, Accepted 14 September 2016, Scheduled 23 September 2016* Corresponding author: Mimoza Ibrani ([email protected]).The authors are with the Faculty of Electrical and Computer Engineering, University of Prishtina, Prishtina 10000, Kosovo.
118 Hamiti et al.
For a 900 MHz antenna of a base station, it was found that, at the input power of 10 W or higher,the minimum safe distance based on the SAR was less than that based on the electromagnetic fieldstrength [7]. Thus, the calculation of the minimum safe distance can be based on the electromagneticfield strength, avoiding the high financial and computational costs of SAR-based calculations.
Another advanced method for computing the minimum safe distance for a base station antenna inthe near-field region, based on source reconstruction, has been described [8].
Studies have reported the development of procedures, prediction formulas and instrumentation forassessing the SAR and radio frequency electromagnetic fields (RF-EMFs) of base station antennas, interms of the antenna parameters, distance and time variations and amplitude probability of exposurelevels [9–13].
The World Health Organization (WHO) also recommends working to investigate populationradio frequency (RF) exposure, particularly useful for global exposure assessment and hopefullyupcoming health risk from such exposure [14]. Comparative analysis of RF exposure survey of mobilecommunications presented in [15], gives data of national surveys in 21 countries across five continentssince 2000. Surprisingly, regardless of country, the year and cellular technology, the measured valueswere a small fraction of human exposure standards. Also, no significant increase in exposure levelsis observed since the widespread introduction of 3G mobile services, at ground level. They suggestextending the study to additional countries.
The main objective of the present paper is to assess the actual level of electromagnetic field exposureand to determine the minimum safe distance of public and occupational exposure for mobile-phonebase station antennas, in a very dense urban environment in Kosovo. Our study considers the caseof the highly populated neighborhood of Ulpiana in Prishtina, Kosovo. The chosen environment ischaracterized as one of the most exposed environments in Kosovo, where density of radiation sources isvery high and the corresponding distance between humans and base stations antennas are worrisome.This conclusion is based on the research that we have done in different environments, including thosethat are considered to be more special, in terms of RF EMF exposure [16, 17].
We also aim to join international efforts to assess the experimental levels of RF-EMF exposure toareas that are very close to base stations of wireless communication systems. We present the results ofa comparative analysis of data obtained from our measurements and RF-EMF exposure values resultedfrom surveys, which includes over 173,000 individual data points presented in [15].
Finally, we compare the results obtained by simulations with those obtained by in-situmeasurements, in order to have a clear picture of the accuracy of the results obtained by simulationsand perhaps to simplify the procedures for evaluating exposure of the population in the future. In aprocess of base transceiver station (BTS) sitting along with the signal coverage, also a safety distanceshould be calculated, resulting in multi parametric cellular network planning and optimization.
2. METHODOLOGY FOR EVALUATION OF EXPOSURE LEVELS ANDDETERMINATION OF MINIMUM SAFE DISTANCES FROM MOBILE-COMMUNICATION BASE STATIONS
The first step was to scan RF sources in the chosen urban neighborhood. Eight base station antennasof GSM 900, GSM 1800 and 3G systems were identified in the study environment. The study areaalso contained a few private mobile radio transmitters operating on very high frequency and ultrahighfrequency ranges, two point-to-point sources operating on unlicensed bands of 2.4 and 5.5 GHz with lowtransmitting power, and a few short-distance microwave links with low transmitting power. Evaluationof the power balance of the identified RF sources reveals that the dominant contributors were the GSM900, GSM 1800 and 3G base stations. Consequently, these contributions have become part of our study.
A map of the neighborhood and base station locations is presented in Fig. 1.Base-station antennas operating in Ulpiana neighborhood are GSM 900, GSM 1800 and 3G
antennas, characterized by 17, 17.8 respectively 18 dBi. Transmitting power/channel (W) was in therange between 1.99526 W and 6.30957 W for GSM 900 antennas, 6.30957 W for GSM 1800, while for3G were used antennas of 19.95262 W and 15.84893 W. The data regarding the base stations technicalparameters are obtained from service provider.
Progress In Electromagnetics Research M, Vol. 50, 2016 119
Figure 1. The map of Ulpiana neighborhood.
2.1. Theoretical Evaluation of the Peak Power Density and Minimum Safe DistanceCalculation
The power density of a plane wave, when a person is exposed to a single antenna of a base station, canbe calculated as [18–20]
S =14π
Pt
R210
G10 (1)
where Pt is the total power of the channels per sector radiated by the antenna and G the gain of theantenna (in dB) in the direction of the person from the antenna.
In the case of the simultaneous action of N antennas, the total power density is obtained as thesum of individual power densities of the different antennas.
At a distance ρ0 from the antenna, the form of the electric field changes from a cylindrical shapein the near field to a spherical field. For a sector antenna, this distance is determined as [18–20].
ρo =φ3 dB
6GAL (2)
where φ3 dB is the horizontal half-power (or −3 dB) beam width, GA the antenna broadside directivityand L the antenna height.
For sector base-station antennas, the peak value of the power density of near-field (cylindrical)radiation, in the horizontal direction of propagation, at distance ρ from the antenna centre and atazimuth Φ, is calculated as [18–20]
Speakρ (ρ, φ) =
Pt2−(
φ
φ3 dB
)2
φ3 dBρL
√1 +
(2
ρ
ρ0
)2(3)
where Pt is the total power of the channels per sector radiated from the antenna and Φ the azimuthangle.

120 Hamiti et al.
Taking the azimuth value Φ = 0 in the expression and considering the peak power density to beequal to the ICNIRP reference level, the minimum safe distance ρ can be calculated as
ρ = ρ0
√√√√√√√(
Pt
φLSρ0
)2
+116
− 14
2(4)
Relations in Eqs. (3) and (4) can be used to simply and accurately calculate the level of exposure andminimum safe distance from a base station antenna.
2.2. Calculated Results
The density of radiated power and the minimum safe distance are calculated using technical parametersof the base station antennas under investigation, in the direction of the maximum radiation intensity(angle Φ = 0) [19, 21, 22].
In Table 1 are presented the minimum safe distances for GSM 900, GSM 1800 and 3G base stations,in terms of public and occupational exposure.
Table 1. Evaluated minimum safe distances for mobile-communication base stations.
No.
Syst
em
Freq
uenc
y [M
Hz]
Ant
enna
type
Ant
enna
dir
ectiv
ity
G[d
Bi]
Tot
al p
ower
of
the
chan
nels
pe
r se
ctor
[W
]
Ant
enna
leng
th L
[m
]
Val
ue o
f Φ 3d
B [
rad]
ICN
IRP
sta
ndar
d fo
r
pub
lic
[µW
/cm
2 ]
ICN
IRP
stan
dard
fo
r oc
cupa
tiona
l [
µW/c
m2 ]
The
val
ue o
f th
e
o [m
]
The
min
imum
saf
e di
stan
ce f
or
publ
ic e
xpos
ure
[m
]
The
min
imum
saf
e di
stan
ce f
or
occu
patio
nal e
xpos
ure
[m
]
1 GSM 900 955 K 742 266 17 3x5 2.51 0.57 450 2250 11.90 2.19 0.47 2 GSM 900 950 APX 17 3x7 2.00 0.57 450 2250 9.52 3.35 0.813 GSM 1800 1810 K 742 266 17.8 3x6.3 2.51 0.58 900 4500 14.56 1.42 0.294 UMTS 1820 K 742 215 18 20 1.30 0.57 900 4500 7.79 2.52 0.59
A
ρ ρ
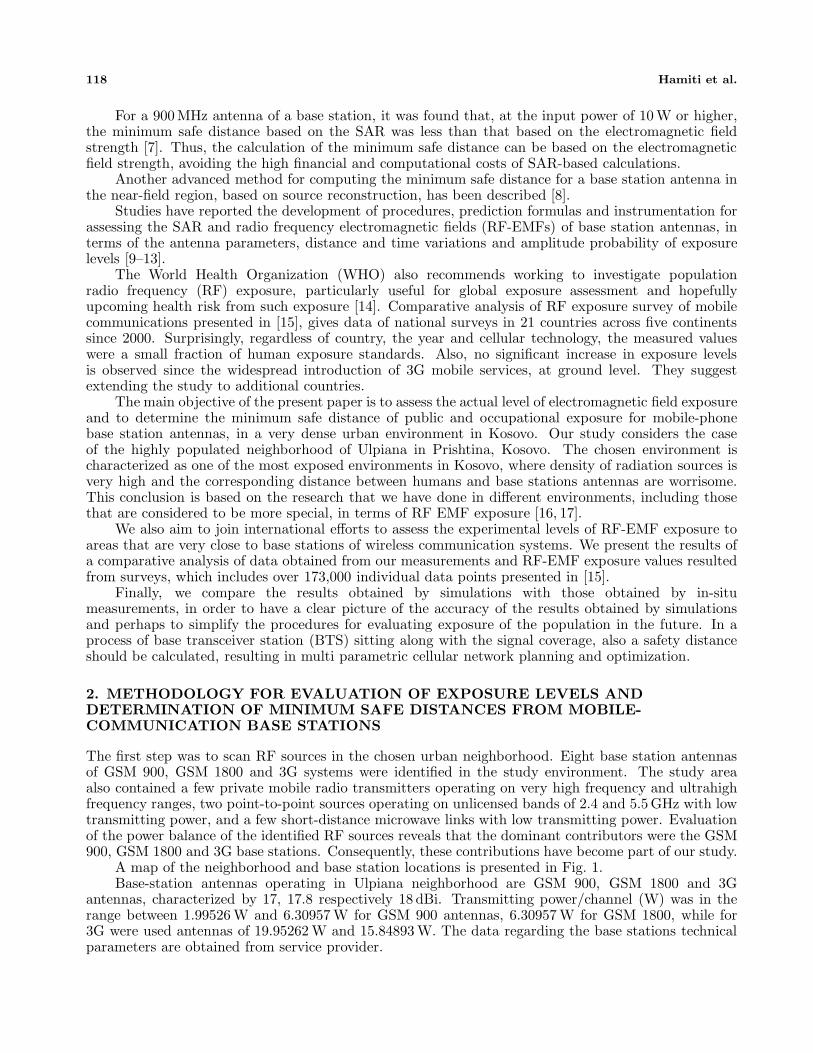
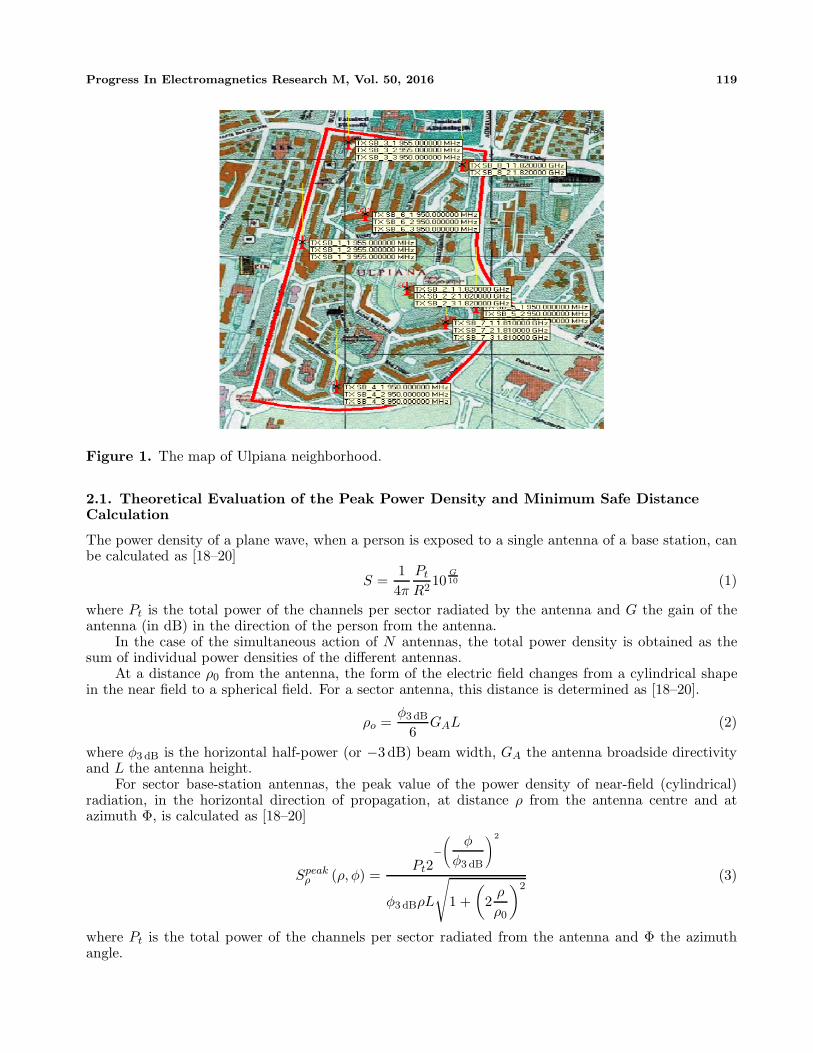
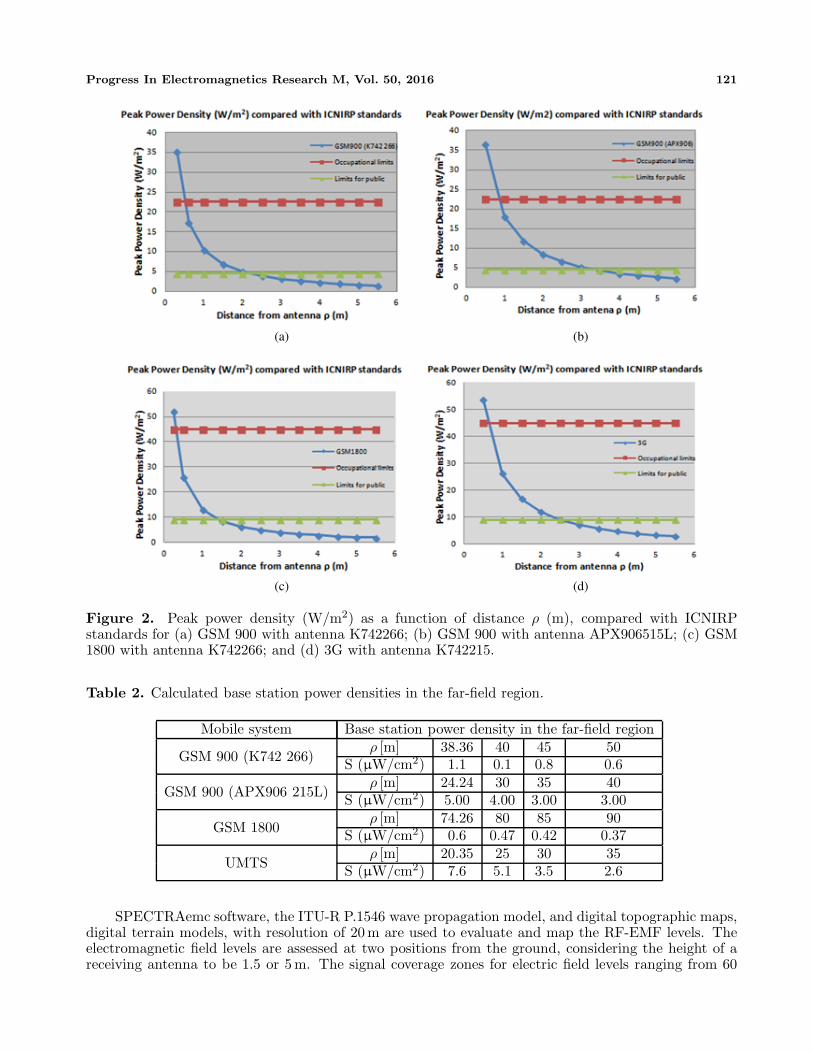
ρFigure 2 illustrates the dependence of the peak power density (W/m2) as a function of distance
ρ (m) from the antenna. The graphs also show the reference exposure levels of the ICNIRP for thegeneral population and occupational exposure. The results for the minimum safe distances varied from1.42 m to 3.35 m for the exposure of the general population.
The results are valid for specific antennas having certain parameters and maximum transmissionpower. Additionally, the results are obtained for ideal conditions of wave propagation, since noconsideration is given to possible reflections and other effects that may occur in reality.
For the far-field region, calculated power densities of the base station at different exposure positionsare given in Table 2. The calculated base station power densities for given exposure sites ranged from0.1 to 7.6 µW/cm2.
3. EVALUATION AND MAPPING OF ELECTROMAGNETIC FIELD LEVELS ANDIN SITU MEASUREMENTS
3.1. Software Mapping of Electromagnetic Field Levels
The methodologies of determining RF exposure and coverage, as well as electromagnetic field mappingvia different software packages, are elaborated [23–27].
Progress In Electromagnetics Research M, Vol. 50, 2016 121
(a)
(d)(c)
(b)
Figure 2. Peak power density (W/m2) as a function of distance ρ (m), compared with ICNIRPstandards for (a) GSM 900 with antenna K742266; (b) GSM 900 with antenna APX906515L; (c) GSM1800 with antenna K742266; and (d) 3G with antenna K742215.
Table 2. Calculated base station power densities in the far-field region.
Mobile system Base station power density in the far-field region
GSM 900 (K742 266)ρ [m] 38.36 40 45 50
S (µW/cm2) 1.1 0.1 0.8 0.6
GSM 900 (APX906 215L)ρ [m] 24.24 30 35 40
S (µW/cm2) 5.00 4.00 3.00 3.00
GSM 1800ρ [m] 74.26 80 85 90
S (µW/cm2) 0.6 0.47 0.42 0.37
UMTSρ [m] 20.35 25 30 35
S (µW/cm2) 7.6 5.1 3.5 2.6
SPECTRAemc software, the ITU-R P.1546 wave propagation model, and digital topographic maps,digital terrain models, with resolution of 20 m are used to evaluate and map the RF-EMF levels. Theelectromagnetic field levels are assessed at two positions from the ground, considering the height of areceiving antenna to be 1.5 or 5 m. The signal coverage zones for electric field levels ranging from 60

122 Hamiti et al.
(a) (b)
Figure 3. Electromagnetic field levels in the Ulpiana neighborhood for receiving antenna heights of(a) h = 1.5 m and (b) h = 5 m.
to 105 dBµV/m are mapped and illustrated. Fig. 3 presents the signal coverage zones for base-stationelectric field levels ranging from 60 to 105 dBµV/m and for a height of the receiving antenna of 1.5 or5m in the urban neighborhood under investigation.
In the human exposure scenario in the urban neighborhood of Ulpiana, for the case that the heightof the receiving antenna is 1.5 m, the electric field strength calculated with SPECTRAemc ranges from65.4 dBµV/m (0.001862 V/m) to 157.5 dBµV/m (76.73 V/m). The maximum value of 157.5 dBµV/m isfound close to the antenna having the highest transmission power. This is also seen in Fig. 3.
In the case that the height of the receiving antenna is 5 m, the electric field strength within thearea of Ulpiana ranges from 76.9 dBµV/m (0.006998 V/m) to 157.5 dBµV/m (76.73 V/m).
The results reveal that the electromagnetic field is stronger at greater heights. This is to be expectedbecause the antennas are located at altitudes above 20 m, and in their horizontal plane, the radiatedlevel is higher.
Table 3 gives the minimum and maximum of the electric field strength E and power density S, inthe urban neighborhood calculated with SPECTRAemc. These values of electric field strength (E) andpower density (S) show the determined level in certain points using the SPECTRAemc software.
Table 3. The minimum and maximum value of the electric field E (V/m) and power density S(µW/cm2) in the Ulpiana neighborhood, expressed also in dBµ.
Antenna
height
(m)
The minimum value The maximum value
E
[dBµV/m]
E
[V/m]
S
[µW/cm2]
S
[dBµW/cm2]
E
[dBµV/m]
E
[V/m]
S
[µW/cm2]
S
[dBµW/cm2]
1.5 65.4 0.001862 9.19 × 10⁻⁷ −60.36 157.7 76.73 1561.91 31.93
5 76.9 0.006998 1.29 × 10⁻⁵ −48.86 157.7 76.73 1561.91 31.93
Given the total surface area of the Ulpiana neighborhood, which is 0.39 km2, Table 4 presents thepercentages of the neighborhood having different levels of exposure of the electromagnetic field.
3.2. Experimental Evaluation of the Electromagnetic Field Levels
An in situ experimental evaluation of base-station electromagnetic field levels was performed with aNarda EMR-300 radiation meter. Measurement points were chosen near antennas, in the far-fieldregion, and in the direction of the maximum antenna radiation intensity, for all sectors of base stations.
Progress In Electromagnetics Research M, Vol. 50, 2016 123
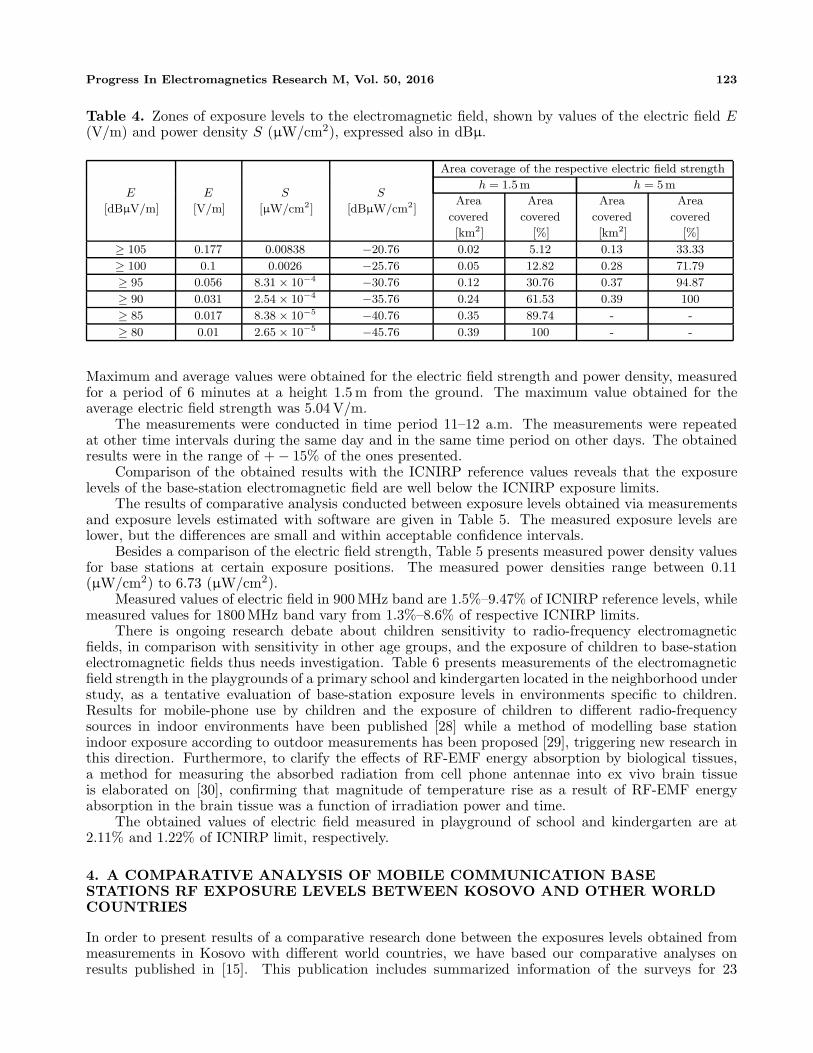
Table 4. Zones of exposure levels to the electromagnetic field, shown by values of the electric field E(V/m) and power density S (µW/cm2), expressed also in dBµ.
E
[dBµV/m]
E
[V/m]
S
[µW/cm2]
S
[dBµW/cm2]
Area coverage of the respective electric field strength
h = 1.5 m h = 5m
Area
covered
[km2]
Area
covered
[%]
Area
covered
[km2]
Area
covered
[%]
≥ 105 0.177 0.00838 −20.76 0.02 5.12 0.13 33.33
≥ 100 0.1 0.0026 −25.76 0.05 12.82 0.28 71.79
≥ 95 0.056 8.31 × 10⁻⁴ −30.76 0.12 30.76 0.37 94.87
≥ 90 0.031 2.54 × 10⁻⁴ −35.76 0.24 61.53 0.39 100
≥ 85 0.017 8.38 × 10⁻⁵ −40.76 0.35 89.74 - -
≥ 80 0.01 2.65 × 10⁻⁵ −45.76 0.39 100 - -
Maximum and average values were obtained for the electric field strength and power density, measuredfor a period of 6 minutes at a height 1.5 m from the ground. The maximum value obtained for theaverage electric field strength was 5.04 V/m.
The measurements were conducted in time period 11–12 a.m. The measurements were repeatedat other time intervals during the same day and in the same time period on other days. The obtainedresults were in the range of + − 15% of the ones presented.
Comparison of the obtained results with the ICNIRP reference values reveals that the exposurelevels of the base-station electromagnetic field are well below the ICNIRP exposure limits.
The results of comparative analysis conducted between exposure levels obtained via measurementsand exposure levels estimated with software are given in Table 5. The measured exposure levels arelower, but the differences are small and within acceptable confidence intervals.
Besides a comparison of the electric field strength, Table 5 presents measured power density valuesfor base stations at certain exposure positions. The measured power densities range between 0.11(µW/cm2) to 6.73 (µW/cm2).
Measured values of electric field in 900 MHz band are 1.5%–9.47% of ICNIRP reference levels, whilemeasured values for 1800 MHz band vary from 1.3%–8.6% of respective ICNIRP limits.
There is ongoing research debate about children sensitivity to radio-frequency electromagneticfields, in comparison with sensitivity in other age groups, and the exposure of children to base-stationelectromagnetic fields thus needs investigation. Table 6 presents measurements of the electromagneticfield strength in the playgrounds of a primary school and kindergarten located in the neighborhood understudy, as a tentative evaluation of base-station exposure levels in environments specific to children.Results for mobile-phone use by children and the exposure of children to different radio-frequencysources in indoor environments have been published [28] while a method of modelling base stationindoor exposure according to outdoor measurements has been proposed [29], triggering new research inthis direction. Furthermore, to clarify the effects of RF-EMF energy absorption by biological tissues,a method for measuring the absorbed radiation from cell phone antennae into ex vivo brain tissueis elaborated on [30], confirming that magnitude of temperature rise as a result of RF-EMF energyabsorption in the brain tissue was a function of irradiation power and time.
The obtained values of electric field measured in playground of school and kindergarten are at2.11% and 1.22% of ICNIRP limit, respectively.
4. A COMPARATIVE ANALYSIS OF MOBILE COMMUNICATION BASESTATIONS RF EXPOSURE LEVELS BETWEEN KOSOVO AND OTHER WORLDCOUNTRIES
In order to present results of a comparative research done between the exposures levels obtained frommeasurements in Kosovo with different world countries, we have based our comparative analyses onresults published in [15]. This publication includes summarized information of the surveys for 23

124 Hamiti et al.
Table 5. Measured vs. software-estimated values of the electric field E (V/m) and power density S(µW/cm2), expressed also in dBµ.
Base
station
Sector
no.
Azimuth
[◦]
Distance
from
base-station
[m]
Measured vales
Evaluation
with
SPECTRAemc
E
[dBµV/m]
E
[V/m]
S
[µW/cm2]
E
[dBµV/m]
E
[V/m]
S
[µW/cm2]
SB 81 190 15 128 2.51 1.67 129 2.81 2.09
2 290 7 134 5.04 6.73 136 6.31 10.55
SB 6
1 60 30 122 1.25 0.41 125 1.77 0.83
2 215 30 121 1.12 0.33 132 3.98 4.20
3 345 30 132 3.98 4.20 133 4.46 5.29
SB 1
1 30 55 124 1.58 0.66 126 1.99 1.05
2 150 40 127 2.23 1.32 129 2.81 2.09
3 270 30 128 2.51 1.67 130 3.16 2.65
SB 4
1 60 40 116 0.63 0.11 118 0.79 0.16
2 165 20 128 2.51 1.67 130 3.16 2.65
3 295 35 120 1.00 0.26 124 1.58 0.66
SB 7
1 50 20 130 3.16 2.65 130 3.16 2.65
2 170 25 128 2.51 1.67 129 2.81 2.09
3 270 15 131 3.54 3.34 132 3.98 4.20
SB 5
1 80 12 126 1.99 1.05 127 2.23 1.33
2 240 20 124 1.58 0.66 125 1.77 0.83
3 350 35 126 1.99 1.05 127 2.23 1.32
SB 2
1 40 65 120 1.00 0.26 122 1.25 0.41
2 150 55 131 3.54 3.34 132 3.98 4.20
3 260 45 118 0.79 0.16 120 1.00 0.26
Table 6. Electromagnetic field base-station exposure levels (values of the electric field E (V/m) andpower density S (µW/cm2), expressed also in dBµ)) in the playgrounds of a kindergarten and primaryschool.
Location of
measurement
Measurements with Narda EMR 300 Evaluation with SPECTRAemc
E
[dBµV/m]
E
[V/m]
S
[µW/cm2]
E
[dBµV/m]
E
[V/m]
S
[µW/cm2]
Kindergarten
playground117 0.71 0.13 118 0.79 0.16
Primary
school
playground
119 0.89 0.21 120 1 0.26
countries in five continents with 173,323 measurement points, with the main characteristics and expandsof the abbreviated names of the mobile technologies presented at Table 7.
Since all measurement surveys were done independently there was lack of a standardizedmeasurement protocol in the participating countries, different methodology in use, different instruments,different frequency bands and resolution bandwidths and measurement modes, different criteria forselecting measurement locations etc. All these facts are considered to have caused a discrepancy betweenobtained results. In Table 7 are presented the results by country and by mobile technology in use, for
Progress In Electromagnetics Research M, Vol. 50, 2016 125
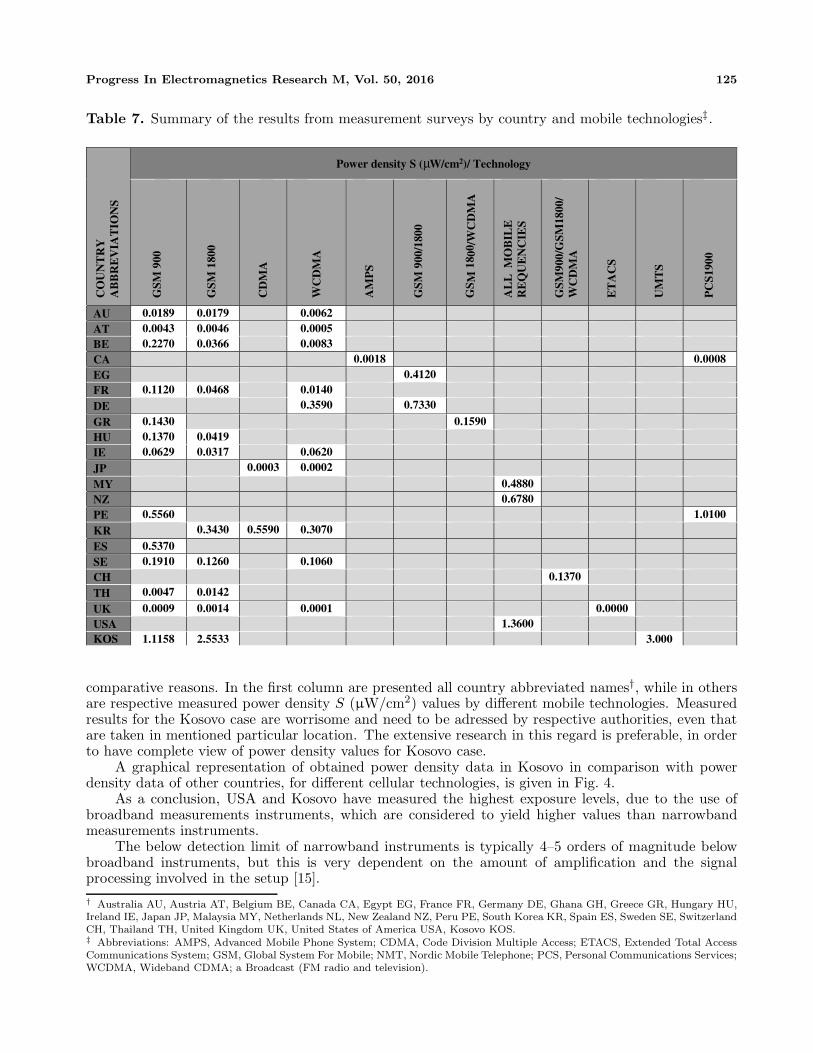
Table 7. Summary of the results from measurement surveys by country and mobile technologies‡.C
OU
NT
RY
A
BB
RE
VIA
TIO
NS
Power density S ( W/cm2)/ Technology G
SM 9
00
GSM
180
0
CD
MA
WC
DM
A
AM
PS
GSM
900
/180
0
GS M
18 0
0 /W
CD
MA
AL
L M
OB
ILE
R
EQ
UE
NC
IES
GSM
900/
GSM
1800
/W
CD
MA
ET
AC
S
UM
TS
PC
S190
0
AU 0.0189 0.0179 0.0062
AT 0.0043 0.0046 0.0005 BE 0.2270 0.0366 0.0083 CA 0.0018 0.0008 EG 0.4120 FR 0.1120 0.0468 0.0140 DE 0.3590 0.7330
GR 0.1430 0.1590 HU 0.1370 0.0419 IE 0.0629 0.0317 0.0620 JP 0.0003 0.0002
MY 0.4880 NZ 0.6780 PE 0.5560 1.0100 KR 0.3430 0.5590 0.3070
ES 0.5370 SE 0.1910 0.1260 0.1060 CH 0.1370 TH 0.0047 0.0142
UK 0.0009 0.0014 0.0001 0.0000 USA 1.3600 KOS 1.1158 2.5533 3.000
μ
comparative reasons. In the first column are presented all country abbreviated names†, while in othersare respective measured power density S (µW/cm2) values by different mobile technologies. Measuredresults for the Kosovo case are worrisome and need to be adressed by respective authorities, even thatare taken in mentioned particular location. The extensive research in this regard is preferable, in orderto have complete view of power density values for Kosovo case.
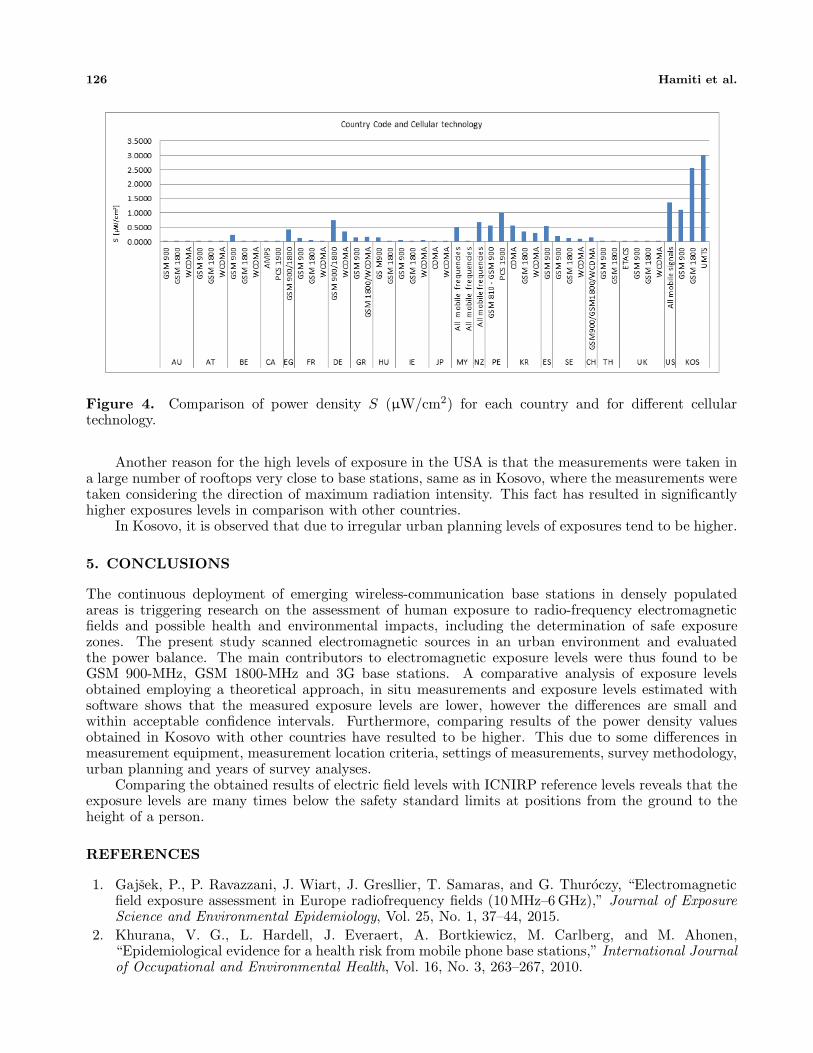
A graphical representation of obtained power density data in Kosovo in comparison with powerdensity data of other countries, for different cellular technologies, is given in Fig. 4.
As a conclusion, USA and Kosovo have measured the highest exposure levels, due to the use ofbroadband measurements instruments, which are considered to yield higher values than narrowbandmeasurements instruments.
The below detection limit of narrowband instruments is typically 4–5 orders of magnitude belowbroadband instruments, but this is very dependent on the amount of amplification and the signalprocessing involved in the setup [15].† Australia AU, Austria AT, Belgium BE, Canada CA, Egypt EG, France FR, Germany DE, Ghana GH, Greece GR, Hungary HU,Ireland IE, Japan JP, Malaysia MY, Netherlands NL, New Zealand NZ, Peru PE, South Korea KR, Spain ES, Sweden SE, SwitzerlandCH, Thailand TH, United Kingdom UK, United States of America USA, Kosovo KOS.‡ Abbreviations: AMPS, Advanced Mobile Phone System; CDMA, Code Division Multiple Access; ETACS, Extended Total AccessCommunications System; GSM, Global System For Mobile; NMT, Nordic Mobile Telephone; PCS, Personal Communications Services;WCDMA, Wideband CDMA; a Broadcast (FM radio and television).
126 Hamiti et al.
Figure 4. Comparison of power density S (µW/cm2) for each country and for different cellulartechnology.
Another reason for the high levels of exposure in the USA is that the measurements were taken ina large number of rooftops very close to base stations, same as in Kosovo, where the measurements weretaken considering the direction of maximum radiation intensity. This fact has resulted in significantlyhigher exposures levels in comparison with other countries.
In Kosovo, it is observed that due to irregular urban planning levels of exposures tend to be higher.
5. CONCLUSIONS
The continuous deployment of emerging wireless-communication base stations in densely populatedareas is triggering research on the assessment of human exposure to radio-frequency electromagneticfields and possible health and environmental impacts, including the determination of safe exposurezones. The present study scanned electromagnetic sources in an urban environment and evaluatedthe power balance. The main contributors to electromagnetic exposure levels were thus found to beGSM 900-MHz, GSM 1800-MHz and 3G base stations. A comparative analysis of exposure levelsobtained employing a theoretical approach, in situ measurements and exposure levels estimated withsoftware shows that the measured exposure levels are lower, however the differences are small andwithin acceptable confidence intervals. Furthermore, comparing results of the power density valuesobtained in Kosovo with other countries have resulted to be higher. This due to some differences inmeasurement equipment, measurement location criteria, settings of measurements, survey methodology,urban planning and years of survey analyses.
Comparing the obtained results of electric field levels with ICNIRP reference levels reveals that theexposure levels are many times below the safety standard limits at positions from the ground to theheight of a person.
REFERENCES
1. Gajsek, P., P. Ravazzani, J. Wiart, J. Gresllier, T. Samaras, and G. Thuroczy, “Electromagneticfield exposure assessment in Europe radiofrequency fields (10 MHz–6 GHz),” Journal of ExposureScience and Environmental Epidemiology, Vol. 25, No. 1, 37–44, 2015.
2. Khurana, V. G., L. Hardell, J. Everaert, A. Bortkiewicz, M. Carlberg, and M. Ahonen,“Epidemiological evidence for a health risk from mobile phone base stations,” International Journalof Occupational and Environmental Health, Vol. 16, No. 3, 263–267, 2010.

Progress In Electromagnetics Research M, Vol. 50, 2016 127
3. Gandhi, G., G. Kaur, and U. Nisar, “A cross-sectional case control study on genetic damage inindividuals residing in the vicinity of a mobile phone base station,” Electromagnetic Biology andMedicine, 344–354, 2014.
4. International Commission on Non-Ionizing Radiation Protection, “Guidelines for limiting exposureto time-varying electric, magnetic, and electromagnetic fields (up to 300 GHz),” Health Physics,Vol. 74, No. 4, 494–522, 1998.
5. Alanko, T., M. Hietanen, and P. von Nandelstadh, “Occupational exposure to RF fields from basestation antennas on rooftops,” Annals of Telecommunications — Annales des Telecommunications,Vol. 63, Nos. 1–2, 125–132, 2008.
6. Lacroux, F., E. Conil, A. C. Carrasco, A. Gati, M. F. Wong, and J. Wiart, “Specificabsorption rate assessment near a base station antenna (2,140 MHz): Some key points,” Annals ofTelecommunications — Annales des Telecommunications, Vol. 63, Nos. 1–2, 55–64, 2008.
7. Joseph, W. and L. Martens, “Comparison of safety distances based on the electromagnetic fieldand based on the SAR for occupational exposure of a 900-MHz base station antenna,” IEEETransactions on Electromagnetic Compatibility, Vol. 47, No. 4, 2005.
8. Laviada, J., Y. Alvarez-Lopez, and F. Las-Heras, “Efficient determination of the near-field invicinity of an antenna for the estimation of its safety perimeter,” Progress In ElectromagneticResearch, Vol. 103, 371–391, 2010.
9. Gosselin, M.-C., G. Vermeeren, S. Kuhn, V. Kellerman, S. Benkler, T. M. I. Uusitupa, W. Joseph,A. Gati, J. Wiart, F. J. C. Meyer, L. Martens, T. Nojima, T. Hikage, Q. Balzano, A. Christ, andN. Kuster, “Estimation formulas for the specific absorption rate in humans exposed to base stationantennas,” IEEE Transactions on Electromagnetic Compatibility, Vol. 53, No. 4, 2011.
10. Gosselin, M.-C., A. Christ, S. Kuhn, and N. Kuster, “Dependence of the occupational exposureto mobile phone base stations on the properties of the antenna and the human body,” IEEETransactions on Electromagnetic Compatibility, Vol. 51, No. 2, 2009.
11. Wang, J., T. Tayamachi, and O. Fujiwara, “Amplitude probability distribution measurementfor electric field intensity assessment of cellular-phone-base stations,” IEEE Transactions onElectromagnetic Compatibility, Vol. 50, No. 3, 2008.
12. Ozdemir, A. R., M. Alkan, and M. Gulsen, “Time dependence of environmental electricfield measurements and analysis of cellular base stations,” IEEE Electromagnetic CompatibilityMagazine, Vol. 3, No. 3, 2014.
13. Higashiyama, J. and Y. Tarusawa, “Design of electric field meter to assess human exposurein environment with mobile base station,” 2014 International Symposium on ElectromagneticCompatibility, Tokyo (EMC’14/Tokyo) 650–653, IEEE, 2014.
14. World Health Organization, WHO research agenda for radiofrequency fields,http://www.who.int/peh-emf/research/agenda/en/index.html (accessed December 19, 2010),2010.
15. Rowley, J. T. and K. H. Joyner, “Comparative international analysis of radiofrequency exposuresurveys of mobile communication radio base stations,” Journal of Exposure Science andEnvironmental Epidemiology, Vol. 22, No. 3, 304–315, 2012.
16. Ibrani, M., E. Hamiti, L. Ahma, R. Halili, V. Shala, and D. Berisha, “Narrowband frequency-selective up-link and down-link evaluation of daily personal-exposure induced by wireless operatingnetworks,” Wireless Networks, 1–10, 2016.
17. Ibrani, M., E. Hamiti, L. Ahma, and B. Shala, “Assessment of personal radio frequencyelectromagnetic field exposure in specific indoor workplaces and possible worst-case scenarios,”AEU-International Journal of Electronics and Communications, Vol. 70, No. 6, 808–813, 2016.
18. Miclaus, S. and P. Bechet, “Estimated and measured values of the radiofrequency radiation powerdensity around cellular base stations,” Romanian Journal of Physics, Vol. 52, Nos. 3/4, 429, 2007.
19. Cicchetti, R. and A. Faraone, “Estimation of the peak power density in the vicinity of cellular andradio base station antennas,” IEEE Transactions on Electromagnetic Compatibility, Vol. 46, No. 2,275–290, 2004.

128 Hamiti et al.
20. Kamo, B., R. M. Mitrushi, V. Kolici, O. Shurdi, and A. Lala, “Estimated peak power density in thevicinity of cellular base stations in Albanian territory,” 2010 International Conference on Software,Telecommunications and Computer Networks (SoftCOM), 117–120, IEEE, 2010.
21. Gajsek, P. and D. Simunic, “Occupational exposure to base stations — compliance with EUDirective 2004/40/EC,” International Journal of Occupational Safety and Ergonomics, Vol. 12,No. 2, 187–194, 2006.
22. Baldauf, M. A., S. Knorzer, J. A. Pontes, and W. Wiesbeck, “Safety distances underneath verticallypolarized base station antennas,” 18th International Zurich Symposium on ElectromagneticCompatibility, EMC Zurich 2007, 191–194, IEEE, 2007.
23. Beekhuizen, J., R. Vermeulen, H. Kromhout, A. Burgi, and A. Huss, “Geospatial modelling ofelectromagnetic fields from mobile phone base stations,” Science of the Total Environment, Vol. 445,202–209, 2013.
24. Hasenfratz, D., S. Sturzenegger, O. Saukh, and L. Thiele, “Spatially resolved monitoring of radio-frequency electromagnetic fields,” Proceedings of First International Workshop on Sensing and BigData Mining, 1–6, ACM, 2013.
25. Agbinya, J., Z. Chaczko, and K. Aboura, “Radio frequency pollution mapping,” Proc. of the FourthInternational Conference on Broadband Communication Information Technology and BiomedicalApplications, 2009.
26. Genc, O., M. Bayrak, and E. Yaldiz, “Analysis of the effects of GSM bands to the electromagneticpollution in the RF spectrum,” Progress In Electromagnetics Research, Vol. 101, 17–32, 2010.
27. Paniagua, J. M., M. Rufo, A. Jimenez, and A. Antolin, “The spatial statistics formalism appliedto mapping electromagnetic radiation in urban areas,” Environmental Monitoring and Assessment,Vol. 185, No. 1, 311–322, 2013.
28. Ibrani, M., L. Ahma, and E. Hamiti, “Assessment of the exposure of children to electromagneticfields from wireless communication devices in home environments,” IET Communications, Vol. 8,No. 12, 2222–2228, 2014.
29. Beekhuizen, J., R. Vermeulen, M. van Eijsden, R. van Strien, A. Burgi, E. Loomans, and A. Huss,“Modelling indoor electromagnetic fields (EMF) from mobile phone base stations for epidemiologicalstudies,” Environment International, Vol. 67, 22–26, 2014.
30. Gultekin, D. H. and L. Moeller, “NMR imaging of cell phone radiation absorption in brain tissue,”Proceedings of the National Academy of Sciences, Vol. 110, No. 1, 58–63, 2013.