pdf, 476 kb - blood
TRANSCRIPT
1
SUPPLEMENTAL MATERIAL
Supplemental Methods
Cr51 labeling studies
Eight bags of commercially available universal donor blood (~300 grams each) were
obtained and refrigerated at 1-6 C. The donor blood was processed and leukoreduced by
filtration (RC2D Triple; Pall Medical, East Hills, NY) immediately after being obtained from a
closed colony of canine blood donors with a universal blood donor red blood cell phenotype
(DEA1.1). Aliquots (20 mL) were taken from 1-week-old (n = 4) and 6-week-old (n = 4) stored
blood and Cr51 labeled as previously described 1. For determination of red blood cell survival, a
blood sample was drawn at 30 min after infusion of the labeled cells (control viability count),
and at 24 h after infusion. Each sample was divided into 2 parts; part 1 was spun down and
separated into red blood cells and plasma, and part 2, the red cells were lysed (Triton, 0.1%). In
this system, the red cell signal reflects the labeled viable cells, the plasma signal reflects the label
that has leaked out of the cells, the lysed sample signal indicating zero viability. The amount of
radioactivity in each sample was determined using a gamma counter (background less than 10
cpm). The cpm/mL of RBCs 24 h after infusion was computed as a percentage of the counts at
30 min after infusion of the labeled cells to determine percent viability [RBC@T24 /[email protected] *
100%] 1. The percent hemolysis in a storage bag was calculated as [supernatant Hb (g/L)]/[total
Hb (g/L)]*(1-Hct) 2.
Bacterial preparation and inoculation

2
S. aureus isolates, sensitive to oxacillin, were prepared and administered into the right
lower lobe, subsegmental airspace via a bronchoscope as previously described.3 The doses of S.
aureus (1, 1.25, 1.5, and 2 x 10⁹ CFU/kg suspended in 1 mL PBS) were determined
spectrophotometrically and confirmed turbidometrically.
Physiological and laboratory measurements
Hemodynamic parameters [MAP, mPAP, PAOP, central venous pressure (CVP), heart
rate (HR),and cardiac output (CO)] were measured and blood sampling from the animals and
from the blood storage bags [arterial and mixed venous blood gases, complete blood counts
(CBC), serum chemistries, Hp, NTBI, blood cultures, and urine volumes] were measured in all
animals studied at the times shown in Figure 1 as previously described.3
Fluid and vasopressor support
All animals received continuous maintenance fluids (Normasol-M + 27 mEq K+/L, 2
mL/kg/h, IV) beginning at T0. To simulate clinical hemodynamic support and equalize initial
volume status in all animals, up to three fluid boluses (0.9 % NaCl, 20mL/kg) were administered
at 20 min intervals if PAOP measured at 4 h was < 10 mmHg. For a MAP < 80 mmHg after the
three fluid boluses, a NE infusion was initiated at 0.2 µg/kg/min and adjusted incrementally (0.2
to 0.4 to 1.0, to a maximum of 2.0 µg/kg/min) at 5-min intervals to maintain MAP between 80
and 110 mmHg throughout the 96 h study. At subsequent times (T6, T8, T10, T12, and every 4
hours thereafter), up to 3 IV fluid boluses (20 mL/kg) were administered if PAOP < 10 mmHg.
3
Sedation and analgesia management
All animals were monitored by a clinician or trained technician at the bedside throughout
the two studies. Midazolam (0.2 mg/kg loading dose, 50 µg/kg/min infusion IV) sedation and
fentanyl (5 µg/kg loading dose, 0.7 µg/kg/min infusion IV) analgesia were titrated based on an
algorithm as previously described.3 Medetomidine infusion (2-5 mg/kg/min) was used to
supplement sedation as needed according to set criteria.
NO consumption capability assay
The ability of CFH in the supernatant to scavenge NO was measured with a previously
published and validated NO consumption capability assay using a NO chemiluminescence
analyzer (Sievers, Boulder, CO).4,5
Plasma CFH levels and spectral deconvolution of species
Hb concentrations (μmol/L) in plasma or supernatants collected from stored RBC units were
determined primarily by Drabkin’s method. Plasma samples containing low levels of Hb (<10 μmol/L)
are close to the limit of detection of the Drabkin’s method. In such cases, plasma Hb was determined by
deconvolution of the Hb spectra.
i. Drabkin’s reagent. Plasma or supernatants from stored RBC units were diluted 1:25 with
Drabkin’s reagent to convert Hb to cyanmethemoglobin 6. Hb concentrations were
obtained by dividing the absorbance spectra at 540 nm (Synergy H1 microplate reader,
BioTek instruments, Winooski, Vermont) by 10.958 (canine Hb extinction coefficient)
and correcting for the dilution factor.
4
ii. Hb deconvolution. Plasma or supernatants from stored RBC units were scanned in the
range of 450 nm to 700 nm using a UV-visible spectrophotometer (Cary 50 Bio, Agilent
Technologies, Santa Clara, California) with 1 cm path-length cuvettes. Hb micromolar
concentration and oxidation state (oxyhemoglobin, methemoglobin) were analyzed by
deconvolution of the Hb spectra into components (oxyhemoglobin, deoxyhemoglobin,
and methemoglobin) and the least-squares method, as previously described.7,8
Canine Hp ELISA assay
Canine plasma Hp levels were determined by a commercial canine Hp ELISA kit (Abnova,
Taipei City, Taiwan).
Canine NTBI/LBI assay
Canine NTBI/LBI were determined by commercial company using a proprietary assay
(aFerrix, Tel Aviv, Israel)
Histology
Lung tissue, lower right and caudal left lobe, and right kidney tissue were sampled from
all animals and placed in formalin either immediately after death or in survivors at 96 h
immediately after euthanasia. The tissue sample was stained with H & E and read blinded to
treatment groups by two pathologists (M.A. and M.Q.) using a modified scoring system9
including a 4-point lung tissue damage score representing hemorrhage, necrosis, and thrombosis,
and a 6-point lung inflammation score representing number of inflammatory cells per high power

5
field and degree of fibrinous exudates. These two scores were used to quantify separately tissue
damage vs. inflammation in the lungs.
Statistical Methods
Logistic regression was used to find the dose of bacterial challenge needed to produce
about 50% average mortality rate with the exchange transfusion of one blood volume (newer or
older). The optimal dose was selected when the estimate is stable for several cycles. Then more
animals were added to the selected dose to reach a total of 24 animals at that dose. The treatment
assignment remained blinded and no analysis on the survival data was done until study
completion.
To evaluate shock reversal, we standardized MAP and NE using Z-scores and then
calculated a “shock reversal” score based on the difference of the MAP Z-score and NE Z-score,
for which a higher score indicates improvements in shock reversal, as done previously.10
Repeated measurements of each animal and the actual pairing of animals within each cycle were
accounted for in the linear mixed models used. Standard residual diagnostics were used to check
model assumptions. Logarithm-transformation was used when necessary. SAS version 9.3
(Cary, NC) was used for all analyses except those noted otherwise (i.e. StatXact).
Supplemental Results
Preliminary studies
The characteristics of the 7- and 42-day-old stored canine blood to be used in these
experiments were determined prior to transfusion studies in animals. Each week for 6 weeks, 6
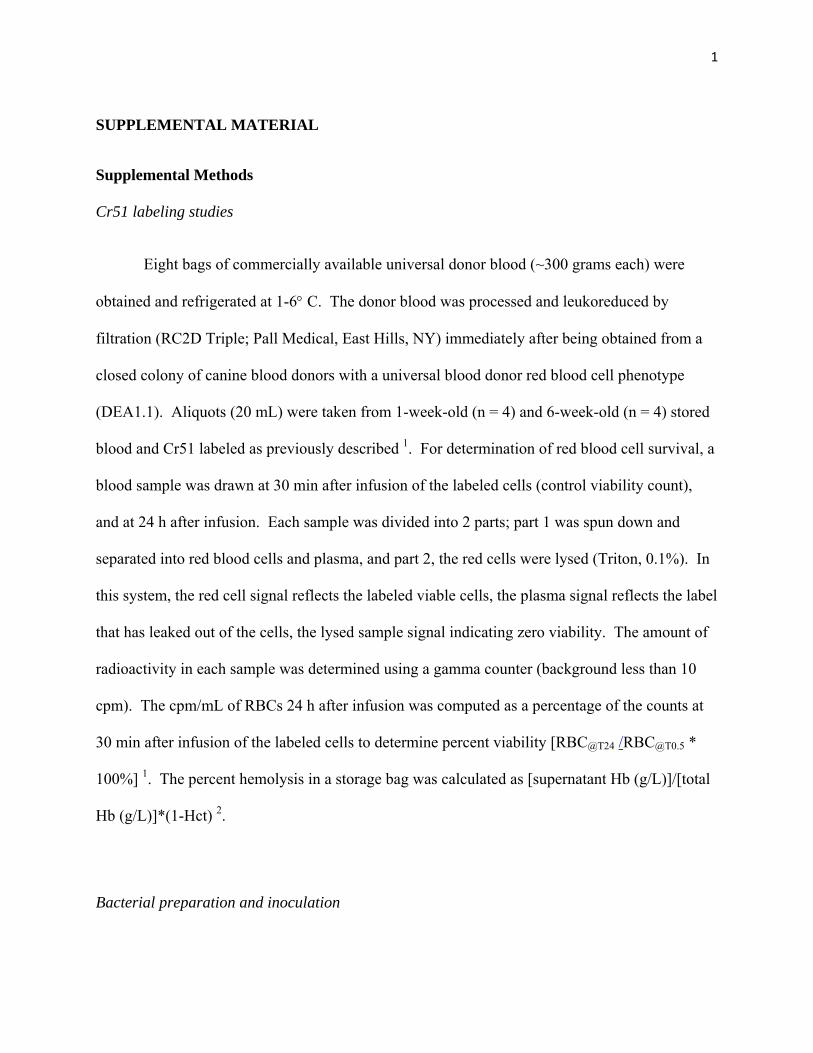
bags of stored blood were sampled for laboratory testing. Over 6 weeks storage, the average pH
and HCO-3 decreased gradually in each unit from ~6.95 to 6.75 and ~12 to 7 mmol, respectively.

6
The K+, lactate, and PO2 in each unit increased gradually from ~3.2 to 4.0 mmol, ~7 to 14 mmol,
and ~100 to 230 mmHg, respectively (see supplemental Figure 1). Importantly, over the 6 weeks
in all 6 units of canine RBC’s, the percent hemolysis was always less than 1% (see supplemental
Fig.1, Panel A). Moreover, a separate chromium 51-labeled RBC survival study was done in
eight normal 2 y/o, 10-12 kg canines (see Supplemental Methods, Chromium 51-labeling
studies). RBC percent survival in the four normal animals at 24 h after receiving a chromium-
labeled aliquot of blood from one of four units of 1-week-old packed RBC after transfusion was
69, 73, 84 and 99 percent (see supplemental Table 1). For 6-week-old blood, the percent
survival of RBC’s in four normal animals at 24 h after transfusion was 63, 62, 61, and 60
percent. In canines, the percent hemolysis in storage bags, RBC percent survival 24 h after
infusion, and the laboratory characteristics of the stored canine blood over time, are consistent
with findings for human blood values after 1 and 6 weeks of storage.11-14
A preliminary study was also performed to determine, in this S. aureus pneumonia
model, the dose of bacterial challenge needed to produce ~50% average mortality rate after
addition of an exchange transfusion of 1 blood volume to the model. Four intrapulmonary
bacterial doses (1, 1.25, 1.5 and 2x 10⁹ CFU/kg, n = 24 total) were given and then animals were
exchange- transfused with 7- or 42-day-old stored canine universal donor blood. We then chose
the bacterial dose (1.25 x 10⁹ CFU/kg S. aureus, n = 8) that produced the desired mortality. An
additional 16 animals were added at this dose for a total of 24 animals. The remainder of the
paper focuses on the 24 animals studied at bacterial dose 1.25 x 10⁹ CFU/kg.

7
Canine Donor Blood Collection and Process Protocol
1. A sterile blood donor bag is connected (Pall, whole blood collection & component
storage system, Port Washington, NY) to an introducer inserted in a large vein in the
canines.
2. The blood donor bags are placed below the level of the heart on a digital blood shaker
(Sebra 1040, Tuscan, AZ) and fill via gravity.
3. Once 450ml whole blood has been collected into CP2D whole blood bag, the bag is
removed from the shaker, and then the tubing permanently sealed between Y connector
and whole blood bag with a tube sealer (Sebra 1040, Tuscan, AZ), and the Y connector
discarded.
4. The CP2D whole blood bag is kept vertically in buckets and balanced.
5. The CP2D whole blood bag bucket vertically placed in a refrigerated centrifuge (Sorvall
RC 3BP, Asheville, NC) at 4000 rpm (Relative Centrifugal force: 4700g) for 6.5 minutes
at 22°C to separate the whole blood into plasma and red blood cells.
6. The bags are gently removed from centrifuge and the CP2D whole blood bag is placed on
the plasma expresser (Fenwal, plasma extractor 4R4414, Deerfield, IL) stand under the
laminar flow hood.
7. The internal closure of the tube connecting CP2D whole blood bag to satellite empty bags
is broken manually and one of the empty bags clamped, another kept open.
8. The supernatant plasma is expressed into the open bag.
9. About 10ml plasma (buffy coat mix) is left in the red blood cell tubing line.
10. The plasma in the satellite bag is labeled as Fresh Frozen Plasma (FFP), and the tubing
sealed and the bag stored immediately below -30°C.

8
11. The buffy coat mix in the remaining 10 ml of plasma in the tubing line is expressed into
the remaining empty satellite bag, sealed and discarded.
12. The AS-3 red blood cells (RBCs) bag is hung on a stand (70-90 inch high, prime stand).
13. The internal closure between the RBCs bag and the leukocyte depletion filter are
manually broken and all the AS-3 solution is allowed to go through the filter and the
CP2D whole blood bags now contains the blood cells via gravity.
14. CP2D whole blood bags are gently shaken several times to make sure AS-3 solution and
blood cells mixed sufficiently.
15. The CP2D whole blood bag on another stand (60 inches high, filter stand) is hung and all
the RBCs and AS-3 solution are allowed to pass through the leukocyte depletion filter
into the AS-3 RBCs bag via gravity.
16. The AS-3 RBCs bag is cut and scaled and this bag is labeled as Packed Red Blood Cells
(PRBCs) and immediately placed in a refrigerator (1°-6°C).

9
Table S1. Cr51 labeled RBC percent survival 24 h after receiving 1- and 6- week
old stored blood.

10
Table S2. Quantitative laboratory parameters, sedation support and fluids in/out.
11
Figure S1. Serial changes in stored blood components over 6 weeks.
Serial values of (A) ) Percent hemolysis; (B) pH; (C) Partial pressure of oxygen, pO2; (D) Bicarbonate, HCO3; (E) Potassium, K+; (F) Lactate sampled weekly for 6 weeks. Mean values over time are represented by a thick grey line. The various forms of dashed lines represent each of the 6 bags of stored blood sampled over time.

12
Figure S2. Correlation of methods for measuring CFH.
Correlation of Drabkin’s method with (A) Deconvolution and (B) Winterbourne methods of detecting CFH at 24 h (R2 = 0.995 for both).

13
Supplemental references:
1. Gillette PN, Manning JM, Cerami A. Increased survival of sickle-cell erythrocytes after
treatment in vitro with sodium cyanate. Proc Natl Acad Sci U S A. Nov
1971;68(11):2791-2793.
2. Sowemimo-Coker SO. Red blood cell hemolysis during processing. Transfus Med Rev.
Jan 2002;16(1):46-60.
3. Minneci PC, Deans KJ, Hansen B, et al. A canine model of septic shock: balancing
animal welfare and scientific relevance. Am J Physiol Heart Circ Physiol. Oct
2007;293(4):H2487-2500.
4. Wang X, Tanus-Santos JE, Reiter CD, et al. Biological activity of nitric oxide in the
plasmatic compartment. Proc Natl Acad Sci U S A. Aug 3 2004;101(31):11477-11482.
5. MacArthur PH, Shiva S, Gladwin MT. Measurement of circulating nitrite and S-
nitrosothiols by reductive chemiluminescence. J Chromatogr B Analyt Technol Biomed
Life Sci. May 15 2007;851(1-2):93-105.
6. Zwart A, van Assendelft OW, Bull BS, England JM, Lewis SM, Zijlstra WG.
Recommendations for reference method for haemoglobinometry in human blood (ICSH
standard 1995) and specifications for international haemiglobinocyanide standard (4th
edition). J Clin Pathol. Apr 1996;49(4):271-274.
7. Donadee C, Raat NJ, Kanias T, et al. Nitric oxide scavenging by red blood cell
microparticles and cell-free hemoglobin as a mechanism for the red cell storage lesion.
Circulation. Jul 26 2011;124(4):465-476.
14
8. Huang Z, Louderback JG, Goyal M, Azizi F, King SB, Kim-Shapiro DB. Nitric oxide
binding to oxygenated hemoglobin under physiological conditions. Biochim Biophys
Acta. Dec 19 2001;1568(3):252-260.
9. Priestnall SL, Erles K, Brooks HW, et al. Characterization of pneumonia due to
Streptococcus equi subsp. zooepidemicus in dogs. Clin Vaccine Immunol. Nov
2010;17(11):1790-1796.
10. Hicks CW, Sweeney DA, Danner RL, et al. Efficacy of selective mineralocorticoid and
glucocorticoid agonists in canine septic shock. Crit Care Med. Jan 2012;40(1):199-207.
11. Zuck TF, Bensinger TA, Peck CC, et al. The in vivo survival of red blood cells stored in
modified CPD with adenine: report of a multi-institutional cooperative effort.
Transfusion. Jul-Aug 1977;17(4):374-382.
12. Rathbun EJ, Nelson EJ, Davey RJ. Posttransfusion survival of red cells frozen for 8
weeks after 42-day liquid storage in AS-3. Transfusion. Mar-Apr 1989;29(3):213-217.
13. Luten M, Roerdinkholder-Stoelwinder B, Schaap NP, de Grip WJ, Bos HJ, Bosman GJ.
Survival of red blood cells after transfusion: a comparison between red cells concentrates
of different storage periods. Transfusion. Jul 2008;48(7):1478-1485.
14. Gkoumassi E, Dijkstra-Tiekstra MJ, Hoentjen D, de Wildt-Eggen J. Hemolysis of red
blood cells during processing and storage. Transfusion. Mar 2012;52(3):489-492.