pcr cleanup on low level presentation of...
TRANSCRIPT

TechnologyTransition Workshop
Using Post‐PCR Cleanup on Low Level Samples: Presentation of Results
Technology Transition Workshop| Robert O’Brien

TechnologyTransition Workshop
MinElute® Study Part 1
• The first part of this study was conducted before the NDIS ruling on what constituted a LCN sample
• Samples that had previously shown stochastic effects where used during the first part of the study to see the effect MinElute® would have on them
• After the ruling was released, the second part of the study was conducted using a concentration of DNA that had previously not shown any stochastic effects
MinElute® Post‐PCR Cleanup Workshop 2Using Post‐PCR Cleanup on Low Level Samples: Presentation of Results

TechnologyTransition Workshop
MinElute® Manual ProcedureReagents• Buffer PB, Buffer PE, Buffer EB (included in kit)
• Ethanol – 96 to 100% (provided by lab)
Supplies• MinElute® spin columns (included in kit)
• 2.0 ml sterile microcentrifuge collection tubes (included in kit)
• 1.5 ml sterile microcentrifuge tubes (provided by lab)
• Microcentrifuge (provided by lab)
• Pipettes – 10 µl, 200 µl and 1000 µl (provided by lab)
Facilities• All work with the MinElute® PCR Purification Kit must be
performed in the dedicated amplification room
MinElute® Post‐PCR Cleanup Workshop 3Using Post‐PCR Cleanup on Low Level Samples: Presentation of Results

TechnologyTransition Workshop
MinElute® Manual Procedure
1. To amplified product, add a volume of Buffer PB that is equal to five times the volume of the amplified product and mix up and down with pipette. − Note: Depending on the volume of amplified product this can
either be added in the amplification tube or it may have to be done in a new sterile microcentrifuge tube.
2. Remove entire volume of Buffer PB and amplified DNA and place in spin column.
3. Spin for one minute at 13,000 rpm. − Note: This is the DNA binding step. The DNA is being bound to the
membrane in the spin column.
MinElute® Post‐PCR Cleanup Workshop 4Using Post‐PCR Cleanup on Low Level Samples: Presentation of Results
TechnologyTransition Workshop
MinElute® Manual Procedure
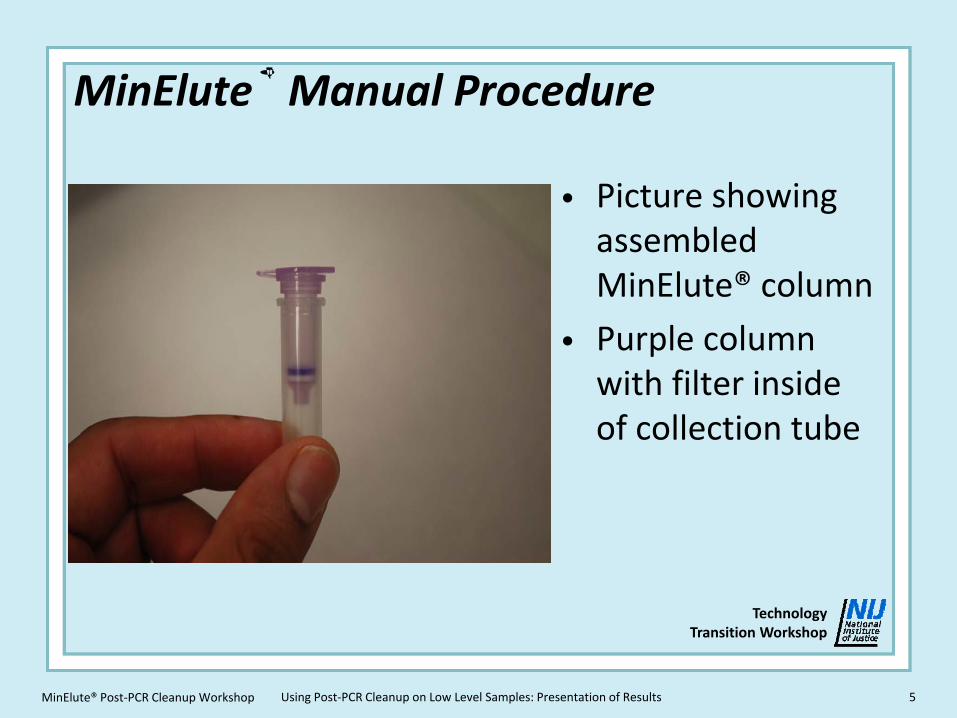
• Picture showing assembled MinElute® column
• Purple column with filter inside of collection tube
MinElute® Post‐PCR Cleanup Workshop 5Using Post‐PCR Cleanup on Low Level Samples: Presentation of Results
TechnologyTransition Workshop
MinElute® Manual Procedure
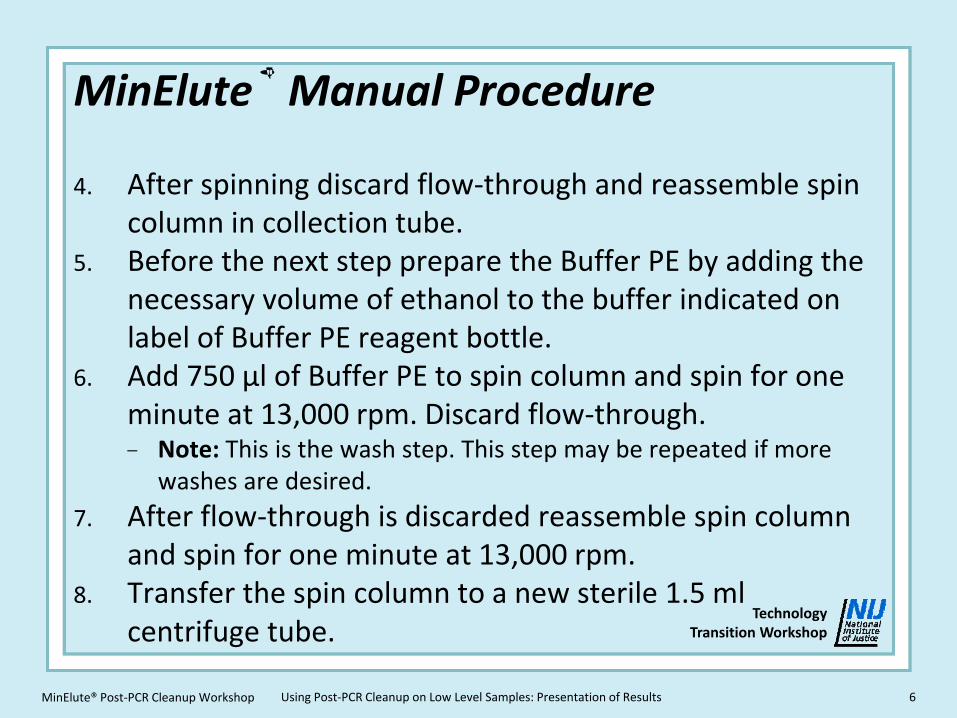
4. After spinning discard flow‐through and reassemble spin column in collection tube.
5. Before the next step prepare the Buffer PE by adding the necessary volume of ethanol to the buffer indicated on label of Buffer PE reagent bottle.
6. Add 750 µl of Buffer PE to spin column and spin for one minute at 13,000 rpm. Discard flow‐through. − Note: This is the wash step. This step may be repeated if more
washes are desired.7. After flow‐through is discarded reassemble spin column
and spin for one minute at 13,000 rpm.8. Transfer the spin column to a new sterile 1.5 ml
centrifuge tube.
MinElute® Post‐PCR Cleanup Workshop 6Using Post‐PCR Cleanup on Low Level Samples: Presentation of Results

TechnologyTransition Workshop
MinElute® Manual Procedure
9. Place 10 µl of Buffer EB directly onto membrane in spin column, being careful not to touch or puncture membrane.
10. Allow Buffer EB to sit on membrane for one minute, then centrifuge for one minute at 13,000 rpm.− Note: During this step the DNA is freed from the membrane and
eluted into the sterile 1.5 ml tube.
11. The final elution volume is usually between 8 and 10 µl.
12. Before this sample is placed on the genetic analyzer it must be heated and snap cooled while in formamide.
MinElute® Post‐PCR Cleanup Workshop 7Using Post‐PCR Cleanup on Low Level Samples: Presentation of Results

TechnologyTransition Workshop
Scope of Study
• MinElute® was first tested on all commercially available amplification kits to determine first if it would work on all kits and if the effects would be similar
• The number of washes done for this study was four, which was the number of washes recommended in a user developed protocol distributed by the manufacturer
• All of the amplified product was put through the cleanup and all of the resulting product was put onto the 3130xlGenetic Analyzer
MinElute® Post‐PCR Cleanup Workshop 8Using Post‐PCR Cleanup on Low Level Samples: Presentation of Results

TechnologyTransition Workshop
Scope of StudyThen, using one kit and one concentration, certain aspects of the procedure were changed:
• The number of washes performed
• The volume of amplified product put through the cleanup process
• The volume of cleaned up product placed on the 3130xlGenetic Analyzer
• The type of sample was also altered from a single source sample to a mixture sample− The purpose of this was to determine if MinElute® can be a useful
tool to bring up a minor profile in a mixture with a high major whose minor is below the calling threshold
MinElute® Post‐PCR Cleanup Workshop 9Using Post‐PCR Cleanup on Low Level Samples: Presentation of Results

TechnologyTransition Workshop
Results
• Effects of MinElute® on all commercially available amplification kits
MinElute® Post‐PCR Cleanup Workshop 10Using Post‐PCR Cleanup on Low Level Samples: Presentation of Results

TechnologyTransition Workshop
Fold Increase
Conclusions:• After post‐PCR cleanup there was a signal increase from an
original peak height of 50 RFUs to a minimum of 300 RFUs in every kit tested
• The fold increase did vary from one kit to the next and also changed with different starting concentrations
• However, in general there was always an increase, with the minimum being 6‐fold
MinElute® Post‐PCR Cleanup Workshop 11Using Post‐PCR Cleanup on Low Level Samples: Presentation of Results

TechnologyTransition Workshop
Fold Increase
MinElute® Post‐PCR Cleanup Workshop Using Post‐PCR Cleanup on Low Level Samples: Presentation of Results 12

TechnologyTransition Workshop
Fold Increase
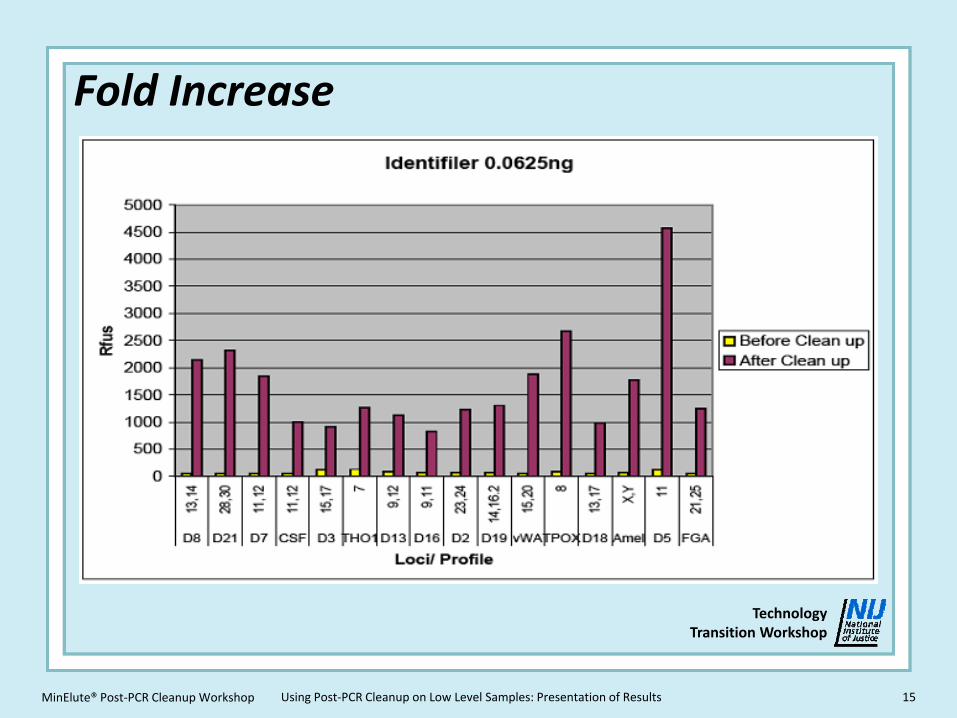
• As seen in the graph on the previous slide, the smallest average fold increase occurred in the Identifiler® Kit– This was a 10‐fold increase
– Cofiler® had the largest average fold increase at a concentration of 0.031 ng/µl
• Kits that were more sensitive were tested at a lower concentration of 0.015 ng/µl– At that concentration, Y filer® showed the greatest average fold
increase of over 20 times
• The concentrations were chosen because all of the peaks were below 75 RFUs in previous testing at these concentrations
MinElute® Post‐PCR Cleanup Workshop 13Using Post‐PCR Cleanup on Low Level Samples: Presentation of Results

TechnologyTransition Workshop
Fold Increase
• Focus was then placed on the two large multiplexes that are commonly used in DNA forensic laboratories– Identifiler
– PowerPlex® 16
• The graphs on the next two slides show the average fold increase at a concentration of 0.0625 ng/µl at each individual locus in the multiplexes
MinElute® Post‐PCR Cleanup Workshop 14Using Post‐PCR Cleanup on Low Level Samples: Presentation of Results
TechnologyTransition Workshop
Fold Increase
MinElute® Post‐PCR Cleanup Workshop 15Using Post‐PCR Cleanup on Low Level Samples: Presentation of Results

TechnologyTransition Workshop
Fold Increase
MinElute® Post‐PCR Cleanup Workshop 16Using Post‐PCR Cleanup on Low Level Samples: Presentation of Results

TechnologyTransition Workshop
Fold Increase
• Even though on average the fold increases are high, there is some variation within the multiplexes from one locus to the next
• All samples were analyzed in triplicate
• The results were averaged together to yield these results
MinElute® Post‐PCR Cleanup Workshop 17Using Post‐PCR Cleanup on Low Level Samples: Presentation of Results

TechnologyTransition Workshop
Quality of the Sample
• Once it was established that there was a fold increase in all amplification kits tested, the next stage was to look at the quality of the resulting samples
• The following artifacts were looked at:– ‐A
– Dye blobs
– High stutter
– Drop out
– Drop in
– Heterozygosity
MinElute® Post‐PCR Cleanup Workshop 18Using Post‐PCR Cleanup on Low Level Samples: Presentation of Results

TechnologyTransition Workshop
Quality of the Sample
• Minus A (‐A)– If ‐A was not present before cleanup then it was not present after
– If ‐A was present before clean up then it increased and became more defined after cleanup
MinElute® Post‐PCR Cleanup Workshop 19Using Post‐PCR Cleanup on Low Level Samples: Presentation of Results

TechnologyTransition Workshop
Quality of the Sample
MinElute® Post‐PCR Cleanup Workshop 20Using Post‐PCR Cleanup on Low Level Samples: Presentation of Results

TechnologyTransition Workshop
Quality of the Sample
• Minus A (‐A)– The previous slide shows there is ‐A present, however it is not distinguished enough from the main peak to be recognized by the GeneMapper® ID program and labeled
– ‐A is at 38% of the main peak
MinElute® Post‐PCR Cleanup Workshop 21Using Post‐PCR Cleanup on Low Level Samples: Presentation of Results

TechnologyTransition Workshop
Quality of the Sample
MinElute® Post‐PCR Cleanup Workshop 22Using Post‐PCR Cleanup on Low Level Samples: Presentation of Results

TechnologyTransition Workshop
Quality of the Sample
• Minus A (‐A)– The ‐A is now at a higher level and is more distinguished from the main peak
– The ‐A is now recognized by the Genemapper® ID program and is labeled
– The ‐A is now at 50% of the main peak
MinElute® Post‐PCR Cleanup Workshop 23Using Post‐PCR Cleanup on Low Level Samples: Presentation of Results

TechnologyTransition Workshop
Quality of the Sample
• Minus A (‐A)– The results are not surprising since MinElute® is supposed to cleanup the sample, increase peak height and produce better quality data
– ‐A is a by‐product of the amplification process so to reduce or remove ‐A, a process would have to be put in place during amplification not after it
MinElute® Post‐PCR Cleanup Workshop 24Using Post‐PCR Cleanup on Low Level Samples: Presentation of Results
TechnologyTransition Workshop
Quality of the Sample
• Dye Blobs– Dye blobs are artifacts that are common to most kits and are often documented by the manufacturer
– The example of the dye blob shown in the next two slides was from the PowerPlex® 16 kit at the D5S818 locus
MinElute® Post‐PCR Cleanup Workshop 25Using Post‐PCR Cleanup on Low Level Samples: Presentation of Results

TechnologyTransition Workshop
Quality of the Sample
MinElute® Post‐PCR Cleanup Workshop 26Using Post‐PCR Cleanup on Low Level Samples: Presentation of Results

TechnologyTransition Workshop
Quality of the Sample
MinElute® Post‐PCR Cleanup Workshop 27Using Post‐PCR Cleanup on Low Level Samples: Presentation of Results

TechnologyTransition Workshop
Quality of the Sample
• Dye Blobs– Even though the dye blob did increase in size, it did not increase in proportion to the main peak
– In other instances, the dye blobs decreased in size and some were even completely removed after cleanup
– Since dye blobs are from excess dyes in the kits, it would be reasonable to assume that the MinElute® kit would help remove or reduce them in some way because the kit is designed to remove excess primers and dyes
MinElute® Post‐PCR Cleanup Workshop 28Using Post‐PCR Cleanup on Low Level Samples: Presentation of Results

TechnologyTransition Workshop
Quality of the Sample
• High Stutter– Sometimes high stutter is seen in data
– Even though high stutter is a sign of a possible mixture, by itself without any other supporting features, it is just simply high stutter
– Stutter is a by‐product of the amplification process
MinElute® Post‐PCR Cleanup Workshop 29Using Post‐PCR Cleanup on Low Level Samples: Presentation of Results

TechnologyTransition Workshop
Quality of the Sample
MinElute® Post‐PCR Cleanup Workshop 30Using Post‐PCR Cleanup on Low Level Samples: Presentation of Results

TechnologyTransition Workshop
Quality of the Sample
• High Stutter– Before cleanup the stutter at the D16S539 locus was above the stutter cut‐off percentage and was assigned an allele call
– The stutter % was 14.4%
MinElute® Post‐PCR Cleanup Workshop 31Using Post‐PCR Cleanup on Low Level Samples: Presentation of Results

TechnologyTransition Workshop
Quality of the Sample
MinElute® Post‐PCR Cleanup Workshop 32Using Post‐PCR Cleanup on Low Level Samples: Presentation of Results

TechnologyTransition Workshop
Quality of the Sample
• High Stutter– After cleanup the high stutter was still present and was still assigned an allele call by the GeneMapper® ID program
– The stutter % following cleanup was 13.6%, which is a little lower than the original percentage of 14.4
– However, the increase was not significant enough to say that MinElute® cleanup will reduce stutter
– In general there was no significant change in stutter from before to after cleanup
MinElute® Post‐PCR Cleanup Workshop 33Using Post‐PCR Cleanup on Low Level Samples: Presentation of Results

TechnologyTransition Workshop
Quality of the Sample
• Drop Out– Drop out is a common stochastic effect that occurs when amplifying low level samples
– Alleles which are present in the sample are not amplified during the PCR process and, therefore, are not seen in the final data
MinElute® Post‐PCR Cleanup Workshop 34Using Post‐PCR Cleanup on Low Level Samples: Presentation of Results

TechnologyTransition Workshop
Quality of the Sample
MinElute® Post‐PCR Cleanup Workshop 35Using Post‐PCR Cleanup on Low Level Samples: Presentation of Results

TechnologyTransition Workshop
Quality of the Sample
• Drop Out– The previous slide shows drop out of an allele at DYS19 before the sample went through the MinElute® cleanup
MinElute® Post‐PCR Cleanup Workshop 36Using Post‐PCR Cleanup on Low Level Samples: Presentation of Results

TechnologyTransition Workshop
Quality of the Sample
MinElute® Post‐PCR Cleanup Workshop 37Using Post‐PCR Cleanup on Low Level Samples: Presentation of Results

TechnologyTransition Workshop
Quality of the Sample
• Drop Out– After cleanup there is still drop out of the allele at the DYS19 locus even though the peak at DYS437 did increase in peak height
– Drop out is a by‐product of low level amplification so any attempts to fix it would have to be conducted at the amplification step, not after the process is completed
– Therefore, it is not surprising that MinElute® would not affect drop out
– MinElute® does not cause or prevent drop out. If drop out was present prior to cleanup, it will be present after
MinElute® Post‐PCR Cleanup Workshop 38Using Post‐PCR Cleanup on Low Level Samples: Presentation of Results

TechnologyTransition Workshop
Quality of the Sample
• Drop In– Drop in is another by‐product of low level amplification where random peaks not associated with the data are seen
– With MinElute® this phenomenon appeared to have occurred but it turned out not to be drop in
MinElute® Post‐PCR Cleanup Workshop 39Using Post‐PCR Cleanup on Low Level Samples: Presentation of Results

TechnologyTransition Workshop
Quality of the Sample
MinElute® Post‐PCR Cleanup Workshop 40Using Post‐PCR Cleanup on Low Level Samples: Presentation of Results

TechnologyTransition Workshop
Quality of the Sample
• Drop In– The 15 and 17 peaks present in the previous slide were not discernable from the baseline before the cleanup process
– So, at first those peaks appeared to be drop in
– The next slide shows a close up of the data before the cleanup process
MinElute® Post‐PCR Cleanup Workshop 41Using Post‐PCR Cleanup on Low Level Samples: Presentation of Results

TechnologyTransition Workshop
Quality of the Sample
MinElute® Post‐PCR Cleanup Workshop 42Using Post‐PCR Cleanup on Low Level Samples: Presentation of Results

TechnologyTransition Workshop
Quality of the Sample
• Drop In– As seen in the previous slide, the 15 and 17 peaks are clearly not discernable from the baseline thus reinforcing that drop in has occurred
– However, the correct profile at the D3S1358 locus for this sample is a 15, 17
– Therefore this is not a random drop in
– In fact, every time that “drop in” was observed it corresponded to the correct profile at the locus
MinElute® Post‐PCR Cleanup Workshop 43Using Post‐PCR Cleanup on Low Level Samples: Presentation of Results

TechnologyTransition Workshop
Quality of the Sample
• Drop In– Since the RFU increase ranged from 10 to 30 fold, it is reasonable to believe that the DNA present in the original sample was just so low that it could not be discerned from the baseline
– These results demonstrate that MinElute® a very good tool for detecting low level samples or contamination that was not previously visible
– In short, MinElute® will bring all things to light, even those things you don’t want to see
MinElute® Post‐PCR Cleanup Workshop 44Using Post‐PCR Cleanup on Low Level Samples: Presentation of Results

TechnologyTransition Workshop
Quality of the Sample
• Heterozygote Peak Height Ratios– Differences in peak height ratio were not only seen before and after cleanup, but were also seen within the triplicate set of samples as shown on the next slide
MinElute® Post‐PCR Cleanup Workshop 45Using Post‐PCR Cleanup on Low Level Samples: Presentation of Results

TechnologyTransition Workshop
Quality of the Sample
• Peak height ratio (PHR) fluctuations within the triplicate sample set
• This could be due to injecting the sample into the 3130xl
MinElute® Post‐PCR Cleanup Workshop 46Using Post‐PCR Cleanup on Low Level Samples: Presentation of Results

TechnologyTransition Workshop
Quality of the Sample• After cleanup the samples showed differences in the peak height ratios within the triplicate, as well as differences between, before and after clean up
MinElute® Post‐PCR Cleanup Workshop 47Using Post‐PCR Cleanup on Low Level Samples: Presentation of Results

TechnologyTransition Workshop
MinElute® StudyPart 1 ‐ Summary• MinElute® successfully yielded a RFU increase in all samples tested
• This increase brings data to a level that crosses most if not all laboratories’ thresholds
• Any stochastic effects caused by low level amplification were carried through in the MinElute® kit– The stochastic effects were more clearly seen because
the peak heights were higher after cleanup and no longer hidden in the baseline
MinElute® Post‐PCR Cleanup Workshop 48Using Post‐PCR Cleanup on Low Level Samples: Presentation of Results

TechnologyTransition Workshop
MinElute® Study Part 2
• Once it was established that MinElute® did give an increase in peak heights in all commercially available amplification kits, the decision was made to explore the method itself and to change certain components of the method to see the affect on the increase in peak height
• Only the Identifiler® Kit was used for the rest of the study
• The concentration used for the second part of the study was 0.125 ng/µl
• Even though this is below the official recommended amount of 0.2 ng/µl, no stochastic effects were previously observed at this concentration
MinElute® Post‐PCR Cleanup Workshop 49Using Post‐PCR Cleanup on Low Level Samples: Presentation of Results

TechnologyTransition Workshop
MinElute® Study Part 2
• The following parameters were studied:− Number of washes− Robotic versus manual− Volume of cleaned up product added to the 3130xl
Genetic Analyzer− Volume of amplified product put through the cleanup
process− The effect of MinElute® on mixtures with defined major
and minor contributors
• All experiments were conducted in triplicate
MinElute® Post‐PCR Cleanup Workshop 50Using Post‐PCR Cleanup on Low Level Samples: Presentation of Results
TechnologyTransition Workshop
Volume of Sample
• During the poster session at the America Academy of Forensic Sciences meeting, attendees inquired why there was no data to show the effects of adding all of the amplified product to the 3130xlGenetic Analyzer without putting it through the cleanup process
• The next few slides show the results of doing precisely that
MinElute® Post‐PCR Cleanup Workshop 51Using Post‐PCR Cleanup on Low Level Samples: Presentation of Results
TechnologyTransition Workshop
Volume of Sample
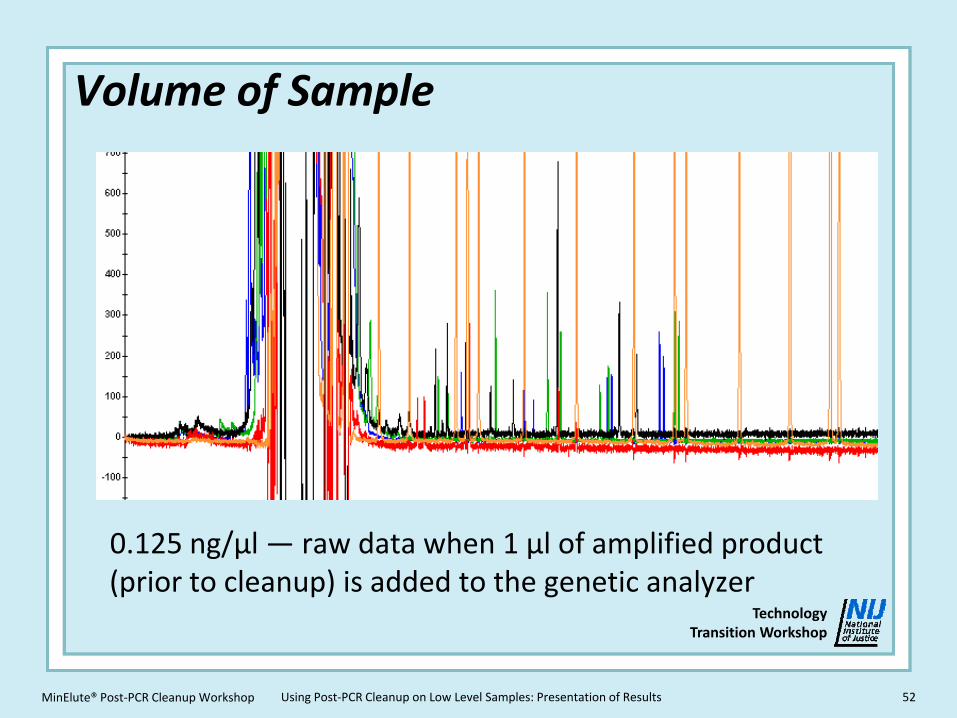
0.125 ng/µl — raw data when 1 µl of amplified product (prior to cleanup) is added to the genetic analyzer
MinElute® Post‐PCR Cleanup Workshop 52Using Post‐PCR Cleanup on Low Level Samples: Presentation of Results
TechnologyTransition Workshop
Volume of Sample
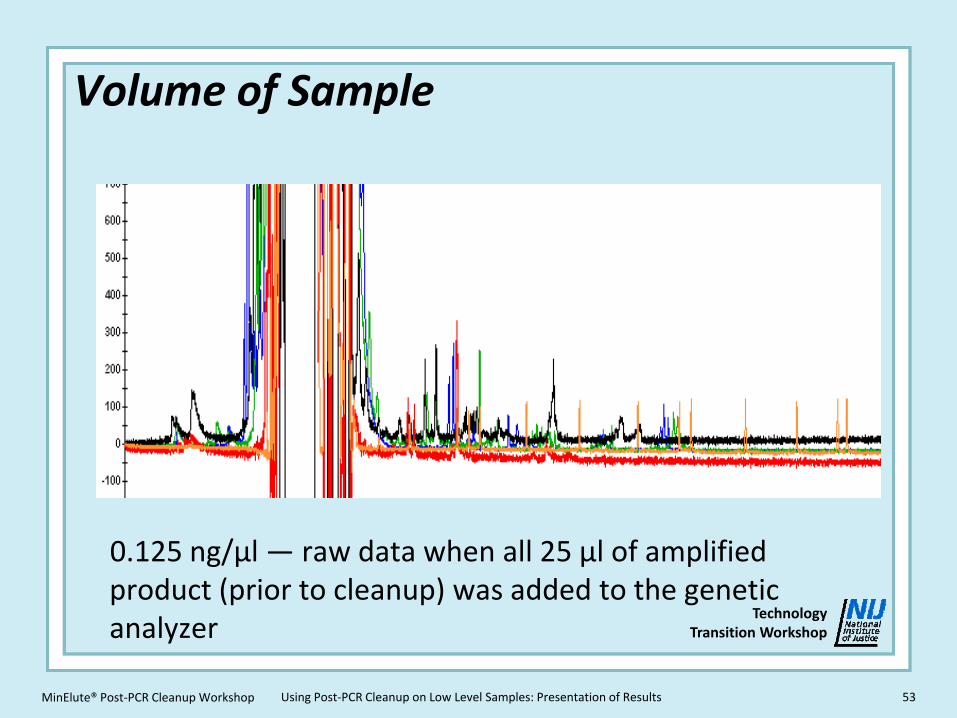
0.125 ng/µl — raw data when all 25 µl of amplified product (prior to cleanup) was added to the genetic analyzer
MinElute® Post‐PCR Cleanup Workshop 53Using Post‐PCR Cleanup on Low Level Samples: Presentation of Results

TechnologyTransition Workshop
Volume of Sample
• By adding all of the amplified product to the genetic analyzer without using MinElute® there was a negative effect on the resulting data
• Before cleanup, DNA was clearly in the sample in the raw data
• However, after adding all of the amplified product to the genetic analyzer, all of the data was suppressed as well as the sizing standard
• This could be due to the excess primers and dyes interfering with the laser’s ability to excite the dyes attached to amplified pieces of DNA
MinElute® Post‐PCR Cleanup Workshop 54Using Post‐PCR Cleanup on Low Level Samples: Presentation of Results

TechnologyTransition Workshop
Number of Washes
• Varying Number of Washes—The number of washes were varied to determine what would be the most efficient way to perform the procedure manually to save on time and reagents
—The number of washes were varied from one to four
—In all cases all of the amplified product, whether cleaned up or not, was added to the genetic analyzer
—The results are charted in the following slide
—In all cases there was an increase in peak heights, however, the peak heights did change with the number of washes performed
MinElute® Post‐PCR Cleanup Workshop 55Using Post‐PCR Cleanup on Low Level Samples: Presentation of Results

TechnologyTransition Workshop
Number of Washes
MinElute® Post‐PCR Cleanup Workshop 56Using Post‐PCR Cleanup on Low Level Samples: Presentation of Results

TechnologyTransition Workshop
Number of Washes
The average fold increase for manual washes was as follows:
Number of Washes Average Fold Increase
1 9.5
2 16.9
3 17.9
4 14.3
MinElute® Post‐PCR Cleanup Workshop 57Using Post‐PCR Cleanup on Low Level Samples: Presentation of Results

TechnologyTransition Workshop
Number of Washes
• Varying Number of Washes– So, even though there is an increase in the fold increase with the number of washes, there comes a point at which doing more washes no longer results in an increase in peak heights
– Even though three washes gave the highest increase in peak heights, two washes seems to be a more efficient method because:
• The increase for two washes is just a little lower than three washes
• The time and reagent use is less
MinElute® Post‐PCR Cleanup Workshop 58Using Post‐PCR Cleanup on Low Level Samples: Presentation of Results

TechnologyTransition Workshop
Robotic Wash
• QIAGEN® has developed a robot called the QIAcube® to perform the MinElute® PCR Purification process
• No contamination within a run or between runs was seen when using this robot
• The QIAcube® frees up time for the analyst to work on other tasks while the robot is performing the cleanup
• The QIAcube® also allows for more consistent pipetting and eliminates human errors that could arise while working with amplified DNA
MinElute® Post‐PCR Cleanup Workshop 59Using Post‐PCR Cleanup on Low Level Samples: Presentation of Results

TechnologyTransition Workshop
Setting Up the QIAcube®
• QIAcube® robot (shown below) is a fully enclosed system
• All controls are via touch screen on the outside
• Once the system starts no human interaction is required
MinElute® Post‐PCR Cleanup Workshop 60Using Post‐PCR Cleanup on Low Level Samples: Presentation of Results

TechnologyTransition Workshop
QIAcube®
MinElute® Post‐PCR Cleanup Workshop 61Using Post‐PCR Cleanup on Low Level Samples: Presentation of Results

TechnologyTransition Workshop
Setting Up the QIAcube®
• The rotor adapter is then placed in the centrifuge
• The adapters will only fit into the centrifuge in one direction
• The purple spin column is positioned closest to the center of the centrifuge, as shown in the following slide
MinElute® Post‐PCR Cleanup Workshop 62Using Post‐PCR Cleanup on Low Level Samples: Presentation of Results

TechnologyTransition Workshop
QIAcube®
MinElute® Post‐PCR Cleanup Workshop 63Using Post‐PCR Cleanup on Low Level Samples: Presentation of Results

TechnologyTransition Workshop
Setting Up the QIAcube®
• Before starting the QIAcube® the spin column, collection tubes and sample tubes must be placed in the correct positions in the instrument
• The QIAcube® can hold a maximum of 12 samples• Fewer samples can be processed as long as they are
positioned in such a way that they will be balanced in the centrifuge
• Inside the QIAcube® there is a light on the robotic arm that is used to detect the positions of the reagents and tubes in the instrument
• This way the QIAcube® knows whether everything is in the correct place before it begins the program
MinElute® Post‐PCR Cleanup Workshop 64Using Post‐PCR Cleanup on Low Level Samples: Presentation of Results

TechnologyTransition Workshop
Setting Up the QIAcube®• The tubes are placed in the
rotor adapter in the positions shown
• The final collection tube and spin column are placed on opposite ends of the rotor adaptor
• The spin column goes on the side with the single cap holder
• The cap of the collection tube goes into the larger cap holder on the other side
MinElute® Post‐PCR Cleanup Workshop 65Using Post‐PCR Cleanup on Low Level Samples: Presentation of Results

TechnologyTransition Workshop
Setting Up the QIAcube®• A set‐up rack is provided that holds the rotor adapters
while the tubes are being placed in them• The rack is numbered 1 to 12• The positions of the rotor adapters are determined at this
point when processing less than 12 samples
MinElute® Post‐PCR Cleanup Workshop 66Using Post‐PCR Cleanup on Low Level Samples: Presentation of Results

TechnologyTransition Workshop
Setting Up the QIAcube®
MinElute® Post‐PCR Cleanup Workshop 67Using Post‐PCR Cleanup on Low Level Samples: Presentation of Results
TechnologyTransition Workshop
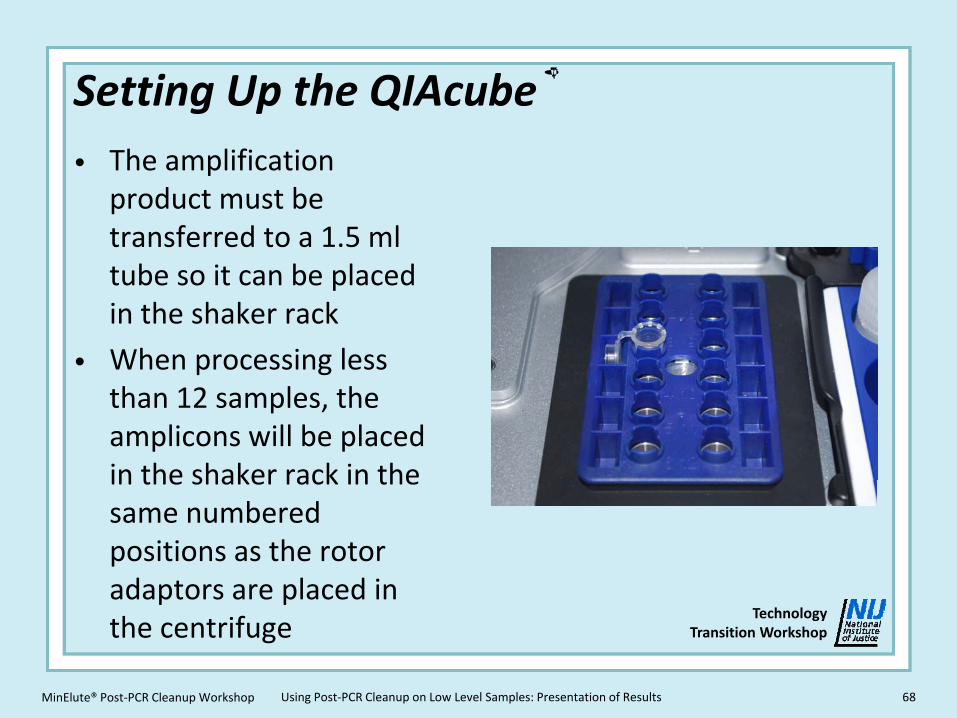
Setting Up the QIAcube®• The amplification
product must be transferred to a 1.5 ml tube so it can be placed in the shaker rack
• When processing less than 12 samples, the amplicons will be placed in the shaker rack in the same numbered positions as the rotor adaptors are placed in the centrifuge
MinElute® Post‐PCR Cleanup Workshop 68Using Post‐PCR Cleanup on Low Level Samples: Presentation of Results

TechnologyTransition Workshop
Setting Up the QIAcube®
As shown, the reagent bottles also have designated areas where they must be placed:
MinElute® Post‐PCR Cleanup Workshop 69Using Post‐PCR Cleanup on Low Level Samples: Presentation of Results

TechnologyTransition Workshop
Setting Up the QIAcube®• Pipette tips are supplied by
QIAGEN® and the racks are placed in pipette tip rack holders on the instrument− 1000 µl tips in the back
− 200 µl tips in front
• The QIAcube® uses less than half of each rack to complete 12 samples
• No contamination was detected when the remainder of the rack was used to perform another run
MinElute® Post‐PCR Cleanup Workshop 70Using Post‐PCR Cleanup on Low Level Samples: Presentation of Results
TechnologyTransition Workshop
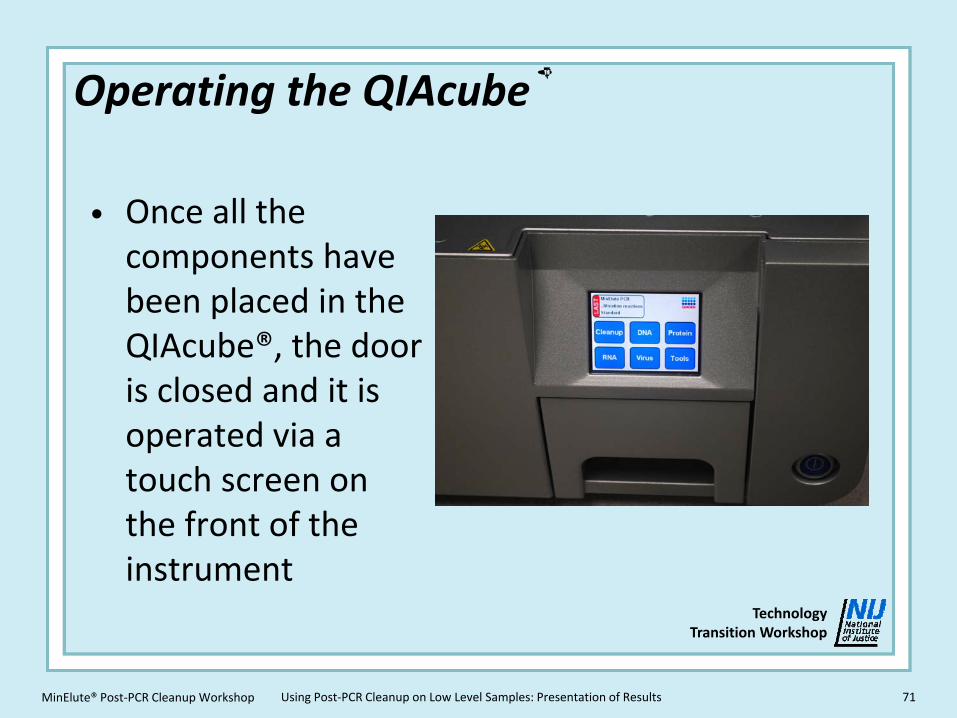
Operating the QIAcube®
• Once all the components have been placed in the QIAcube®, the door is closed and it is operated via a touch screen on the front of the instrument
MinElute® Post‐PCR Cleanup Workshop 71Using Post‐PCR Cleanup on Low Level Samples: Presentation of Results
TechnologyTransition Workshop
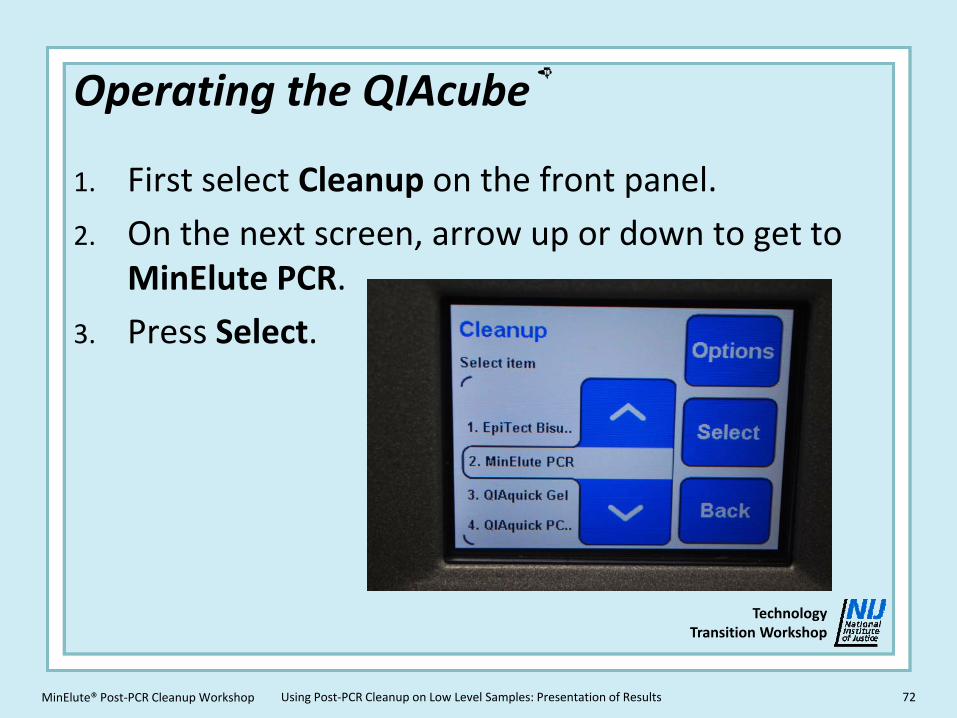
Operating the QIAcube®
1. First select Cleanup on the front panel.
2. On the next screen, arrow up or down to get to MinElute PCR.
3. Press Select.
MinElute® Post‐PCR Cleanup Workshop 72Using Post‐PCR Cleanup on Low Level Samples: Presentation of Results

TechnologyTransition Workshop
Operating the QIAcube®
4. Select Amplification Reactions.
MinElute® Post‐PCR Cleanup Workshop 73Using Post‐PCR Cleanup on Low Level Samples: Presentation of Results

TechnologyTransition Workshop
Operating the QIAcube®
5. On the next screen select Standard.
6. This takes you to the Fill‐up Volume screen, where you press Select.– Your total fill‐up volume must be 100 µl
– Depending on the volume of amplified product in the tube the fill‐up volume may need to be adjusted
– The fill up volume refers to how much buffer is added to bring up the volume to 100 µl
7. To adjust the fill‐up volume go to Options and use the + or – key to set the fill‐up volume.
8. Press Save.
MinElute® Post‐PCR Cleanup Workshop 74Using Post‐PCR Cleanup on Low Level Samples: Presentation of Results

TechnologyTransition Workshop
Operating the QIAcube®
MinElute® Post‐PCR Cleanup Workshop 75Using Post‐PCR Cleanup on Low Level Samples: Presentation of Results

TechnologyTransition Workshop
Operating the QIAcube®
9. On the last screen displayed, click Start.− The instrument will display questions on panel verifying everything was set up correctly
MinElute® Post‐PCR Cleanup Workshop 76Using Post‐PCR Cleanup on Low Level Samples: Presentation of Results

TechnologyTransition Workshop
Results From QIAcube®
MinElute® Post‐PCR Cleanup Workshop 77Using Post‐PCR Cleanup on Low Level Samples: Presentation of Results

TechnologyTransition Workshop
Results From QIAcube®
• QIAcube® only performs one buffer wash
• The chart on the previous slide shows that performing MinElute® cleanup with the QIAcube® gives better results than a comparable, single manual wash
• The chart also shows that the robotic process does not work as well as conducting the manual method with two washes
• When performing the robotic cleanup process on the triplicate 0.0625 ng/µl concentration samples, the fold increases varied for the manual washes but the QIAcube® results were very close
MinElute® Post‐PCR Cleanup Workshop 78Using Post‐PCR Cleanup on Low Level Samples: Presentation of Results

TechnologyTransition Workshop
Results From QIAcube®
Washes [0.125 ng/µl]Fold Increase
[0.0625 ng/µl]Fold Increase
Manual ‐ One wash 9.56 7.36
Manual ‐ Two washes 16.96 11.52
QIAcube® 10.44 9.76
• The QIAcube® gave the most consistent increase between concentrations of amplified DNA
• This could be due to the increased precision associated with robotic pipetting as opposed to manual
MinElute® Post‐PCR Cleanup Workshop 79Using Post‐PCR Cleanup on Low Level Samples: Presentation of Results

TechnologyTransition Workshop
Results From QIAcube®
• Because some laboratories retain some of their amplified product, in this next stage of the study either:– Not all of the amplified product was put through the cleanup
process
– Not all of it was added to the 3130xl Genetic Analyzer
• The purpose was to see what type of peak height increase would be achieved if product was leftover for possible future testing
• The cleanup for this part of the study was conducted on the QIAcube® and a concentration of 0.125 ng/µl was used for all experiments
MinElute® Post‐PCR Cleanup Workshop 80Using Post‐PCR Cleanup on Low Level Samples: Presentation of Results

TechnologyTransition Workshop
Results From QIAcube®
• The results of adding different volumes of cleaned up product to the 3130xl are shown below– The QIAcube® elutes approximately 15 µl of product
Volume of Cleaned Up Product Added to 3130xl
Average Fold Increase
1 µl 4.28
5 µl 8.44
10 µl 7.86
MinElute® Post‐PCR Cleanup Workshop 81Using Post‐PCR Cleanup on Low Level Samples: Presentation of Results

TechnologyTransition Workshop
Results From QIAcube®
Cleaning up some of the amplified product had the most drastic effect on the average fold increase of peaks:
Volume of Amplified Product Put Through Cleanup Process
Average Fold Increase
5 µl 1.43
10 µl 2.56
MinElute® Post‐PCR Cleanup Workshop 82Using Post‐PCR Cleanup on Low Level Samples: Presentation of Results

TechnologyTransition Workshop
Results From QIAcube®
• When only 5 µl of amplified product was put through the cleanup process, at some loci there was not an increase in peak heights
• In fact, the average peak height went down at those loci
• The heterozygote peak height ratios did change from before cleanup to after cleanup
• After cleanup the ratios were more consistent within the triplicate than before
MinElute® Post‐PCR Cleanup Workshop 83Using Post‐PCR Cleanup on Low Level Samples: Presentation of Results

TechnologyTransition Workshop
Peak Height Ratios Before and After Cleanup of 5µl of Amplified Product
Locus % Peak Height Ratio
Set 1Pre Q
Set 2Pre Q
Set3Pre Q
Set1Post Q
Set 2Post Q
Set 3Post Q
D8 75 74 97 75 76 75
D21 75 74 97 75 76 75
D7 83 58 51 83 80 83
CSF 61 61 87 58 60 60
D3 83 77 63 82 81 80
TH01 Not applicable – homozygous at this locus
D13 76 56 69 78 78 78
D16 97 75 61 98 96 94
MinElute® Post‐PCR Cleanup Workshop 84Using Post‐PCR Cleanup on Low Level Samples: Presentation of Results

TechnologyTransition Workshop
Peak Height Ratios Before and After Cleanup of 5µl of Amplified Product
Locus % Peak Height Ratio
Set 1Pre Q
Set 2Pre Q
Set3Pre Q
Set1Post Q
Set 2Post Q
Set 3Post Q
D2 82 82 45 90 94 93
D19 92 68 54 85 87 87
vWA 67 76 64 69 64 64
TPOX Not applicable – homozygous at this locus
D18 79 91 73 88 82 82
Amel 49 96 75 49 45 45
D5 Not applicable – homozygous at this locus
FGA 94 98 76 95 96 100
MinElute® Post‐PCR Cleanup Workshop 85Using Post‐PCR Cleanup on Low Level Samples: Presentation of Results

TechnologyTransition Workshop
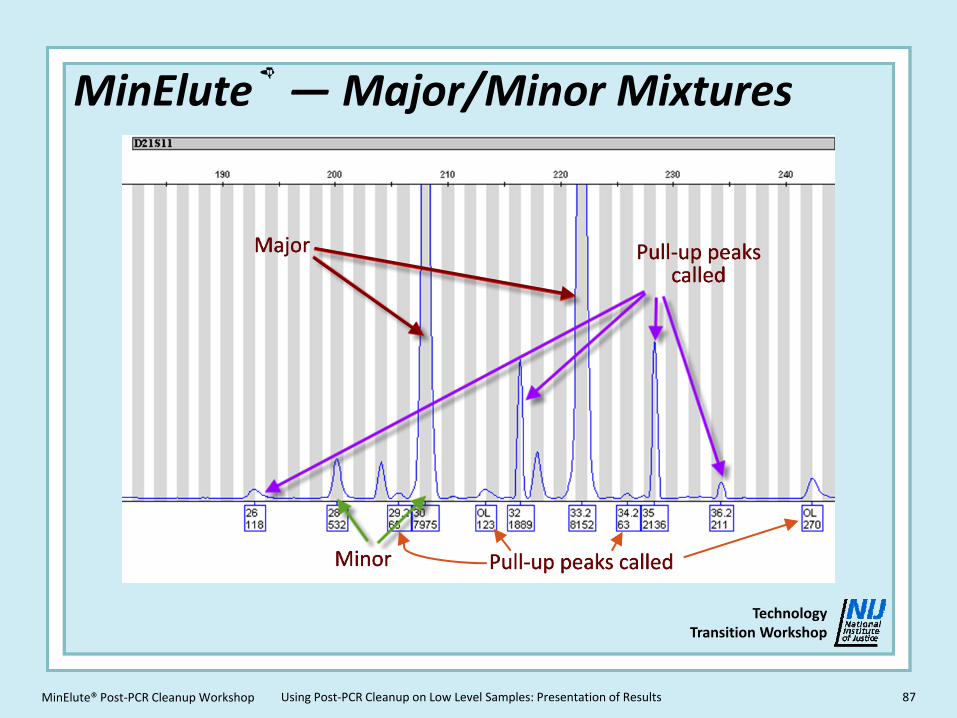
MinElute® —Major/Minor Mixtures• Two mixture ratios were run through the cleanup process
on the QIAcube®− The ratios of minor to major were 1:15 and 1:20− In both cases, all of the amplified product was cleaned up− All of the resulting cleaned up product was added to the genetic
analyzer− The minor peak heights increased, so peaks that were previously
not called now were− The major peak heights also increased, so much so that the major
peaks were now all off‐scale− This introduced a lot of pull‐up into the sample− In some cases, the pull‐up was as high, or higher than, the minor
contributor peaks− This made it difficult to discern the minor peaks from the pull‐up
peaks
MinElute® Post‐PCR Cleanup Workshop 86Using Post‐PCR Cleanup on Low Level Samples: Presentation of Results
TechnologyTransition Workshop
MinElute® —Major/Minor Mixtures
MinElute® Post‐PCR Cleanup Workshop 87Using Post‐PCR Cleanup on Low Level Samples: Presentation of Results

TechnologyTransition Workshop
MinElute® —Major/Minor Mixtures
• As shown in the previous slide, the minor is well above calling levels
• However, many other called peaks are introduced into the mixture due to pull‐up from offscale peaks from the major
• These extra peaks can easily cause the analyst to make an incorrect deduction of the profile of the minor
• If the entire mixture is at a low level, MinElute® would be effective
• However, when the major is at normal RFU levels there is a potential to cause offscale data with MinElute®
• This causes subsequent problems that may affect interpretation
MinElute® Post‐PCR Cleanup Workshop 88Using Post‐PCR Cleanup on Low Level Samples: Presentation of Results

TechnologyTransition Workshop
Summary
• The MinElute® system, whether performed manually or with the QIAcube®, increases the peak heights of data
• MinElute® cannot correct problems associated with amplification of low level samples
• However, peaks present prior to cleanup, whether previously visible or in the baseline, will not only become visible they will also be called
• Each laboratory will need to determine the lowest concentration they want to process when using MinElute®
• This value will be determined during their internal validation process
MinElute® Post‐PCR Cleanup Workshop 89Using Post‐PCR Cleanup on Low Level Samples: Presentation of Results

TechnologyTransition Workshop
Summary
• MinElute® is a great tool for data that can be seen but not reported out due to the labs thresholds
• It will also reveal any problems with contamination that may have been hidden before
• Even though there is a larger increase in peak heights with more than one manual wash, the QIAcube® gives more consistent results and allows the analyst to do other tasks during the clean up process
MinElute® Post‐PCR Cleanup Workshop 90Using Post‐PCR Cleanup on Low Level Samples: Presentation of Results

TechnologyTransition Workshop
Questions?
MinElute® Post‐PCR Cleanup Workshop 91Using Post‐PCR Cleanup on Low Level Samples: Presentation of Results
TechnologyTransition Workshop
Contact Information
Robert O’Brien
NFSTC
7881 114th Ave North
Largo, FL 33773
1‐727‐549‐6067 XT108
MinElute® Post‐PCR Cleanup Workshop 92Using Post‐PCR Cleanup on Low Level Samples: Presentation of Results
Note: All images are courtesy of Rob O’Brien.