paypal cross-border consumer research 2015 global snapshot · paypal cross-border consumer research...
TRANSCRIPT

© 2015 PayPal Inc. All rights reserved. Confidential and proprietary.
PayPal Cross-Border Consumer Research 2015 GLOBAL SNAPSHOT PayPal Cross Border contacts: Melissa O’Malley, Astrid Huijssoon, Ritesh Arora
PayPal Market Research Contact: Daniel Jenkinson
Ipsos Contacts: Eleanor Pettit & Peter Attwell
© 2015 PayPal Inc. All rights reserved. Confidential and proprietary.
Background & Objectives
Understanding that we are going through a commerce revolution, PayPal
in partnership with Ipsos, conducted a global 29 market survey with
approximately 23,000 consumers to examine how people shop online
and across borders.
Advancement of technology is helping to open up commerce
opportunities for everyone - across borders, anywhere, anytime and via
any device.
This survey is designed to gain insight into 3 main areas:
• How online commerce, and specifically cross-border commerce is evolving
• How and why consumers shop online across borders
• How consumers pay for cross-border transactions

© 2015 PayPal Inc. All rights reserved. Confidential and proprietary.
Research Methodology This study was conducted across 29 markets and approx. 23,000 consumers globally.
3
Screening
Transaction & Spend:
Past 12 Months &
Next 12 Months
Cross-Border
transactions &
spend
Cross-Border
Payment
Online
survey
Global Fieldwork
conducted Sept-Oct
2015
20 minute
questionnaire
Respondents
recruited from
online panels
Own and/or use an Internet-enabled device*
Nationally representative of online population Aged 18+
Fieldwork Sample, per market
Questionnaire
This research was
carried out to
the international
quality standard
for market
research, ISO
20252:2012
Data weighted to adjust for
known population incidence
29 markets
Sample of c.800 per market.
Drivers, barriers and
attitudes to cross-
border shopping
*Desktop computer/Laptop/ notebook computer/Tablet /Smartphone/Some other type of mobile phone/Electronic
organizer / PDA with wireless voice and data features/Games console with Internet connectivity (e.g. Wii) /Smart TV

© 2015 PayPal Inc. All rights reserved. Confidential and proprietary.
GLOBAL SNAPSHOT
4

© 2015 PayPal Inc. All rights reserved. Confidential and proprietary.
0
10
20
30
40
50
60
70
80
90
100
0
100
200
300
400
500
600
CNAUSGSKJPINEYSANIARMXBRUATRILRUPLSEATCHNLESITFRDEIREUKCAUS
Online and x-border commerce size and growth estimates US and China are biggest markets in terms of online spend, but India is growing fast
5
North America Western Europe Middle East Latin America Asia Pacific Africa Eastern Europe
Online commerce size (US$BN) / Growth (CAGR 2014-2017)
Total domestic spend 2015 ($US bn)
Compound annual growth rate: total e-commerce (CAGR) US$BN CAGR
Total x-border online spend 2015 ($US bn)
Compound annual growth rate: mobile commerce (CAGR)

© 2015 PayPal Inc. All rights reserved. Confidential and proprietary.
Incidence of online cross-border shopping
Shopping across-borders is most prevalent in Ireland, Austria and Israel
6
78
33
64
14
69 61
49 43
63
35
15
51
67
38
21
65
45 51
33
55
30
59 56 62
88
73
30 35
65
20
60
33
79
28 35
47 50
32
58
78
46
29
54
71
32
45
45
60
40
64
37 36
36
11
23
60 59
32
2 7 3 7 3 3 5 6 5 8 7 4 4 8 9 3 10 4 7 5 6 5 8 2 1 4 9 6 4
US CA UK IRE DE FR IT ES NL CH AT SE PL RU IL TR UA BR MX AR NI SA EY IN JP SK SIN AU CN
North America Western Europe Middle East Latin America Asia Pacific Africa Eastern Europe
% Shop domestically only % Shop domestic and x-border % Shop x-border only
Self-stated domestic and cross border purchasing in past 12 months
Q27. Thinking about shopping online, from which of the following country or geographies’ websites have you
purchased in the past 12 months? Please include your home country if applicable.Base: Online shoppers (size shown
in appendix)
-8
-7
-6
n/a
-9
-11
-12
-6
-7
-5
+2
-8
-3
+4
-3
-2
-5
-1
+5
n/a
n/a
n/a
n/a
n/a
n/a
n/a
n/a
-11
+9
Ppt. change
in x-border incidence
Vs.2014*
*where data available

© 2015 PayPal Inc. All rights reserved. Confidential and proprietary.
Growth is expected in cross-border spending in all markets surveyed
Largest growth is expected in Nigeria and India
7
10 7
11
16 16 15
20
28
11 12
7
13
21
14 15
35
31 30
41 39
85
42
56
79
31
45
16
2
31
0
10
20
30
40
50
60
70
80
90
US CA UK IRE DE FR IT ES NL CH AT SE PL RU IL TR UA BR MX AR NI SA EY IN JP SK SIN AU CN
North America Western Europe Middle East Latin America Asia Pacific Africa Eastern Europe
*Estimated growth based on future intention of cross-border shoppers, and online shoppers who
have not shopped cross-border (from survey data)
% Estimated growth* in x-border spend for 2016

© 2015 PayPal Inc. All rights reserved. Confidential and proprietary.
The majority of cross border purchases are still made on a computer
But in some less developed markets, a large proportion of cross-border purchases are
made on a mobile device
8
64%
77%
67%
77% 80% 86%
78% 77% 81% 81% 82% 79% 79% 78% 79%
66%
54%
74% 69%
79%
50%
67% 59%
53%
75% 70% 71%
74%
53%
19%
12%
15%
12% 11%
8%
12% 12% 9% 10%
10% 10% 11% 13%
15%
19%
29%
14% 17%
11%
36%
18% 28%
30%
12% 19% 16% 13%
27%
13% 9% 15%
10% 7% 5% 8% 8% 8% 9% 7%
9% 7% 8% 5%
10% 12% 8%
10% 4% 11% 12% 12%
11% 11% 6% 11% 11%
14%
4% 2% 3% 2% 3% 2% 2% 3% 2% 1% 1% 2% 3% 2% 1% 6% 5% 4% 5% 6% 3% 3% 2%
6% 2% 5% 3% 2%
6%
US CA UK IRE DE FR IT ES NL CH AT SE PL RU IL TR UA BR MX AR NI SA EY IN JP SK SIN AU CN
North America Western Europe Middle East Latin America Asia Pacific Africa Eastern Europe
Q33. Thinking only about the purchases you make on websites in other countries, what proportion of your purchases
in the last 12 months do you think were made using each device? Base = Cross border shoppers (size shown in
appendix)
Other device Tablet Smartphone Desktop/laptop/
notebook
Average proportion of x-border purchases in past
12 month made on each device

© 2015 PayPal Inc. All rights reserved. Confidential and proprietary.
China and the US are the most popular cross-border destinations
For Western European shoppers however, shopping within Europe is still more popular
9
25
19
14
11
5
USA
China
UK / GB
Germany
Japan
Top x-border destinations among
all online shoppers surveyed*
Top x-border shopping destinations for consumers
Within each region* (% of online shoppers living in each
region shopping cross-border from
the country mentioned)
USA 30%
CN 21%
UK 16%
USA 29%
CN 15%
UK 7%
USA 38%
CN 26%
JP 9%
DE 23%
UK 21%
USA 19%
USA 26%
CN 14%
UK 9%
USA 30%
CN 30%
UK 12%
North
America
(n = 1057)
Central/South
America (n = 1490)
Western
Europe (n = 5823)
Africa (n = 1411)
Middle East (n = 1695)
Asia Pacific (n = 3651)
*Results are among all consumers surveyed,
not weighted for population size Q27. Thinking about shopping online, from which of the following country or geographies’ websites have you
purchased in the past 12 months? Please include your home country if applicable.Base:
Total online shoppers n= 16,302
Region definition (countries surveyed): Western Europe: UK, IRE, DE, FR, IT, ES, NL, SE,
AT, CH, Central and Eastern Europe: PL, RU; North America: USA, CA; Latin America: MX,
BR, AR; Middle East: TR, IL, UAE; Asia Pacific IN, CN, AU, JP, SK, SG Africa: NG, SA, EG
CN 31%
USA 15%
UK 9%
Eastern
Europe (n = 1176)

© 2015 PayPal Inc. All rights reserved. Confidential and proprietary.
In most regions, clothing and apparel is the most popular category for
cross-border purchases
10
Top x-border categories among
all x-border shoppers surveyed*
Top x-border categories for respondents
Living in each region* (% of x-border shoppers shopping
x-border in each category)
Entertainment/education
online=47%
Clothing = 44%
Consumer electronics =
41%
Clothing=42%
Entertainment/education
(physical) = 30%
Entertainment/education
(digital)=26%
Clothing=48%
Entertainment/education
(digital) =45%
Consumer Electronics=40%
Clothing=48%
Entertainment/education
(physical)=33%
Travel & transportation
=33%
Clothing =53%
Cosmetics/beauty = 34%
Travel & Transportation =32%
Clothing =51%
Travel & Transportation= 35%
ConsumerElectronics=34%
North America
(n = 456)
Central/South
America (n = 803)
Western Europe (n =3124)
Africa (n = 734)
Middle East (n = 956)
Asia Pacific (n = 1469)
*Results are among all consumers surveyed,
not weighted for population size
Clothing=54%
Consumer Electronics=
39%
Toys & Hobbies=34%
Eastern Europe (n = 555)
49
32
31
31
29
26
Clothing, Footwear & Accessories
Consumer Electronics
Entertainment/education (digital/downloadable/online
)
Travel & Transportation
Entertainment/education (physical items)
Toys & Hobbies
Q28. In the past 12 months what kinds of products have you purchased from websites in
other countries? Base: Cross-Border shoppers n = 8097
Region definition (countries surveyed): Western Europe: UK, IRE, DE, FR, IT, ES, NL, SE,
AT, CH, Central and Eastern Europe: PL, RU; North America: USA, CA; Latin America: MX,
BR, AR; Middle East: TR, IL, UAE; Asia Pacific IN, CN, AU, JP, SK, SG Africa: NG, SA, EG

© 2015 PayPal Inc. All rights reserved. Confidential and proprietary.
64
61
58
46
45
41
41
37
Attitudes to cross border shopping vary dramatically between markets
11
US CA UK IRE DE FR IT ES NL CH AT SE PL RU IL TR UA BR MX AR NI SA EY IN JP SK SIN AU CN
I prefer large 'global' stores (e.g.
Amazon) when purchasing from
another country
It does not matter to me where the
items are shipped from, as long as
the total price is good
I would not feel comfortable making
purchases from a foreign website
that is not in my own language
It is not important to me if the
online retailer is based overseas or
not
I am generally comfortable buying
from an online store in another
country
I trust online stores from other
countries as much as stores from
the country I live in
Sometimes it is not clear whether I
am shopping on a domestic or
international online store
I have in the past made purchases
on websites not in my own
language
(% Agree with statement)
Attitudes among all online shoppers surveyed*
*Results are among all consumers surveyed, not weighted for
population size
Attitudes compared between countries
(% Agree with statement)
Q34b/Q47. To what extent do you agree or disagree with each of the following statements?
Base: Online shoppers (size shown in appendix)
I would not feel comfortable making purchases
from a foreign website that is not in my own
language
I prefer large 'global' stores (e.g. Amazon) when
purchasing from another country
It is not important to me if the online
retailer is based overseas or not
I trust online stores from other countries as
much as stores from the country I live in

© 2015 PayPal Inc. All rights reserved. Confidential and proprietary.
Shipping costs, and reassurance about safety of purchasing are key drivers to
cross-border shopping
12
50
47
41
38
37
37
36
35
35
34
Free shipping
Safe way to pay
Can find items which are hard-to-find locally
Free return shipping
Costs shown/payment possible in your local currency
Customer support in my language
Lower overall cost to buy items from another country
Proof of product authenticity
Faster delivery
Website available in my language or translation available
Q39. Which, if any, of the following would make you more likely to buy from a website
from another country? Base: Online shoppers n = 16,302
47
41
39
39
38
37
37
37
36
36
Delivery shipping costs
Concern that I may not receive the item
Having to pay customs duties/fees and /or taxes
May not receive sufficient help if I encounter problems
Delivery time not fast enough
Concern that the item I receive would not be as described
Difficult process for returning products
Concerns about counterfeit goods
Concern about identity theft / fraud
It is not clear how much duties/customs fees/taxes I will have to pay
Q36. Which, if any, of the following reasons prevent you purchasing from websites in
another country (more often)? Base: Online shoppers = 16,302
*Results are among all consumers surveyed, not weighted for population size
Top 10 potential drivers for x-border shopping among all online
shoppers surveyed*
Top 10 barriers for x-border shopping among all online shoppers
surveyed*

© 2015 PayPal Inc. All rights reserved. Confidential and proprietary.
The number of people sending returns cross-border is low in most countries
Freight forwarding is most popular in China, India and UAE
13
18
12 16 15 16
13 15
20
13 12
19
12
19
9
17
23
32
16 16
11
18 19
24
42
14
23
18 16
35
26 25
33
44
22
30 29 30
16
45
27 26 30
38
30
51
66
40
50
37
54
47
57
68
42
57
51
25
78
US CA UK IRE DE FR IT ES NL CH AT SE PL RU IL TR UA BR MX AR NI SA EY IN JP SK SIN AU CN
North America Western Europe Middle East Latin America Asia Pacific Africa Eastern Europe
Incidence of sending returns Incidence of freight forwarding*
Q42. Have you ever done any of the following when buying products online from other countries?
Q40. Which of the following (if any) have happened to you in the Past 12 months? – returned a product to
another country. Base = cross-border shoppers (size shown in appendix)
* Freight forwarding defined as having products delivered to a freight forwarding company (who
receives goods in the country of purchases then ships them to you) or having products delivered
to a friend’s/family member’s/hotel’s address in the country of purchase

© 2015 PayPal Inc. All rights reserved. Confidential and proprietary.
73
62
45
45
44
33
29
Attitudes to currency conversion
14
US CA UK IRE DE FR IT ES NL CH AT SE PL RU IL TR UA BR MX AR NI SA EY IN JP SK SIN AU CN
I would prefer to have the option
of paying either in local currency
or my own currency
I check currency conversion rates
before making purchases in
foreign currencies
I would not feel comfortable
making purchases online in a
foreign currency
My bank charges me for making
payments in foreign currencies
I have in the past made purchases
online paid in a foreign currency
The fees charged by PayPal for
xborder transactions are generally
lower than other payment
methods
PayPal charges me for making
payments in foreign currencies
(% Agree with statement)
Attitudes among all online shoppers surveyed* Attitudes compared between countries
(% Agree with statement)
Q47. Please state whether you agree or disagree with each of the following statements about
shopping online in other countries: Base: Online shoppers (size shown in appendix)
I would not feel comfortable making purchases
online in a foreign currency
The fees charged by PayPal for x-border
transactions are generally lower than other
payment methods
I check currency conversion rates
before making purchases in foreign
currencies
I would prefer to have the option of
paying either in local currency or my own
currency
*Results are among all consumers surveyed, not weighted for
population size
© 2015 PayPal Inc. All rights reserved. Confidential and proprietary.
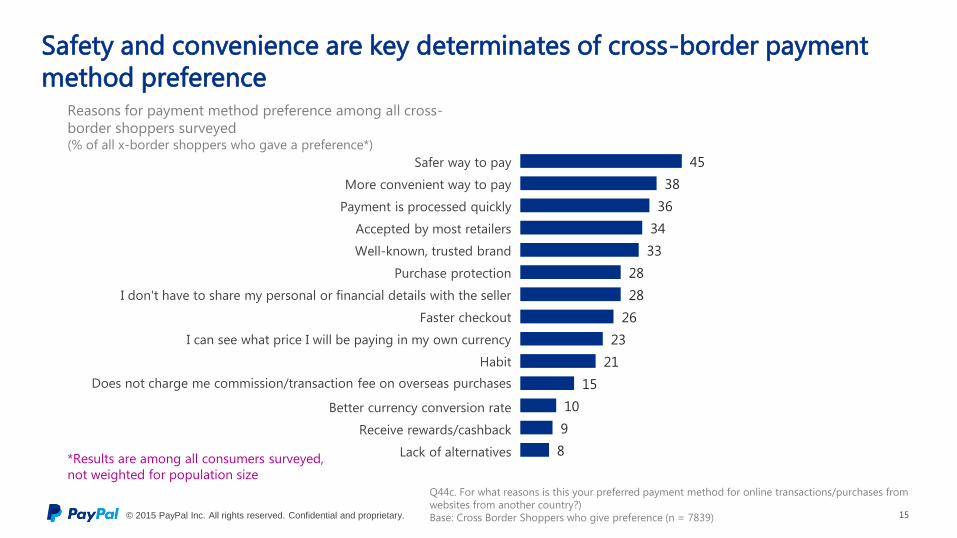
Safety and convenience are key determinates of cross-border payment
method preference
15
Q44c. For what reasons is this your preferred payment method for online transactions/purchases from
websites from another country?)
Base: Cross Border Shoppers who give preference (n = 7839)
45
38
36
34
33
28
28
26
23
21
15
10
9
8
Safer way to pay
More convenient way to pay
Payment is processed quickly
Accepted by most retailers
Well-known, trusted brand
Purchase protection
I don't have to share my personal or financial details with the seller
Faster checkout
I can see what price I will be paying in my own currency
Habit
Does not charge me commission/transaction fee on overseas purchases
Better currency conversion rate
Receive rewards/cashback
Lack of alternatives *Results are among all consumers surveyed,
not weighted for population size
Reasons for payment method preference among all cross-
border shoppers surveyed (% of all x-border shoppers who gave a preference*)

© 2015 PayPal Inc. All rights reserved. Confidential and proprietary.
Incidence of P2P payments
16
7 8
14
19
8 8 7
10
8
13
8
10
8 8
6
10
30
6
10
5
12
8
12
19
3
8
15
13 12
US CA UK IRE DE FR IT ES NL CH AT SE PL RU IL TR UA BR MX AR NI SA EY IN JP SK SIN AU CN
North America Western Europe Middle East Latin America Asia Pacific Africa Eastern Europe
Q48. Which of the following have you done online in the past 12 months?
Base = all internet users (size shown in appendix)
Incidence of Cross-border P2P Payments (% respondents have “Sent money to friends and/or family in another country” in the past 12 months)

© 2015 PayPal Inc. All rights reserved. Confidential and proprietary.
Market Sizing Estimate and Forecast: Methodology Estimating and forecasting online and mobile sales for the period 2014 to 2017
17
To build the forecast we look at
relationships between key macro-
economic indicators.
We use the survey data to add purchase
behaviour (penetration and average
spend per head) to understand the size
and projection of future category
spend.
From these inputs, we model category
sales growth, changes to the
online/mobile population, and growth
in online/mobile spend for those
populations to forecast total online and
mobile spending. We assume that the
current rates of adoption amongst non-
users continues and as the level of
adoption reaches the upper limits we
reach saturation.
Total and online population
development (Source: The World
Bank).
GDP per capita development
(Source: The World Bank).
Total and online retail sales
(Source: ONS Report).
Category online purchase penetration
Average category spend
Smartphone penetration
Tablet penetration
INPUTS SURVEY DATA MODELING
• Total online spend includes mobile spend. Mobile spend includes spend on both smartphones and tablets.
• Estimations/forecast based on the following meta categories: Groceries, Food, drink & Alcohol; Health & Beauty; Clothing,
Footwear & Accessories; Event tickets; Travel & transportation; Household goods; Leisure, Hobbies & Outdoors;
Baby/Children’s Supplies; Entertainment; and Consumer Electronics.

© 2015 PayPal Inc. All rights reserved. Confidential and proprietary.
Global Technical Note
18
Weighted
base:
To
tal
On
lin
e
sh
op
pers
X-b
ord
er
sh
op
pers
Weighted
base:
To
tal
On
lin
e
sh
op
pers
X-b
ord
er
sh
op
pers
UK 800 627 224 India 808 632 241
Ireland 810 594 511 China 800 652 231
Germany 801 616 189 Singapore 813 582 406
France 800 569 219 Japan 800 626 75
Italy 800 566 291 Australia 800 538 349
Spain 803 536 303 South Korea 810 620 167
Netherlands 803 535 197 US 800 564 125
Austria 800 603 513 Canada 808 493 331
Switzerland 809 598 391 Brazil 800 532 261
Sweden 808 579 286 Mexico 808 506 341
Poland 811 592 193 Argentina 800 452 201
Russia 801 584 362 South Africa 810 464 192
Turkey 812 590 207 Egypt 811 462 202
Israel 810 591 468 Nigeria 804 485 339
UAE 813 514 281
On Behalf of PayPal, Ipsos interviewed a representative quota
sample** of c.800 (23,354 in total) adults (aged 18 or over)
who own and/or use an internet enabled device* in each of 29
countries (UK, Ireland, France, Germany, Austria, Switzerland, Italy, Spain, Netherlands, Sweden, Poland, Turkey, Russia, Israel, UAE, USA, Canada, Brazil, Mexico, Argentina, India,China, Japan, South Korea, Singapore, Australia, South Africa, Nigeria, Egypt). Interviews were conducted online
between 17th September and 28th October 2015.
Data was weighted to known incidence of online shoppers in
all countries, and to demographic profile of internet users in 4
countries (SK, SG, EG & UAE). *Desktop computer/Laptop/ notebook computer/Tablet
/Smartphone/Some other type of mobile phone/Electronic
organizer / PDA with wireless voice and data features/Games
console with Internet connectivity (e.g. Wii) ** Age, gender and region representative of online population (Age
and gender representative in Switzerland). Quotas were not set for
Nigeria, as online profile not available in this country