pavement management systems - royal institute of …€¦ · · 2013-05-14an uniform and...
TRANSCRIPT

Pavement Management Systems
Johan Lang
2013-05-07

Value
for
money
Pavement Management Systems - PMS
3
PMS Objectives
Optimal Pavement Management based on socio-economic considerations
4
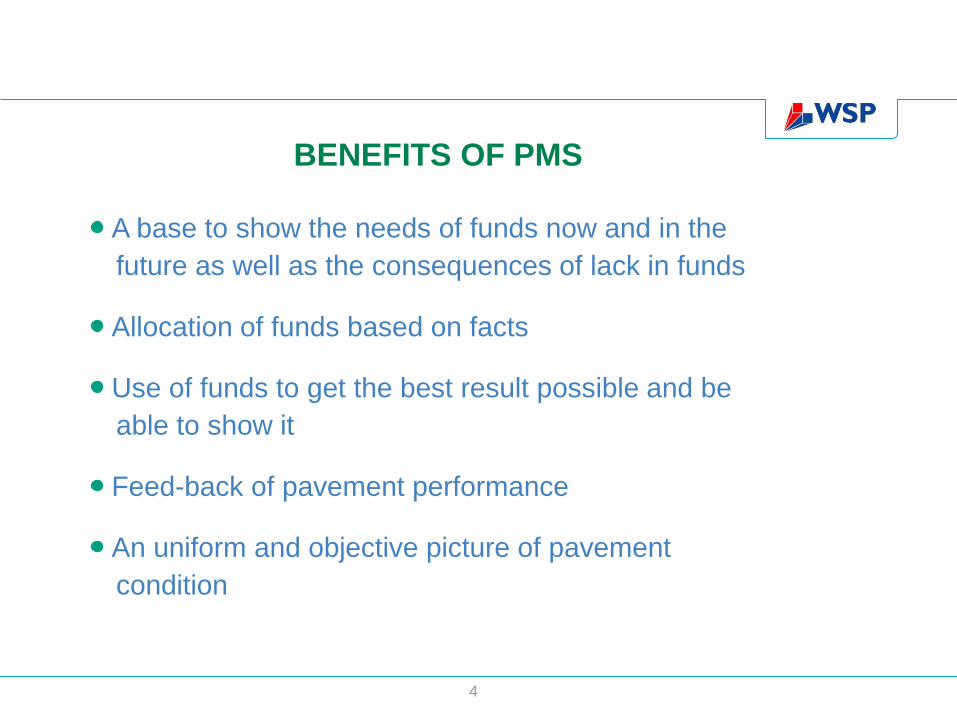
BENEFITS OF PMS
A base to show the needs of funds now and in the
future as well as the consequences of lack in funds
Allocation of funds based on facts
Use of funds to get the best result possible and be
able to show it
Feed-back of pavement performance
An uniform and objective picture of pavement
condition

5
Planning pavement maintenance and rehabilitation
activities
A tool for the pavement engineer to decide
WHERE
WHEN
HOW
an action will be done
PMS - Pavement Management Systems
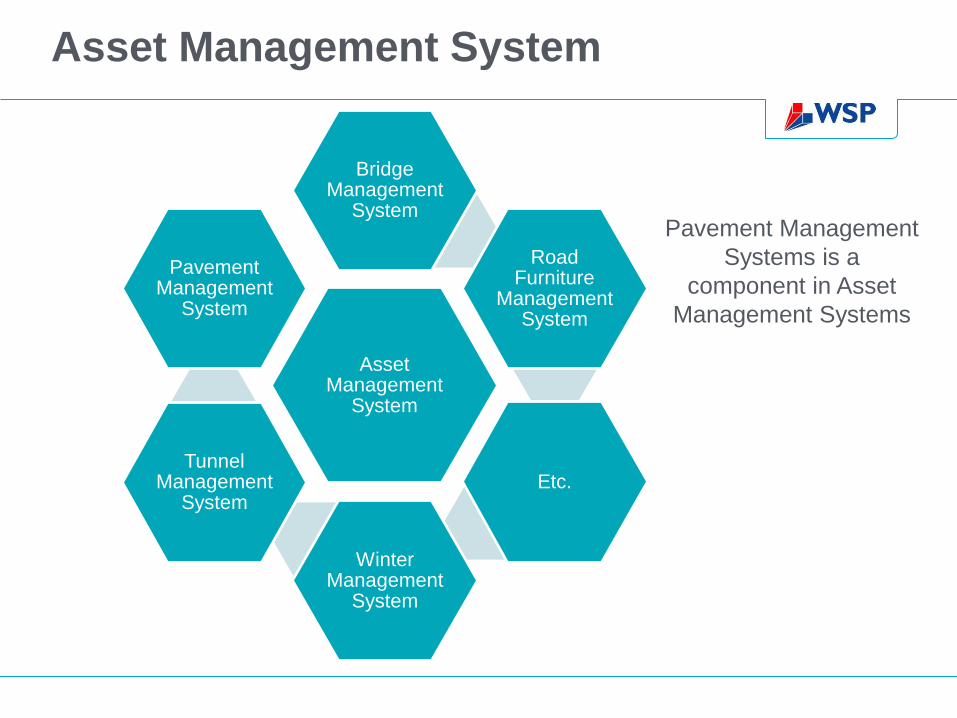
Asset Management System
Asset Management
System
Bridge Management
System
Road Furniture
Management System
Etc.
Winter Management
System
Tunnel Management
System
Pavement Management
System
Pavement Management
Systems is a
component in Asset
Management Systems

Old poor road

Sweden
Poor road stops the
school bus

Russia
Federal highway in Russia

Russia

England
”Repaired” pothole
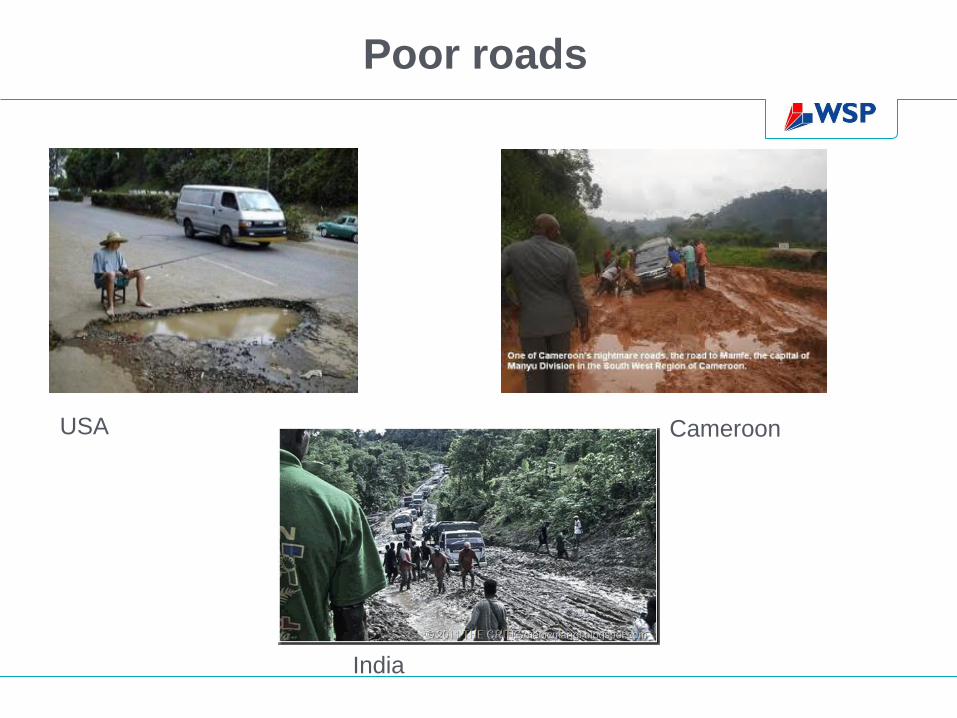
Poor roads
Cameroon
India
USA

Good roads
Morocco
Tanzania
Congo
Mali

Good roads
Canada
USA Serbia
Chile

Good roads
New Zealand Spain
Sweden Sweden

A pavements life cycle

Roads for the users

Pavements for the road users
Comfort
Road
Safety Noice
Internal
Particles
External
Fuel
Emission
PM10
PM2.5l
CO2
Vehicle
operating
costs Tire
Rep-
air
Travel
time
Access

A pavements life cycle

20
Year
Ro
ad
Ag
en
cy C
ost
År
Ro
ad
Co
nd
itio
n
Ro
ad
Us
er
Co
st
Pavement Life
Cycle Cost

21
Road administrator cost
Road user cost
Total cost
Minimum cost
Optimizing
Time
Co
st
pe
r ye
ar

Pavement Management Systems is multidiciplinary
Technomy
Highway engineering
Geotechnical engineering
Structural engineering
Mechanical engineering
Business economics
Socio economics
IT
Logistics
Measurements
etc

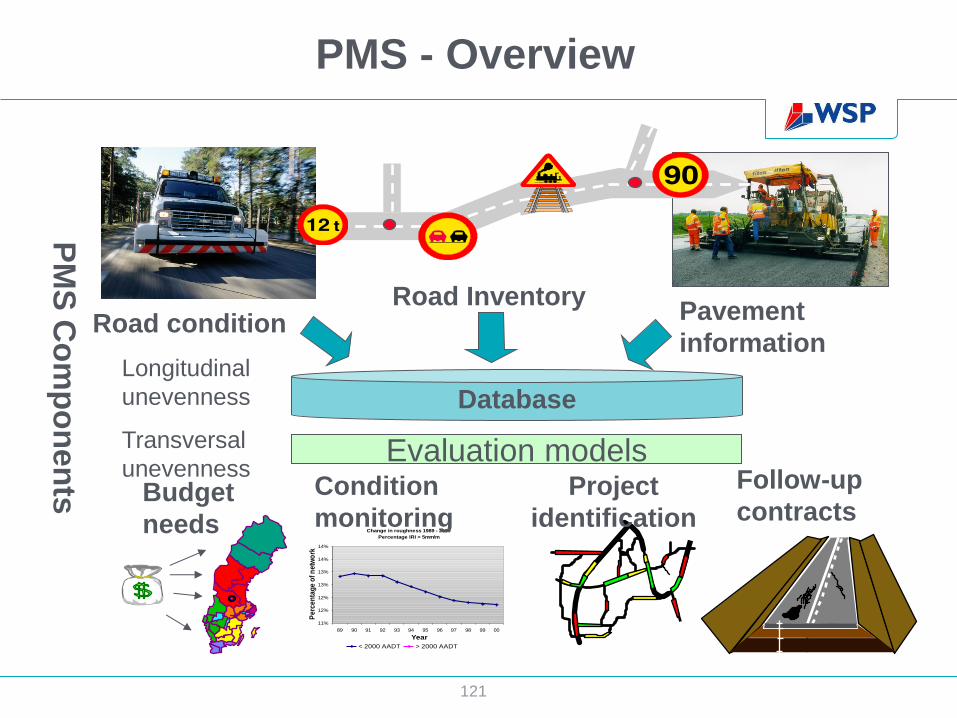
PMS - Overview
23
Database
Road condition
Longitudinal
unevenness
Transversal
unevenness
Road Inventory Pavement
information
Budget
needs
Project
identification
Follow-up
contracts Change in roughness 1989 - 2000
Percentage IRI > 5mm/m
11%
12%
12%
13%
13%
14%
14%
89 90 91 92 93 94 95 96 97 98 99 00
Year
Pe
rce
nta
ge
of
ne
two
rk
< 2000 AADT > 2000 AADT
Condition
monitoring
Evaluation models
PM
S C
om
po
ne
nts

Network level - Overview
REHABILITATION
MAINTENANCE
REGION 1
REGION 2
REGION 3
REGION XX
GOVERNMENT
ROAD
ADMINISTRATION
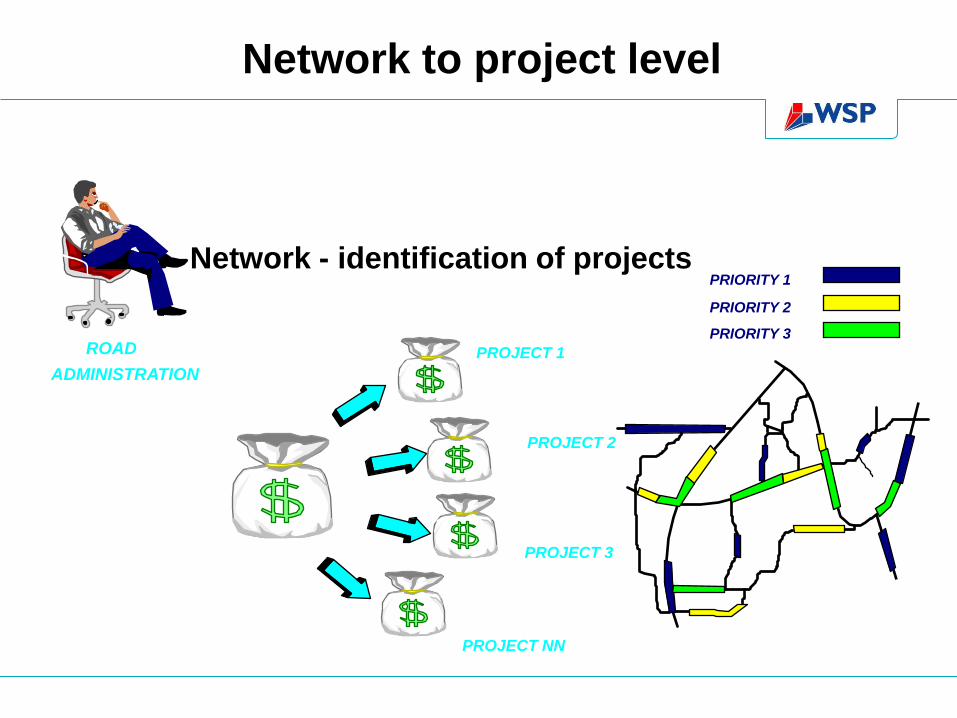
Network to project level
ROAD
ADMINISTRATION
PROJECT 1
PROJECT 2
PROJECT 3
PROJECT NN
PRIORITY 1
PRIORITY 2
PRIORITY 3
Network - identification of projects

PMS - Project Level
Detailed analysis
of individual projects

27
Network level
Project level
Network to project

PMS - Overview
28
Database
Road condition
Longitudinal
unevenness
Transversal
unevenness
Road Inventory Pavement
information
Budget
needs
Project
identification
Follow-up
contracts Change in roughness 1989 - 2000
Percentage IRI > 5mm/m
11%
12%
12%
13%
13%
14%
14%
89 90 91 92 93 94 95 96 97 98 99 00
Year
Pe
rce
nta
ge
of
ne
two
rk
< 2000 AADT > 2000 AADT
Condition
monitoring
Evaluation models
PM
S C
om
po
ne
nts
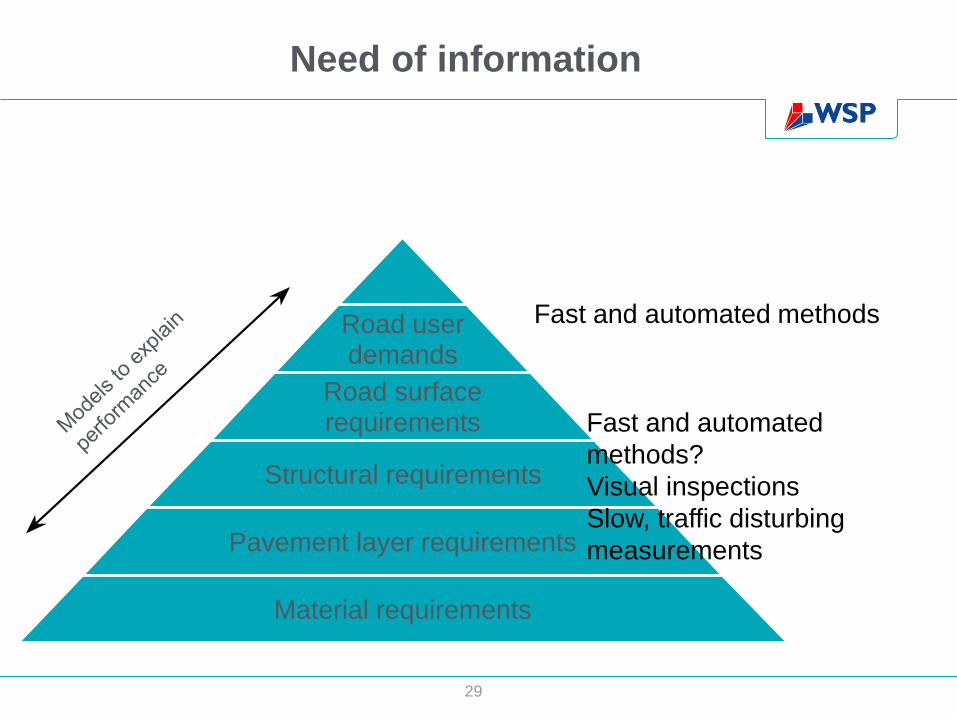
29
Road user demands
Road surface requirements
Structural requirements
Pavement layer requirements
Material requirements
Fast and automated
methods?
Visual inspections
Slow, traffic disturbing
measurements
Fast and automated methods
Need of information
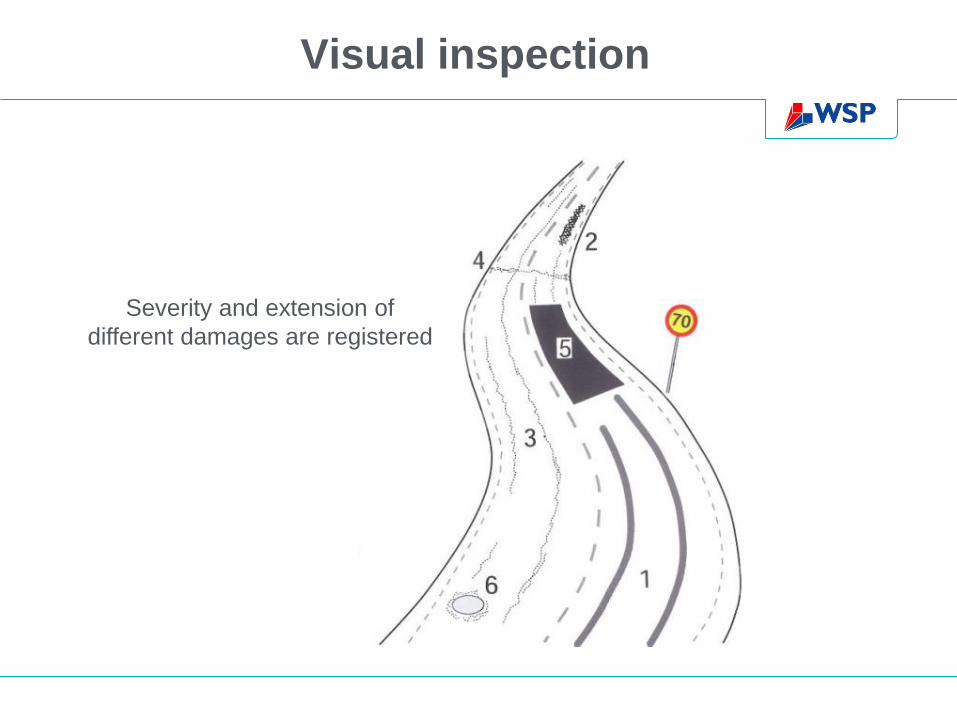
Visual inspection
Severity and extension of
different damages are registered

Unevenness – Roughness - Smoothness

Local uneveness or bumps
32

Rut depth
Wear of studded
tires
Plastic deformation Structural deformation

Poor surface drainage
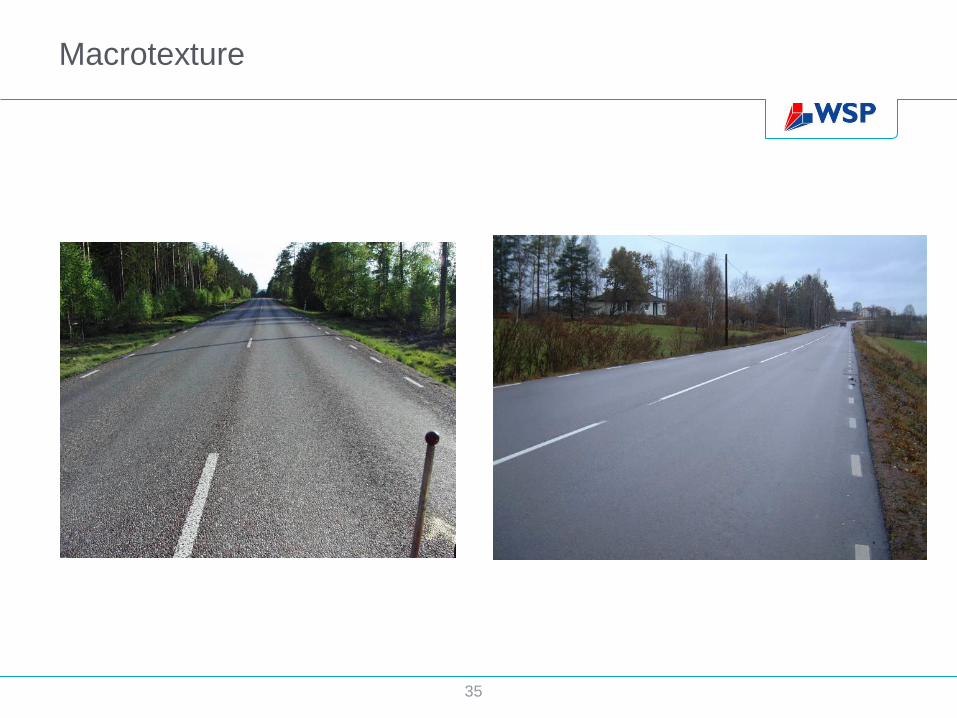
Macrotexture
35

Cracking

Cracks
37

Frost dependent cracks

Edge cracking

Poor drainage
Water plants in
the ditches
Stagnant water
in the ditches
Eroded soil is
filling the
ditches

Pot hole
41

Bleeding asphalt

Ravelling
Surface dressing where
stones get loose

Patching and local repair
44

PMS - Overview
45
Database
Road condition
Longitudinal
unevenness
Transversal
unevenness
Road Inventory Pavement
information
Budget
needs
Project
identification
Follow-up
contracts Change in roughness 1989 - 2000
Percentage IRI > 5mm/m
11%
12%
12%
13%
13%
14%
14%
89 90 91 92 93 94 95 96 97 98 99 00
Year
Pe
rce
nta
ge
of
ne
two
rk
< 2000 AADT > 2000 AADT
Condition
monitoring
Evaluation models
PM
S C
om
po
ne
nts
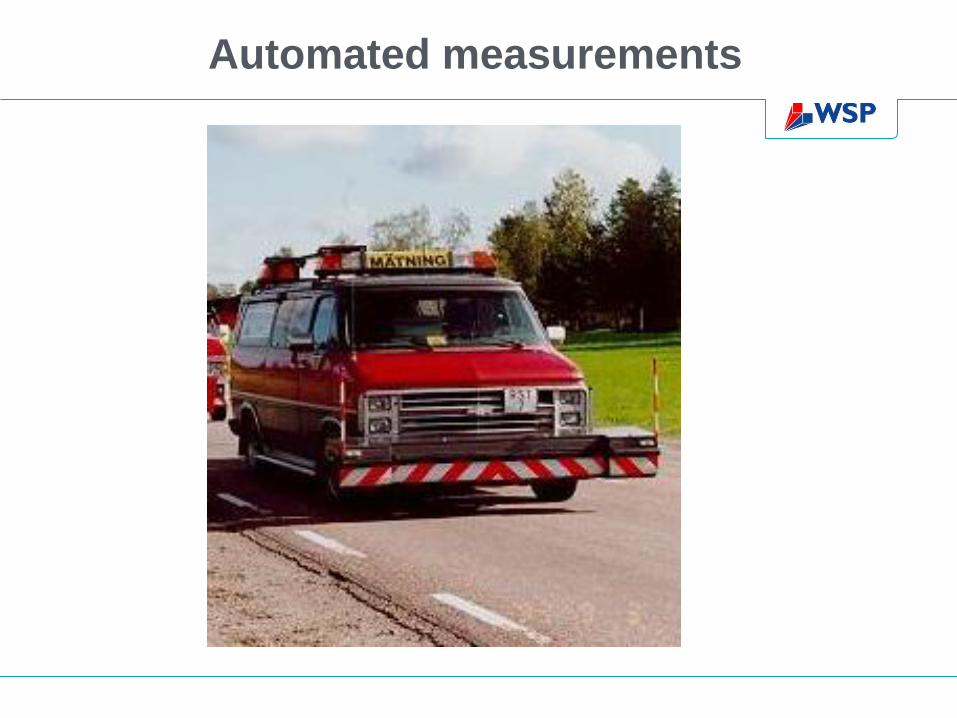
Automated measurements

47
Measurement
equipment

Measurement quality
Repeatability
Measure again and get the same
results.
Validity
Measure what is intended to measure

Visual inspection by using images
Inspection of damages Measurement in stereo
images

Automated measurements

Rut depth (1987) Unevenness IRI (1987) Cross fall, curvature, hilliness (1991) Cross profile Texture (2005) Edge deformation (2002) Longitudinal profile Cracks (not yet) Pictures
Condition data

Measured road lane length Km

53
Laser height sensors
Accelometer
Computer
Inertial reference
Speed/distance

54
Height sensora (laser)
Accelerometers
Profile measurements
Inklinometer
55
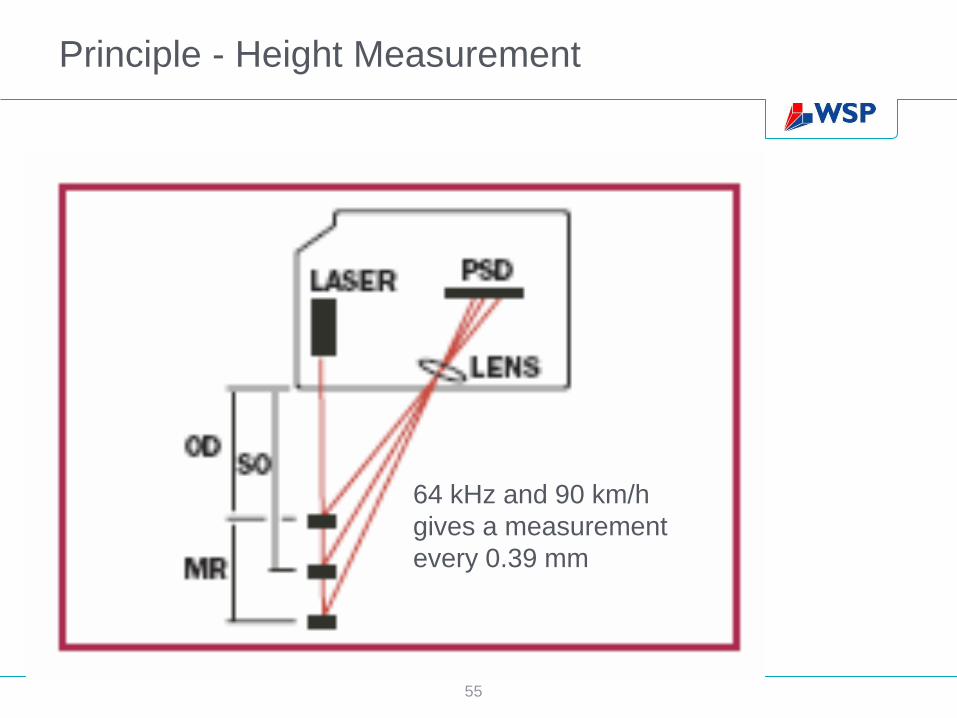
Principle - Height Measurement
64 kHz and 90 km/h
gives a measurement
every 0.39 mm

56
Laser height sensors
Accelometer
Computer
Inertial reference
Speed/distance

57
IRI – International Roughness Index

58
α
•Measurement of three
longitudinal profiles
•Development of full-car model
•Intepretation of vibration
(ISO2631 and EU directive
2002/44/EG)

59
0.5 mm 5 mm 50 mm 0.5 m 5 m 50 m
Micro-
texture
Macrotexture
Mega-
texture
Evenness
Wavelength
Types of evenness

60
Macrotextur-Mean Profile Depth
Beräkning av
makrotextur från
profil
ETD=0.2 + 0.8 MPD 100 mm
averagePeakPeak
MPD
2
21

61
-0.20
-0.18
-0.16
-0.14
-0.12
-0.10
-0.08
-0.06
-0.04
-0.02
0.00
0.02
0.04
0.06
0.08
0.10
0.12
0.14
0.16
0.18
0.20
Modern profilometers can give a detailed 3D map of the road surface

Modern laser scanning equipment can give a 3D image of
the road and surroundings

Collection of images
• Collection of high resolution images in traffic speed
• Processing at the office
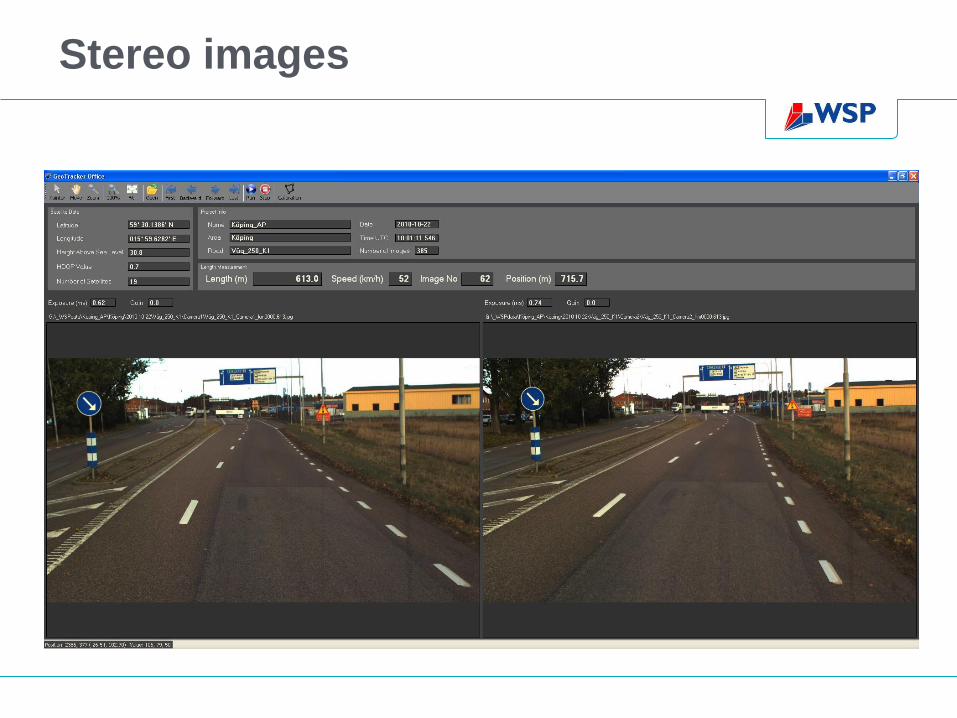
Stereo images
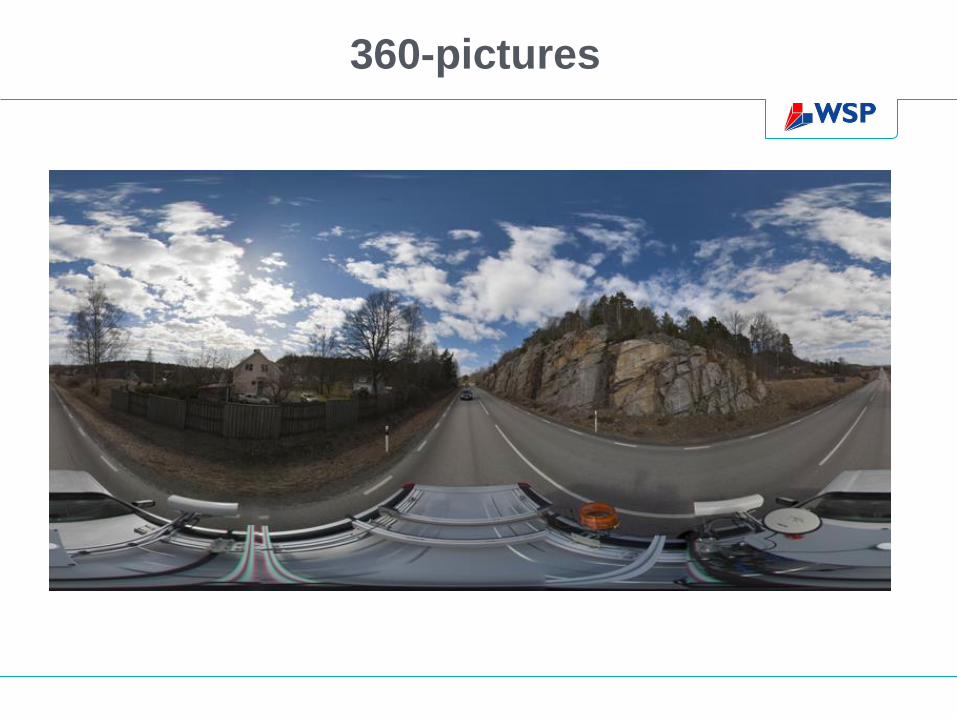
360-pictures

Visual inspection by using images
Inspection of damages Measurement in stereo
images

Laser scanning

Falling Weight Deflectometer - FWD
50 kN
90 cm
45 cm
20 cm
D0 D20 D45 D90
Bearing
Capacity

Ground Penetrating Radar (GPR)
• Measuring thicknesses
of pavement layers.
• Different antennas for
different depth

PMS - Overview
70
Database
Road condition
Longitudinal
unevenness
Transversal
unevenness
Road Inventory Pavement
information
Budget
needs
Project
identification
Follow-up
contracts Change in roughness 1989 - 2000
Percentage IRI > 5mm/m
11%
12%
12%
13%
13%
14%
14%
89 90 91 92 93 94 95 96 97 98 99 00
Year
Pe
rce
nta
ge
of
ne
two
rk
< 2000 AADT > 2000 AADT
Condition
monitoring
Evaluation models
PM
S C
om
po
ne
nts

71
Road
condition
Longitudinal
unevenness
Transversal
unevenness
Road Inventory Pavement
information
Link
Node
Coordinates
x, y, z

Traffic numbers are collected in the
"Traffic Measurement System"
Number of vehicles
Number of axles
Vehicle type
Based on traffic measurements Equivalent Standard Axle Loads is calculated

Example of output from the maintenance treatment
database

The maintenance treatment database covers a long
period

Expected durability
0
5
10
15
20
25
0-249 250 - 499 500 - 999 1000 -
1999
2000 -
3999
4000 -
7999
8000 -
11999
>12000
Trafik
Liv
slä
ng
d (
år)
75

PMS - Overview
76
Database
Road condition
Longitudinal
unevenness
Transversal
unevenness
Road Inventory Pavement
information
Budget
needs
Project
identification
Follow-up
contracts Change in roughness 1989 - 2000
Percentage IRI > 5mm/m
11%
12%
12%
13%
13%
14%
14%
89 90 91 92 93 94 95 96 97 98 99 00
Year
Pe
rce
nta
ge
of
ne
two
rk
< 2000 AADT > 2000 AADT
Condition
monitoring
Evaluation models
PM
S C
om
po
ne
nts

77
Planning pavement maintenance and rehabilitation
activities
A tool for the pavement engineer to decide
WHERE
WHEN
HOW
an action will be done
PMS - Pavement Management Systems

78
Primary users
Performs analysis and produce outputs from the system (measurements, data storage, analysis, further development)
Skilled engineers
Secondary users
Uses the results of the system
Managers
Who are the users?

79
PMS is a
Decision
Support
System

80
Road Data Bank
Data collection and storage
Evaluation
0-500 500-1500 1500-4000 4000-7000 7000- 0
20
40
60
80
100
120
Systems
Users Benefits

PMS - Overview
81
Database
Road condition
Longitudinal
unevenness
Transversal
unevenness
Road Inventory Pavement
information
Budget
needs
Project
identification
Follow-up
contracts Change in roughness 1989 - 2000
Percentage IRI > 5mm/m
11%
12%
12%
13%
13%
14%
14%
89 90 91 92 93 94 95 96 97 98 99 00
Year
Pe
rce
nta
ge
of
ne
two
rk
< 2000 AADT > 2000 AADT
Condition
monitoring
Evaluation models
PM
S C
om
po
ne
nts

82

Output example from the New Swedish PMS

Output example from the New Swedish PMS

Output example from the New Swedish PMS

Output index

Output index

88
0 1000 2000 3000 4000 5000
600.00 617.00 604.00 618.00
Vägbredd(m) 7.0 8.0 11.7
Trafik(ÅDT) 3190 6090 5780
Tung traf(ÅDT) . 550 530
Bel.lager 1 0Y1B1681 35ABS1198 32HABS1293
Bel.lager 2 16MABT1280 0ABT1698 1) 0MABT1292
Bel.lager 3 24MABT1275 32HABT1287 2) 3) 28HABT1286
1)32MABT1285,2)24MABT1279,3)32MABT1285,
Spårdjup(mm)
OjämnhetIRI(mm/m)
930601 930721 940530 950607 960609 970605980627 990617 991023
Road Surface ConditionDalarnas län , Väg: 60.00
Sträcka: 0 - 5000, Körfält: 10, Riktning: Framåt, Sida för vägdata: 1
VÄGVERKET
PMS
20000531, 13.12
Vägversion: 19991205
Best1
20
15
10
5
0
0123456

Example PMS planning module – Road graph
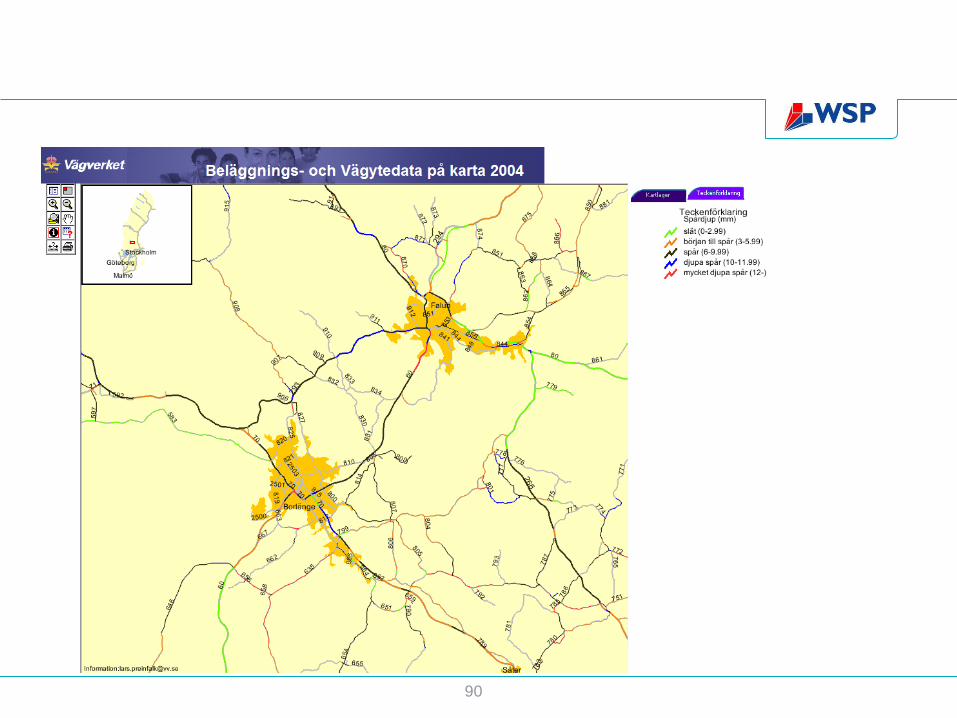
90

91

92
y = 0,0741x + 1,5298
R2 = 0,8817
0
0,5
1
1,5
2
2,5
3
3,5
4
0 5 10 15 20 25 30
Age
IRI
(mm
/m) 610 vehicles/day
90 trucks/day
3055 m
7.0 m
90 km/h
Change in condition
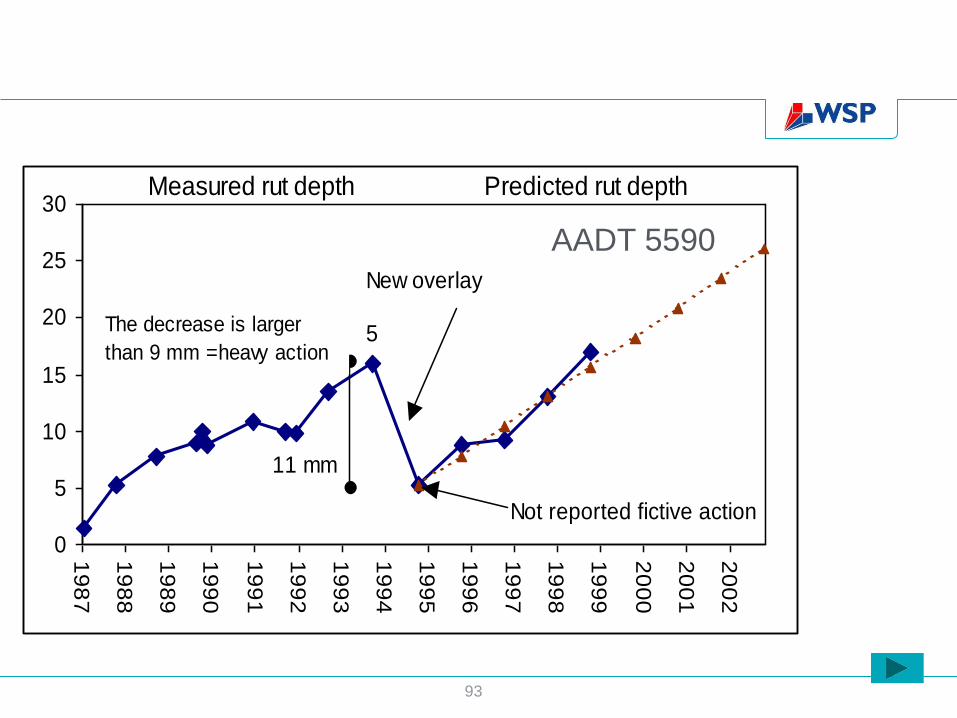
93
0
5
10
15
20
25
30
19
87
19
88
19
89
19
90
19
91
19
92
19
93
19
94
19
95
19
96
19
97
19
98
19
99
20
00
20
01
20
02
Measured rut depth Predicted rut depth
New overlay
Not reported fictive action
5
11 mm
The decrease is larger
than 9 mm =heavy action
AADT 5590

94
0123
456789
1011
12131415
1989
1990
1991
1992
1993
1994
1995
1996
1997
1998
1999
2000
2001
2002
2003
Measured rut depth Predicted rut depth
AC
Stone mastic asphalt Stone mastic asphalt
New overlays
AADT 22490

Maintenance standard IRI
Trafik (fordon/dygn)
120 110 100 90 80 70 60 50
0-250 4,3 4,7 5,2 5,9 6,7 6,7 6,7
250-500 4,0 4,4 4,9 5,5 6,3 6,3 6,3
500-1000 3,7 4,1 4,5 5,1 5,8 5,8 5,8
1000-2000 3,0 3,3 3,7 4,2 4,8 5,2 5,2
2000-4000 2,4 2,6 2,9 3,2 3,6 4,1 4,9 4,9
4000-8000 2,4 2,6 2,9 3,2 3,6 4,1 4,9 4,9
>8000 2,4 2,6 2,9 3,2 3,6 4,1 4,9 4,9
Skyltad hastighet (km/h)

Maintenance standard rut depth
Trafik (fordon/dygn)
120 110 100 90 80 70 60 50
0-250 18,0 18,0 24,0 24,0 30,0 30,0 30,0
250-500 18,0 18,0 22,0 22,0 27,0 27,0 27,0
500-1000 18,0 18,0 20,0 20,0 24,0 24,0 24,0
1000-2000 15,0 16,0 17,0 18,0 20,0 21,0 21,0
2000-4000 13,0 13,0 14,0 14,0 16,0 16,0 18,0 18,0
4000-8000 13,0 13,0 14,0 14,0 16,0 16,0 18,0 18,0
>8000 13,0 13,0 14,0 14,0 16,0 16,0 18,0 18,0
Skyltad hastighet (km/h)

97
y = 0,0957x + 2,087
R2 = 0,7381
y = 0,098x + 0,2498
R2 = 0,9156
0
0,5
1
1,5
2
2,5
3
3,5
4
0 5 10 15 20 25 30
Age
IRI
(mm
/m)
Maintenance
670 vehicles/day
90 trucks/day
1163 m
7.0 m
90 km/h
40 mm Hot Mix
1996
Maintenance effect

Predicted unevenness before
maintenance

Predicted rut depth before maintenance

Yearly change in condition

101
How much can different types of maintenance improve the surface
condition?
Ratio IRIafter/IRIbefore
CM=Cold Mix
HM=Hot Mix
SC=Seal Coat
SD=Surface
Dressing
SHM=Semi-
Hot Mix
P=Preparatory
work
500-999 vehicles/day

Pavements for the road users
Comfort
Road
Safety Noice
Internal
Particles
External
Fuel
Emission
PM10
PM2.5l
CO2
Vehicle
operating
costs Tire
Rep-
air
Travel
time
Access

103
Effects
Environment
Safety
Health
Comfort
Speed
Vehicle
Cost
Environment Safety
Health
Comfort Speed Vehicle
Valuation
Condition Evenness
Rut depth
Friction
Texture
Cross fall
etc.

104
Speed
Safe
ty
Com
fort
Vehic
le d
am
age
Tyre
wear
Fuel consum
ption
Choic
e o
f ro
ad
Tra
nsport
dam
age
Noic
e
Pollu
tion
Longevity
Win
ter
main
tenance
Rut Depth 2 1 2 1 1 1 1 1 1 2 3 2Rut shape 2 ? 2 1 1 1 1 1 1 0 0 2Roughness 3 2 3 3 2 3 3 3 2 1 3 2Megatexture 2 2 3 3 2 3 2 3 3 1 2 2Macrotexture 0 0 2 1 3 3 0 0 3 1 0 2Microtexture 0 0 0 0 3 1 0 0 1 0 0 0Friction 3 3 2 0 0 0 2 0 0 0 0 0Retroreflection 2 2 2 0 0 0 1 0 0 0 0 0Crossfall 1 1 1 1 1 1 0 0 0 1 2 0Water permeability 2 2 2 0 0 1 1 0 1 3 1 2Bearing Capicity 0 0 0 0 0 1 3 0 0 0 3 0Stiffness 0 0 0 0 0 2 0 0 1 0 0 0
Influence
Big
Fair
Low
None
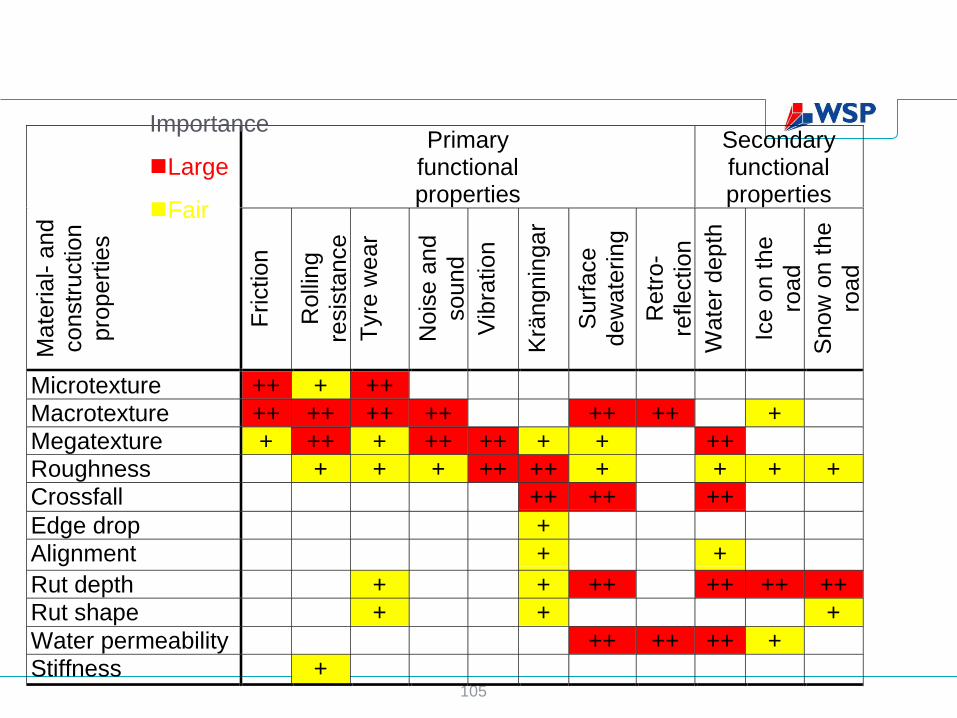
105
Primaryfunctionalproperties
Secondaryfunctionalproperties
Ma
teri
al- a
nd
constr
uction
pro
pert
ies
Fri
ction
Rolli
ng
resis
tance
Tyre
wear
Nois
e a
nd
sound
info
rma
tion
Vib
ration
Krä
ngnin
gar
Surf
ace
de
wate
ring
Retr
o-
reflection
Wate
r dep
th
Ice
on the
roa
d
Sno
w o
n the
roa
d
Microtexture ++ + ++
Macrotexture ++ ++ ++ ++ ++ ++ +
Megatexture + ++ + ++ ++ + + ++Roughness + + + ++ ++ + + + +
Crossfall ++ ++ ++
Edge drop +
Alignment + +
Rut depth + + ++ ++ ++ ++
Rut shape + + +
Water permeability ++ ++ ++ +
Stiffness +
Importance
Large
Fair

IRI vs Speed - Trucks
106
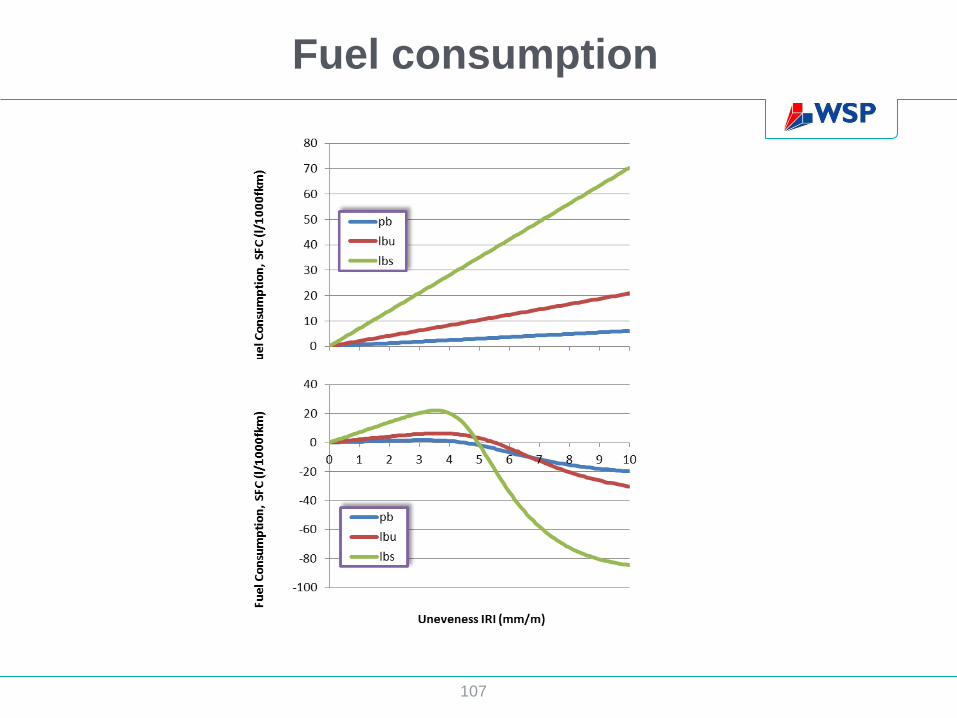
107
Fuel consumption
108
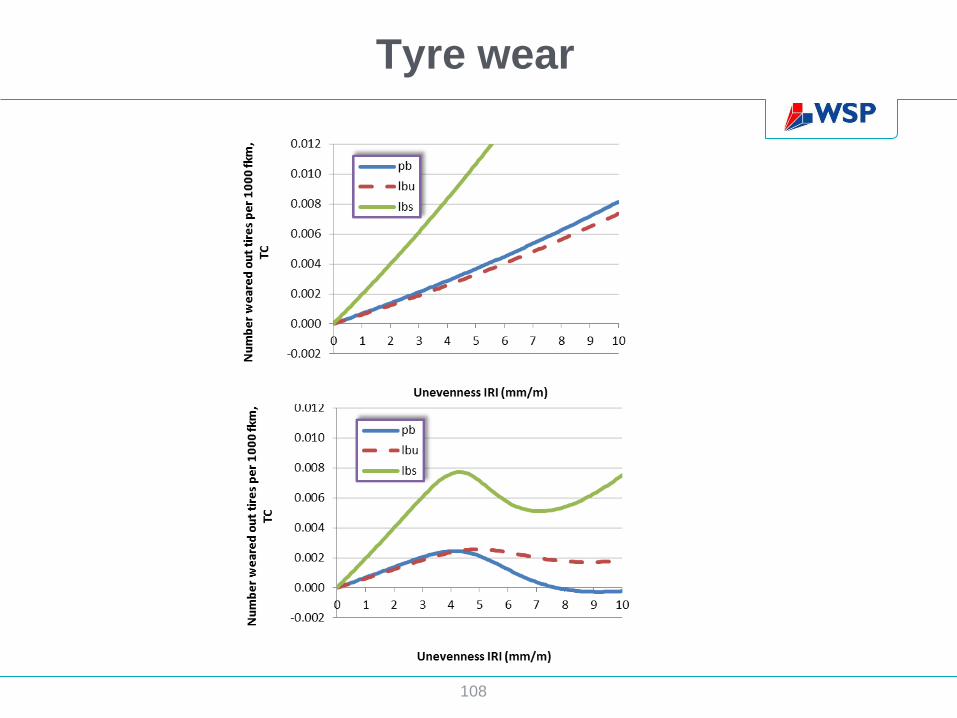
Tyre wear

109
Parts consumption vs. evenness

110
Capital value vs. evenness

Comfort
111
Profile
measurement IRI QC-model
Panel rating
Vibration
measurement •ISO 2631
•Speed 70 km/h
•Passenger car

112
Profile
measurement
IRI
Panel rating
1 Very poor
2 Poor
3 Fair
4 Good
5 Very good
Comfort

113
Profile
measurement IRI QC-model
Panel rating
Vibration
measurement
Vibration
Profile
measurement
Comfort
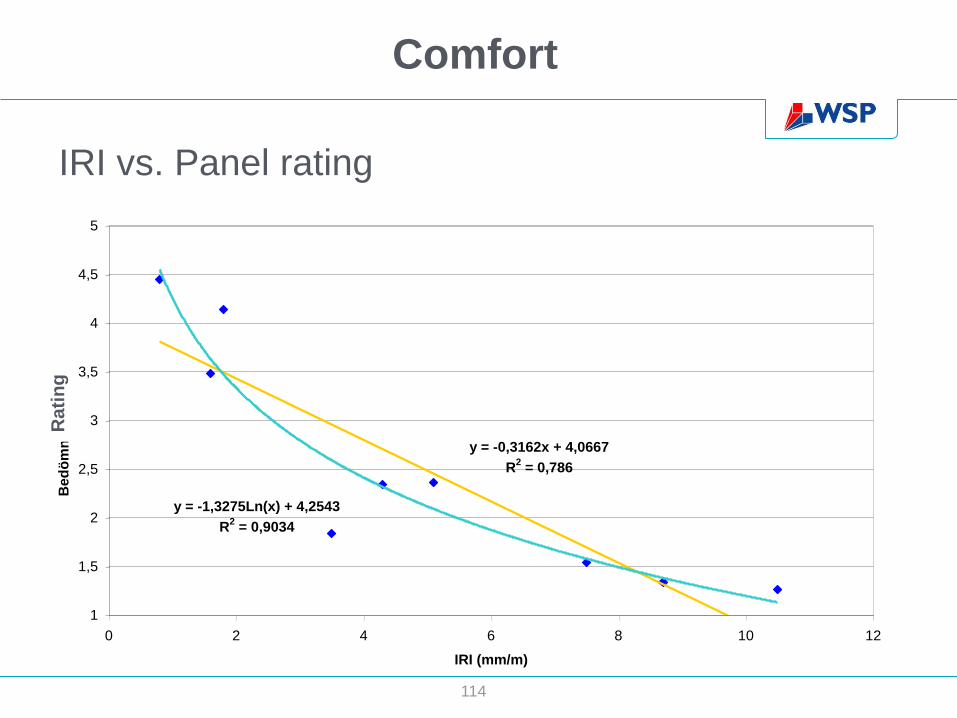
114
y = -0,3162x + 4,0667
R2 = 0,786
y = -1,3275Ln(x) + 4,2543
R2 = 0,9034
1
1,5
2
2,5
3
3,5
4
4,5
5
0 2 4 6 8 10 12
IRI (mm/m)
Bed
öm
nin
g (
sk
ala
1-5
)
IRI vs. Panel rating
Ra
tin
g
Comfort

Summary road user opinion survey
Road user opinion, main roads, unsatisfied %
Winter: 2000,2002,2004
0
10
20
30
40
50
60
70
80
1995 1996 1997 1998 1999 2000 2001 2002 2003 2004 2005
Car ruts
Car roughness
Car markings
Car ice
Truck ruts
Truck roughness
Truck markings
Truck ice

Road user requirements on road condition
Five reports (in swedish, summary in english)
1. Literature review
• Many countries are making road user opinion studies but few
have find a good connection between rod user opinion and
condition measurements
2. Focusgroup discussions
• Surface drainage is important
• Important condition variables: rut depth, potholes, patches,
roughness and cracks
• Critical condition: If a driver must react to avoid a damage eg a
pothole
• Truckdrivers don’t like narrow road with weak edges
• Good understanding of shortage of money
3. Questionnarie
4. Driving simulator
5. Summary
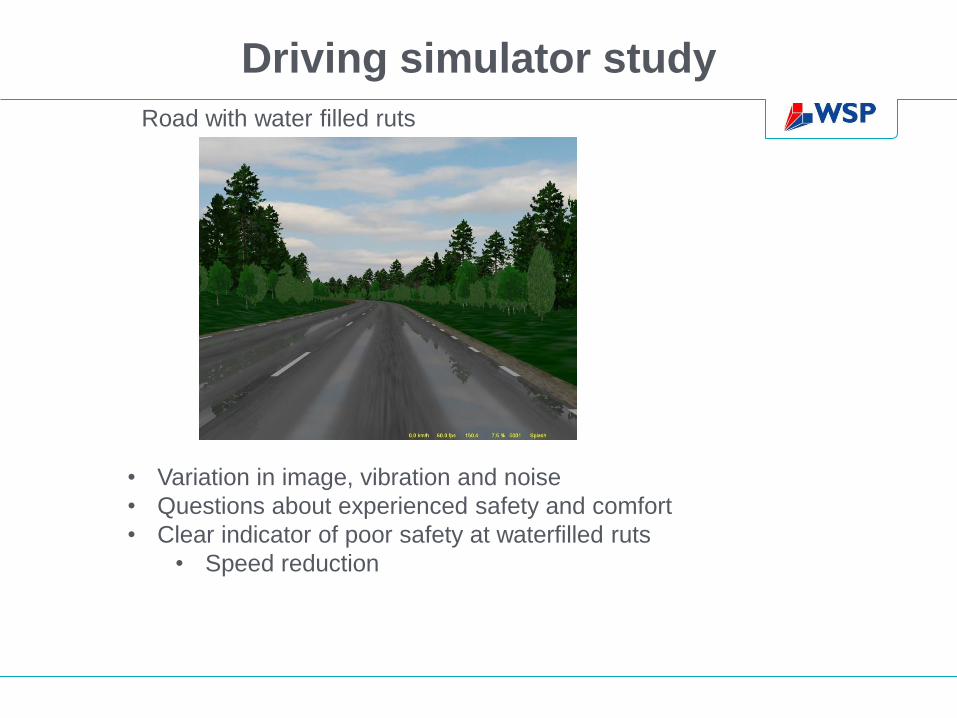
Driving simulator study
Road with water filled ruts
• Variation in image, vibration and noise
• Questions about experienced safety and comfort
• Clear indicator of poor safety at waterfilled ruts
• Speed reduction

118
y = 0,0028x + 0,0098
R2 = 0,7599
0,008
0,010
0,012
0,014
0,016
0,018
0 1 2 3
MPD
RR
aver.
Rolling restistance vs. texture
119
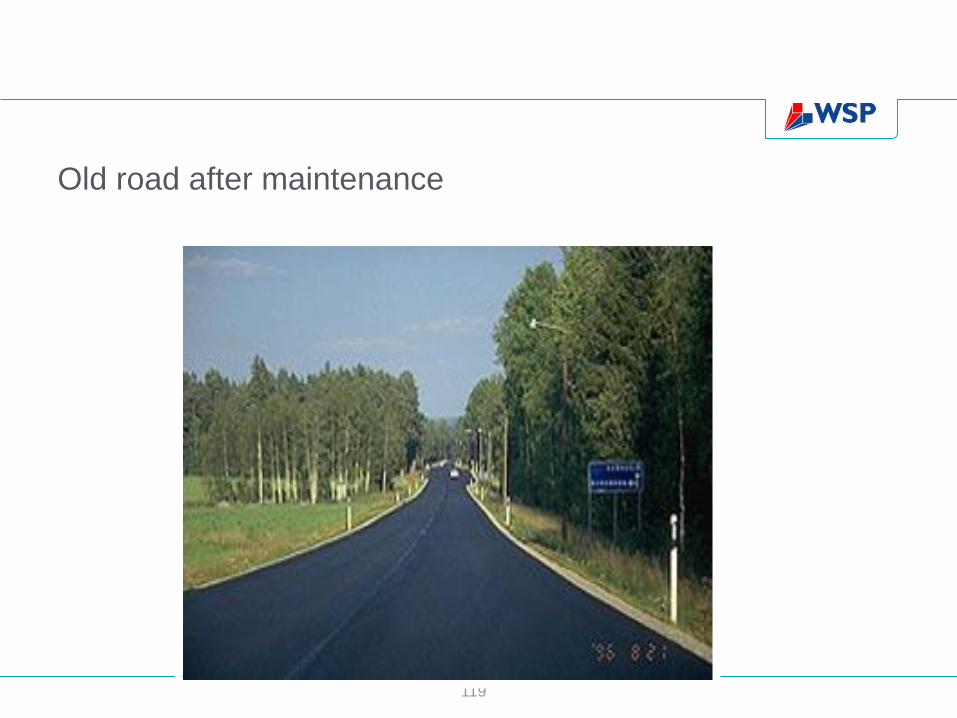
Old road after maintenance
120
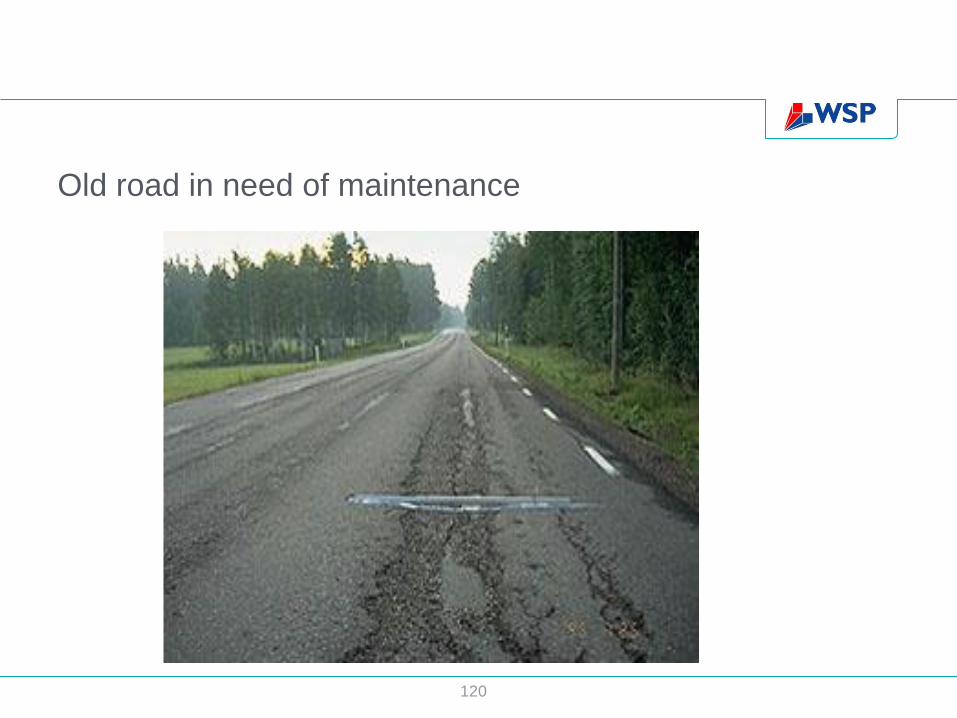
Old road in need of maintenance
PMS - Overview
121
Database
Road condition
Longitudinal
unevenness
Transversal
unevenness
Road Inventory Pavement
information
Budget
needs
Project
identification
Follow-up
contracts Change in roughness 1989 - 2000
Percentage IRI > 5mm/m
11%
12%
12%
13%
13%
14%
14%
89 90 91 92 93 94 95 96 97 98 99 00
Year
Pe
rce
nta
ge
of
ne
two
rk
< 2000 AADT > 2000 AADT
Condition
monitoring
Evaluation models
PM
S C
om
po
ne
nts

122
Road Data Bank
Data collection and storage
Evaluation
0-500 500-1500 1500-4000 4000-7000 7000- 0
20
40
60
80
100
120
Systems
Users Benefits

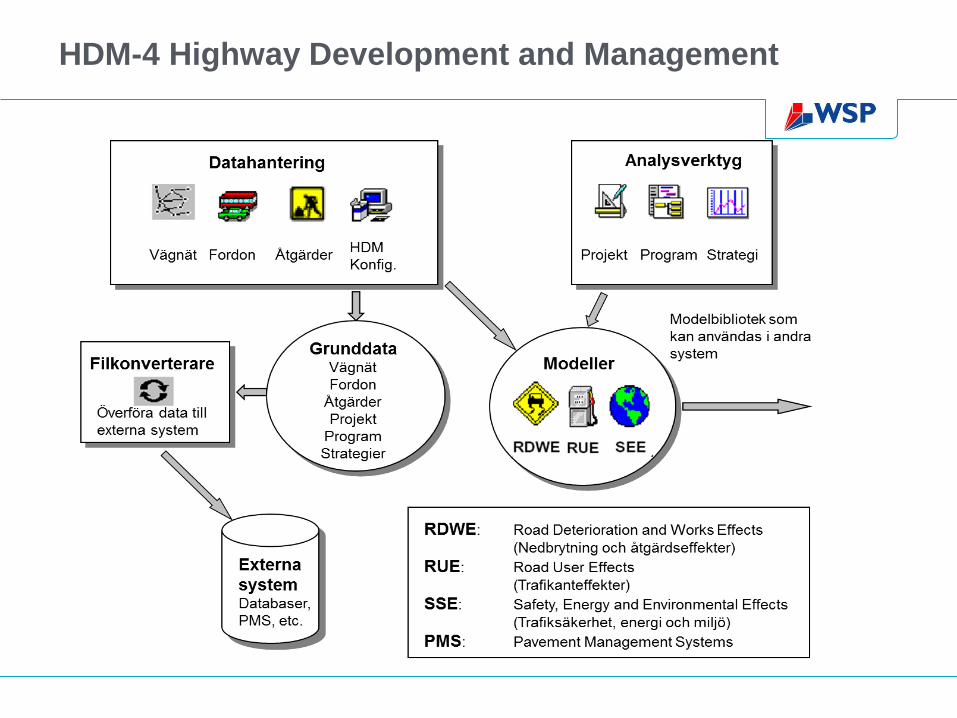
HDM-4 Highway Development and Management
HDM-III Highway Design and Maintenance Standards Model
HDM-4 Highway Development and Management
First developed by the World Bank
Today managed by PIARC (The World Road Association)
HDM-4 Highway Development and Management

Resultat
NPV/Cost= (UCbase-
UCalt-(ACalt-ACbase)/
(ACalt-ACbase)

Resultat