patient care planning discussions for patients at … · patient care planning discussions for...
TRANSCRIPT
Ontario Health Technology Assessment Series; Vol. 14: No. 19, pp. 1–72, December 2014
Patient Care Planning Discussions for
Patients at the End of Life: An
Evidence-Based Analysis
S Baidoobonso
December 2014

Ontario Health Technology Assessment Series; Vol. 14: No. 19, pp. 1–72, December 2014 2
Suggested Citation
This report should be cited as follows:
Baidoobonso S. Patient care planning discussions for patients at the end of life: an evidence-based analysis. Ont
Health Technol Assess Ser [Internet]. 2014 December;14(19):1–72. Available from:
http://www.hqontario.ca/evidence/publications-and-ohtac-recommendations/ontario-health-technology-assessment-
series/eol-planning-discussions
Permission Requests
All inquiries regarding permission to reproduce any content in the Ontario Health Technology Assessment Series
should be directed to [email protected].
How to Obtain Issues in the Ontario Health Technology Assessment Series
All reports in the Ontario Health Technology Assessment Series are freely available in PDF format at the following
URL: http://www.hqontario.ca/evidence/publications-and-ohtac-recommendations/ontario-health-technology-
assessment-series.
Conflict of Interest Statement
The members of the Division of Evidence Development and Standards at Health Quality Ontario are impartial.
There are no competing interests or conflicts of interest to declare.
Indexing
The Ontario Health Technology Assessment Series is currently indexed in MEDLINE/PubMed, Excerpta
Medica/Embase, and the Centre for Reviews and Dissemination database.
Peer Review
All reports in the Ontario Health Technology Assessment Series are subject to external expert peer review.
Additionally, Health Quality Ontario posts draft reports and recommendations on its website for public comment
prior to publication. For more information, please visit:
http://www.hqontario.ca/en/mas/ohtac_public_engage_overview.html.

Ontario Health Technology Assessment Series; Vol. 14: No. 19, pp. 1–72, December 2014 3
About Health Quality Ontario
Health Quality Ontario is an arms-length agency of the Ontario government. It is a partner and leader in
transforming Ontario’s health care system so that it can deliver a better experience of care, better outcomes for
Ontarians, and better value for money.
Health Quality Ontario strives to promote health care that is supported by the best available scientific evidence. The
Evidence Development and Standards branch works with expert advisory panels, clinical experts, scientific
collaborators, and field evaluation partners to conduct evidence-based reviews that evaluate the effectiveness and
cost-effectiveness of health interventions in Ontario.
Based on the evidence provided by Evidence Development and Standards and its partners, the Ontario Health
Technology Advisory Committee—a standing advisory subcommittee of the Health Quality Ontario Board—makes
recommendations about the uptake, diffusion, distribution, or removal of health interventions to Ontario’s Ministry
of Health and Long-Term Care, clinicians, health system leaders, and policymakers.
Health Quality Ontario’s research is published as part of the Ontario Health Technology Assessment Series, which is
indexed in MEDLINE/PubMed, Excerpta Medica/Embase, and the Centre for Reviews and Dissemination database.
Corresponding Ontario Health Technology Advisory Committee recommendations and other associated reports are
also published on the Health Quality Ontario website. Visit http://www.hqontario.ca for more information.
About the Ontario Health Technology Assessment Series
To conduct its comprehensive analyses, Evidence Development and Standards and its research partners review the
available scientific literature, making every effort to consider all relevant national and international research;
collaborate with partners across relevant government branches; consult with expert advisory panels, clinical and
other external experts, and developers of health technologies; and solicit any necessary supplemental information.
In addition, Evidence Development and Standards collects and analyzes information about how a health intervention
fits within current practice and existing treatment alternatives. Details about the diffusion of the intervention into
current health care practices in Ontario add an important dimension to the review.
The Ontario Health Technology Advisory Committee uses a unique decision determinants framework when making
recommendations to the Health Quality Ontario Board. The framework takes into account clinical benefits, value for
money, societal and ethical considerations, and the economic feasibility of the health care intervention in Ontario.
Draft Ontario Health Technology Advisory Committee recommendations and evidence-based reviews are posted for
21 days on the Health Quality Ontario website, giving individuals and organizations an opportunity to provide
comments prior to publication. For more information, please visit: http://www.hqontario.ca/evidence/evidence-
process/evidence-review-process/professional-and-public-engagement-and-consultation.
Disclaimer
This report was prepared by the Evidence Development and Standards branch at Health Quality Ontario or one of its
research partners for the Ontario Health Technology Advisory Committee and was developed from analysis,
interpretation, and comparison of scientific research. It also incorporates, when available, Ontario data and
information provided by experts and applicants to Health Quality Ontario. The analysis may not have captured every
relevant publication and relevant scientific findings may have been reported since the development of this
recommendation. This report may be superseded by an updated publication on the same topic. Please check the
Health Quality Ontario website for a list of all publications: http://www.hqontario.ca/evidence/publications-and-
ohtac-recommendations.
Ontario Health Technology Assessment Series; Vol. 14: No. 19, pp. 1–72, December 2014 4
Abstract
Background
Ontario spends about 9% of its health budget on care for people at the end of life (EoL), most of whom
die from chronic, prolonged conditions. For many people, patient care planning discussions (PCPDs) can
improve the quality and reduce the cost of care.
Objectives
This evidence-based analysis aimed to examine the effectiveness of PCPDs in achieving better patient-
centred outcomes for people at the EoL.
Data Sources
A systematic literature search was conducted in MEDLINE, Embase, CINAHL, and EBM Reviews to
identify relevant literature published between January 1, 2004, and October 9, 2013.
Review Methods
Peer-reviewed reports from randomized controlled trials (RCTs) and observational studies were
examined. Outcomes included quality of life (QoL), satisfaction, concordance, advance care planning
(ACP), and health care use. Quality of evidence was assessed using GRADE.
Results
While the effects of PCPDs on QoL are unclear, single-provider PCPDs were associated with family
members being very satisfied with EoL care (odds ratio [OR]: 5.17 [95% CI: 1.52, 17.58]), improved
concordance between patients’ and families’ wishes (OR: 4.32, P < 0.001), fewer episodes of hospital
care (mean difference [MD]: −0.21, P = 0.04), spending fewer days in hospital (MD: −1.8, P = 0.03), and
receiving hospice care (OR: 5.17 [95% CI: 2.03, 13.17]). Team-based PCPDs were associated with
greater patient satisfaction (standardized mean difference [SMD]: 0.39 [95% CI: 0.17, 0.60]) and fewer
outpatient visits (MD: −5.20 [95% CI: −9.70, −0.70]). Overall, PCPDs were associated with more ACP
and more optimal health care use.
Limitations
Most of the RCTs were unblinded, intervention was measured or described inadequately in some studies,
and the term “usual care” was often undefined.
Conclusions
Patients at the EoL and their families benefited from PCPDs. Furthermore, PCPDs occurring earlier in the
course of illness were associated with better outcomes than those occurring later.

Ontario Health Technology Assessment Series; Vol. 14: No. 19, pp. 1–72, December 2014 5
Plain Language Summary
In 2009–2010, about 88,000 people in Ontario were near the end of their lives; nearly all of these people
were adults who died from chronic illnesses such as cancer, heart disease, stroke, diabetes, and
Alzheimer’s disease. Providing better-quality health care for people at the end of life has become a
priority and research suggests that the quality of care can be improved by patient care planning
discussions among health care providers, patients, and families. These discussions focus on designing
care for a particular patient on the basis of disease progress, treatment options, preferences, goals, values,
and other related considerations. This review was conducted to examine the effects of patient care
planning discussions on the quality of care provided and the use of health care resources at the end of life.
This review found that patient care planning discussions with a team of providers from multiple
professions were beneficial for patients and their families. High-quality evidence indicates that
discussions with a single provider can improve families’ satisfaction with care at the end of a loved one’s
life and increase agreement between the wishes of the patient and his or her family. These discussions can
also reduce the likelihood that patients will need care in hospital and reduce the number of days a patient
spends in hospital. Finally, discussions with a single provider increased care planning and the use of
hospice services. Moderate- to high-quality evidence shows that patient care planning discussions with a
team of providers from multiple professions led to increases in care planning, fewer days in intensive
care, and fewer visits for outpatient services.
Ontario Health Technology Assessment Series; Vol. 14: No. 19, pp. 1–72, December 2014 6
Table of Contents
List of Tables ............................................................................................................................................... 7
List of Figures .............................................................................................................................................. 8
List of Abbreviations .................................................................................................................................. 9
Background ............................................................................................................................................... 10
Objective of Analysis .................................................................................................................................................. 10
Clinical Need and Target Population ........................................................................................................................... 10
Technology/Technique ................................................................................................................................................ 13
Evidence-Based Analysis .......................................................................................................................... 14
Research Question ....................................................................................................................................................... 14
Research Methods........................................................................................................................................................ 14
Statistical Analysis ...................................................................................................................................................... 15
Quality of Evidence ..................................................................................................................................................... 17
Results of Evidence-Based Analysis ........................................................................................................................... 18
Description of Included Studies .......................................................................................................................... 19
Description of Interventions ............................................................................................................................... 27
Quality of Life ..................................................................................................................................................... 35
Satisfaction with End-of-Life Care ..................................................................................................................... 37
Concordance ....................................................................................................................................................... 40
Completion of Advance Care Planning Documents and Processes .................................................................... 41
Health Care Use ................................................................................................................................................. 43
Summary of Findings .......................................................................................................................................... 51
Conclusions ................................................................................................................................................ 55
Acknowledgements ................................................................................................................................... 56
Appendices ................................................................................................................................................. 58
Appendix 1: Literature Search Strategies .................................................................................................................... 58
Appendix 2: Evidence Quality Assessment ................................................................................................................. 60
References .................................................................................................................................................. 67

Ontario Health Technology Assessment Series; Vol. 14: No. 19, pp. 1–72, December 2014 7
List of Tables
Table 1: Body of Evidence Examined According to Study Design ............................................................ 19 Table 2: Description of Included Studies .................................................................................................... 21 Table 3: Description of Interventions and Outcomes ................................................................................. 28 Table 4: Effect of Patient Care Planning Discussions on Patient’s Quality of Life .................................... 35 Table 5: Effect of Patient Care Planning Discussions on Informal Caregiver’s Quality of Life ................ 37 Table 6: Effect of Patient Care Planning Discussions on Patient’s Satisfaction with End-of-Life Care .... 37 Table 7: Effect of Patient Care Planning Discussions on Family’s Satisfaction with End-of-Life Care .... 39 Table 8: Effect of Patient Care Planning Discussions on Concordance between Patient’s Wishes
and Care Received ......................................................................................................................... 40 Table 9: Effect of Patient Care Planning Discussions on Concordance between Patient’s and Family’s
Wishes ............................................................................................................................................ 41 Table 10: Effect of Patient Care Planning Discussions on Completion of Advance Care Planning
Documents and Processes .............................................................................................................. 42 Table 11: Effect of Patient Care Planning Discussions on Receiving Chemotherapy at End-of-Life ........ 43 Table 12: Effect of Timing of Patient Care Planning Discussions on Receiving Chemotherapy
at End-of-Life ................................................................................................................................ 44 Table 13: Effect of Patient Care Planning Discussions on Resuscitation ................................................... 44 Table 14: Effect of Patient Care Planning Discussions on Receiving Hospital Care ................................. 45 Table 15: Effect of Timing of Patient Care Planning Discussions on Receiving Hospital Care ................ 45 Table 16: Effect of Patient Care Planning Discussions on Hospital Length of Stay .................................. 46 Table 17: Effect of Patient Care Planning Discussions on Emergency Department Visits ........................ 47 Table 18: Effect of Patient Care Planning Discussions on Intensive Care Unit Care ................................. 47 Table 19: Effect of Timing of Patient Care Planning Discussions on Intensive Care Unit Care ................ 48 Table 20: Effect of Patient Care Planning Discussions on Intensive Care Unit Length of Stay ................. 48 Table 21: Effect of Patient Care Planning Discussions on Home Health Visits ......................................... 49 Table 22: Effect of Patient Care Planning Discussions on Urgent Care Visits ........................................... 49 Table 23: Effect of Patient Care Planning Discussions on Other Outpatient Visits ................................... 50 Table 24: Effect of Patient Care Planning Discussions on Receiving Hospice Care .................................. 50 Table 25: Effect of Timing of Patient Care Planning Discussions on Receiving Hospice Care ................. 51 Table 26: Summary of the Highest Quality Evidence on Outcomes of Patient Care Planning
Discussions .................................................................................................................................... 52 Table 27: Summary of the Highest Quality Evidence on Timing of Patient Care Planning Discussions ... 54 Table A1: GRADE Evidence Profile for Comparison of Single-Provider Discussions and Usual Care
or No Discussion ............................................................................................................................ 60 Table A2: GRADE Evidence Profile for Comparison of Team-Based Discussions and Usual Care
or No Discussion ............................................................................................................................ 61 Table A3: GRADE Evidence Profile for Timing of Patient Care Planning Discussions............................ 63 Table A4: Risk of Bias among Randomized Controlled Trials for the Comparison of Single-Provider
Discussions and Usual Care or No Discussion .............................................................................. 64 Table A5: Risk of Bias among Randomized Controlled Trials for the Comparison of Team-Based
Discussions and Usual Care or No Discussion .............................................................................. 65 Table A6: Risk of Bias among Observational Trials for the Comparison of Single-Provider
Discussions and Usual Care or No Discussion .............................................................................. 65 Table A7: Risk of Bias among Observational Trials for the Comparison of Team-Based Discussions
and Usual Care or No Discussion .................................................................................................. 66

Ontario Health Technology Assessment Series; Vol. 14: No. 19, pp. 1–72, December 2014 8
List of Figures
Figure 1: CARENET’s Model for Improving Communication about End-of-Life Care ............................ 12 Figure 2: Citation Flow Chart ..................................................................................................................... 18

Ontario Health Technology Assessment Series; Vol. 14: No. 19, pp. 1–72, December 2014 9
List of Abbreviations
ACP Advance care planning
CARENET Canadian Researchers at the End of Life Network
CI Confidence interval
CINAHL Cumulative Index to Nursing & Allied Health Literature
EBA Evidence-based analysis
EoL End of life
GRADE Grading of Recommendations Assessment, Development, and Evaluation
HQO Health Quality Ontario
OR Odds ratio
PCPD Patient care planning discussion
QODD Quality of dying and death
QoL Quality of life
RCT Randomized controlled trial
SR Systematic review

Ontario Health Technology Assessment Series; Vol. 14: No. 19, pp. 1–72, December 2014 10
Background
Objective of Analysis
This evidence-based analysis (EBA) aimed to examine the effectiveness of patient care planning
discussions (PCPDs) in achieving better patient-centred outcomes for people at the end of life (EoL). This
EBA is particularly focused on the effectiveness of having a discussion that includes a single health care
provider, having a discussion that includes an interprofessional team of health care providers, and the
timing of discussions about EoL care. This EBA is part of a mega-analysis focused on EoL care.
Clinical Need and Target Population
End-of-Life Population
It is difficult to know in advance when patients are definitely at the EoL; hence, EoL is defined on the
basis of assumptions about a person’s risk of dying. These assumptions tend to be related: the period in
which the person is expected to die; eligibility for certain health services (e.g., hospice care, palliative
In July 2013, the Evidence Development and Standards (EDS) branch of Health Quality Ontario (HQO) began work on developing an evidentiary framework for end of life care. The focus was on adults with advanced disease who are not expected to recover from their condition. This project emerged from a request by the Ministry of Health and Long-Term Care that HQO provide them with an evidentiary platform on strategies to optimize the care for patients with advanced disease, their caregivers (including family members), and providers.
After an initial review of research on end-of-life care, consultation with experts, and presentation to the Ontario Health Technology Advisory Committee (OHTAC), the evidentiary framework was produced to focus on quality of care in both the inpatient and the outpatient (community) settings to reflect the reality that the best end-of-life care setting will differ with the circumstances and preferences of each client. HQO identified the following topics for
analysis: determinants of place of death, patient care planning discussions, cardiopulmonary resuscitation,
patient, informal caregiver and healthcare provider education, and team-based models of care. Evidence-based analyses were prepared for each of these topics.
HQO partnered with the Toronto Health Economics and Technology Assessment (THETA) Collaborative to evaluate the cost-effectiveness of the selected interventions in Ontario populations. The economic models used administrative data to identify an end-of-life population and estimate costs and savings for interventions with significant estimates of effect. For more information on the economic analysis, please contact Murray Krahn at [email protected].
The End-of-Life mega-analysis series is made up of the following reports, which can be publicly accessed at http://www.hqontario.ca/evidence/publications-and-ohtac-recommendations/ohtas-reports-and-ohtac-recommendations.
End-of-Life Health Care in Ontario: OHTAC Recommendation
Health Care for People Approaching the End of Life: An Evidentiary Framework
Effect of Supportive Interventions on Informal Caregivers of People at the End of Life: A Rapid Review
Cardiopulmonary Resuscitation in Patients with Terminal Illness: An Evidence-Based Analysis
The Determinants of Place of Death: An Evidence-Based Analysis
Educational Intervention in End-of-Life Care: An Evidence-Based Analysis
End-of-Life Care Interventions: An Economic Analysis
Patient Care Planning Discussions for Patients at the End of Life: An Evidence-Based Analysis
Team-Based Models for End-of-Life Care: An Evidence-Based Analysis

Ontario Health Technology Assessment Series; Vol. 14: No. 19, pp. 1–72, December 2014 11
care); or the part of life in which patients, family members, informal caregivers, and health care providers
struggle with the implications of a chronic illness that has progressed to advanced stages. (1)
Because each of the commonly used definitions of EoL is quite narrow, this EBA and the mega-analysis
aimed to be inclusive by defining EoL broadly. Thus, the EoL population was defined as adult patients with
advanced disease not expected to recover from their condition or stabilize. This population included people
who were seriously or terminally ill, those whom clinicians believed were at the EoL, and those receiving
palliative care. This definition aims to incorporate the 3 approaches to identifying patients at the EoL.
From 2007 to 2009, the 3 most recent years for which complete data were available, 264,503 persons died
in Ontario. Of these, 261,135 persons (98.7%) were adults aged 18 and older, and chronic, prolonged
conditions accounted for most deaths in this group. In Ontario, the top 10 causes of death in 2009 were
cancer (29.5%), diseases of the heart (20.9%), cerebrovascular diseases (6.2%), accidents (4.4%), chronic
lower respiratory illnesses (4.2%), diabetes mellitus (3.2%), Alzheimer’s disease (2.5%), influenza and
pneumonia (2.4%), kidney-related diseases (1.4%), and suicide (1.4%). (2) Most of these are advanced
chronic conditions, so the above definition is appropriate for identifying the EoL population in Ontario.
Quality of End-of-Life Care and Communication
Quality of EoL care is a domain of the multidimensional quality of dying and death construct (QODD).
The QODD consists of 7 broad and overlapping domains: physical, psychological, social, spiritual or
existential, nature of health care, life course and death preparation, and circumstances of death. The
quality of EoL care depends on the extent to which the health care patients receive affects outcomes in
those domains. (3) Additionally, good-quality EoL care must be informed by the best available evidence
when appropriate. (4) The health care received should thus be related to a plan of care; the patient’s and
family’s goals, values, needs, and so forth; receiving services that are consistent with the care plan; and
applying the best available evidence, among other things. (4)
Open and honest communication between patients, families, and health care providers is essential for
achieving good-quality EoL care. Communication exchanges information between patients and providers,
(5) and it can help to inform patients about their condition, prognosis, and treatment options as well as
elicit patients’ goals, values, and preferences. Given that PCPDs include advance care planning (ACP)
and goals of care discussions, this type of intervention can help to improve communication about EoL
care. They are important for obtaining informed consent and for sharing decision-making.
Ontario law specifies that, even when an advanced care plan or do-not-resuscitate (DNR) order is in
place, decisions about treatments cannot be made without informed consent, which requires health care
providers to discuss care options with patients or their substitute decision makers. (6) Patient care
planning discussions are thus a necessary and important component of decision-making in health care.
Advance care plans and DNR orders are outputs from the PCPDs, and they should be updated if a
patient’s wishes, values, or beliefs related to care change in any way. More recent expressions of care
preferences take precedence over older ones, even if the older ones are written and the more recent ones
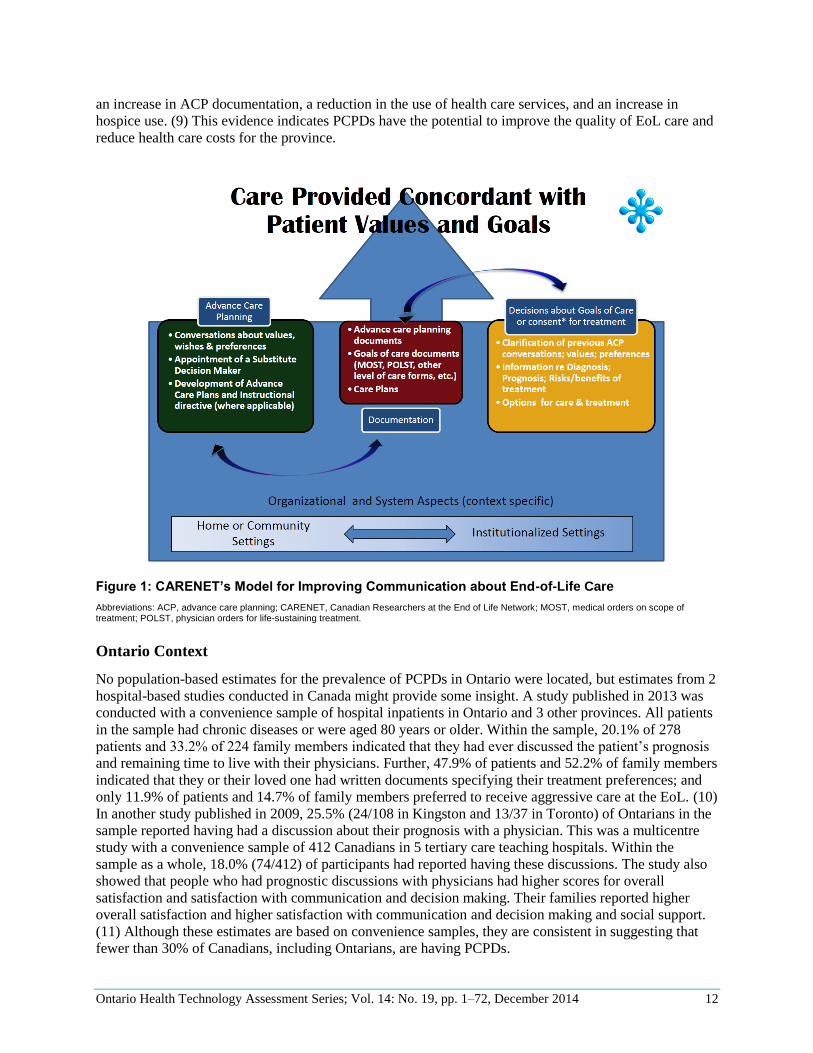
are verbal. Communication about EoL care has thus become an area of focus for the Canadian
Researchers at the End of Life Network (CARENET), a group focused on improving palliative and EoL
care. Their conceptual model for improving communication about EoL care is presented in Figure 1.
Results from recent systematic reviews show that these discussions can be beneficial. For instance, family
meetings are associated with lower health care use, and palliative care teams are associated with better
use of health care. (7) Palliative care consultations and conferences are associated with increased family
satisfaction, improved decision making, and reduced health care use. (8) Ethics consultations also show
benefits, because they lead to improved health care use. (7;8) Last, ACP interventions are associated with
Ontario Health Technology Assessment Series; Vol. 14: No. 19, pp. 1–72, December 2014 12
an increase in ACP documentation, a reduction in the use of health care services, and an increase in
hospice use. (9) This evidence indicates PCPDs have the potential to improve the quality of EoL care and
reduce health care costs for the province.
Figure 1: CARENET’s Model for Improving Communication about End-of-Life Care
Abbreviations: ACP, advance care planning; CARENET, Canadian Researchers at the End of Life Network; MOST, medical orders on scope of treatment; POLST, physician orders for life-sustaining treatment.
Ontario Context
No population-based estimates for the prevalence of PCPDs in Ontario were located, but estimates from 2
hospital-based studies conducted in Canada might provide some insight. A study published in 2013 was
conducted with a convenience sample of hospital inpatients in Ontario and 3 other provinces. All patients
in the sample had chronic diseases or were aged 80 years or older. Within the sample, 20.1% of 278
patients and 33.2% of 224 family members indicated that they had ever discussed the patient’s prognosis
and remaining time to live with their physicians. Further, 47.9% of patients and 52.2% of family members
indicated that they or their loved one had written documents specifying their treatment preferences; and
only 11.9% of patients and 14.7% of family members preferred to receive aggressive care at the EoL. (10)
In another study published in 2009, 25.5% (24/108 in Kingston and 13/37 in Toronto) of Ontarians in the
sample reported having had a discussion about their prognosis with a physician. This was a multicentre
study with a convenience sample of 412 Canadians in 5 tertiary care teaching hospitals. Within the
sample as a whole, 18.0% (74/412) of participants had reported having these discussions. The study also
showed that people who had prognostic discussions with physicians had higher scores for overall
satisfaction and satisfaction with communication and decision making. Their families reported higher
overall satisfaction and higher satisfaction with communication and decision making and social support.
(11) Although these estimates are based on convenience samples, they are consistent in suggesting that
fewer than 30% of Canadians, including Ontarians, are having PCPDs.

Ontario Health Technology Assessment Series; Vol. 14: No. 19, pp. 1–72, December 2014 13
Patient care planning discussions also have the potential to meaningfully reduce health care costs in
Ontario. Care at the EoL is quite costly for Ontarians, and these costs are expected in increase as the
population ages. In 2009–2010, Ontario’s health budget was approximately $44.8 billion. The province
spends an estimated 9% of its health budget on EoL care. (Ba’ Pham, personal communication, March 19,
2014) Additionally, a report from the Canadian Institute for Health Information states that care for seniors
older than 65 years accounted for 44.0% of average health care spending at the national level in 2000 and
45.0% in 2011. This was because of the high cost of EoL care and because health care use for chronic
conditions increases with age. (12)
Technology/Technique
“Patient care planning discussions” is an umbrella term used to describe discussions that usually lead to a
written medical and nursing care program specifically designed for a particular patient. It encompasses
advance care planning or goals of care conversations (i.e., discussions with patients and/or their substitute
decision makers about the goals and desired direction of their care). (13) There are many interventions for
patient care planning, but this EBA focuses on discussion interventions for reasons described above.
Discussions are complex interventions, because their multiple components can affect their efficacy.
Although they can take different forms depending on the context, they adhere to an underlying structure.
(14) These interventions can vary by setting, health care personnel, frequency, topics discussed, intensity,
structure, and so forth, and therefore must be broken into their constituent parts when they are being
evaluated, and each part must be assessed separately. This EBA has deconstructed PCPDs to assess the
number of providers involved and the timing of discussions.

Ontario Health Technology Assessment Series; Vol. 14: No. 19, pp. 1–72, December 2014 14
Evidence-Based Analysis
Research Question
Which approaches to patient care planning discussions (PCPDs) optimize the quality of end-of-life (EoL)
care for patients with advanced disease, informal caregivers, and providers?
Research Methods
Literature Search Strategy
A literature search was performed on October 9, 2013, using Ovid MEDLINE, Ovid MEDLINE In-
Process and Other Non-Indexed Citations, Ovid Embase, EBSCO Cumulative Index to Nursing & Allied
Health Literature (CINAHL), and EBM Reviews, for studies published from January 1, 2004, to October
9, 2013. (Appendix 1 provides details of the search strategies.) Abstracts were reviewed by a single
reviewer and, for those studies meeting the eligibility criteria, full-text articles were obtained. Reference
lists were also examined for any additional relevant studies not identified through the search.
Inclusion Criteria
English-language full-text publications
published between January 1, 2004, and October 9, 2013
randomized controlled trials (RCTs), systematic reviews (SRs), meta-analyses, and
observational studies
adult patients (aged 18 and older) with advanced disease or who are seriously ill and whose
health is likely to continue to deteriorate
adult patients at the EoL
communication between providers and patients
communication between providers and families
communication between patients and their families
goals of care or PCPDs, conferences, conversations, or consultations
Exclusion Criteria
related to sudden or violent death
non-SRs, case reports, editorials, letters, comments, conference abstracts
include children only (younger than 18 years)
most participants are children
Outcomes of Interest
primary outcome is quality of life (QoL)
secondary outcomes are the following:
– patient satisfaction
– family satisfaction

Ontario Health Technology Assessment Series; Vol. 14: No. 19, pp. 1–72, December 2014 15
– concordance between patient’s wishes and care received
– concordance between patient’s wishes and family’s or substitute decision maker’s wishes
– completion of advance care planning processes or documentation
– health care use
Statistical Analysis
Data Extraction
Data were extracted from the studies with a standardized data form. The form collected information about
the following:
Source (i.e., citation information, contact details, study type);
Methods (i.e., study design, study duration and years, participant allocation, allocation
sequence concealment, blinding, reporting of missing data, reporting of outcomes, and
whether or not the study compared 2 or more groups);
Outcomes (i.e., outcomes measured, number of participants for each outcome, number of
participants missing for each outcome, outcome definition and source of information, unit of
measurement, upper and lower limits [for scales], and time points at which the outcome was
assessed);
Participants (i.e., number of participants, population, diseases and conditions represented,
setting, country, age, sex, proportion of racial minorities, proportion of immigrants,
proportion of Canadian Aboriginals, marital status, education level, and income or poverty
status);
Intervention (number of intervention groups, type of intervention, individuals and
professional groups present for the discussions, number of participants in each arm of the
study, initiator of the discussion, use of a communication tool to facilitate the discussion,
structure of the discussion, timing of the discussion, content of the discussion, and frequency
of discussions);
Results (i.e., summary data for each intervention group, effect estimates, and confidence
intervals or P values for each effect estimate); and
Other information (i.e., funding source, key conclusions, other information to guide the
review, and whether the study’s authors needed to be contacted).
Authors of the studies were contacted to provide unpublished data when required for comparisons and
meta-analysis.
Assessment of Risk of Bias in Included Primary Studies
The risk of bias assessment was guided by a modified version of the tool in the Cochrane Handbook for
Systematic Reviews of Interventions. (15) For randomized controlled trials, bias assessment considered
selection bias (i.e., allocation concealment), performance bias (i.e., blinding of participants and health
care providers), attrition bias (i.e., incomplete outcome data), reporting bias (i.e., selective outcome
reporting), and other limitations (e.g., related to study design). For observational studies, the tool
considered selection bias (i.e., appropriate eligibility criteria, adequate control for confounding),
measurement bias (i.e., appropriate measurement of exposures and outcomes), and attrition bias (i.e.,
incomplete follow-up). The results of bias assessment are presented in Appendix 2 and were used to
assess the overall quality of evidence for each outcome.

Ontario Health Technology Assessment Series; Vol. 14: No. 19, pp. 1–72, December 2014 16
Assessment of Publication Bias
Funnel plots were used to assess potential publication biases, and the results of these assessments were
used to rate the quality of the evidence for each outcome (Appendix 2).
Data Synthesis
The studies were divided into 2 subgroups on the basis of whether or not they included patient care
planning discussions (PCPDs) with one provider (single-provider) or an interprofessional team of
providers working in a coordinated way (team-based). Within the subgroups, studies were pooled if they
employed the same study design and used (or did not use) a tool to facilitate discussions.
The EoL population was defined broadly, and this systematic review is concerned with the average
effectiveness of PCPDs on EoL care, so a great deal of heterogeneity in the results was expected given the
diversity in the EoL population. Hence, while the I2 statistic was used to assess heterogeneity in the meta-
analyses, it was not used to determine whether or not the results should be pooled. According to the
Cochrane Handbook for Systematic Reviews of Interventions, heterogeneity of 0–40% may not be
important, heterogeneity between 30% and 60% is moderate, heterogeneity from 50% to 90% is
substantial, and heterogeneity between 75% and 100% is considerable. (15) Notably, the importance of I2
in assessing heterogeneity depends on the magnitude and direction of the effect estimates and the strength
of the evidence for heterogeneity. Given the diversity in the population, certain judgments needed to be
made about heterogeneity.
Results were pooled only when the confidence intervals for their effect estimates overlapped. If the I2
statistic was greater than 50% and the confidence intervals overlapped, then a random effects model was
used to pool the estimates. If the I2 statistic was greater than 50% and the confidence intervals did not
overlap, the estimates were not pooled. Additional, steps were taken to explain potential reasons for
heterogeneity in the studies. For instance, the diseases and conditions in the population, the country and
setting, the outcomes measured, and the demographic characteristics of the samples were considered.

Ontario Health Technology Assessment Series; Vol. 14: No. 19, pp. 1–72, December 2014 17
Quality of Evidence
The quality of the body of evidence for each outcome was examined according to the Grading of
Recommendations Assessment, Development, and Evaluation (GRADE) Working Group criteria. (16)
The overall quality was determined to be high, moderate, low, or very low using a step-wise, structural
methodology.
Study design was the first consideration; the starting assumption was that randomized controlled trials
(RCTs) are high quality, whereas observational studies are low quality. Five additional factors—risk of
bias, inconsistency, indirectness, imprecision, and publication bias—were then taken into account.
Limitations in these areas resulted in downgrading the quality of evidence. Finally, 3 main factors that can
raise the quality of evidence from observation studies were considered: large magnitude of effect, dose-
response gradient, and accounting for all residual confounding factors. (16) For more detailed
information, please refer to the latest series of GRADE articles. (16)
As stated by the GRADE Working Group, the final quality score can be interpreted using the following
definitions:
High High confidence in the effect estimate—the true effect lies close to the estimate of the
effect
Moderate Moderate confidence in the effect estimate—the true effect is likely to be close to the
estimate of the effect, but may be substantially different
Low Low confidence in the effect estimate—the true effect may be substantially different
from the estimate of the effect
Very Low Very low confidence in the effect estimate—the true effect is likely to be substantially
different from the estimate of effect

Ontario Health Technology Assessment Series; Vol. 14: No. 19, pp. 1–72, December 2014 18
Results of Evidence-Based Analysis
The database search yielded 5,314 citations published between January 1, 2004, and October 9, 2013
(with duplicates removed). Articles were excluded on the basis of information in the title and abstract.
The full texts of potentially relevant articles were obtained for further assessment. Figure 2 shows the
breakdown of when and for what reason citations were excluded from the analysis.
Fifty-two studies (10 systematic reviews, 13 RCTs, and 29 observational studies) met the inclusion
criteria. The reference lists of these studies were hand-searched to identify other relevant studies, and 2
additional citations (2 observational studies) were included, for a total of 54.
Figure 2: Citation Flow Chart
Abbreviations: EoL, end of life; RCT, randomized controlled trial.
Search results (excluding duplicates) n = 5,314
Study abstracts reviewed n = 1,101
Full-text studies reviewed n = 370
Included Studies (54)
Systematic reviews: n = 10
RCTs: n = 13a
Observational studies: n = 31b
Additional citations identified n = 2
Citations excluded on basis of title n = 4,213
Citations excluded on basis of abstract n = 731
Citations excluded on basis of full text n = 317
Reasons for exclusion
Abstract review: Excluded nonhuman population (n = 0); related to sudden or violent death (n = 1); healthy or well population (n = 9); not about EoL care (n = 7); about death trajectories (n = 5); study type (n = 612); not about care discussions (n = 73); includes children only (n = 20); most participants are children (n = 4)
Full-text review: Excluded non-English (n = 2); duplicate publication (n = 2); topic not relevant or unrelated to care discussions (n = 211); noninterventional (n = 97); outcomes of interest not reported (n = 12); qualitative study (n = 3)
aTwo reports were from the same study. Includes 1 cluster RCT.
bIncludes non-RCTs.

Ontario Health Technology Assessment Series; Vol. 14: No. 19, pp. 1–72, December 2014 19
For each included study, the study design was identified and is summarized below in Table 1, a modified
version of a hierarchy of study design by Goodman. (17)
Table 1: Body of Evidence Examined According to Study Design
Study Design Number of Eligible Studies
RCTs
Systematic review of RCTs 1
Large RCT 10a
Small RCT 3
Observational Studies
Systematic review of non-RCTs with contemporaneous controls 3
Non-RCT with contemporaneous controls 11
Systematic review of non-RCTs with historical controls 6
Non-RCT with historical controls 3
Database, registry, or cross-sectional study 3
Case series
Retrospective review, modelling 14
Studies presented at international conference
Expert opinion
Total 54
Abbreviation: RCT, randomized controlled trial. aTwo reports were from the same study. Includes one cluster RCT.
Systematic reviews and observational studies with low-quality designs were excluded from the analyses
for this EBA. As mentioned previously, the search for this EBA identified 10 systematic reviews. While
these systematic reviews were used to provide background information about the topic, they were not
included in the analyses, because none included the populations, (7;8) interventions, (9;18-22) and
outcomes (23) that were the focus of this EBA. Further, 1 of the systematic reviews was an overview of
other systematic reviews. (24) Studies with the lowest-quality designs, as assessed through Goodman’s
hierarchy in Table 1, were excluded from further analyses. Some of these studies were retrospective and
based on data collected from chart reviews; (25-34) the rest did not provide unadjusted estimates. (35-38)
Description of Included Studies
The analyses for this EBA used data from 30 studies, and details about their characteristics and
participants are presented in Table 2. Nine of the 13 RCTs had more than 50 participants in each
intervention arm. (39-47) Eight of the RCTs were conducted in the United States, (40-43;46-50) 2 were
conducted in the United Kingdom, (51;52) 2 were conducted in Australia, (39;44) and 1 was conducted in
France. (45) They all included older adults who had a variety of diseases and conditions, such as cancer,
chronic heart failure, chronic obstructive pulmonary disease, and dementia. The RCTs included men and
women, and although most participants were white, they included ethno-racial minorities as well.
The EBA includes a total of 17 observational studies. Eleven of the observational studies had
contemporaneous controls, (53-63) and like the RCTS, most of these studies had more than 50
participants in each intervention arm. (53;55;56;58-61) The participants in these observational studies
also tended to be older, had a variety of diseases and conditions, and were ethno-racially diverse. All of
these studies were conducted in the United States. Another 3 observational studies from the United States

Ontario Health Technology Assessment Series; Vol. 14: No. 19, pp. 1–72, December 2014 20
had historical controls, (64-66) and 2 had more than 50 participants in each intervention arm. (65;66)
They all included older adults and had mixed disease populations, and most participants were white. Last,
there were 3 cross-sectional studies, (11;67;68) 2 of which had more than 50 people in each intervention
arm. (67;68) Two of the cross-sectional studies were disease-specific and from the United States, (67;68)
but one was conducted in Canada with a mixed disease population. (11)

Ontario Health Technology Assessment Series; Vol. 14: No. 19, pp. 1–72, December 2014 21
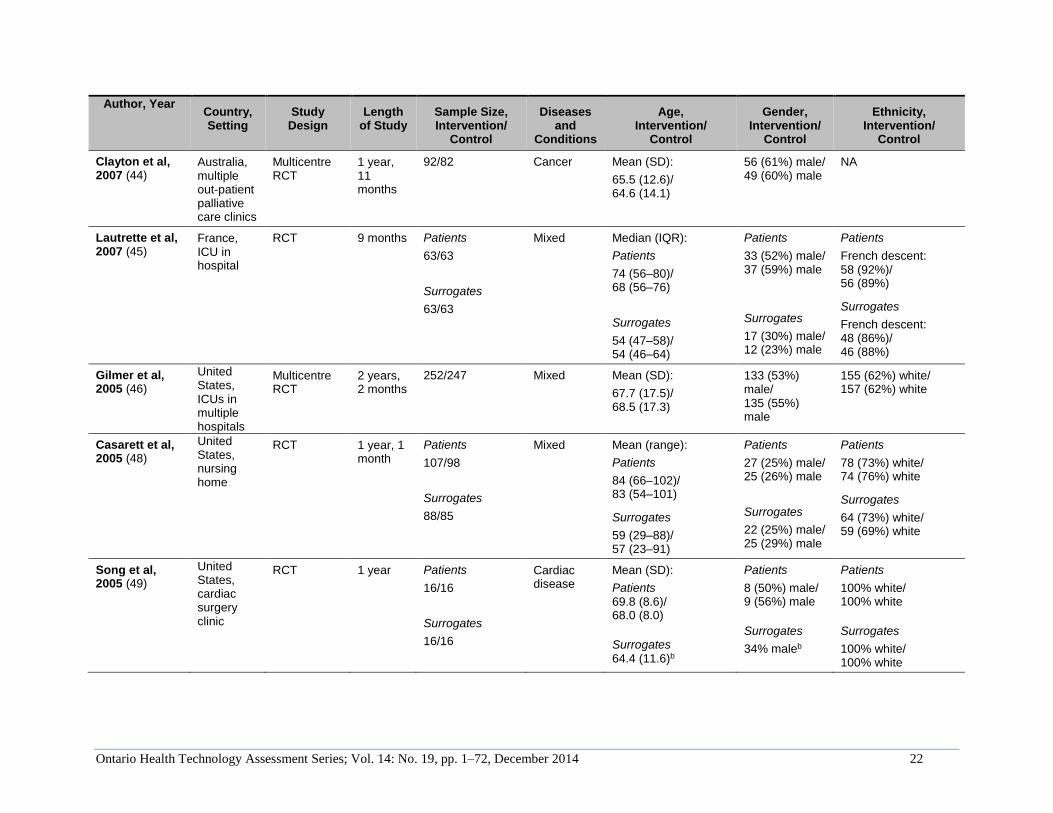
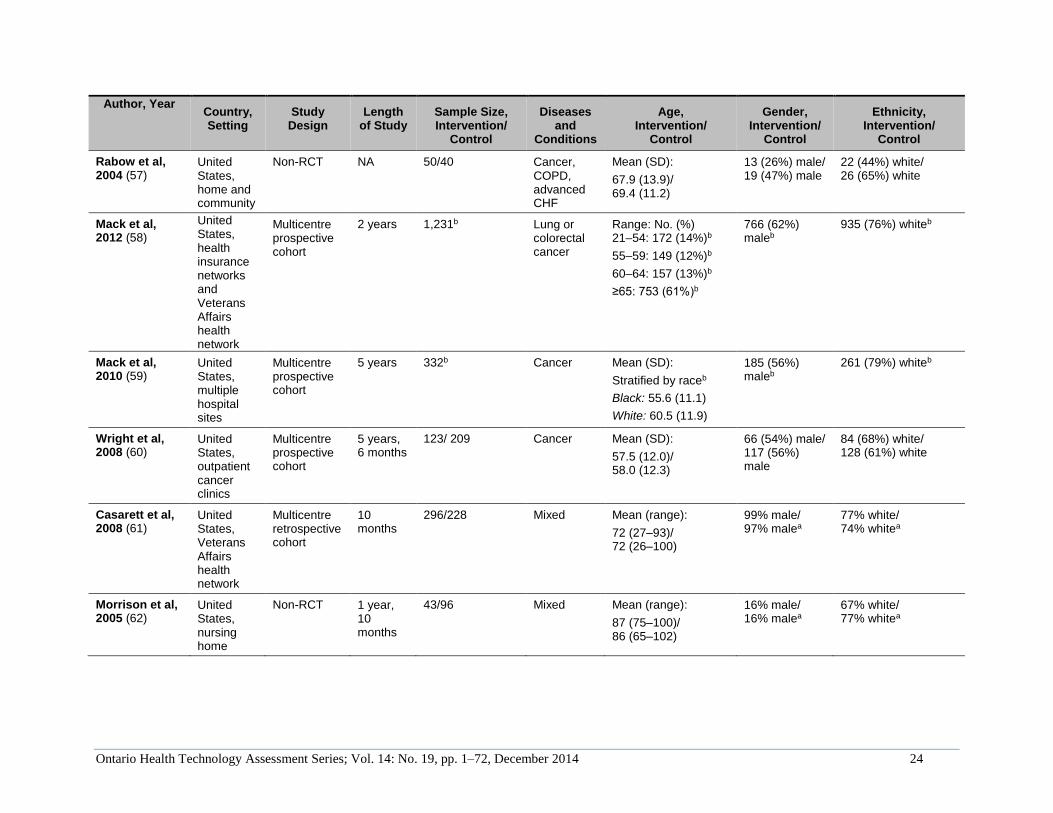
Table 2: Description of Included Studies
Author, Year Country, Setting
Study Design
Length of Study
Sample Size, Intervention/
Control
Diseases and
Conditions
Age, Intervention/
Control
Gender, Intervention/
Control
Ethnicity, Intervention/
Control
RCTs
Kirchhoff et al, 2012; (40) Kirchhoff et al, 2010 (41)
United States, multiple outpatient clinics
Multicentre RCT
3 years, 7 months
Patients
160/153
Surrogates
160/153
CHF, ESRD
Mean (SD):
Patients
71.4 (12.2)/ 70.6 (11.6)
Surrogates
59.5 (13.9)/ 57.4 (13.6)
Patients
96 (60%) male/ 89 (58%) male
Surrogates
43 (27%) male/ 41 (27%) male
Patients
149 (93%) white/ 146 (95%) white
Surrogates
153 (96%) white/ 147 (96%) white
Au et al, 2012 (42)
United States, hospital
Clustered RCT
3 years, 11 months
194/182 COPD Mean (SD):
69.4 (10.0)/ 69.4 (10.0)
98% male/ 96% malea
85% white/ 87% whitea
Sampson et al, 2011 (51)
United Kingdom, palliative care unit in hospital
RCT 6 months Patients
22/10
Carers
22/10
Dementia Mean (SD):
Patients 87 (6.1)/ 85 (6.6)
Carers 60 (13.0)/ 57 (12.0)
Patients
5 (23%) male/ 1 (10%) male
Carers
14 (64%) male/ 3 (30%) male
Patients
20 (91%) white/ 7 (78%) white
Carers
20 (91%) white/ 8 (80%) white
Detering et al, 2010 (39)
Australia, multiple medical units in hospital
RCT 8 months 154/155 Mixed Median (IQR):
85 (82-88)/ 84 (81-87)
83 (54%) male/ 64 (41%) male
Includes minoritiesa
Gade et al, 2008 (43)
United States, hospitals
Multicentre RCT
1 year, 7 months
275/237 Mixed Mean (SD):
73.6 (12.6)/ 73.1 (13.2)
113 (41%) male/ 116 (49%) male
NA
Ontario Health Technology Assessment Series; Vol. 14: No. 19, pp. 1–72, December 2014 22
Author, Year Country, Setting
Study Design
Length of Study
Sample Size, Intervention/
Control
Diseases and
Conditions
Age, Intervention/
Control
Gender, Intervention/
Control
Ethnicity, Intervention/
Control
Clayton et al, 2007 (44)
Australia, multiple out-patient palliative care clinics
Multicentre RCT
1 year, 11 months
92/82 Cancer Mean (SD):
65.5 (12.6)/ 64.6 (14.1)
56 (61%) male/ 49 (60%) male
NA
Lautrette et al, 2007 (45)
France, ICU in hospital
RCT 9 months Patients
63/63
Surrogates
63/63
Mixed Median (IQR):
Patients
74 (56–80)/ 68 (56–76)
Surrogates
54 (47–58)/ 54 (46–64)
Patients
33 (52%) male/ 37 (59%) male
Surrogates
17 (30%) male/ 12 (23%) male
Patients
French descent: 58 (92%)/ 56 (89%)
Surrogates
French descent: 48 (86%)/ 46 (88%)
Gilmer et al, 2005 (46)
United States, ICUs in multiple hospitals
Multicentre RCT
2 years, 2 months
252/247 Mixed Mean (SD):
67.7 (17.5)/ 68.5 (17.3)
133 (53%) male/ 135 (55%) male
155 (62%) white/ 157 (62%) white
Casarett et al, 2005 (48)
United States, nursing home
RCT 1 year, 1 month
Patients
107/98
Surrogates
88/85
Mixed Mean (range):
Patients
84 (66–102)/ 83 (54–101)
Surrogates
59 (29–88)/ 57 (23–91)
Patients
27 (25%) male/ 25 (26%) male
Surrogates
22 (25%) male/ 25 (29%) male
Patients
78 (73%) white/ 74 (76%) white
Surrogates
64 (73%) white/ 59 (69%) white
Song et al, 2005 (49)
United States, cardiac surgery clinic
RCT 1 year Patients
16/16
Surrogates
16/16
Cardiac disease
Mean (SD):
Patients 69.8 (8.6)/ 68.0 (8.0)
Surrogates 64.4 (11.6)b
Patients
8 (50%) male/ 9 (56%) male
Surrogates
34% maleb
Patients
100% white/ 100% white
Surrogates
100% white/ 100% white

Ontario Health Technology Assessment Series; Vol. 14: No. 19, pp. 1–72, December 2014 23
Author, Year Country, Setting
Study Design
Length of Study
Sample Size, Intervention/
Control
Diseases and
Conditions
Age, Intervention/
Control
Gender, Intervention/
Control
Ethnicity, Intervention/
Control
Nicolasora et al, 2006 (47)
United States, medical unit in hospital
RCT 3 months 136/161 Mixed Median: 65/69 54% male/ 46% malea
77% white/ 70% whitea
Dyar et al, 2012 (50)
United States, hospital
RCT 9 months 12/14 Cancer Mean (SD):
66.7 (16.3)/ 64.9 (7.5)
25% male/ 36% male
NA
Jones et al, 2011 (52)
United States, multiple outpatient clinics
Multicentre RCT
1 year, 9 months
Preference cohort
21/14
Randomized cohort
22/20
Cancer Mean (SD):
Preference cohort
62.0 (11.0)/
67.7 (7.9)
Randomized cohort
58.6 (8.1)/
60.2 (13.3)
Preference cohort
48% male/ 50% malea
Randomized cohort
57% male/ 50% male
Preference cohort
95% white/ 93% whitea
Randomized cohort
86% white/ 95% whitea
Observational with contemporaneous controls
Evangelista et al, 2012 (54)
United States, hospital
Prospective case-control
5 months 36/36 Mixed Mean (SD):
53.9 (8.3)/
53.3 (8.7)
26 (72%) male/ 25 (69%) male
22 (61%) white/ 22 (61%) white
Jacobsen et al, 2011 (55)
United States, hospital
Non-RCT 7 months 517/382 NA Mean:
62.9/63.5
308 (60%) male/ 217 (57%) male
NA
Engelhardt et al, 2009 (56)
United States, health insurance network
Multicentre non-RCT
NA Patients
198/205
Informal Caregivers
100/85
Mixed Mean (SD):
Patients
66.0 (12.1)/ 68.4 (12.1)
Informal Caregivers,
59.9 (14.6)/ 63.8 (13.1)
Patients
63 (32%) male/ 108 (53%) male
Informal Caregivers
40 (41%) male/ 9 (12%) male
Patients
167 (85%) white/ 183 (91%) white
Informal Caregivers
NA
Ontario Health Technology Assessment Series; Vol. 14: No. 19, pp. 1–72, December 2014 24
Author, Year Country, Setting
Study Design
Length of Study
Sample Size, Intervention/
Control
Diseases and
Conditions
Age, Intervention/
Control
Gender, Intervention/
Control
Ethnicity, Intervention/
Control
Rabow et al, 2004 (57)
United States, home and community
Non-RCT NA 50/40 Cancer, COPD, advanced CHF
Mean (SD):
67.9 (13.9)/ 69.4 (11.2)
13 (26%) male/ 19 (47%) male
22 (44%) white/ 26 (65%) white
Mack et al, 2012 (58)
United States, health insurance networks and Veterans Affairs health network
Multicentre prospective cohort
2 years 1,231b Lung or colorectal cancer
Range: No. (%) 21–54: 172 (14%)b
55–59: 149 (12%)b
60–64: 157 (13%)b
≥65: 753 (61%)b
766 (62%) maleb
935 (76%) whiteb
Mack et al, 2010 (59)
United States, multiple hospital sites
Multicentre prospective cohort
5 years 332b Cancer Mean (SD):
Stratified by raceb
Black: 55.6 (11.1)
White: 60.5 (11.9)
185 (56%) maleb
261 (79%) whiteb
Wright et al, 2008 (60)
United States, outpatient cancer clinics
Multicentre prospective cohort
5 years, 6 months
123/ 209 Cancer Mean (SD):
57.5 (12.0)/ 58.0 (12.3)
66 (54%) male/ 117 (56%) male
84 (68%) white/ 128 (61%) white
Casarett et al, 2008 (61)
United States, Veterans Affairs health network
Multicentre retrospective cohort
10 months
296/228 Mixed Mean (range):
72 (27–93)/ 72 (26–100)
99% male/ 97% malea
77% white/ 74% whitea
Morrison et al, 2005 (62)
United States, nursing home
Non-RCT 1 year, 10 months
43/96 Mixed Mean (range):
87 (75–100)/ 86 (65–102)
16% male/ 16% malea
67% white/ 77% whitea

Ontario Health Technology Assessment Series; Vol. 14: No. 19, pp. 1–72, December 2014 25
Author, Year Country, Setting
Study Design
Length of Study
Sample Size, Intervention/
Control
Diseases and
Conditions
Age, Intervention/
Control
Gender, Intervention/
Control
Ethnicity, Intervention/
Control
Zhang et al, 2009 (53)
United States, multiple hospitals
Multicentre prospective cohort
5 years, 4 months
188/415 Cancer Mean (SD):
59.8 (12.9)/ 58.6 (13.2)
51% male/ 51% malea
74% white/ 70% whitea
Briggs et al, 2004 (63)
United States, multiple units in a hospital
Non-RCT NA Patients
13/14
Surrogates
13/14
Heart failure, renal failure
Mean (SD):
Patients
68.7 (9.2)b
Surrogates
50 (14.8)b
Patients
39% male/ 79% malea
Surrogates
23% male/ 29% malea
NA
Observational with historical controls
Lamba et al, 2012 (64)
United States, surgical ICU in hospital
Prospective before and after
1 year, 1 month; 1 year, 3 months
31/21 Mixed Mean:
54/46
19 (61%) male/ 12 (57%) male
NA
Norton et al, 2007 (65)
United States, medical ICU in hospital
Prospective before and after
1 year, 1 month
126/65 Mixed Mean (SD):
66.3 (16.3)/ 68.8 (15.4)
57 (45%) male/ 33 (51%) male
95 (75%) white/ 51 (79%) white
Lindner et al, 2007 (66)
United States, nursing home
Prospective before and after
6 months 107/117 Mixed Mean (SD):
72 (12.2)/ 71 (12.3)
91% male/ 89% malea
70% white/ 57% whitea
Cross-sectional
Leung et al, 2012 (67)
United States, Veterans Affairs health network
Multicentre cross-sectional
2 years, 2 months
55/321 COPD Mean:
70.9/69.1
52 (95%) male/ 313 (98%) male
44 (80%) white/ 247 (77%) white

Ontario Health Technology Assessment Series; Vol. 14: No. 19, pp. 1–72, December 2014 26
Author, Year Country, Setting
Study Design
Length of Study
Sample Size, Intervention/
Control
Diseases and
Conditions
Age, Intervention/
Control
Gender, Intervention/
Control
Ethnicity, Intervention/
Control
Mori et al, 2013
(68) United States, hospital
Cross-sectional
2 years 20/29 Cancer Mean (SD):
60.1 (9.8)/ 67.5 (11.7)
10 (50%) male/ 14 (48%) male
NA
Heyland et al, 2009 (11)
Canada, multiple hospitals
Multicentre cross-sectional
NA Patients
74/338
Family members
46/107
Mixed Mean (SD):
Patients 67.6 (7.2)/ 71.9 (9.4)
Family members
56.6 (14.0)/ 57.4 (13.5)
Patients
51% male/ 51% malea
Family members
40% male/ 34% malea
NA
Abbreviations: CHF, chronic heart failure; COPD, chronic obstructive pulmonary disease; ESRD, end-stage renal disease; ICU, intensive care unit; IQR, interquartile range; NA, not available; RCT, randomized controlled trial; SD, standard deviation. aDisaggregated information was not provided. bData for the intervention and control arms were not provided separately.

Ontario Health Technology Assessment Series; Vol. 14: No. 19, pp. 1–72, December 2014 27
Description of Interventions
The interventions from each study are described in detail in Table 3. As the table shows, each intervention
was unique. Only 7 of the interventions were team-based, (43;45;46;57;61;64;65) and 16 of the
interventions included the use of a tool to facilitate patient care planning discussions (PCPDs). (39-
49;51;55;56;62;63;66) These tools included, but were not limited to, automated forms, frameworks,
models, question prompt lists, mnemonics, and structured questionnaires. In 7 of the studies, (11;53;58-
60;67;68) the intervention was compared with having no discussions; and in the rest of the studies, (39-
52;54-57;61-66) the intervention was compared with usual care.
The single-provider PCPD interventions were performed by a variety of providers. In some cases, the
intervention was delivered by a provider from one of several specified professional groups; (40;41;52;54-
56;63) in other cases, the intervention was delivered by a provider from only 1 specific professional
group. Medical doctors were included in 10 single-provider PCPD interventions, (42;44;47;48;52-
55;66;67) nurses were included in 8, (39-41;49;51;52;54;55;63) and social workers were included in 5.
(40;41;55;56;62;63) Chaplains were included in 2, (40;41;63) and nurse practitioners (50) and health
educators (56) were each included in 1 of the single-provider PCPD interventions. In 5 studies, the
profession of the provider was not specified. (11;58-60;68)
The team-based PCPDs included at least 2 providers from various professional groups. Six of the PCPD
teams included physicians, (43;45;57;61;64;65) 4 included nurses, (43;57;61;64) 4 included chaplains,
(43;57;61;65) 3 included social workers, (43;57;61) 2 included psychologists, (57;65) and 2 included
nurse practitioners. (61;65) Each of the following professions were included in only one intervention:
ethicist, (46) pharmacist, (57) art therapist, (57) volunteer coordinator, (57) volunteer, (61) counsellor,
(64) interfaith pastor, (64) music therapist, (65) and massage therapist. (65) Three studies did not specify
which professional groups were included in their interventions. (45;46;61) Additionally, the sizes of the
interprofessional teams varied. In one study, the intervention had 2 parts—the first part included 2
professional groups, and the second part included 4 professions. (64) Another intervention had a 4-
member team, (43) and 3 interventions had 6-member teams. (57;61;65) In 2 studies, the size of the
intervention team was not specified but was dependent on the patient’s needs. (45;46)
In most of the studies, the length and frequency of the PCPDs were not specified. However, in studies that
reported this information, the PCPDs lasted from 10 minutes to 3 hours and 20 minutes. (39-41;45;54;63)
Most discussions lasted between 30 and 60 minutes, however. In most studies, the discussion took place
once, but in some, (51;54;57) they took place over multiple sessions.
The discussions covered a variety of topics. The 4 most frequently covered topics were advance care
planning (ACP), (39-41;43;47-49;51;52;54-56;58;62-64;66;67) treatment options (including
resuscitation), (40;41;44;47-49;54-56;58;63;64;66) patients’ preferences, (40-42;46;47;50;51;53-
55;63;66) and patients’ goals. (39;43;48;54;55;62;64;66) Other commonly covered topics included
prognosis, physical or medical needs, patient and surrogate understanding and knowledge, social support
and needs, palliative services, and patients’ values.

Ontario Health Technology Assessment Series; Vol. 14: No. 19, pp. 1–72, December 2014 28
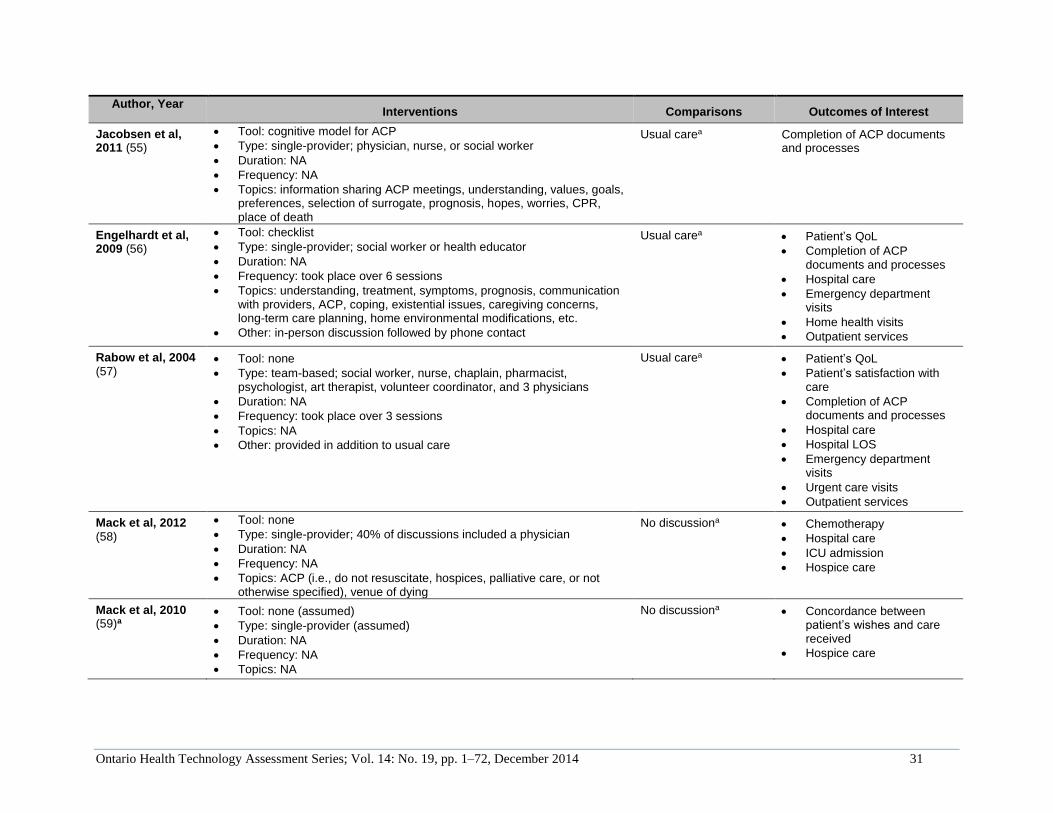
Table 3: Description of Interventions and Outcomes
Author, Year Interventions Comparisons Outcomes of Interest
Randomized controlled trials (RCTs)
Kirchhoff et al, 2012; (40) Kirchhoff et al, 2010 (41)
Tool: facilitation tool
Type: single-provider; nurse, social worker, or chaplain who was trained to deliver the intervention
Duration: 1.0−1.5 hours
Frequency: NA
Topics: patient and surrogate understanding, information about treatment, assistance with documentation of care preferences, surrogate understanding of patient preferences, preparing surrogate to make decisions that honour patient preferences; completion of STP
Usual care: standard AD counseling, assessment of AD on admission, question whether patient wanted more information, referrals according to institutional protocol
Concordance between patient wishes and care received
Concordance between patient’s and surrogate’s wishes
Au et al, 2012 (42) Tool: automated form
Type: single-provider; physician
Duration: NA
Frequency: NA
Topics: barriers and facilitators to EoL communication, patient preferences
Usual carea Completion of ACP documents and processes
Sampson et al, 2011 (51)
Tool: framework
Type: single-provider; nurse
Duration: NA
Frequency: up to 4 consultations at least 5 days apart
Topics: knowledge; illness severity and prognosis; patient’s physical needs; social situation and social support; previous care preferences; cultural, spiritual, health, social, financial needs; role of palliative care; ACP
Other: included a needs assessment, discussion with carers and family, summary of discussion in a standard form
Usual carea Informal caregiver’s QoL
Carer and family’s satisfaction with care
Detering et al, 2010 (39)
Tool: Respecting Patient Choices model
Type: single-provider; nurse who was trained to deliver the intervention; a physician was sometimes included
Duration: Median length of discussion was 60 minutes (range 10−200 minutes)
Frequency: NA
Topics: prognosis, goals, values, beliefs, discuss and document choices for future health care, ACP
Other: offered on top of usual care
Usual care: no ACP unless specifically requested
Patient’s satisfaction with care
Informal caregiver’s and family’s satisfaction with care
Completion of ACP documents and processes

Ontario Health Technology Assessment Series; Vol. 14: No. 19, pp. 1–72, December 2014 29
Author, Year Interventions Comparisons Outcomes of Interest
Gade et al, 2008 (43)
Tool: Weismann’s palliative care components
Type: team-based; physician, nurse, social worker, and chaplain
Duration: NA
Frequency: NA
Topics: symptom management, psychosocial and spiritual support, EoL planning, posthospital care, diagnosis, prognosis, goals of care, ACP
Usual carea Patient’s QoL
Patient’s satisfaction with care
Completion of ACP documents and processes
Hospital LOS
Clayton et al, 2007 (44)
Tool: question prompt list with 112 potential questions that was reviewed 20–30 minutes before the consultation
Type: single-provider; physician
Duration: NA
Frequency: NA
Topics: palliative care, physical symptoms, treatment, lifestyle and QoL, prognosis, support, EoL issues
Usual care: routine consultation
Patient’s satisfaction with care
Lautrette et al, 2007 (45)
Tool: VALUE mnemonic, a brochure, and detailed procedures
Type: team-based; physician and other professionals
Duration: Median length of discussion was 30 minutes (range 19–45 minutes)
Frequency: NA
Topics: NA
Usual care: EoL family conference
ICU LOS
Gilmer et al, 2005 (46)
Tool: process model
Type: team-based; ethicist consultant and other professionals
Duration: NA
Frequency: NA
Topics: ethical issues, hospital policy, ethical consensus statements, statutes, laws, measures to improve communication, medical factors, patient preferences and values, QoL, context
Usual care: no ethics consultation was offered
Hospital LOS
ICU LOS
Casarett et al, 2005 (48)
Tool: structured interview questionnaire
Type: single-provider; physician
Duration: NA
Frequency: NA
Topics: goals of care, life-sustaining treatment, symptoms, palliative care needs (i.e., comfort care, nursing support, practical support, ACP, emotional support, bereavement support, spiritual support, address loneliness)
Usual care: assessment by research assistant
Family’s satisfaction with care
Hospital care
Hospital LOS

Ontario Health Technology Assessment Series; Vol. 14: No. 19, pp. 1–72, December 2014 30
Author, Year Interventions Comparisons Outcomes of Interest
Song et al, 2005 (49)
Tool: Representational Approach model
Type: single-provider; nurse
Duration: NA
Frequency: NA
Topics: ACP, illness experiences, misconceptions and concerns, informed choices about medical care, treatment, complications, benefits
Other: offered in addition to usual care
Usual care: information cards and a booklet if more information was desired
Concordance between patient’s and surrogate’s wishes
Nicolasora et al, 2006 (47)
Tools: script that provides detailed information about life-sustaining treatments and ADs
Type: single-provider; physician
Duration: NA
Frequency: NA
Topics: completion of ACP, CPR status, patient wishes for change, AD creation
Usual care: not approached by physician
Completion of ACP documents and processes
Dyar et al, 2012 (50)
Tool: none
Type: single-provider; nurse practitioner
Duration: NA
Frequency: NA
Topics: Five Wishes (a living will), information about hospices, needs assessment
Usual carea Patient’s QoL
Jones et al, 2011 (52)
Tool: none
Type: single-provider; nurse or physician who was trained to deliver the intervention
Duration: NA
Frequency: NA
Topics: patient perceptions, communication with providers and family, hopes and fears for future, health care decision-making
Other: family members were not invited to the first consultation, but they were included in subsequent sessions
Usual carea Patient’s satisfaction with care
Observational with contemporaneous controls
Evangelista et al, 2012 (54)
Tool: none
Type: single-provider; nurse or physician
Duration: 50–120 minutes
Frequency: NA
Topics: patient’s values, goals, preferences; areas where patient perceived the need for support (e.g., physical, symptom control, emotional support, illness understanding, treatment goals, ACP); establish treatment plan
Usual care: no palliative care consultation
Patient’s QoL
Ontario Health Technology Assessment Series; Vol. 14: No. 19, pp. 1–72, December 2014 31
Author, Year Interventions Comparisons Outcomes of Interest
Jacobsen et al, 2011 (55)
Tool: cognitive model for ACP
Type: single-provider; physician, nurse, or social worker
Duration: NA
Frequency: NA
Topics: information sharing ACP meetings, understanding, values, goals, preferences, selection of surrogate, prognosis, hopes, worries, CPR, place of death
Usual carea Completion of ACP documents and processes
Engelhardt et al, 2009 (56)
Tool: checklist
Type: single-provider; social worker or health educator
Duration: NA
Frequency: took place over 6 sessions
Topics: understanding, treatment, symptoms, prognosis, communication with providers, ACP, coping, existential issues, caregiving concerns, long-term care planning, home environmental modifications, etc.
Other: in-person discussion followed by phone contact
Usual carea Patient’s QoL
Completion of ACP documents and processes
Hospital care
Emergency department visits
Home health visits
Outpatient services
Rabow et al, 2004 (57)
Tool: none
Type: team-based; social worker, nurse, chaplain, pharmacist, psychologist, art therapist, volunteer coordinator, and 3 physicians
Duration: NA
Frequency: took place over 3 sessions
Topics: NA
Other: provided in addition to usual care
Usual carea Patient’s QoL
Patient’s satisfaction with care
Completion of ACP documents and processes
Hospital care
Hospital LOS
Emergency department visits
Urgent care visits
Outpatient services
Mack et al, 2012 (58)
Tool: none
Type: single-provider; 40% of discussions included a physician
Duration: NA
Frequency: NA
Topics: ACP (i.e., do not resuscitate, hospices, palliative care, or not otherwise specified), venue of dying
No discussiona Chemotherapy
Hospital care
ICU admission
Hospice care
Mack et al, 2010
(59)a Tool: none (assumed)
Type: single-provider (assumed)
Duration: NA
Frequency: NA
Topics: NA
No discussiona Concordance between patient’s wishes and care received
Hospice care

Ontario Health Technology Assessment Series; Vol. 14: No. 19, pp. 1–72, December 2014 32
Author, Year Interventions Comparisons Outcomes of Interest
Wright et al, 2008
(60)a Tool: none (assumed)
Type: single-provider (assumed)
Duration: NA
Frequency: NA
Topics: NA
No discussiona Chemotherapy
Hospice care
Casarett et al, 2008 (61)
Palliative care consultation
Tool: none
Type: team-based; physician, nurse practitioner, or both; social worker; nurse; chaplain; volunteers; and other professionals as needed
Duration: NA
Frequency: NA
Topics: NA
Usual carea Patient’s QoL
Morrison et al, 2005 (62)
Tool: aid to structure discussions
Type: single-provider; social worker trained to deliver intervention
Duration: NA
Frequency: NA
Topics: patient’s decisional capacity, information on how to appoint proxies, communication with proxies, ACP, goals of care, feedback to physicians on congruence
Usual carea Concordance between patient’s wishes and care received
Zhang et al, 2009
(53)a Tool: none (assumed)
Type: single-provider; physician
Duration: NA
Frequency: NA
Topics: preferencesa
No discussiona Patient’s satisfaction
Chemotherapy
Resuscitation
ICU admission
Hospice care
Briggs et al, 2004 (63)
Tool: aid to structure discussions
Type: single-provider; nurse, chaplain, or social worker who was trained to deliver the intervention
Duration: 1 hour
Frequency: NA
Topics: patient and surrogate understanding, information about treatment, assistance with ACP documentation, surrogate’s understanding of patient’s preferences, preparing surrogate to make decisions that honour patient preferences, complete STP
Usual care: ACP literature, referral to trained ACP facilitator
Concordance between patient’s and surrogate’s wishes
Observational with historical controls

Ontario Health Technology Assessment Series; Vol. 14: No. 19, pp. 1–72, December 2014 33
Author, Year Interventions Comparisons Outcomes of Interest
Lamba et al, 2012 (64)
Tool: none
Type: team-based; Part I (physician and nurse), Part II (physician, nurse, counsellor, and interfaith pastor)
Duration: NA
Frequency: NA
Topics: Part I (prognosis, ADs, family support, surrogate decision-maker, pain, other symptoms), Part II (likely patient outcomes; treatment options; goals of care; assessment of content on goals of care discussion, family understanding, issues of conflict)
Usual carea Completion of ACP documents and processes
Hospital LOS
ICU LOS
Norton et al, 2007 (65)
Tool: none
Type: team-based; nurse practitioner, physician, chaplain, music therapist, massage therapist, and psychologist
Duration: NA
Frequency: NA
Topics: medical history and physical exam, palliative care, involvement with team and family, other providers
Usual care: physician makes a palliative care referral
Hospital LOS
ICU LOS
Lindner et al, 2007 (66)
Tool: electronic medical record note
Type: single-provider; physician
Duration: NA
Frequency: NA
Topics: information about surrogates, dates and content of prior written ADs, values, preferences, goals of care, wishes regarding resuscitation, artificial nutrition, hydration, hospital transfer, autopsy
Usual carea Concordance between patient’s wishes and care received
Completion of ACP documents and processes
Cross-sectional
Leung et al, 2012
(67)a Tool: none (assumed)
Type: single-provider; physician
Duration: NA
Frequency: NA
Topics: care planninga
No discussiona Patient’s satisfaction with care
Mori et al, 2013
(68)a Tool: none (assumed)
Type: single-provider; health care provider
Duration: NA
Frequency: NA
Topics: NA
No discussiona Family’s satisfaction with care

Ontario Health Technology Assessment Series; Vol. 14: No. 19, pp. 1–72, December 2014 34
Author, Year Interventions Comparisons Outcomes of Interest
Heyland et al, 2009 (11)a
Tool: none (assumed)
Type: single-provider; health care provider
Duration: NA
Frequency: NA
Topics: NA
No discussiona Patient’s satisfaction with care
Family’s satisfaction with care
Abbreviations: ACP, advance care planning; AD, advance directive; CPR, cardiopulmonary resuscitation; EoL, end of life; ICU, intensive care unit; LOS, length of stay; NA, not available; QoL, quality of life; RCT, randomized controlled trial; STP, statement of treatment preferences; VALUE, value comments made by the family, acknowledge family emotions, listen, understand the patient as a person, elicit family questions.. aAdditional information was not provided.

Ontario Health Technology Assessment Series; Vol. 14: No. 19, pp. 1–72, December 2014 35
Quality of Life
Table 4 provides details about the relationship between PCPDs and quality of life (QoL) for patients at
the EoL. Compared with the controls, single-provider PCPDs could have had a small effect on QoL
(GRADE: very low). In 1 small randomized RCT that used 2 instruments to measure QoL, patients in the
intervention arm reported higher QoL than those in the control arm, but the differences were not
statistically significant. (50) One observational study showed that patients receiving single-provider
PCPDs had higher QoL than control patients, (54) and another showed that the intervention had no effect
on patients’ QoL. (56) In one of the original articles, the P value for the effect showed that the difference
observed was significant. It is likely that the conservative estimate of the confidence interval in Table 4
produced the discrepancy between the statistical significance of the results. Similarly, the highest-quality
evidence from a large RCT could not demonstrate that team-based PCPDs affected patients’ QoL, either
(GRADE: moderate). (43)
One observational study of a team-based PCPD found that, after adjusting for other covariates, earlier
discussions were associated with greater well-being for patients (β = 0.003, P = 0.006; GRADE: low).
(61) In that study, the timing of PCPDs had little effect on QoL. While the effect was statistically
significant, it might not have been clinically significant. The study’s report did not present unadjusted
estimates of the effect.
Table 4: Effect of Patient Care Planning Discussions on Patient’s Quality of Life
Author, Year Instrument
Range
Study Design
Tool Used?
Results Intervention Results Control Difference in Means (95% CI)
Single-Provider Discussion vs. Usual Care or No Discussion
GRADE for highest-quality evidence: Very low
Highest-quality evidence
Dyar et al, 2012 (50)
FACT-G (0–108)
Small RCT
No Mean change in FACT-G score from baseline (SD): 1.2 (12.5)
Mean change in FACT-G score from baseline (SD): −3.9 (5.0)
5.10 (−3.98, 14.18)
SMD: 0.47 (−0.58, 1.52)
Dyar et al, 2012
(50)
LASA (12–120)
Small RCT
No Mean change in LASA score from baseline (SD): 2.0 (25.7)
Mean change in LASA score from baseline (SD): −8.8 (21.7)
10.80 (−11.10, 32.70)
SMD: 0.44 (−0.52, 1.37)
Evangelista et al, 2012 (54) a
MLHFQ (0–105)
Obs-cont
No Mean change in MLHFQ score from baseline: 9.9 (17.3)b
Mean change in MLHFQ score from baseline: 4.3 (15.6)b
5.60 (−2.01, 13.21)b,c,d
SMD: 0.34 (−0.13, 0.80)b
Engelhardt et al, 2009 (56)
McGill Quality of Life Questionnaire (0–10)
Obs-cont
Yes Mean change in score from baseline: 0.1 (1.2)b
Mean change in score from baseline: 0.1 (1.5)b
0.01 (−0.25, 0.27)b
SMD: 0.01 (−0.19, 0.20)b
Team-Based Discussion vs. Usual Care or No Discussion
GRADE for highest-quality evidence: Moderate
GRADE for all evidence: Very low
Highest-quality evidence

Ontario Health Technology Assessment Series; Vol. 14: No. 19, pp. 1–72, December 2014 36
Author, Year Instrument
Range
Study Design
Tool Used?
Results Intervention Results Control Difference in Means (95% CI)
Gade et al, 2008 (43)
11-point Likert scale (0–10)
Large RCT
Yes Mean change in score from baseline: 2.3 (3.7)b
Mean change in score from baseline: 2.2 (3.5)b
0.10 (−0.61, 0.81)
SMD: 0.03 (−0.17, 0.23)
Lower-quality evidence
Rabow et al, 2004 (57)
Multidimensional Quality of Life Scale—Cancer Version (0–100)
Obs-cont
No Mean change in score from baseline: −0.4
Mean change in score from baseline: 2.3
−2.7, P = 0.43e
Casarett et al, 2008 (61)
FATE (0–100)
Obs-cont
No Mean FATE score: 64 Mean FATE score: 54 10, P < 0.001d,e
Abbreviations: CI, confidence interval; FACT-G, Functional Assessment of Cancer Therapy–General; FATE, Family Assessment of Treatment at End-of-Life; GRADE, Grading of Recommendations Assessment, Development, and Evaluation; LASA, Linear Analogue Self-Assessment Scale; MLHFQ, Minnesota Living with Heart Failure Questionnaire; Obs-cont, observational study with contemporaneous control; QoL, quality of life; RCT, randomized controlled trial; SD, standard deviation; SMD, standardized mean difference. dStatistically significant at P ≤ 0.05. aLower scores indicated higher QoL in the original scale, so the results were multiplied by −1 to make the signs for the differences consistent with the
results from other studies. bStandard deviations and CIs are conservatively estimated because information about the correlation between the estimates was not provided. cThe effect estimate was statistically significant in the original article, but was not significant here because of the conservative estimation of the confidence interval. eConfidence interval could not be calculated given the information provided.
One study, a small randomized controlled trial (RCT), assessed the effect of a single-provider PCPD on
informal caregivers’ QoL. (51) The study suffered from high attrition, which resulted in only 11 informal
caregivers completing the 6-month follow-up and 4 informal caregivers completing the post-bereavement
follow-up. Because of the small sample size, statistical comparisons of the intervention and control arms
were not performed. Overall, the evidence did not indicate whether or not the intervention was associated
with greater QoL for informal caregivers (GRADE: very low). See Table 5 for details.

Ontario Health Technology Assessment Series; Vol. 14: No. 19, pp. 1–72, December 2014 37
Table 5: Effect of Patient Care Planning Discussions on Informal Caregiver’s Quality of Life
Author, Year Instrument
Range
Study Design
Tool Used?
Results Intervention Results Control Difference in Means (95% CI)
Single-Provider Discussion vs. Usual Care or No Discussion
GRADE for all evidence: Very low
Sampson et al, 2011 (51)a
EuroQoL EQ-5D (0–100)
Small RCT
Yes Score at baseline (SD): 69.8 (23.6)
Score at 6 wk (SD): 73.6 (11.1)
Score at 6 mo (SD): 80.0 (6.1)
Score post-death (SD): 69.3 (24.7)
Score at baseline (SD): 62.7 (37.5)
Score at 6 wk (SD): 79.8 (12.2)
Score at 6 mo (SD): 80.8 (13.2)
Score post-death: 92.0 (1 person)
NA
Abbreviations: CI, confidence interval; GRADE, Grading of Recommendations Assessment, Development, and Evaluation; QoL, quality of life; RCT, randomized controlled trial; SD, standard deviation. aNo statistical comparisons were performed in this study.
Satisfaction with End-of-Life Care
Results pertaining to the patient’s satisfaction with EoL care (Table 6) seem to suggest that PCPDs,
whether with single providers or with teams, were associated with greater satisfaction with EoL care.
Results from 3 RCTs showed no evidence that single-provider PCPDs affected patients’ overall
satisfaction with care (GRADE: moderate). (39;44;52) However, results from 1 large RCT indicated that
single-provider PCPDs were associated with patients being “very satisfied” with their EoL care. (39) One
large RCT assessing a team-based PCPD found that the intervention was significantly associated with
greater satisfaction with EoL care (GRADE: high). (43)
Table 6: Effect of Patient Care Planning Discussions on Patient’s Satisfaction with End-of-Life Care
Author, Year Instrument
Range
Study Design
Tool Used?
Results Intervention Results Control Effect Estimate (95% CI)
Single-Provider Discussion vs. Usual Care or No Discussion
GRADE for highest-quality evidence: Moderate
GRADE for all evidence: Very low
Highest-quality evidence
Detering et al, 2010 (39)
3-point Likert
Large RCT
Yes Very satisfied: 125/133 (94.0%)
Satisfied or very satisfied: 131/133 (98.5%)
Very satisfied: 91/139 (65.5%)
Satisfied or very satisfied: 131/139 (94.2%)
OR: 8.24 (3.72, 18.26)a
OR: 4.00 (0.83, 19.19)
Clayton et al, 2007 (44)b,c
25-item scale (25–125)
Large RCT
Yes Mean score: 110.1 Mean score: 110.3 MD: −0.2 (−3.4, 2.9)

Ontario Health Technology Assessment Series; Vol. 14: No. 19, pp. 1–72, December 2014 38
Author, Year Instrument
Range
Study Design
Tool Used?
Results Intervention Results Control Effect Estimate (95% CI)
Jones et al, 2011 (52)
5-item scale (range not reported)
Small RCT
No Mean change in score from baseline (SD): 0.6 (1.5)
Mean change in score from baseline (SD): 1.9 (1.1)
MD:
−1.3 (−2.09, −0.51)a
SMD:
−0.96 (−1.61, −0.32)
Lower-quality evidence
Zhang et al, 2009 (53)d
11-point Likert (0–10)
Obs-cont No Mean score (SD): 6.3 (2.7)
Mean score (SD): 5.7 (3.3)
MD: 0.60 (−0.39, 1.59)
SMD:
0.20 (−0.13, 0.53)
Leung et al, 2012 (67)
5-point Likert dichotomized as very satisfied versus less satisfied
Cross-sectional
No NA NA OR: 2.02 (1.16, 3.50)a
Heyland et al, 2009 (11)
CARENET’s Family Satisfaction Survey (1–100)
Cross-sectional
No Mean score (SD): 76.1 (9.7)
Mean score (SD): 73.1 (10.6)
MD: 3.00 (0.53, 5.47)a
SMD: 0.29 (0.03, 0.54)
Team-Based Discussion vs. Usual Care or No Discussion
GRADE for highest-quality evidence: High
GRADE for all evidence: Low
Highest-quality evidence
Gade et al, 2008
(43)b
11-point Likert (0–10)
Large RCT
Yes Mean score (SD): 8.0 (1.4)
Mean score (SD): 7.4 (1.7)
MD: 0.60 (0.27, 0.93)a
SMD:
0.39 (0.17, 0.60)
Lower-quality evidence
Rabow et al, 2004 (57)
Group Health Association of American Consumer Satisfaction Survey (20–100)
Obs-cont No Mean change in score between 6- and 12-month evaluations: 0.5e
Mean change in score between 6- and 12-month evaluations: −2.1e
MD: 2.6, P = 0.26f
Abbreviations: CARENET, Canadian Researchers at the End of Life Network; CI, confidence interval; GRADE, Grading of Recommendations Assessment, Development, and Evaluation; MD, difference in means; NA, not available; Obs-cont, observational study with contemporaneous controls; OR, odds ratio; RCT, randomized controlled trial; SD, standard deviation; SMD, standardized mean difference. aStatistically significant at P ≤ 0.05. bAssessed satisfaction with communication about care. cStandardized MD could not be computed from the information provided. dAssessed quality of death. eAdjusted for baseline values. fConfidence interval could not be calculated from the information provided.

Ontario Health Technology Assessment Series; Vol. 14: No. 19, pp. 1–72, December 2014 39
Results from 3 RCTs showed that single-provider PCPDs were associated with greater satisfaction with
EoL care among family members (GRADE: high). (39;48;51) As was seen when patients’ satisfaction
with EoL care was assessed, family members in the intervention arm were more likely to report being
“very satisfied” with care than those in the control arm (OR [95% CI]: 5.17 [1.52, 17.58]). (39) These
results are presented in detail in Table 7.
Table 7: Effect of Patient Care Planning Discussions on Family’s Satisfaction with End-of-Life Care
Author, Year Instrument
Range
Study Design
Tool Used?
Results Intervention Results Control Effect Estimate (95% CI)
Single-Provider Discussion vs. Usual Care or No Discussion
GRADE for highest-quality evidence: High
GRADE for all evidence: Moderate
Highest-quality evidence
Detering et al, 2010 (39)a
3-point Likert
Large RCT
Yes Very satisfied: 24/29 (82.8%)
Satisfied or very satisfied: 26/29 (89.7%)
Very satisfied: 13/27 (48.1%)
Satisfied or very satisfied: 21/27 (77.8%)
OR: 5.17 (1.52, 17.58)b
OR: 2.48 (0.55, 11.10)
Casarett et al, 2005
(48)c
Toolkit Afterdeath Survey (1–5)
Large RCT
Yes Mean score (SD): 4.3 (1.0)
Mean score (SD): 2.2 (1.5)
MD: 2.10 (1.75, 2.45)b
SMD: 1.67 (1.35, 1.99)
Sampson et al, 2011
(51)
Satisfaction with End-of-Life Care in Advanced Dementia Scale (10–40)
Small RCT
Yes Mean score (SD): 27.6 (8.5)
Mean score (SD): 23.0 (1 person)
MD: 4.6c
Lower-quality evidence
Mori et al, 2013 (68)d
Toolkit of Instruments to Measure End-of-Life Care (0–10)
Cross-sectional
No Mean score (SD): 9.7 (0.6)
Mean score (SD): 8.7 (1.4)
MD: 1.00 (0.42, 1.58)b
SMD: 0.84 (0.24, 1.43)
Heyland et al, 2009
(11)
CARENET’s Family Satisfaction Survey (1–100)
Cross-sectional
No Mean score (SD): 75.2 (13.3)
Mean score (SD): 70.4 (12.2)
MD: 4.89 (0.41, 9.37)b
SMD: 0.39 (0.04, 0.74)
Pooled estimate (2
cross-sectional studies, FE), I2 = 39%
SMD: 0.50 (0.20, 0.80)b
Abbreviations: CARENET, Canadian Researchers at the End of Life Network; CI, confidence interval; FE, fixed effects; GRADE, Grading of Recommendations Assessment, Development, and Evaluation; MD, difference in means; OR, odds ratio; RCT, randomized controlled trial; SD, standard deviation; SMD, standardized mean difference; RCT, randomized controlled trial. aAssessed satisfaction with quality of death. bStatistically significant at P ≤ 0.05. cCI cannot be calculated from information provided. dAssessed quality of care.

Ontario Health Technology Assessment Series; Vol. 14: No. 19, pp. 1–72, December 2014 40
Concordance
Evidence from a large RCT suggests that single-provider PCPDs did not significantly increase
concordance between patient’s wishes and the care they received (OR [95% CI]: 1.73 [0.76, 3.90];
GRADE: high). (40;41) However, despite not being significant, the point estimate suggests that the
intervention was associated with greater concordance, as shown in Table 8.
Table 8: Effect of Patient Care Planning Discussions on Concordance Between Patient’s Wishes
and Care Received
Author, Year Study Design
Tool Used?
Results Intervention Results Control Odds Ratio (95% CI)
Single-Provider Discussion vs. Usual Care or No Discussion
GRADE for highest-quality evidence: High
GRADE for all evidence: Moderate
Highest-quality evidence
Kirchhoff et al, 2012; (40) Kirchhoff et al, 2010 (41)
Large RCT
Yes Concordant: 46/62 (74.2%)
Concordant: 30/48 (62.5%)
1.73 (0.76, 3.90)
Lower-quality evidence
Mack et al, 2010
(59)a Obs-cont
No Concordant: 87/113 (77.0%)
Concordant: 137/219 (62.6%)
2.00 (1.19, 3.36)b
Morrison et al, 2005 (62)
Obs-cont
No Concordant: 47/49 (95.9%)
Concordant: 79/96 (82.3%)
5.06 (1.12, 22.87)b
Pooled estimate (2
obs-cont studies, FE), I2 = 24%
2.28 (1.41, 3.70)b
Lindner et al, 2007 (66)
Obs-hist
Yes Concordant: 39/40 (97.5%)
Concordant: 38/44 (86.4%)
6.16 (0.71, 53.59)
Abbreviations: CI, confidence interval; FE, fixed effects; GRADE, Grading of Recommendations Assessment, Development, and Evaluation; Obs-cont, observational study with contemporaneous controls; Obs-hist, observational study with historical controls; RCT, randomized controlled trial. aRaw numbers were not provided in the article and were therefore estimated using the odds ratio and algebraic formulas. bStatistically significant at P ≤ 0.05.
Also, Table 9 shows that single-provider PCPDs were associated with greater concordance between the
patient’s wishes and the family’s wishes, and these effect estimates were fairly large and statistically
significant (GRADE: high). (40;41;49)

Ontario Health Technology Assessment Series; Vol. 14: No. 19, pp. 1–72, December 2014 41
Table 9: Effect of Patient Care Planning Discussions on Concordance between Patient’s and Family’s Wishes
Author, Year Study Design
Tool Used?
Results Intervention Results Control Effect Estimate (P value)
Single-Provider Discussion vs. Usual Care or No Discussion
GRADE for highest-quality evidence: High
GRADE for all evidence: Moderate
Highest-quality evidence
Kirchhoff et al, 2012; (40) Kirchhoff et al, 2010 (41)
Large RCT
Yes Agreement on resuscitation, κ (95% CI): 0.74 (0.65, 0.83)
Agreement on resuscitation, κ (95% CI): 0.26 (0.14, 0.39)
OR: 4.32 (< 0.001)a
Song et al, 2005 (49) Small RCT
Yes Congruence, mean (SD): 2.8 (0.6)
Congruence, mean (SD): 1.4 (1.0)
MD: 1.4 (0.002)a
Lower-quality evidence
Briggs et al, 2004
(63)
Obs-cont
Yes Mean rank: 17.8 Mean rank: 9.9 Mann-Whitney U: 33.00 (< 0.01)a
Abbreviations: CI, confidence interval; GRADE, Grading of Recommendations Assessment, Development, and Evaluation; MD, difference in means; Obs-cont, observational study with contemporaneous controls; OR, odds ratio; RCT, randomized controlled trial; SD, standard deviation. aStatistically significant at P ≤ 0.05.
Completion of Advance Care Planning Documents and Processes
Evidence shows that both single-provider and team-based PCPDs were associated with greater
completion of advance care planning (ACP) documents and processes. Based on evidence from 1 large
cluster RCT and 2 large RCTs, single-provider PCPDs were associated with a 13% to 77% (95% CIs
ranged from 5% to 83%) increase in completion of ACP documents and processes (GRADE: high).
(39;42;47) Notably, the results from the 2 RCTs were not pooled because the CIs did not overlap, and the
I2 was 99%. Both studies included mixed disease populations, so it is unlikely that the disease mix was
the source of heterogeneity. The heterogeneity might have been related to the countries in which the
studies were conducted (i.e., Australia versus the United States), the number of hospital units in which the
studies were conducted (i.e., multiple versus one), the outcomes that were assessed (i.e., receiving ACP
versus completing advance directives), and/or the age of patients included in the studies (i.e., older
seniors versus younger seniors). (39;47) Results from a large RCT show that team-based PCPDs were
associated with a 22% (95% CI: 15%, 30%) increase in the completion of ACP processes and documents
(GRADE: high). (43) Table 10 provides further details about these results.

Ontario Health Technology Assessment Series; Vol. 14: No. 19, pp. 1–72, December 2014 42
Table 10: Effect of Patient Care Planning Discussions on Completion of Advance Care Planning Documents and Processes
Author, Year Study Design
Tool Used?
Results Intervention Results Control Difference in Proportions
(95% CI)
Single-Provider Discussion vs. Usual Care or No Discussion
GRADE for highest-quality evidence: High
GRADE for all evidence: Moderate
Highest-quality evidence
Au et al, 2012 (42) Large cluster RCT
Yes Change in proportion who discussed treatment preferences with clinician: 38.0%
Change in proportion who discussed treatment preferences with clinician: 13.4%
25% (17, 33)a
Detering et al, 2010 (39)
Large RCT
Yes Received ACP: 119/154 (77.3%)
Received ACP: 1/155 (0.6%)
77% (70, 83)a
Nicolasora et al, 2006 (47)
Large RCT
Yes Completed ADs: 13/102 (12.7%)
Completed ADs: 1/128 (0.8%)
13% (5, 19)a
Lower-quality evidence
Jacobsen et al, 2011 (55)
Obs-cont Yes ACP preferences discussed and documented: 175/517 (33.8%)
ACP preferences discussed and documented: 81/382 (21.2%)
13% (7, 18)a
Engelhardt et al, 2009 (56)
Obs-cont Yes Completed Ads: 78/166 (47.0%)
Completed ADs: 41/194 (21.1%)
26% (16, 35)a
Pooled estimate (2
obs-cont studies, RE), I2 = 82%
19% (6, 32)a
Lindner et al, 2007 (66)
Obs-hist Yes Physician completed AD note: 67/107 (62.6%)
Physician completed AD note: 5/117 (4.3%)
59% (48, 68)a
Team-Based Discussion vs. Usual Care or No Discussion
GRADE for highest-quality evidence: High
GRADE for all evidence: Low
Highest-quality evidence
Gade et al, 2008
(43) Large RCT
Yes Change in proportion who completed ADs: 37.7%
Change in proportion who completed ADs: 15.6%
22% (15, 30)a
Lower-quality evidence
Rabow et al, 2004 (57)
Obs-cont No Durable powers of attorney since baseline: 12/22 (54.5%)
Durable powers of attorney since baseline: 5/18 (27.8%)
27% (−3, 56)
Lamba et al, 2012 (64)
Obs-hist No Completion of DNR status: 25/31 (80.6%)
Completion of DNR status: 11/21 (52.4%)
29% (3, 54)a
Abbreviations: ACP, advance care planning; AD, advance directive; CI, confidence interval; DNR, do not resuscitate; GRADE, Grading of Recommendations Assessment, Development, and Evaluation; Obs-cont, observational study with contemporaneous controls; Obs-hist, observational study with historical controls; RCT, randomized controlled trial; RE, random effects. aStatistically significant at P ≤ 0.05.

Ontario Health Technology Assessment Series; Vol. 14: No. 19, pp. 1–72, December 2014 43
Health Care Use
Chemotherapy Pooled results from 3 observational studies with contemporaneous controls (Table 11) indicate that
single-provider PCPDs were associated with a lower likelihood of receiving chemotherapy at the EoL
(OR [95% CI]: 0.50 [0.35, 0.72]; GRADE: low). (53;58;60) All of the studies had similar point estimates
indicating a 50% reduction in the receipt of chemotherapy, but only 1 study, the largest, showed a
difference that was statistically significant. (58)
Table 11: Effect of Patient Care Planning Discussions on Receiving Chemotherapy at End of Life
Author, Year Study Design
Tool Used?
Results Intervention Results Control Odds Ratio (95% CI)
Single-Provider Discussion vs. Usual Care or No Discussion
GRADE for all evidence: Low
Mack et al, 2012
(58) Obs-cont No Received
chemotherapy: 158/1082 (14.6%)
Received chemotherapy: 39/149 (26.2%)
0.48 (0.32, 0.72)a
Wright et al, 2008 (60)
Obs-cont No Received chemotherapy: 5/123 (4.1%)
Received chemotherapy: 14/209 (6.7%)
0.59 (0.21, 1.68)
Zhang et al, 2009 (53)
Obs-cont No Received chemotherapy: 4/75 (5.3%)
Received chemotherapy: 7/70 (10.0%)
0.51 (0.14, 1.81)
Pooled estimate
(3 obs-cont studies, FE), I2 = 0%
0.50 (0.35, 0.72)a
Abbreviations: CI, confidence interval; FE, fixed effects; GRADE, Grading of Recommendations Assessment, Development, and Evaluation; Obs-cont, observational study with contemporaneous controls. aStatistically significant at P ≤ 0.05.
Table 12 presents evidence from a large observational study showing that patients who had single-
provider PCPDs more than 30 days before their death were less likely to receive chemotherapy than
patients who had these discussions within 30 days of death (χ2 statistic: 17.057, P < 0.001; GRADE: low).
(58)

Ontario Health Technology Assessment Series; Vol. 14: No. 19, pp. 1–72, December 2014 44
Table 12: Effect of Timing of Patient Care Planning Discussions on Receiving Chemotherapy at End of Life
Author, Year Study Design
Tool Used?
Results
Single-Provider Discussion vs. Usual Care or No Discussion
GRADE for all evidence: Low
Mack et al, 2012 Obs-cont No Proportion receiving chemotherapy in the last 14 days of life
Days between first discussion and death:
≤ 30: 65/311 (20.9%)
31–60: 19/186 (10.2%)
61–90: 9/108 (8.3%)
> 90: 23/189 (12.2%)
χ2: 17.057, df=3, P < 0.001a
Abbreviations: GRADE, Grading of Recommendations Assessment, Development, and Evaluation; Obs-cont, observational study with contemporaneous control. aStatistically significant at P ≤ 0.05.
Resuscitation Pooled results from 2 observational studies presented in detail in Table 13 show that patients who
received single-provider PCPDs were less likely to be resuscitated than those in the control arm (OR
[95% CI]: 0.13 [0.03, 0.55]; GRADE: very low). (53;60) The effect was statistically significant, and its
magnitude was large, which adds credibility to the result, despite the very low quality of the evidence.
Table 13: Effect of Patient Care Planning Discussions on Resuscitation
Author, Year Study Design
Tool Used?
Results Intervention Results Control Odds Ratio (95% CI)
Single-Provider Discussion vs. Usual Care or No Discussion
GRADE for all evidence: Very low
Wright et al, 2008 (60)
Obs-cont No 1/123 (0.8%) 14/209 (6.7%) 0.11 (0.01, 0.88)a
Zhang et al, 2009 (53)
Obs-cont No 1/75 (1.3%) 6/70 (8.6%) 0.14 (0.02, 1.23)
Pooled estimate
(2 obs-cont studies, FE), I2 = 0%
0.13 (0.03, 0.55)a
Abbreviations: CI, confidence interval; FE, fixed effects; GRADE, Grading of Recommendations Assessment, Development, and Evaluation; Obs-cont, observational study with contemporaneous controls. aStatistically significant at P ≤ 0.05.
Hospital Care Evidence from a large RCT (Table 14) shows that, on average, patients who received single-provider
PCPDs had 0.21 fewer episodes of hospital care than those in the control arm (P = 0.04; GRADE: high).
(48) On the other hand, evidence from an observational study with contemporaneous controls suggests
that, on average, patients who received team-based PCPDs had 0.40 more episodes of hospital care than
those in the study’s control arm (95% CI: −0.24, 1.04; GRADE: low). (57)

Ontario Health Technology Assessment Series; Vol. 14: No. 19, pp. 1–72, December 2014 45
Table 14: Effect of Patient Care Planning Discussions on Receiving Hospital Care
Author, Year Study Design
Tool Used?
Results Intervention Results Control Effect Estimate (95% CI)
Single-Provider Discussion vs. Usual Care or No Discussion
GRADE for highest-quality evidence: High
GRADE for all evidence: Moderate
Highest-quality evidence
Casarett et al, 2005 (48)
Large RCT
Yes Mean number of acute care admissions (range): 0.3 (0-4)
Mean number of acute care admissions (range): 0.5 (0-4)
MD: –0.21, P = 0.04a
Lower-quality evidence
Engelhardt et al, 2009 (56)
Obs-cont Yes Mean change in number of inpatient admissions from baseline (SD): 0.5 (6.1)b
Mean change in number of inpatient admissions from baseline (SD): 2.1 (17.3)b
MD: –1.67 (–3.82, 0.48)a, c
Mack et al, 2012 (58)
Obs-cont No Received acute care at EoL: 424/1082 (39.2%)
Received acute care at EoL: 72/149 (48.3%)
OR: 0.69 (0.49, 0.97)a
Team-Based Discussion vs. Usual Care or No Discussion
GRADE for all evidence: Low
Rabow et al, 2004 (57)
Obs-cont No Mean (SD): 1.2 (2.0)
Mean (SD): 0.8 (1.0)
MD: 0.40 (–0.24, 1.04)
Abbreviations: CI, confidence interval; EoL, end of life; GRADE, Grading of Recommendations Assessment, Development, and Evaluation; MD, difference in means; Obs-cont, observational study with contemporaneous controls; OR, odds ratio; RCT, randomized controlled trial; SD, standard deviation. aStatistically significant at P ≤ 0.05. bStandard deviations are slightly larger because information about the correlation between estimates was not provided. cSignificant difference was shown in the paper, but the difference was not significant in this estimate because the SDs for the MDs were estimated conservatively.
Furthermore, the evidence shows that earlier single-provider PCPDs were associated with a lower
likelihood of receiving hospital care at the EoL (χ2 statistic: 55.906, P < 0.001; GRADE: moderate). (58)
As shown in Table 15, there was an apparent gradient between the timing of PCPDs and the likelihood of
receiving hospital care.
Table 15: Effect of Timing of Patient Care Planning Discussions on Receiving Hospital Care
Author, Year Study Design
Tool Used?
Results
Single-Provider Discussion vs. Usual Care or No Discussion
GRADE for all evidence: Moderate
Mack et al, 2012
(58) Obs-cont No Proportion receiving acute care in the last 30 days of life
Days between first discussion and death:
≤ 30: 180/311 (57.9%)
31–60: 76/186 (40.9%)
61–90: 35/108 (32.4%)
> 90: 49/189 (25.9%)
χ2: 55.905, df = 3, P < 0.001a
Abbreviations: GRADE, Grading of Recommendations Assessment, Development, and Evaluation; Obs-cont, observational study with contemporaneous control. aStatistically significant at P ≤ 0.05.

Ontario Health Technology Assessment Series; Vol. 14: No. 19, pp. 1–72, December 2014 46
The results in Table 16 show that single-provider PCPDs were associated with spending 1.8 fewer days in
hospital (P = 0.03; GRADE: high). (48) The evidence does not clearly indicate any relationship between
team-based PCPDs and hospital length of stay, however. Results from 1 large multicentre RCT suggest
that team-based PCPDs had no effect on the number of days spent in the hospital, (43) and results from
another large multicentre RCT suggest that team-based PCPDs were associated with spending 3.00 fewer
days in hospital (GRADE: low). (46) Both of these RCTs were conducted with mixed disease patient
populations in hospitals in the United States, and the patients were of similar ages. However, 1 study
focused on patients for whom death was imminent, (46) and the other did not. (43) Patients for whom
death is imminent comprise a small but special EoL population. (Ba’ Pham, personal communication,
February 10, 2014).
Table 16: Effect of Patient Care Planning Discussions on Hospital Length of Stay
Author, Year Study Design
Tool Used?
Results Intervention Results Control Difference in Means (95% CI)
Single-Provider Discussion vs. Usual Care or No Discussion
GRADE for all evidence: High
Casarett et al, 2005 (48)
Large RCT
Yes Mean (range): 1.2 (0–18)
Mean (range): 3.0 (0–29)
–1.8, P = 0.03a
Team-Based Discussion vs. Usual Care or No Discussion
GRADE for highest-quality evidence: Low
GRADE for all evidence: Low
Highest-quality evidence
Gade et al, 2008 (43)
Large RCT
Yes Median (IQR): 7 (4–12)
Median (IQR): 7 (4–12)
0
Gilmer et al, 2005 (46)
Large RCT
Yes Mean (SD): 8.3 (9.4)
Mean (SD): 11.3 (16.5)
–3.00 (–6.07, 0.07)a, b
Lower-quality evidence
Rabow et al, 2004 (57)
Obs-cont
No Mean (SD): 6.3 (12.4)
Mean (SD): 4.3 (9.0)
2.00 (–2.43, 6.43)
Lamba et al, 2012 (64)
Obs-hist
No Mean (SD): 22.2 (23.1)
Mean (SD): 31.1 (26.9)
–8.90 (–22.99, 5.19)
Norton et al, 2007 (65)
Obs-hist
No Mean (SD): 35.8 (50.2)
Mean (SD): 41.4 (58.4)
–5.63 (–22.32, 11.06)
Pooled estimate
(2 obs-hist studies, FE), I2 = 0%
–7.54 (–18.30, 3.23)
Abbreviations: CI, confidence interval; FE, fixed effects; GRADE, Grading of Recommendations Assessment, Development, and Evaluation; IQR, interquartile range; Obs-cont, observational study with contemporaneous controls; Obs-hist, observational study with historical controls; RCT, randomized controlled trial; SD, standard deviation. aStatistically significant at P ≤ 0.05. bSignificant difference was shown in the paper, but the difference was not significant in this estimate because the SDs for the mean differences were estimated conservatively.
Emergency Department Visits The evidence from 1 observational study suggests that patients who received single-provider PCPDs
tended to have fewer visits to the emergency department when compared with their controls (−1.27 [95%
CI: −3.34, 0.80]; GRADE: low). (56) These results (Table 17) were not statistically significant, however.
One observational study assessed the relationship between team-based PCPDs and emergency department
visits. (57) That study did not provide evidence that team-based PCPDs were associated with the number

Ontario Health Technology Assessment Series; Vol. 14: No. 19, pp. 1–72, December 2014 47
of times a patient visits emergency departments (difference in means [95% CI]: −0.10 [−1.16, 0.96];
GRADE: moderate). Table 17 provides additional details about these results. Table 17: Effect of Patient Care Planning Discussions on Emergency Department Visits
Author, Year Study Design
Tool Used?
Results Intervention Results Control Difference in Means (95% CI)
Single-Provider Discussion vs. Usual Care or No Discussion
GRADE for all evidence: Low
Engelhardt et al, 2009 (56)
Obs-cont
Yes Mean change from baseline (SD): 1.7 (6.8)a
Mean change from baseline (SD): 3.0 (13.5)a
–1.27 (–3.34, 0.80)
Team-Based Discussion vs. Usual Care or No Discussions
GRADE for all evidence: Moderate
Rabow et al, 2004 (57)
Obs-cont
No Mean (SD): 1.6 (2.2)
Mean (SD): 1.7 (2.8)
–0.10 (–1.16, 0.96)
Abbreviations: CI, confidence interval; GRADE, Grading of Recommendations Assessment, Development, and Evaluation; Obs-cont, observational study with contemporaneous controls; SD, standard deviation. aStandard deviations are slightly larger because information about the correlation between estimates was not provided.
Care in Intensive Care Unit The pooled estimate from 3 observational studies does not indicate that single-provider PCPDs were
associated with the likelihood that a patient will receive care in the intensive care unit (ICU) (OR [95%
CI]: 0.44 [0.13, 1.53]; GRADE: very low). (53;58;60) However, 2 of the 3 studies included in the pooled
results showed that single-provider PCPDs were associated with less ICU care (Table 18). Notably, all 3
studies were multicentre prospective studies conducted in the United States with patients who had similar
demographic characteristics. The patients were recruited from various settings, however.
Table 18: Effect of Patient Care Planning Discussions on Care in an Intensive Care Unit
Author, Year Study Design
Tool Used?
Results Intervention Results Control Odds Ratio (95% CI)
Single-Provider Discussion vs. Usual Care or No Discussion
GRADE for all evidence: Very low
Mack et al, 2012 (58)
Obs-cont No ICU care at EoL: 64/1082 (5.9%)
ICU care at EoL: 7/149 (4.7%)
1.28 (0.57, 2.84)
Wright et al, 2008 (60)
Obs-cont No ICU admission: 5/123 (4.1%)
ICU admission: 26/209 (12.4%)
0.30 (0.11, 0.80)a
Zhang et al, 2009 (53)
Obs-cont No ICU stay: 2/75 (2.7%)
ICU stay: 10/70 (14.3%)
0.16 (0.03, 0.78)a
Pooled estimate
(3 obs-cont studies, RE), I2 = 75%
0.44 (0.13, 1.53)
Abbreviations: CI, confidence interval; EoL, end of life; GRADE, Grading of Recommendations Assessment, Development, and Evaluation; ICU, intensive care unit; Obs-cont, observational study with contemporaneous control; RE, random effects. aStatistically significant at P ≤ 0.05.
Table 19 shows that earlier single-provider PCPDs were associated with a lower likelihood of receiving
ICU care at EoL (χ2 statistic: 16.606, P < 0.001; GRADE: low). (58) The data were too sparse to indicate

Ontario Health Technology Assessment Series; Vol. 14: No. 19, pp. 1–72, December 2014 48
whether or not a gradient was present, but the results showed that people who had single-provider PCPDs
more than 30 days before death were less likely to receive ICU care at the EoL.
Table 19: Effect of Timing of Patient Care Planning Discussions on Care in an Intensive Care Unit
Author, Year Study Design
Tool Used?
Results
Single-Provider Discussion vs. Usual Care or No Discussion
GRADE for all evidence: Low
Mack et al, 2012 (58)
Obs-cont No Receiving ICU care in the last 30 days of life
Days between first discussion and death:
≤ 30: 37/311 (11.9%)
31–60: 9/186 (4.8%)
61–90: 6/108 (5.6%)
> 90: 6/183 (3.3%)
χ2: 16.606, df = 3, P < 0.001a
Abbreviations: GRADE, Grading of Recommendations Assessment, Development, and Evaluation; ICU, intensive care unit; Obs-cont, observational study with contemporaneous control. aStatistically significant at P ≤ 0.05.
As shown in Table 20, patients in 2 large RCTs who received team-based PCPDs appeared to spend fewer
days in the ICU, but none of the differences was statistically significant (GRADE: high). (46;58) While
point estimates from both studies suggest that team-based PCPDs are associated with spending fewer
days in the ICU, these differences could have also resulted from chance.
Table 20: Effect of Patient Care Planning Discussions on Length of Stay in Intensive Care Unit
Author, Year Study Design
Tool Used?
Results Intervention Results Control Difference in Means (95% CI)
Team-Based Discussion vs. Usual Care or No Discussion
GRADE for highest-quality evidence: High
GRADE for all evidence: Moderate
Highest-quality evidence
Lautrette et al, 2007 (45)
Large RCT
Yes Median (IQR): 7 (4–14)
Median (IQR): 9 (5–20)
–2, P = 0.54a
Gilmer et al, 2005 (46)
Large RCT
Yes Mean (SD): 6.0 (9.4)
Mean (SD): 7.5 (10.3)
–1.50 (–3.48, 0.48)
Lower-quality evidence
Lamba et al, 2012 (64)
Obs-hist No Mean (SD): 14.6 (21.3)
Mean (SD): 17.2 (18.7)
–2.60 (–13.56, 8.36)
Norton et al, 2007 (65)
Obs-hist No Mean (SD): 9.0 (9.3)
Mean (SD): 16.3 (16.5)
–7.32 (–11.65, –2.99)b
Pooled estimate
(2 obs-hist, FE), I2 = 0%
–6.68 (–10.71, –2.65)b
Abbreviations: CI, confidence interval; FE, fixed effects; GRADE, Grading of Recommendations Assessment, Development, and Evaluation; IQR, interquartile range; Obs-hist, observational study with historical controls; RCT, randomized controlled trial; SD, standard deviation. aInformation for calculating CI was not provided. bStatistically significant at P ≤ 0.05.

Ontario Health Technology Assessment Series; Vol. 14: No. 19, pp. 1–72, December 2014 49
Home Health Visits Results from one observational study showed that patients who received single-provider PCPDs tended to
receive more home health visits than patients in the control arm (difference in means [95% CI]: 0.49
[−2.57, 3.55]; GRADE: very low). (56) It must be noted that this difference was not statistically
significant, however.
Table 21: Effect of Patient Care Planning Discussions on Home Health Visits
Author, Year Study Design
Tool Used?
Results Intervention Results Control Difference in Means (95% CI)
Single-Provider Discussion vs. Usual Care or No Discussion
GRADE for all evidence: Very low
Engelhardt et al, 2009 (56)
Obs-cont Yes Mean change from baseline (SD): 1.8 (15.9)a
Mean change from baseline (SD): 1.3 (15.3)a
0.49 (–2.57, 3.55)
Abbreviations: CI, confidence interval; GRADE, Grading of Recommendations Assessment, Development, and Evaluation; Obs-cont, observational study with contemporaneous controls; SD, standard deviation. aStandard deviations are slightly larger because information about the correlation between estimates was not provided.
Urgent Care Visits An observational study from the United States found that patients who received team-based PCPDs had
fewer urgent care visits than those in the study’s control arm (difference in means [95% CI]: −0.30
[−0.61, 0.01]; GRADE: moderate; Table 22). (57) As with some of the results discussed previously, the
difference between the study’s 2 arms was not statistically significant in the table below but was
significant in the original study. It is worth noting that, in the United States, urgent care centres are
similar to walk-in clinics that deliver ambulatory care. They are typically used for conditions that require
urgent attention, but are not serious enough to warrant a visit to an emergency department.
Table 22: Effect of Patient Care Planning Discussions on Urgent Care Visits
Author, Year Study Design
Tool Used?
Results Intervention Results Control Difference in Means (95% CI)
Team-Based Discussion vs. Usual Care or No Discussion
GRADE for all evidence: Moderate
Rabow et al, 2004 (57)
Obs-cont
No Mean (SD): 0.3 (0.5) Mean (SD): 0.6 (0.9) –0.30 (–0.61, 0.01)a, b
Abbreviations: CI, confidence interval; GRADE, Grading of Recommendations Assessment, Development, and Evaluation; Obs-cont, observational study with contemporaneous controls; SD, standard deviation. aStatistically significant at P ≤ 0.05. bSignificant difference was shown in the paper, but the difference was not significant in this estimate.
Other Outpatient Visits The results in Table 23 show that patients who received single-provider PCPDs tended to have more
outpatient visits than those in the control group (difference in means [95% CI]: 2.4 [−4.2, 9.0]; GRADE:
low), but the difference was not statistically significant. (56) The results also show that team-based PCPDs
were significantly associated with having fewer outpatient visits (differences in means [95% CI]: −5.2 [−9.7,
−0.7]; GRADE: moderate). (57) While the 2 sets of results may seem contradictory, they are not entirely
surprising, because patients who receive team-based PCPDs may have all of their needs met by the team
that is delivering the intervention. Furthermore, the study from which the latter result was taken featured a
team-based PCPD with a team that included a psychologist, a pharmacist, a nurse, and 3 physicians.

Ontario Health Technology Assessment Series; Vol. 14: No. 19, pp. 1–72, December 2014 50
Table 23: Effect of Patient Care Planning Discussions on Other Outpatient Visits
Author, Year Study Design
Tool Used?
Results Intervention Results Control Difference in Means (95% CI)
Single-Provider Discussion vs. Usual Care or No Discussion
GRADE for all evidence: Low
Engelhardt et al, 2009 (56)
Obs-cont
Yes Outpatient visits
Mean change from baseline (SD):
−0.4 (32.5)a
Outpatient visits
Mean change from baseline (SD):
−2.8 (34.8)a
2.39 (−4.18, 8.96)
Team-Based Discussion vs. Usual Care or No Discussion
GRADE for all evidence: Moderate
Rabow et al, 2004 (57)
Obs-cont
No Clinic and specialist visits combined
Mean (SD): 12.4 (9.5)
Clinic and specialist visits combined
Mean (SD): 17.6 (11.8)
−5.20 (−9.70, −0.70)b
Abbreviations: CI, confidence interval; GRADE, Grading of Recommendations Assessment, Development, and Evaluation; Obs-cont, observational study with contemporaneous controls; SD, standard deviation. aStandard deviations are slightly larger because information about the correlation between estimates was not provided. bStatistically significant at P ≤ 0.05.
Hospice Care One large RCT showed that patients who received single-provider PCPDs were more likely to receive
hospice care at the EoL when compared with their controls (OR [95% CI]: 5.17 [2.03, 13.17]; GRADE:
high). (48) Further details about the results for this outcome are presented in Table 24.
Table 24: Effect of Patient Care Planning Discussions on Receiving Hospice Care
Author, Year Study Design
Tool Used?
Results Intervention Results Control Odds Ratio (95% CI)
Single-Provider Discussion vs. Usual Care or No Discussion
GRADE for highest-quality evidence: High
GRADE for all evidence: Moderate
Highest-quality evidence
Casarett et al, 2005 (48)
Large RCT
Yes Hospice enrolment: 27/107 (25.2%)
Hospice enrolment: 6/98 (6.1%)
5.17 (2.03, 13.17)a
Lower-quality evidence
Mack et al, 2012 (58)
Obs-cont No Any hospice care: 688/1082 (63.6%)
Any hospice care: 30/149 (20.1%)
6.93 (4.56, 10.53)a
Mack et al, 2010b (59)
Obs-cont No Hospice care for > 1 week:
79/113 (69.9%)
Hospice care for > 1 week:
115/219 (52.5%)
2.10 (1.30, 3.40)a
Wright et al, 2008 (60)
Obs-cont No Hospice care for > 1 week:
80/122 (65.6%)
Hospice care for > 1 week:
93/209 (44.5%)
2.38 (1.50, 3.77)a
Zhang et al, 2009 (53)
Obs-cont No Hospice care for > 1 week:
56/75 (74.7%)
Hospice care for > 1 week:
36/70 (51.4%)
2.78 (1.38, 5.61)a

Ontario Health Technology Assessment Series; Vol. 14: No. 19, pp. 1–72, December 2014 51
Author, Year Study Design
Tool Used?
Results Intervention Results Control Odds Ratio (95% CI)
Pooled estimate
(3 obs-cont studies, FE), I2 = 0%
2.33 (1.72, 3.15)a
Abbreviations: CI, confidence interval; FE, fixed effects; GRADE, Grading of Recommendations Assessment, Development, and Evaluation; Obs-cont, observational study with contemporaneous controls; RCT, randomized controlled trial; SD, standard deviation. aStatistically significant at P ≤ 0.05. bRaw numbers were not provided in the article and were therefore estimated using the odds ratio and algebraic formulas.
As was seen with other results related to the timing of PCPDs, earlier PCPDs were associated with more
optimal health service use at the EoL. An observational study with contemporaneous controls showed that
earlier single-provider PCPDs were associated with a higher likelihood of receiving hospice care, as
shown in Table 25 (χ2 statistic: 50.756, P < 0.001; GRADE: moderate). (58)
Table 25: Effect of Timing of Patient Care Planning Discussions on Receiving Hospice Care
Author, Year Study Design
Tool Used?
Results
Single-Provider Discussion vs. Usual Care or No Discussion
GRADE for all evidence: Moderate
Mack et al, 2012 (58)
Obs-cont No Receiving any hospice care
Days between first discussion and death:
≤ 30: 152/311 (48.9%)
31−60: 126/186 (67.7%)
61−90: 80/108 (74.1%)
> 90: 146/189 (77.2%)
χ2: 50.756, df = 3, P < 0.001a
Abbreviations: GRADE, Grading of Recommendations Assessment, Development, and Evaluation; Obs-cont, observational study with contemporaneous control. aStatistically significant at P ≤ 0.05.
Summary of Findings
The findings from the highest-quality evidence for each outcome assessed in this EBA are summarized in
Tables 26 and 27. While PCPDs might not have been associated with patients’ QoL or satisfaction with
care, they were associated with families’ satisfaction with the care their loved ones received and with
greater concordance between patients’ wishes and those of their families. This concordance is one of the
first steps in achieving optimal communication about EoL care, as is shown in CARENET’s model
(Figure 1). The next stage of the model focuses on the completion of ACP documents and processes;
again, the results from the EBA indicate that PCPDs were associated with this stage of the process of
communicating about EoL care. The last stage of the model focuses on the care patients receive. While
the results from this EBA do not suggest that PCPDs improved concordance between patients’ wishes and
the care they received, PCPDs were associated with receiving less aggressive care at EoL, a lower
likelihood of being resuscitated, and a greater likelihood of receiving hospice care. These health care use
outcomes are consistent with patients’ stated preference for less aggressive care at EoL. (10) Furthermore,
the results from this analysis unequivocally show that earlier PCPDs lead to better outcomes than later
discussions. Notably, however, all of the PCPDS in this study were provided to an EoL population (i.e.,
adults with life-threatening illnesses who are not expected to recover or stabilize).

Ontario Health Technology Assessment Series; Vol. 14: No. 19, pp. 1–72, December 2014 52
Table 26: Summary of the Highest-Quality Evidence on Outcomes of Patient Care Planning Discussions
Outcome Single-Provider Discussion vs. Usual
Care or No Discussion Team-Based Discussion vs. Usual
Care or No Discussion
Effect Estimate (95% CI) GRADE Effect Estimate (95% CI) GRADE
Patient’s QoL SMD
0.47 (−0.58, 1.52)
0.44 (−0.52, 1.37)
0.34 (−0.13, 0.80)a, b
0.01 (−0.19, 0.20)
Very low SMD
0.03 (−0.17, 0.23)
Moderate
Informal caregiver’s QoL Estimates NA Very low NA
Patient’s satisfaction with EoL care
OR
Very satisfied: 8.24 (3.72, 18.26)a
Satisfied or very satisfied: 4.00 (0.83, 19.19)
MD
−0.2 (−3.4, 2.9)
SMD
−0.96 (−1.61, −0.32)a
Moderate SMD
0.39 (0.17, 0.60)a
High
Family’s satisfaction with EoL care
OR
Very satisfied: 5.17 (1.52, 17.58)a
Satisfied or very satisfied: 2.48 (0.55, 11.10)
MD
2.10 (1.75, 2.45)a
4.6
High NA
Concordance between patient’s wishes and care received
OR
1.73 (0.76, 3.90)
High NA
Concordance between patient’s and family’s wishes
OR
4.32, P < 0.001a
MD
1.4, P = 0.002a
High NA
Completion of ACP documents and processes
Differences in Proportions
25% (17, 33)a
77% (70, 83)a
13% (5, 19)a
High Differences in Proportions
22% (15, 30)a
High
Receiving chemotherapy at EoL
OR
0.50 (0.35, 0.72)a
Low NA
Resuscitation OR
0.13 (0.03, 0.55)a
Very low NA

Ontario Health Technology Assessment Series; Vol. 14: No. 19, pp. 1–72, December 2014 53
Outcome Single-Provider Discussion vs. Usual
Care or No Discussion Team-Based Discussion vs. Usual
Care or No Discussion
Effect Estimate (95% CI) GRADE Effect Estimate (95% CI) GRADE
Receiving hospital care MD
−0.21, P = 0.04a
High MD
0.40 (−0.24, 1.04)b
Low
Hospital LOS MD
−1.8, P = 0.03a
High MD
0
−3.00 (−6.07, 0.07)a, b
Low
ED visits MD
−1.27 (−3.34, 0.80)
Low MD
−0.10 (−1.16, 0.96)
Moderate
ICU care OR
0.44 (0.13, 1.53)
Very low NA
ICU LOS NA MD
−2
−1.50 (−3.48, 0.48)
High
Home health visits MD
0.49 (−2.57, 3.55)
Very low NA
Urgent care visits NA MD
−0.30 (−0.61, 0.01)a, b
Moderate
Other outpatient visits MD
2.39 (−4.18, 8.96)
Low MD
−5.20 (−9.70, −0.70)a
Moderate
Receiving hospice care OR
5.17 (2.03, 13.17)a
High NA
Abbreviations: ACP, advance care planning; CI, confidence interval; ED, emergency department; EoL, end of life; GRADE, Grading of Recommendations Assessment, Development, and Evaluation; ICU, intensive care unit; LOS, length of stay; MD, difference in means; NA, not available; OR, odds ratio; QoL, quality of life; SMD, standardized mean difference. aStatistically significant at P ≤ 0.05. bSignificant difference was shown in the paper, but the difference was not significant in this estimate because the standard deviations for the MDs were estimated conservatively.
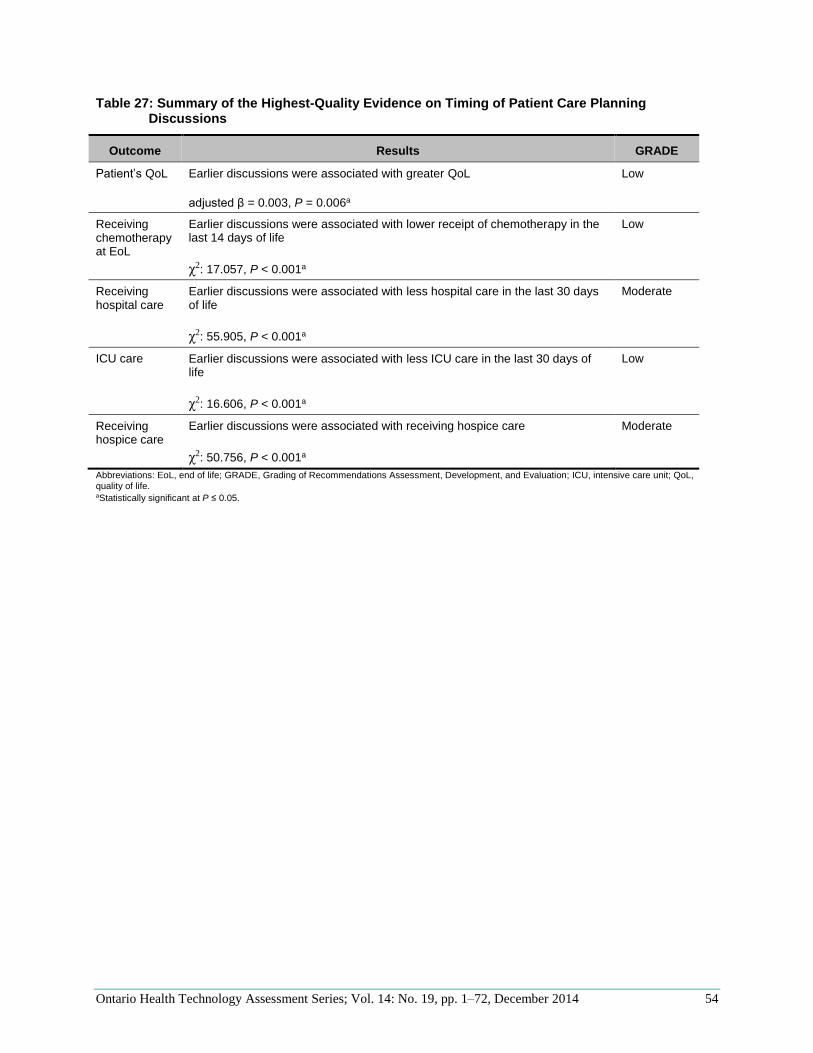
Ontario Health Technology Assessment Series; Vol. 14: No. 19, pp. 1–72, December 2014 54
Table 27: Summary of the Highest-Quality Evidence on Timing of Patient Care Planning Discussions
Outcome Results GRADE
Patient’s QoL Earlier discussions were associated with greater QoL
adjusted β = 0.003, P = 0.006a
Low
Receiving chemotherapy at EoL
Earlier discussions were associated with lower receipt of chemotherapy in the last 14 days of life
χ2: 17.057, P < 0.001a
Low
Receiving hospital care
Earlier discussions were associated with less hospital care in the last 30 days of life
χ2: 55.905, P < 0.001a
Moderate
ICU care Earlier discussions were associated with less ICU care in the last 30 days of life
χ2: 16.606, P < 0.001a
Low
Receiving hospice care
Earlier discussions were associated with receiving hospice care
χ2: 50.756, P < 0.001a
Moderate
Abbreviations: EoL, end of life; GRADE, Grading of Recommendations Assessment, Development, and Evaluation; ICU, intensive care unit; QoL, quality of life. aStatistically significant at P ≤ 0.05.

Ontario Health Technology Assessment Series; Vol. 14: No. 19, pp. 1–72, December 2014 55
Conclusions
Based on the best available evidence, it is clear that single-provider and team-based patient care planning
discussions (PCPDs) provide benefits for patients at the end of life (EoL) and their families. These
benefits can be observed in terms of patient-centred outcomes and the use of health care resources.
Additionally, earlier PCPDs are associated with better patient-centred and utilization outcomes.
High-quality evidence with large magnitudes of effect lend moderate certainty to the conclusion that
single-provider PCPDs:
Improve families’ satisfaction with EoL care and concordance between patients’ and families’
wishes.
Reduce the likelihood of receiving hospital care and the number of days spent in hospital.
Increase the completion of advance care planning (ACP) processes and documents and the
likelihood of receiving hospice care.
Moderate- to high-quality evidence with large magnitudes of effect indicate, with moderate certainty, that
team-based PCPDs:
Increase patient satisfaction and the completion of ACP documents and processes.
Reduce the number of days spent in intensive care and decrease the use of outpatient services.
Finally, moderate-quality evidence indicates that earlier PCPDs are associated with reduced hospital care
and with increased hospice care.
The body of evidence used in this evidence-based analysis suffered from common limitations, described
below.
Some of the randomized controlled trials were unblinded, and in some cases blinding was done
inappropriately or not reported. This could have led to an overestimation of the effect estimates.
Most studies did not specify how missing data were handled. Because the patients included in the
studies were at the EoL, and patients who died likely had a different EoL trajectory or prognosis
than those who completed the studies, missing data could have introduced attrition bias. The
direction in which this bias would have affected the results is unclear.
In some observational studies, exposure to the intervention was measured on the basis of a
patient’s or family member’s response to a single question about discussing EoL care plans with a
health care provider. Furthermore, the interventions were often not described in enough detail. As
a result, it was impossible to compare multiple components of each intervention or assess how
well the intervention was delivered.
Usual care was not defined in most studies, so it is possible that some effect estimates, especially
those related to team-based PCPDs, were underestimated.
Studies that measured satisfaction with care and quality of life used a variety of instruments that
did not consistently assess the same components of the construct being measured, so their results,
as part of an overall body of evidence for those outcomes, should be interpreted cautiously.
Ontario Health Technology Assessment Series; Vol. 14: No. 19, pp. 1–72, December 2014 56
Acknowledgements
Editorial Staff Elizabeth Jean Betsch, ELS
Medical Information Services Corinne Holubowich, BEd, MLIS
Kellee Kaulback, BA(H), MISt
Health Quality Ontario’s Expert Advisory Panel on End-of-Life Care
Panel Member Affiliation(s) Appointment(s)
Panel Co-Chairs
Dr Robert Fowler Sunnybrook Research Institute
University of Toronto
Senior Scientist
Associate Professor
Shirlee Sharkey St. Elizabeth Health Care Centre President and CEO
Professional Organizations Representation
Dr Scott Wooder Ontario Medical Association President
Health Care System Representation
Dr Douglas Manuel Ottawa Hospital Research Institute
University of Ottawa
Senior Scientist
Associate Professor
Primary/ Palliative Care
Dr Russell Goldman Mount Sinai Hospital, Tammy Latner Centre for Palliative Care
Director
Dr Sandy Buchman
Mount Sinai Hospital, Tammy Latner Centre for Palliative Care Cancer Care Ontario University of Toronto
Educational Lead
Clinical Lead QI
Assistant Professor
Dr Mary Anne Huggins Mississauga Halton Palliative Care Network; Dorothy Ley Hospice
Medical Director
Dr Cathy Faulds London Family Health Team Lead Physician
Dr José Pereira The Ottawa Hospital University of Ottawa
Professor, and Chief of the Palliative Care program at The Ottawa Hospital
Dean Walters Central East Community Care Access Centre Nurse Practitioner
Critical Care
Dr Daren Heyland Clinical Evaluation Research Unit Kingston General Hospital
Scientific Director
Oncology
Dr Craig Earle Ontario Institute for Cancer Research Director of Health Services

Ontario Health Technology Assessment Series; Vol. 14: No. 19, pp. 1–72, December 2014 57
Panel Member Affiliation(s) Appointment(s)
Cancer Care Ontario Research Program
Internal Medicine
Dr John You McMaster University Associate Professor
Geriatrics
Dr Daphna Grossman Baycrest Health Sciences Deputy Head Palliative Care
Social Work
Mary-Lou Kelley
School of Social Work and Northern Ontario School of Medicine
Lakehead University
Professor
Emergency Medicine
Dr Barry McLellan Sunnybrook Health Sciences Centre President and Chief Executive Officer
Bioethics
Robert Sibbald London Health Sciences Centre University of Western Ontario
Professor
Nursing
Vicki Lejambe Saint Elizabeth Health Care Advanced Practice Consultant
Tracey DasGupta Sunnybrook Health Sciences Centre Director, Interprofessional Practice
Mary Jane Esplen De Souza Institute University of Toronto
Director Clinician Scientist
Abbreviations: CEO, Chief Executive Officer; QI, Quality Improvement.

Ontario Health Technology Assessment Series; Vol. 14: No. 19, pp. 1–72, December 2014 58
Appendices
Appendix 1: Literature Search Strategies
Search date: October 9, 2013
Databases searched: Ovid MEDLINE, Ovid MEDLINE In-Process, Embase, All EBM Databases (see below),
CINAHL
Database: EBM Reviews - Cochrane Database of Systematic Reviews <2005 to August 2013>, EBM Reviews -
ACP Journal Club <1991 to September 2013>, EBM Reviews - Database of Abstracts of Reviews of Effects <3rd
Quarter 2013>, EBM Reviews - Cochrane Central Register of Controlled Trials <September 2013>, EBM Reviews -
Cochrane Methodology Register <3rd Quarter 2012>, EBM Reviews - Health Technology Assessment <3rd Quarter
2013>, EBM Reviews - NHS Economic Evaluation Database <3rd Quarter 2013>, Embase <1980 to 2013 Week
40>, Ovid MEDLINE(R) <1946 to September Week 4 2013>, Ovid MEDLINE(R) In-Process & Other Non-Indexed
Citations <October 01, 2013
Search Strategy:
# Searches Results
1 exp Terminal Care/ 86347
2 exp Palliative Care/ use mesz,acp,cctr,coch,clcmr,dare,clhta,cleed 41169
3 exp palliative therapy/ use emez 61505
4 exp Terminally Ill/ use mesz,acp,cctr,coch,clcmr,dare,clhta,cleed 5628
5 exp terminally ill patient/ use emez 5936
6 exp terminal disease/ use emez 4501
7 exp dying/ use emez 5665
8 ((End adj2 life adj2 care) or EOL care or (terminal* adj2 (care or caring or ill* or disease*)) or
palliat* or dying or (Advanced adj3 (disease* or illness*)) or end stage*).ti,ab. 336689
9 or/1-8 430311
10 exp Patient Care Planning/ 79710
11 ((goal* adj2 care) or patient care plan* or advance care plan*).ti,ab. 5370
12 ((communicat* or conversation* or conference* or discuss* or consult*) adj2 (strateg* or plan* or
model* or intervention* or framework* or care or program* or process*)).ti,ab. 83458
13 or/10-12 165666
14 9 and 13 10891
15 limit 14 to english language [Limit not valid in CDSR,ACP Journal Club,DARE,CCTR,CLCMR;
records were retained] 10171
16 limit 15 to yr="2004 -Current" [Limit not valid in DARE; records were retained] 6293
17 limit 16 to yr="2009 -Current" [Limit not valid in DARE; records were retained] 4023
18 remove duplicates from 17 2853
19 limit 16 to yr="2004 - 2008" [Limit not valid in DARE; records were retained] 2270
20 remove duplicates from 19 1473
21 18 or 20 4326

Ontario Health Technology Assessment Series; Vol. 14: No. 19, pp. 1–72, December 2014 59
CINAHL
# Query Results
S1 (MH "Terminal Care+") 38,947
S2 (MH "Palliative Care") 19,702
S3 (MH "Terminally Ill Patients+") 7,636
S4 ((End N2 life N2 care) or EOL care or (terminal* N2 (care or caring or ill* or disease*)) or palliat* or
dying or (advanced N3 (disease* or illness*)) or end stage*) 52,178
S5 S1 OR S2 OR S3 OR S4 60,161
S6 (MH "Patient Care Plans+") 6,983
S7 ((goal* N2 care) or patient care plan* or advance care plan*) 6,438
S8 ((communicat* or conversation* or conference* or discuss* or consult*) N2 (strateg* or plan* or
model* or intervention* or framework* or care or program* or process*)) 19,731
S9 S6 OR S7 OR S8 29,515
S10 S5 AND S9 2,848
S11
S5 AND S9
Limiters - Published Date: 20040101-20131231; English Language
2,237

Ontario Health Technology Assessment Series; Vol. 14: No. 19, pp. 1–72, December 2014 60
Appendix 2: Evidence Quality Assessment
Table A1: GRADE Evidence Profile for Comparison of Single-Provider Discussions and Usual Care or No Discussion
Number of Studies (Design)
Risk of Bias Inconsistency Indirectness Imprecision Publication Bias Upgrade Considerations
Quality
Patient’s Quality of Life
1 (RCT)
2 (observational)
Serious limitations (–1)a
No serious limitations
No serious limitations
Serious limitations (–1)b
Undetected Large magnitude of effect (+1)
⊕ Very low
Informal Caregiver’s Quality of Life
1 (RCT) Very serious limitations (–2)c
No serious limitations
No serious limitations
Serious limitations (–1)b
Undetected None ⊕ Very low
Patient’s Satisfaction with End-of-Life Care
3 (RCTs) No serious limitations
Serious limitations (–1)d
No serious limitations
No serious limitations
Undetected None ⊕⊕⊕ Moderate
Family’s Satisfaction with End-of-Life Care
3 (RCTs) No serious limitations
No serious limitations
No serious limitations
No serious limitations
Undetected None ⊕⊕⊕⊕ High
Concordance Between Patient’s Wishes and Care Received
1 (RCT) No serious limitations
No serious limitations
No serious limitations
No serious limitations
Undetected None ⊕⊕⊕⊕ High
Concordance Between Patient’s and Family’s Wishes
2 (RCTs) No serious limitations
No serious limitations
No serious limitations
No serious limitations
Undetected None ⊕⊕⊕⊕ High
Completion of Advance Care Planning Documents and Processes
3 (RCTs) No serious limitations
No serious limitations
No serious limitations
No serious limitations
Undetected None ⊕⊕⊕⊕ High
Receiving Chemotherapy at End of Life
3 (observational) Serious limitations (–1)e,f
No serious limitations
No serious limitations
No serious limitations
Undetected Large magnitude of effect (+1)
⊕⊕ Low
Resuscitation
2 (observational) Serious limitations (–1)e,f
No serious limitations
No serious limitations
Serious limitations (–1)b
Undetected Large magnitude of effect (+1)
⊕ Very low
Receiving Hospital Care
1 (RCT) No serious limitations
No serious limitations
No serious limitations
No serious limitations
Undetected None ⊕⊕⊕⊕ High

Ontario Health Technology Assessment Series; Vol. 14: No. 19, pp. 1–72, December 2014 61
Number of Studies (Design)
Risk of Bias Inconsistency Indirectness Imprecision Publication Bias Upgrade Considerations
Quality
Hospital Length of Stay
1 (RCT) No serious limitations
No serious limitations
No serious limitations
No serious limitations
Undetected None ⊕⊕⊕⊕ High
Emergency Department Visits
1 (observational) No serious limitations
No serious limitations
No serious limitations
No serious limitations
Undetected None ⊕⊕ Low
Intensive Care Unit Care
3 (observational) Serious limitations (–1)e,f
Serious limitations (–1)d
No serious limitations
No serious limitations
Undetected Large magnitude of effect (+1)
⊕ Very low
Home Health Visits
1 (observational) No serious limitations
No serious limitations
No serious limitations
Serious limitations (–1)b
Undetected None ⊕ Very low
Other Outpatient Visits
1 (observational) No serious limitations
No serious limitations
No serious limitations
Serious limitations (–1)b
Undetected Large magnitude of effect (+1)
⊕⊕ Low
Receiving Hospice Care
1 (RCT) No serious limitations
No serious limitations
No serious limitations
Serious limitations (–1)b
Undetected None ⊕⊕⊕⊕ High
Abbreviations: GRADE, Grading of Recommendations Assessment, Development, and Evaluation; RCT, randomized controlled trial.
aRandomized controlled trial has serious risk of bias because of concerns about allocation concealment and blinding, and 1 observational study did not adequately account for confounding. bWide confidence intervals. cVery high level of attrition and uncertainty about who was blinded or how blinding was achieved. dResults were inconsistent. eObservational studies had some limitations related to how the exposure was assessed. fObservational studies had limitations related to confounding.
Table A2: GRADE Evidence Profile for Comparison of Team-Based Discussions and Usual Care or No Discussion
Number of Studies (Design)
Risk of Bias Inconsistency Indirectness Imprecision Publication Bias Upgrade Considerations
Quality
Patient’s Quality of Life
1 (RCT) No serious limitations
No serious limitations
No serious limitations
Serious limitations (–1)a
Undetected None ⊕⊕⊕ Moderate
Patient’s Satisfaction with End-of-Life Care
1 (RCT) No serious limitations
No serious limitations
No serious limitations
No serious limitations
Undetected None ⊕⊕⊕⊕ High

Ontario Health Technology Assessment Series; Vol. 14: No. 19, pp. 1–72, December 2014 62
Number of Studies (Design)
Risk of Bias Inconsistency Indirectness Imprecision Publication Bias Upgrade Considerations
Quality
Completion of Advance Care Planning Documents and Processes
1 (RCT) No serious limitations
No serious limitations
No serious limitations
No serious limitations
Undetected None ⊕⊕⊕⊕ High
Receiving Hospital Care
1 (observational) No serious limitations
No serious limitations
No serious limitations
Serious limitations (–1)a
Undetected All plausible confounding increases confidence in estimate (+1)
⊕⊕ Low
Hospital Length of Stay
2 (RCT) Serious limitations (–1)b
Serious limitations (–1)c
No serious limitations
No serious limitations
Undetected None ⊕⊕ Low
Emergency Department Visits
1 (observational) No serious limitations
No serious limitations
No serious limitations
No serious limitations
Undetected All plausible confounding increases confidence in estimate (+1)
⊕⊕⊕ Moderate
Intensive Care Unit Length of Stay
2 (RCT) No serious limitations
No serious limitations
No serious limitations
No serious limitations
Undetected None ⊕⊕⊕⊕ High
Urgent Care Visits
1 (observational) No serious limitations
No serious limitations
No serious limitations
No serious limitations
Undetected All plausible confounding increases confidence in estimate (+1)
⊕⊕⊕ Moderate
Other Outpatient Visits
1 (observational) No serious limitations
No serious limitations
No serious limitations
Serious limitations (–1)a
Undetected Large magnitude of effect (+1)
All plausible confounding increases confidence in estimate (+1)
⊕⊕⊕ Moderate
Abbreviations: GRADE, Grading of Recommendations Assessment, Development, and Evaluation; RCT, randomized controlled trial.
aWide confidence intervals. bRCTs suffer limitations because of blinding and allocation concealment. cOne study showed that the intervention had beneficial effects and the other showed no effect.

Ontario Health Technology Assessment Series; Vol. 14: No. 19, pp. 1–72, December 2014 63
Table A3: GRADE Evidence Profile for Timing of Patient Care Planning Discussions
Number of Studies (Design)
Risk of Bias Inconsistency Indirectness Imprecision Publication Bias Upgrade Considerations
Quality
Patient’s Quality of Life
1 (observational) Serious limitations (–1)a
No serious limitations
No serious limitations
No serious limitations
Undetected Dose-response gradient (+1)
⊕⊕ Low
Receiving Chemotherapy at End of Life
1 (observational) Serious limitations (–1)b
No serious limitations
No serious limitations
No serious limitations
Undetected Large magnitude of effect (+1)
⊕⊕ Low
Receiving Hospital Care
1 (observational) Serious limitations (–1)b
No serious limitations
No serious limitations
No serious limitations
Undetected Large magnitude of effect (+1)
Dose-response gradient (+1)
⊕⊕⊕ Moderate
Intensive Care Unit Care
1 (observational) Serious limitations (–1)b
No serious limitations
No serious limitations
No serious limitations
Undetected Large magnitude of effect (+1)
⊕⊕ Low
Receiving Hospice Care
1 (observational) Serious limitations (–1)b
No serious limitations
No serious limitations
No serious limitations
Undetected Large magnitude of effect (+1)
Dose-response gradient (+1)
⊕⊕⊕ Moderate
Abbreviations: GRADE, Grading of Recommendations Assessment, Development, and Evaluation; RCT, randomized controlled trial. aInformation about what variables were adjusted for in the multivariable model was missing. bObservational study suffered from limitations in how the exposure was measured and in confounding.

Ontario Health Technology Assessment Series; Vol. 14: No. 19, pp. 1–72, December 2014 64
Table A4: Risk of Bias Among Randomized Controlled Trials for Comparison of Single-Provider Discussions and Usual Care or No Discussion
Author, Year Allocation Concealment
Blinding Complete Accounting of Patients and
Outcome Events
Selective Reporting Bias
Other Limitations
Kirchhoff et al, 2012 (40); Kirchhoff et al 2010 (41)
No limitations Limitationsa Limitationsb No limitations No limitations
Au et al, 2012 (42) No limitations Limitationsc No limitations No limitations Limitationsd
Sampson et al, 2011 (51)
No limitations Unclear Limitationsb No limitations Limitationse
Detering et al, 2010 (39) No limitations Limitationsf Limitationsb No limitations No limitations
Clayton et al, 2007 (44) No limitations No limitations Limitationsb No limitations No limitations
Casarett et al, 2005 (48) No limitations Limitationsg Limitationsb No limitations No limitations
Song et al, 2005 (49) No limitations Limitationsh Limitationsb No limitations No limitations
Nicolasora et al, 2006 (47)
No limitations Unclear Limitationsb No limitations No limitations
Dyar et al, 2012 (50) Unclear Unclear Limitationsb No limitations Limitationsi
Jones et al, 2011 (52) No limitations No limitations Limitationsb No limitations No limitations
Abbreviations: RCT, randomized controlled trial. aFacilitators unblinded because nature of the intervention made blinding impossible. bExcluded patients with missing data, which could have introduced bias because patients with missing data likely died during the course of the study and were different from those with complete data. cPatients and providers were unblinded, because nature of the intervention made blinding impossible. dPhysicians were randomized, not patients, so patients were clustered by physician; individual-level estimates are therefore not completely independent. eVery high attrition likely introduced selection bias. fResearchers administering questionnaires were blinded initially, but some responses given by participants made patient allocation obvious. gStudy personnel were unblinded because of nature of the study, but patients were blinded. hPatients and personnel were unblinded after baseline because of nature of the intervention.
iStopped study when positive effect was found.

Ontario Health Technology Assessment Series; Vol. 14: No. 19, pp. 1–72, December 2014 65
Table A5: Risk of Bias among Randomized Controlled Trials for Comparison of Team-Based Discussions and Usual Care or No Discussion
Author, Year Allocation Concealment
Blinding Complete Accounting of Patients and
Outcome Events
Selective Reporting Bias
Other Limitations
Gade et al, 2008 (43) No limitations Unclear Limitationsa No limitations No limitations
Lautrette et al, 2007 (45) No limitations No limitations Limitationsa No limitations No limitations
Gilmer et al, 2005 (46) Unclear Unclear Limitationsa No limitations No limitations aExcluded patients with missing data, which could have introduced bias because patients with missing data likely died during the course of the study and were different from those with complete data.
Table A6: Risk of Bias among Observational Trials for Comparison of Single-Provider Discussions and Usual Care or No Discussion
Author, Year Appropriate Eligibility Criteria
Appropriate Measurement of
Exposure
Appropriate Measurement of
Outcome
Adequate Control for Confounding
Complete Follow-Up
Observational with Contemporaneous Controls
Evangelista et al, 2012 (54)
No limitations No limitations No limitations No limitations No limitations
Jacobsen et al, 2011 (55)
No limitations No limitations No limitations Limitationsa No limitations
Engelhardt et al, 2009 (56)
No limitations No limitations No limitations Limitationsb No limitations
Mack et al, 2012 (58) No limitations Limitationsc No limitations Unclear No limitations
Mack et al, 2010 (59) No limitations Limitationsc No limitations No limitations No limitations
Wright et al, 2008 (60) No limitations Limitationsc No limitations No limitations No limitations
Morrison et al, 2005 (62) No limitations No limitations No limitations Limitationsd No limitations
Zhang et al, 2009 (53) No limitations Limitationse No limitations Limitationsd No limitations
Briggs et al, 2004 (63) No limitations No limitations No limitations Limitationsf No limitations
Observational with Historical Controls
Lindner et al, 2007 (66) No limitations No limitations No limitations No limitations No limitations
Cross-Sectional
Leung et al, 2012 (67) No limitations Limitationse Limitationsg No limitations No limitations

Ontario Health Technology Assessment Series; Vol. 14: No. 19, pp. 1–72, December 2014 66
Mori et al, 2013 (68) No limitations Limitationse No limitations No limitations No limitations
Heyland et al, 2009 (11) No limitations Limitationse Limitationsg Limitationsf No limitations aConsidered only differences in age and sex; other demographic factors and potential prognostic factors not accounted for. bParticipants in the 2 arms differed on the basis of age and sex, and surrogates in the 2 arms differed on the basis of sex; diagnosis was the only prognostic factor assessed. cExposure was assessed on basis of patient’s medical record, not through observation of the intervention being administered. dParticipants in the 2 arms differed on a few prognostic factors, but not on demographic factors. eExposure was assessed on basis of patient’s response to a single question about discussing wishes with the physician. fParticipants in the 2 arms differed on prognostic factors and demographic factors. gUsed Likert score instead of a validated scale.
Table A7: Risk of Bias Among Observational Trials for Comparison of Team-Based Discussions and Usual Care or No Discussion
Author, Year Appropriate Eligibility Criteria
Appropriate Measurement of
Exposure
Appropriate Measurement of
Outcome
Adequate Control for Confounding
Complete Follow-Up
Observational with Contemporaneous Controls
Rabow et al, 2004 (57) No limitations No limitations No limitations No limitations No limitations
Casarett et al, 2008 (61) No limitations No limitations No limitations Limitationsa No limitations
Observational with Historical Controls
Lamba et al, 2012 (64) No limitations No limitations No limitations Limitationsb No limitations
Norton et al, 2007 (65) No limitations No limitations No limitations No limitations No limitations aParticipants in the 2 arms differed on a few demographic and prognostic factors, but were similar overall. bConsidered only differences in age and sex; other demographic factors and potential prognostic factors not accounted for.
Ontario Health Technology Assessment Series; Vol. 14: No. 19, pp. 1–72, December 2014 67
References
(1) Lorenz KA, Lynn J, Morton SC, Dy SM, Shugarman LM, Wilkinson A, et al. Methodological
approaches for a systematic review of end-of-life care. J Palliat Med. 2005;8 Suppl 1:S4-11.
(2) Statistics Canada. Table 3-6. Ten leading causes of death, by sex and geography, 2009—Ontario.
[Ottawa]: Statistics Canada; 2012 [cited 2014 Feb. 13]. Available from:
http://www.statcan.gc.ca/pub/84-215-x/2012001/tbl/t019-eng.htm.
(3) Hales S, Zimmermann C, Rodin G. The quality of dying and death. Arch Intern Med.
2008;168(9):912-8.
(4) Ferrell BR. Overview of the domains of variables relevant to end-of-life care. J Palliat Med.
2005;8 Suppl 1:S22-S29.
(5) You JJ, Fowler RA, Heyland DK. Just ask: discussing goals of care with patients in hospital with
serious illness. CMAJ. 2014 Apr 1;186(6):425-32.
(6) Gauvin F-P, Lavis JN. Evidence brief: improving end-of-life communication, decision-making
and care in Ontario. Hamilton (ON): McMaster Health Forum. 2013 Oct. 119 p.
(7) Fawole OA, Dy SM, Wilson RF, Lau BD, Martinez KA, Apostol CC, et al. A systematic review
of communication quality improvement interventions for patients with advanced and serious
illness. J Gen Intern Med. 2012;28(4):570-7.
(8) Scheunemann LP, McDevitt M, Carson SS, Hanson LC. Randomized, controlled trials of
interventions to improve communication in intensive care: a systematic review. Chest.
2011;139(3):543-54.
(9) Robinson L, Dickinson C, Rousseau N, Beyer F, Clark A, Hughes, J et al. A systematic review of
the effectiveness of advance care planning interventions for people with cognitive impairment
and dementia. Age Ageing. 2012;41(2):263-9.
(10) Heyland DK, Barwich D, Pichora D, Dodek P, Lamontagne F, You JJ, et al. Failure to engage
hospitalized elderly patients and their families in advance care planning. JAMA Intern Med.
2013;173(9):778-87.
(11) Heyland DK, Allan DE, Rocker G, Dodek P, Pichora D, Gafni A, et al. Discussing prognosis with
patients and their families near the end of life: impact on satisfaction with end-of-life care. Open
Med 2009;3(2):e101-e110.
(12) Canadian Institute for Health Information. National Health Expenditure Trends, 1975 to 2013.
Ottawa (ON): CIHI. 2013. 161 p.
(13) PubMed. Patient Care Planning. 2013 [cited 2014 Jan. 6]; Available from:
URL:http://www.ncbi.nlm.nih.gov/mesh/68010347
(14) Petticrew M. When are complex interventions "complex"? When are simple interventions
"simple"? Eur J Public Health 2011;21(4):397-8.

Ontario Health Technology Assessment Series; Vol. 14: No. 19, pp. 1–72, December 2014 68
(15) Higgins JPT, Green SE. Cochrane handbook for systematic reviews of interventions, version
5.1.0. 2011 [cited 2013 Sept. 20]; Available from: www.cochrane-handbook.org.
(16) Guyatt GH, Oxman AD, Schunemann HJ, Tugwell P, Knottnerus A. GRADE guidelines: a new
series of articles in the Journal of Clinical Epidemiology. J Clin Epidemiol. 2011;64(4):380-2.
(17) Goodman C. Literature searching and evidence interpretation for assessing health care practices.
Stockholm, Sweden: Swedish Council on Technology Assessment in Health Care. 1996. 81 p.
119E.
(18) Barnes S, Gardiner C, Gott M, Payne S, Chady B, Small N, et al. Enhancing patient-professional
communication about end-of-life issues in life-limiting conditions: a critical review of the
literature. J Pain Symptom Manage. 2012;44(6):866-79.
(19) Lorenz KA, Lynn J, Dy SM, Shugarman LR, Wilkinson A, Mularski RA, et al. Evidence for
improving palliative care at the end of life: a systematic review. Ann Intern Med.
2008;148(2):147-59.
(20) Dy SM, Shugarman LR, Lorenz KA, Mularski RA, Lynn J. A systematic review of satisfaction
with care at the end of life. J Am Geriatr Soc. 2008;56(1):124-9.
(21) Frost DW, Cook DJ, Heyland DK, Fowler RA. Patient and healthcare professional factors
influencing end-of-life decision-making during critical illness: a systematic review. Crit Care
Med. 2011;39(5):1174-89.
(22) Bravo G, Dubois MF, Wagneur B. Assessing the effectiveness of interventions to promote
advance directives among older adults: a systematic review and multi-level analysis. Soc Sci Med
2008; 67(7):1122-1132.
(23) Kryworuchko J, Hill E, Murray MA, Stacey D, Fergusson DA. Interventions for Shared Decision-
Making About Life Support in the Intensive Care Unit: A Systematic Review. Worldviews Evid
Based Nurs 2013; 10(1):1-16.
(24) Tamayo-Velazquez MI, Simon-Lorda P, Villegas-Portero R, Higueras-Callejon C, Garcia-
Gutierrez JF, Martinez-Pecino F et al. Interventions to promote the use of advance directives: an
overview of systematic reviews. Patient Educ Couns 2010; 80(1):10-20.
(25) Lukas L, Foltz C, Paxton H. Hospital outcomes for a home-based palliative medicine consulting
service. J Palliat Med 2013; 16(2):179-184.
(26) Zaide GB, Pekmezaris R, Nouryan CN, Mir TP, Sison CP, Liberman T et al. Ethnicity, race, and
advance directives in an inpatient palliative care consultation service. Palliat Support Care 2012;
11(1):5-11.
(27) Quenot JP, Rigaud JP, Prin S, Barbar S, Pavon A, Hamet M et al. Impact of an intensive
communication strategy on end-of-life practices in the intensive care unit. Intensive Care Med
2012; 38(1):145-152.
(28) Pekmezaris R, Cooper L, Efferen L, Mastrangelo A, Silver A, Eichorn A et al. Transforming the
mortality review conference to assess palliative care in the acute care setting: a feasibility study.
Palliat Support Care 2010; 8(4):421-426.

Ontario Health Technology Assessment Series; Vol. 14: No. 19, pp. 1–72, December 2014 69
(29) Lopez-Acevedo M, Havrilesky LJ, Broadwater G, Kamal AH, Abernethy AP, Berchuck A et al.
Timing of end-of-life care discussion with performance on end-of-life quality indicators in
ovarian cancer. Gynecol Oncol 2013; 130(1):156-161.
(30) Doll KM, Stine JE, Van LL, Moore DT, Bae-Jump V, Brewster WR et al. Outpatient end of life
discussions shorten hospital admissions in gynecologic oncology patients. Gynecol Oncol 2013;
130(1):152-155.
(31) Lustbader D, Pekmezaris R, Frankenthaler M, Walia R, Smith F, Hussain E et al. Palliative
medicine consultation impacts DNR designation and length of stay for terminal medical MICU
patients. Palliat Support Care 2011; 9(4):401-406.
(32) Schellinger S, Sidebottom A, Briggs L. Disease specific advance care planning for heart failure
patients: Implementation in a large health system. J Palliat Med 2011; 14(11):1224-1230.
(33) Nelson C, Chand P, Sortais J, Oloimooja J, Rembert G. Inpatient palliative care consults and the
probability of hospital readmission. Perm J 2011; 15(2):48-51.
(34) Levy C, Morris M, Kramer A. Improving end-of-life outcomes in nursing homes by targeting
residents at high-risk of mortality for palliative care: Program description and evaluation. J Palliat
Med 2008; 11(2):217-225.
(35) Bischoff KE, Sudore R, Miao Y, Boscardin WJ, Smith AK. Advance care planning and the
quality of end-of-life care in older adults. J Am Geriatr Soc 2013; 61(2):209-214.
(36) Bell CL, Kuriya M, Fischberg D. Hospice referrals and code status: Outcomes of inpatient
palliative care consultations among Asian Americans and Pacific Islanders with cancer. J Pain
Symptom Manage 2011; 42(4):557-564.
(37) Sawicki GS, Dill EJ, Asher D, Sellers DE, Robinson WM. Advance care planning in adults with
cystic fibrosis. J Palliat Med 2008; 11(8):1135-1141.
(38) Spettell CM, Rawlins WS, Krakauer R, Fernandes J, Breton ME, Gowdy W et al. A
comprehensive case management program to improve palliative care. J Palliat Med 2009;
12(9):827-832.
(39) Detering KM, Hancock AD, Reade MC, Silvester W. The impact of advance care planning on
end of life care in elderly patients: Randomised controlled trial. BMJ (Online) 2010;
340(7751):847.
(40) Kirchhoff KT, Hammes BJ, Kehl KA, Briggs LA, Brown RL. Effect of a disease-specific
advance care planning intervention on end-of-life care. J Am Geriatr Soc 2012; 60(5):946-950.
(41) Kirchhoff KT, Hammes BJ, Kehl KA, Briggs LA, Brown RL. Effect of a disease-specific
planning intervention on surrogate understanding of patient goals for future medical treatment. J
Am Geriatr Soc 2010; 58(7):1233-1240.
(42) Au DH, Udris EM, Engelberg RA, Diehr PH, Bryson CL, Reinke LF et al. A randomized trial to
improve communication about end-of-life care among patients with COPD. Chest 2012;
141(3):726-735.
Ontario Health Technology Assessment Series; Vol. 14: No. 19, pp. 1–72, December 2014 70
(43) Gade G, Venohr I, Conner D, McGrady K, Beane J, Richardson RH et al. Impact of an inpatient
palliative care team: A randomized control trial. J Palliat Med 2008; 11(2):180-190.
(44) Clayton JM, Butow PN, Tattersall MH, Devine RJ, Simpson JM, Aggarwal G et al. Randomized
controlled trial of a prompt list to help advanced cancer patients and their caregivers to ask
questions about prognosis and end-of-life care. J Clin Oncol 2007; 25(6):715-723.
(45) Lautrette A, Darmon M, Megarbane B, Joly LM, Chevret S, Adrie C et al. A communication
strategy and brochure for relatives of patients dying in the ICU. N Engl J Med 2007; 356(5):469-
478.
(46) Gilmer T, Schneiderman LJ, Teetzel H, Blustein J, Briggs K, Cohn F et al. The costs of
nonbeneficial treatment in the intensive care setting: ethics consultations can help decide about
life-sustaining treatments, which are costly and provide little benefit to dying patients. Health Aff
2005; 24(4):961-971.
(47) Nicolasora N, Pannala R, Mountantonakis S, Shanmugam B, DeGirolamo A, Amoateng-
Adjepong Y et al. If asked, hospitalized patients will choose whether to receive life-sustaining
therapies. J Hosp Med 2006; 1(3):161-167.
(48) Casarett D, Karlawish J, Morales K, Crowley R, Mirsch T, Asch DA. Improving the use of
hospice services in nursing homes: a randomized controlled trial. JAMA 2005; 294(2):211-217.
(49) Song M-K, Kirchhoff KT, Douglas J, Ward S, Hammes B. A randomized, controlled trial to
improve advance care planning among patients undergoing cardiac surgery. Med Care 2005;
43(10):1049-1053.
(50) Dyar S, Lesperance M, Shannon R, Sloan J, Colon-Otero G. A Nurse Practitioner Directed
Intervention Improves the Quality of Life of Patients with Metastatic Cancer: Results of a
Randomized Pilot Study. J Palliat Med 2012; 15(8):890-895.
(51) Sampson EL, Jones L, Thune-Boyle IC, Kukkastenvehmas R, King M, Leurent B et al. Palliative
assessment and advance care planning in severe dementia: An exploratory randomized controlled
trial of a complex intervention. Palliat Med 2011; 25(3):197-209.
(52) Jones L, Harrington J, Barlow CA, Tookman A, Drake R, Barnes K et al. Advance care planning
in advanced cancer: can it be achieved? An exploratory randomized patient preference trial of a
care planning discussion. Palliat Support Care 2011; 9(1):3-13.
(53) Zhang B, Wright AA, Huskamp HA. Health care costs in the last week of life: Associations with
end-of-life conversations. Arch Intern Med 2009; 169(5):480-488.
(54) Evangelista LS, Lombardo D, Malik S, Ballard-Hernandez J, Motie M, Liao S. Examining the
effects of an outpatient palliative care consultation on symptom burden, depression, and quality
of life in patients with symptomatic heart failure. J Card Fail 2012; 18(12):894-899.
(55) Jacobsen J, Robinson E, Jackson VA, Meigs JB, Billings JA. Development of a cognitive model
for advance care planning discussions: Results from a quality improvement initiative. J Palliat
Med 2011; 14(3):331-336.

Ontario Health Technology Assessment Series; Vol. 14: No. 19, pp. 1–72, December 2014 71
(56) Engelhardt JB, Rizzo VM, Della Penna RD, Feigenbaum PA, Kirkland KA, Nicholson JS et al.
Effectiveness of care coordination and health counseling in advancing illness. Am J Manage Care
2009; 15(11):817-825.
(57) Rabow MW, Dibble SL, Pantilat SZ, McPhee SJ. The Comprehensive Care Team: A Controlled
Trial of Outpatient Palliative Medicine Consultation. Arch Intern Med 2004; 164(1):83-91.
(58) Mack JW, Cronin A, Keating NL, Taback N, Huskamp HA, Malin JL et al. Associations between
end-of-life discussion characteristics and care received near death: a prospective cohort study. J
Clin Oncol 2012; 30(35):4387-4395.
(59) Mack JW, Paulk ME, Viswanath K, Prigerson HG. Racial disparities in the outcomes of
communication on medical care received near death. Arch Intern Med 2010; 170(17):1533-1540.
(60) Wright AA, Zhang B, Ray A, Mack JW, Trice E, Balboni T et al. Associations between end-of-
life discussions, patient mental health, medical care near death, and caregiver bereavement
adjustment. JAMA 2008; 300(14):1665-1673.
(61) Casarett D, Pickard A, Bailey FA, Ritchie C, Furman C, Rosenfeld K et al. Do palliative
consultations improve patient outcomes? J Am Geriatr Soc 2008; 56(4):593-599.
(62) Morrison RS, Chichin E, Carter J, Burack O, Lantz M, Meier DE. The effect of a social work
intervention to enhance advance care planning documentation in the nursing home. J Am Geriatr
Soc 2005; 53(2):290-294.
(63) Briggs LA, Kirchhoff KT, Hammes BJ, Song MK, Colvin ER. Patient-centered advance care
planning in special patient populations: a pilot study. J Prof Nurs 2004; 20(1):47-58.
(64) Lamba S, Murphy P, McVicker S, Smith JH, Mosenthal AC. Changing end-of-life care practice
for liver transplant service patients: Structured palliative care intervention in the surgical
intensive care unit. J Pain Symptom Manage 2012; 44(4):508-519.
(65) Norton SA, Hogan LA, Holloway RG, Temkin-Greener H, Buckley MJ, Quill TE. Proactive
palliative care in the medical intensive care unit: Effects on length of stay for selected high-risk
patients. Crit Care Med 2007; 35(6):1530-1535.
(66) Lindner SA, Davoren JB, Vollmer A, Williams B, Landefeld CS. An electronic medical record
intervention increased nursing home advance directive orders and documentation. J Am Geriatr
Soc 2007; 55(7):1001-1006.
(67) Leung JM, Udris EM, Uman J, Au DH. The effect of end-of-life discussions on perceived quality
of care and health status among patients with COPD. Chest 2012; 142(1):128-133.
(68) Mori M, Ellison D, Ashikaga T, McVeigh U, Ramsay A, Ades S. In-advance end-of-life
discussions and the quality of inpatient end-of-life care: a pilot study in bereaved primary
caregivers of advanced cancer patients. Support Care Cancer 2013; 21(2):629-636.

Ontario Health Technology Assessment Series; Vol. 14: No. 19, pp. 1–72, December 2014 72
Health Quality Ontario
130 Bloor Street West, 10th Floor
Toronto, Ontario
M5S 1N5
Tel: 416-323-6868
Toll Free: 1-866-623-6868
Fax: 416-323-9261
Email: [email protected]
www.hqontario.ca
ISSN 1915-7398 (online)
ISBN 978-1-4606-4874-2 (PDF)
© Queen’s Printer for Ontario, 2014