pathways to assess changes in future intense rainfall and
TRANSCRIPT

Pathways to Assess
Future Intense Rainfall
and Flood Risk in
Yorkshire Using the
Latest UK Climate Change
Projections
CC Malcolm Campbell CC Ian Patterson

Author(s):
Ben Rabb, iCASP, University of Leeds
James Norman, iCASP, University of Leeds
Suraje Dessai, University of Leeds
Date of Issue:
01.03.18
Version:
1.0
Please cite this document as follows:
Rabb, B., Norman, J. and Dessai, S. (2018). Pathways to Assess Future
Intense Rainfall and Flood Risk in Yorkshire Using the Latest UK
Climate Change Projections. Yorkshire Integrated Catchment
Solutions Programme, iCASP report.
iCASP is funded under NERC Grant: NE/P011160/1
Partners:
3 | P a g e
Contents
1 Introduction .................................................................................................................... 4
1.1 JBA Consulting ....................................................................................................... 4
1.2 Yorkshire Wildlife Trust ........................................................................................... 6
1.3 Leeds City Council .................................................................................................. 6
2 Pathways for uptake of UKCP18 in Yorkshire ................................................................ 8
3 Detailed pathway: Surface water flooding in the UK & Yorkshire .................................. 10
3.1 Updating rainfall estimates for Surface Water Flood Risk Maps using UKCP18 .... 10
3.2 Sense checking UKCP18 output ........................................................................... 12
3.3 Benefits of using UKCP18 ..................................................................................... 13
4 Summary and conclusions ........................................................................................... 14
5 Acknowledgments ........................................................................................................ 15

4 | P a g e
1 Introduction
The UK Climate Projections 2018 – UKCP181 build upon the current set of projections
(UKCP09) to provide the most up-to date assessment of how the climate of the UK
may change over the 21st century. The aim of this short report is to explore how
UKCP18 can be used in Yorkshire to better plan for risks associated with extreme
rainfall in the region e.g. surface water flooding. This report briefly sketches out possible
pathways by which UKCP18 could be used by considering the contexts and needs of the
following three organisations, as case examples:
JBA Consulting which exemplifies a highly technical organisation making use of
weather data, climate projections and numerical modelling to provide assessments of
flood risk;
Leeds City Council which typifies an organisation that makes use of such
assessments in flood risk management and alleviation planning; and
The Yorkshire Wildlife Trust which provides an example of an organisation yet to
make specific use of climate change projections within its conservation and
restoration activities.
Example pathways have been suggested (see Table 2) to show how users will be able to
interact with the forthcoming UKCP18 data products to access and create salient information
relevant to their decision-making context and levels of expertise. One example pathway has
been further developed into a practical ‘step by step’ guide to illustrate how UKCP18 can be
used for updating rainfall information for surface water flood risk planning (see Section 3).
1.1 JBA Consulting
JBA provides professional advisory services on surface water flood risk in the UK. For
example, the UK Environment Agency (EA) commissioned the company to produce national
Flood Maps for Surface Water (FMfSW) based on their JFlow hydrological modelling tool
(see Box 1 for more details).2 JBA also provide advice to clients on climate change risk
management across a range of sectors, for example, in the context of infrastructure
investment planning, water resource management and environmental impact assessment.
Government policy and regulatory frameworks set the context within which many of JBA’s
clients operate, and influence the scope and requirements of their climate change risk
management advisory services. For example, the water industry has clear assessment and
reporting guidelines and procedures to manage climate change risks which JBA utilise. For
now, there is no systematic framework for combining climate change and surface water flood
risk assessment in the UK – perhaps because it is still regarded as a ‘cutting edge’ science
and not yet ‘deployable’. There is more specific national guidance on climate change and
flooding from other sources.3
Climate change risk management involves JBA using a range of information and data
sources as well as tools – often depending on the needs of the client and availability of
1 UK Met Office, Defra, BEIS, EA (2017). UK Climate Projections: A Project Overview: https://www.metoffice.gov.uk/binaries/content/assets/mohippo/pdf/uk-climate/uk-cp/ukcp18-project-overview-final.pdf [Accessed 20.12.17] 2 EA (2013). What is the Updated Flood Map for Surface Water? https://www.gov.uk/government/uploads/system/uploads/attachment_data/file/297432/LIT_8988_0bf634.pdf [Accessed 20.12.17] 3 EA (2017). Flood risk assessments: climate change allowances. https://www.gov.uk/guidance/flood-risk-assessments-climate-change-allowances [Accessed 20.12.17]
5 | P a g e
information. For example, there is a well-established resource of hydrological impact data
from the ‘UK Future Flows’ project4. Here, the UK Centre for Hydrology (CEH) and others
have used UKCP09 climate projections to assess possible impacts on stream flow, river and
groundwater levels. JBA is less likely to use the raw output of UKCP09 climate models to
conduct bespoke impact and risk studies (although the expertise is there if needed).
Looking ahead to the release of UKCP18, a key question for an organisation such as JBA is
how new climate projections can be used in consultancy projects, either through application-
specific products developed by joined-up, industry-wide projects (such as UK Future Flows
v2.0), or through independent JBA research and development. A related consideration
concerns the communication of uncertainty associated with each of the new UKCP18
products (i.e. the global, regional and probabilistic projections). Past work involving the
UKCP09 projections has highlighted the subtleties involved in effectively conveying the
significance of multiple scenarios and parameter uncertainty in different contexts.
Understanding the form and possible uses of forthcoming UKCP18 projections will help
define the level of work required to support effective communication of uncertainty.
Box 1: Development of the Flood Maps for Surface Water (FMfSW) for England
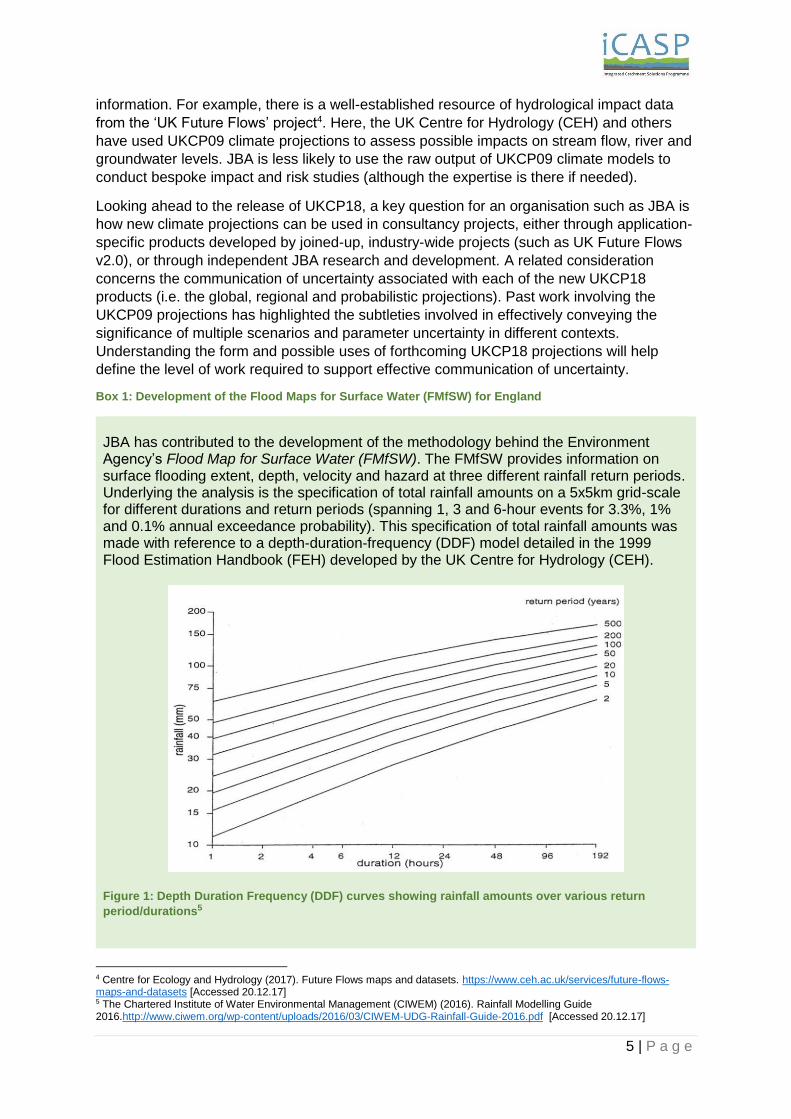
JBA has contributed to the development of the methodology behind the Environment Agency’s Flood Map for Surface Water (FMfSW). The FMfSW provides information on surface flooding extent, depth, velocity and hazard at three different rainfall return periods. Underlying the analysis is the specification of total rainfall amounts on a 5x5km grid-scale for different durations and return periods (spanning 1, 3 and 6-hour events for 3.3%, 1% and 0.1% annual exceedance probability). This specification of total rainfall amounts was made with reference to a depth-duration-frequency (DDF) model detailed in the 1999 Flood Estimation Handbook (FEH) developed by the UK Centre for Hydrology (CEH).
Figure 1: Depth Duration Frequency (DDF) curves showing rainfall amounts over various return
period/durations5
4 Centre for Ecology and Hydrology (2017). Future Flows maps and datasets. https://www.ceh.ac.uk/services/future-flows-maps-and-datasets [Accessed 20.12.17] 5 The Chartered Institute of Water Environmental Management (CIWEM) (2016). Rainfall Modelling Guide 2016.http://www.ciwem.org/wp-content/uploads/2016/03/CIWEM-UDG-Rainfall-Guide-2016.pdf [Accessed 20.12.17]

6 | P a g e
Figure 1 depicts DDF curves for a typical location as described by the FEH model. The FEH analysis incorporates extensive rain gauge data and has been widely used to generate design storms for single locations and river catchments in the UK. The specified total rainfall amounts were then adjusted to factor in the effect of the land surface, and scaled across an archetypal storm profile, giving storm intensity as a function of storm duration. The JFlow® hydraulic model was then used to simulate how this adjusted rainfall would flow as surface runoff when applied over a digital terrain model to identify regions of surface water accumulation. However, the maps do not provide an assessment of the likely impact of climate change on the various flood metrics.
1.2 Yorkshire Wildlife Trust
The Yorkshire Wildlife Trust (YWT) is one of several dozen regional trusts in the UK and is
concerned with the management of conservation areas across the region. The YWT also
coordinates the Yorkshire Peat Partnership (YPP); a large five-year, multi-donor project
aimed at restoring large areas of peatland in the Yorkshire uplands through activities such as
drain blocking and revegetation. Amongst other ‘ecosystem services’, peatland restoration
aims to reduce flood risk downstream. Indeed, YWT also carries out several natural flood
management (NFM) projects beyond peatland restoration. Whilst not directly involved in
surface water flood risk management, the same climate change information will also likely be
relevant for peatland restoration and NFM projects.
Climate change will in-part determine the success or otherwise of peatland restoration and
NFM projects as well as potentially being a driver for investing further in such projects. For
example, the business case for a project capable of alleviating the impacts of more extreme
rainfall or increases in peak flow may be strengthened. On the other hand, the future efficacy
of such projects may be at risk from gradual changes in the bioclimatic envelope as well as
changes in the exposure to climate extremes that drive storms, landslip or bog burst.
Ultimately, climate change assessments may provide evidence to inform decisions about the
most cost-effective habitat restoration efforts.
YPP is interested in learning whether the high-resolution climate projections of UKCP18 offer
useful insights into potential future climate-related impacts on upland peatlands and other
NFM projects. For example, could output from UKCP18 be used in formal decision-making
modelling tools such as DigiBog.6 ? Until now, the outputs of available climate information
(including the spatial scale and available climate variables) have not been considered
relevant or accessible to most conservation projects.
1.3 Leeds City Council
Under the Water Act 2010, a Lead Local Flood Authority (LLFA) is responsible for managing
‘local flood risk’, which covers surface water flooding. As LLFA for the Leeds Metropolitan
District, Leeds City Council has used the EA’s Flood Map for Surface Water (FMfSW) to
produce the 2011 Preliminary Flood Risk Assessment (PFRA) for Leeds. This map was
updated in 2013 and provides four levels of flood risk for different rainfall return periods, but
does not specifically identify how the risk of surface flooding may vary due to climate change
6 Baird, A., Morris, P.J. and Belyea, L. (2011). The DigiBog peatland development model 1: rationale, conceptual model, and hydrological basis. http://onlinelibrary.wiley.com/doi/10.1002/eco.230/abstract [Accessed 20.12.17]

7 | P a g e
impacts (see Box 1 for more details).7 The PRRA also includes a summary of historic flood
incidents, areas of local (including surface) flood risk and immediate measures for reducing
these risks.
The PFRA has fed into the Local Flood Risk Management Strategy (LFRMS). In the
production of the LFRMS, the Leeds City Council flooding team referred to the EA’s
guidance to flood risk management authorities on adapting to climate change (Adapting to
Climate Change: Advice for Flood and Coastal Erosion Risk Management Authorities), which
provides basin-level uplift factors for peak flow and extreme rainfall intensity as ranges for
three future time horizons.8 The Leeds City Council flooding team also consulted the
UKCP09 information upon which the EA guidance was based. They looked specifically at
projections of precipitation changes for the 25km grid square centred over Leeds. Table 1
below details this national change factor (for England) recommended for use within EA
guidance, and shows the values for a single location which the Leeds City Council flooding
team derived independently. A change factor is a term used to describe the difference in
average precipitation conditions between current and future time periods. There is
considerable difference between the two sources of information.
Table 1: Change in wettest day of summer season (taken as 99th percentile of daily precipitation rate) compared to a 1961-90 baseline. An upper estimate (90th percentile) and central estimate (50th percentile) of modelled changes are shown for the 2020s, 2050s and 2080s across England and locally over Leeds from UKCP09.
Change in wettest summer day (from 1961-1990)
location Percentile of modelled output
‘2020s’ (2015- 39)
‘2050s’ (2040- 2069)
‘2080s’ (2070-2115)
England Upper estimate (90th %’ile) 10% 20% 40%
Central estimate (50th %’ile) 5% 10% 20%
UKCP09 grid cell over Leeds
(50km resolution)
Upper estimate (90th %’ile) 6.4% 2.9% 16.0%
Central estimate (50th %’ile) -0.3% -4.0% -5.1%
Anticipating the release of UKCP18, two questions arise for the Leeds City Council flooding
team. The first concerns the level of work involved in making use of new national climate
projections – i.e. would it require processing large amounts of data in an independent
analysis, or just a review of new guidance such as an updated surface water flood risk map
based on UKCP18? The second is whether UKCP18-derived information would provide
sufficient extra detail over past assessments, based on UKCP09, to justify the resources
required to implement changes to existing flood risk assessments. These two considerations
are particularly relevant when new climate change information becomes available between
scheduled review cycles, as will be the case for the PRFA and LFRMS which are both due
for review and republishing in 2018.
7 EA (2013). What is the Updated Flood Map for Surface Water? https://www.gov.uk/government/uploads/system/uploads/attachment_data/file/297432/LIT_8988_0bf634.pdf [Accessed 20.12.17] 8EA (2016). Adapting to climate change: Advice for Flood and Coastal Erosion Risk Management Authorities https://www.gov.uk/government/uploads/system/uploads/attachment_data/file/571572/LIT_5707.pdf [Accessed 20.12.17]
8 | P a g e
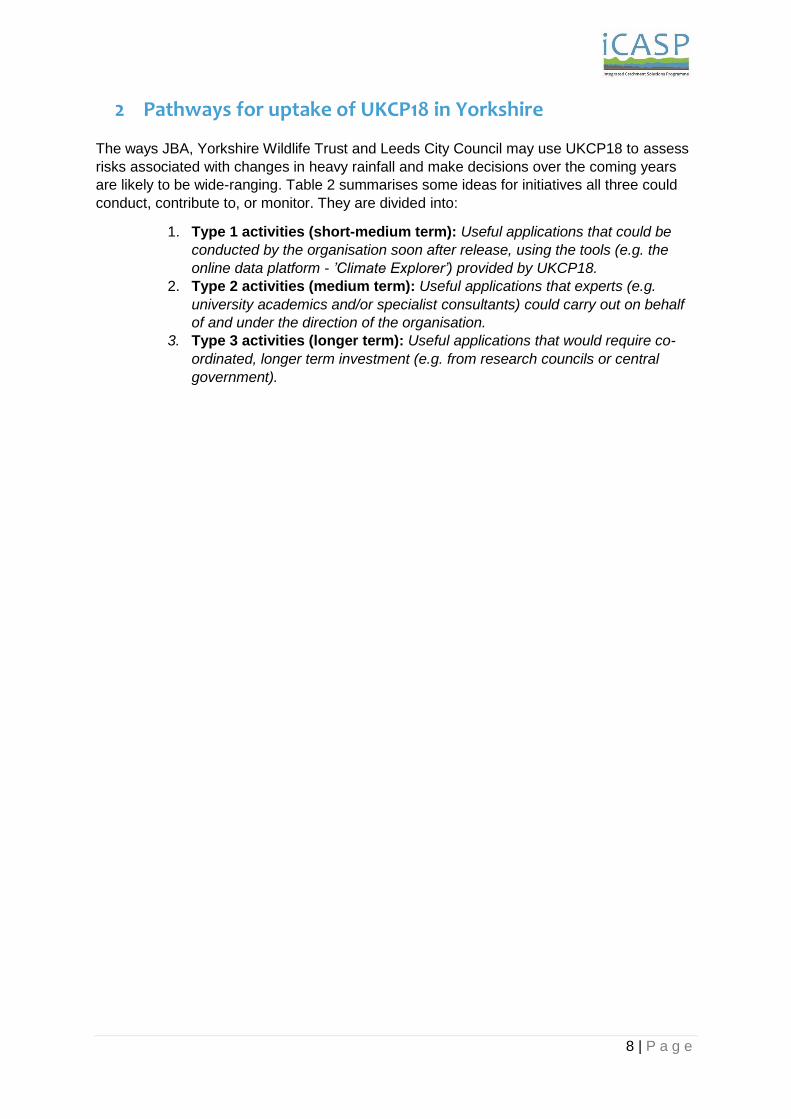
2 Pathways for uptake of UKCP18 in Yorkshire
The ways JBA, Yorkshire Wildlife Trust and Leeds City Council may use UKCP18 to assess
risks associated with changes in heavy rainfall and make decisions over the coming years
are likely to be wide-ranging. Table 2 summarises some ideas for initiatives all three could
conduct, contribute to, or monitor. They are divided into:
1. Type 1 activities (short-medium term): Useful applications that could be
conducted by the organisation soon after release, using the tools (e.g. the
online data platform - ’Climate Explorer’) provided by UKCP18.
2. Type 2 activities (medium term): Useful applications that experts (e.g.
university academics and/or specialist consultants) could carry out on behalf
of and under the direction of the organisation.
3. Type 3 activities (longer term): Useful applications that would require co-
ordinated, longer term investment (e.g. from research councils or central
government).
9 | P a g e
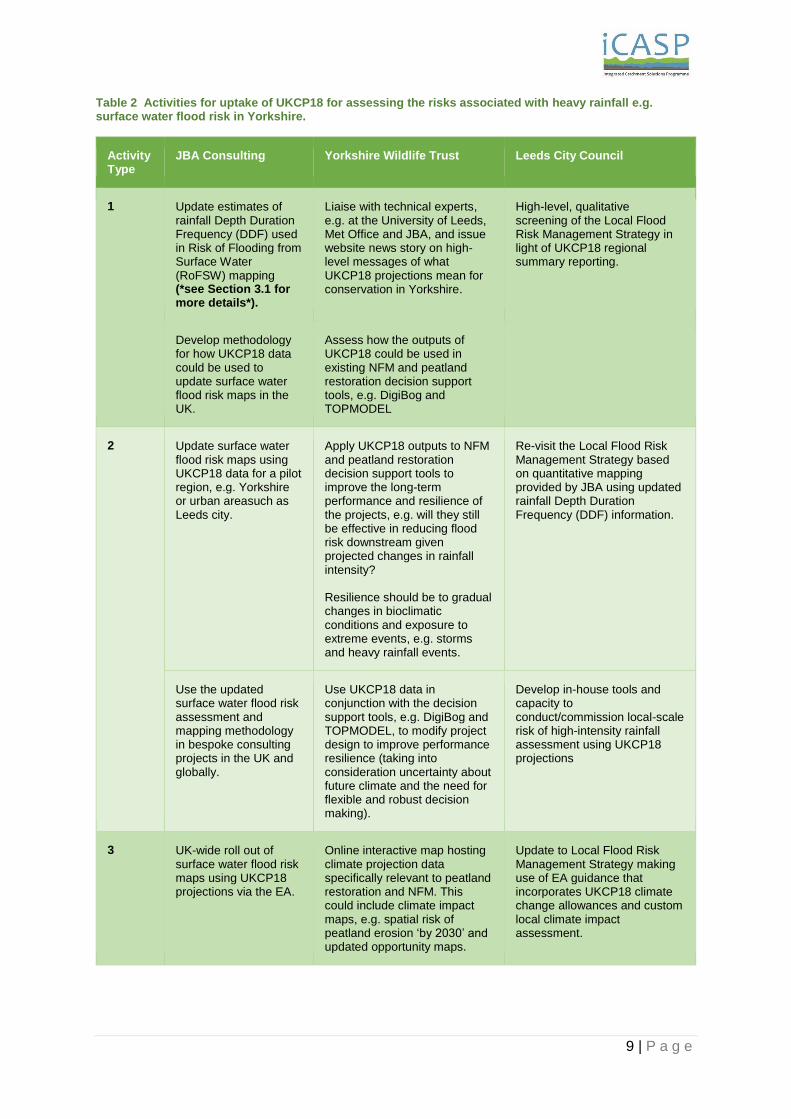
Table 2 Activities for uptake of UKCP18 for assessing the risks associated with heavy rainfall e.g. surface water flood risk in Yorkshire.
Activity Type
JBA Consulting Yorkshire Wildlife Trust Leeds City Council
1
Update estimates of rainfall Depth Duration Frequency (DDF) used in Risk of Flooding from Surface Water (RoFSW) mapping (*see Section 3.1 for more details*).
Liaise with technical experts, e.g. at the University of Leeds, Met Office and JBA, and issue website news story on high-level messages of what UKCP18 projections mean for conservation in Yorkshire.
High-level, qualitative screening of the Local Flood Risk Management Strategy in light of UKCP18 regional summary reporting.
Develop methodology for how UKCP18 data could be used to update surface water flood risk maps in the UK.
Assess how the outputs of UKCP18 could be used in existing NFM and peatland restoration decision support tools, e.g. DigiBog and TOPMODEL
2
Update surface water flood risk maps using UKCP18 data for a pilot region, e.g. Yorkshire or urban areasuch as Leeds city.
Apply UKCP18 outputs to NFM and peatland restoration decision support tools to improve the long-term performance and resilience of the projects, e.g. will they still be effective in reducing flood risk downstream given projected changes in rainfall intensity? Resilience should be to gradual changes in bioclimatic conditions and exposure to extreme events, e.g. storms and heavy rainfall events.
Re-visit the Local Flood Risk Management Strategy based on quantitative mapping provided by JBA using updated rainfall Depth Duration Frequency (DDF) information.
Use the updated surface water flood risk assessment and mapping methodology in bespoke consulting projects in the UK and globally.
Use UKCP18 data in conjunction with the decision support tools, e.g. DigiBog and TOPMODEL, to modify project design to improve performance resilience (taking into consideration uncertainty about future climate and the need for flexible and robust decision making).
Develop in-house tools and capacity to conduct/commission local-scale risk of high-intensity rainfall assessment using UKCP18 projections
3 UK-wide roll out of surface water flood risk maps using UKCP18 projections via the EA.
Online interactive map hosting climate projection data specifically relevant to peatland restoration and NFM. This could include climate impact maps, e.g. spatial risk of peatland erosion ‘by 2030’ and updated opportunity maps.
Update to Local Flood Risk Management Strategy making use of EA guidance that incorporates UKCP18 climate change allowances and custom local climate impact assessment.

10 | P a g e
3 Detailed pathway: Surface water flooding in the UK &
Yorkshire
Surface water flooding resulting from heavy downpours is a significant source of flood risk in
the UK. The summer storms of 2007 resulted in unparalleled levels of destruction,
overwhelming 7300 businesses and 48,000 homes across the country, causing 13
casualties and an estimated £3.2 billion in damage9. The independent Pitt Review of that
summer’s events found that two-thirds of the damage in urban areas was caused by surface
water flooding.
The Yorkshire region is particularly at risk because of a combination of urban centres and
steep-sided, hydrologically responsive river catchments, both of which are sensitive to
intense, short duration rainfall. The past decade has seen a series of high impact surface
flooding events caused by intense, sometimes unprecedented, levels of rainfall. For
example, in 2012 the wettest April to June period on record led to significant flood damage in
the region. In particular, when large thunderstorms hit towards the end of June, parts of the
Calder Valley in West Yorkshire experienced a typical month’s rainfall in less than 24 hours.
More than 500 businesses and homes were flooded in the valley. During this period some
4500 homes were affected across the UK, with an estimated £500 million in total damage
costs.
Successive UK Climate Change Risk Assessments (CCRAs) have shown that flooding is
one of the most significant climate-related risks facing the nation.10 Recent studies have
highlighted a possible intensification of summer-time convective storms suggesting that
climate change must be a key consideration for surface water flooding assessments.
However, the climate models used in past assessments (i.e. those associated with UKCP09)
could only approximate the key physical processes within these summer-time storms and
were therefore unable to provide robust estimates of changes in short-duration rainfall
amounts. The forthcoming UK Climate Projections (UKCP18) are expected to fill this
knowledge gap by providing projections from a high-resolution regional model with an
improved representation of convective storms.
3.1 Updating rainfall estimates for Surface Water Flood Risk Maps using
UKCP18
Box 2 outlines the steps that would be needed to update the assessment briefly described in
Box 1, with output from UKCP18. The following procedure could be used to estimate future
changes in rainfall Depth Duration Frequency (DDF) information for use within surface water
flood risk assessments in Yorkshire.
9 UK Parliament (2010). Reducing flood risk: key issues for the 2010 Parliament http://www.parliament.uk/business/publications/research/key-issues-for-the-new-parliament/green-growth/reducing-flood-risk/ [Accessed 20.12.17] 10 UK Committee on Climate Change (2017). UK Climate Change Risk Assessment 2017 Evidence Report. https://www.theccc.org.uk/tackling-climate-change/preparing-for-climate-change/uk-climate-change-risk-assessment-2017/ [Accessed 20.12.17]
11 | P a g e
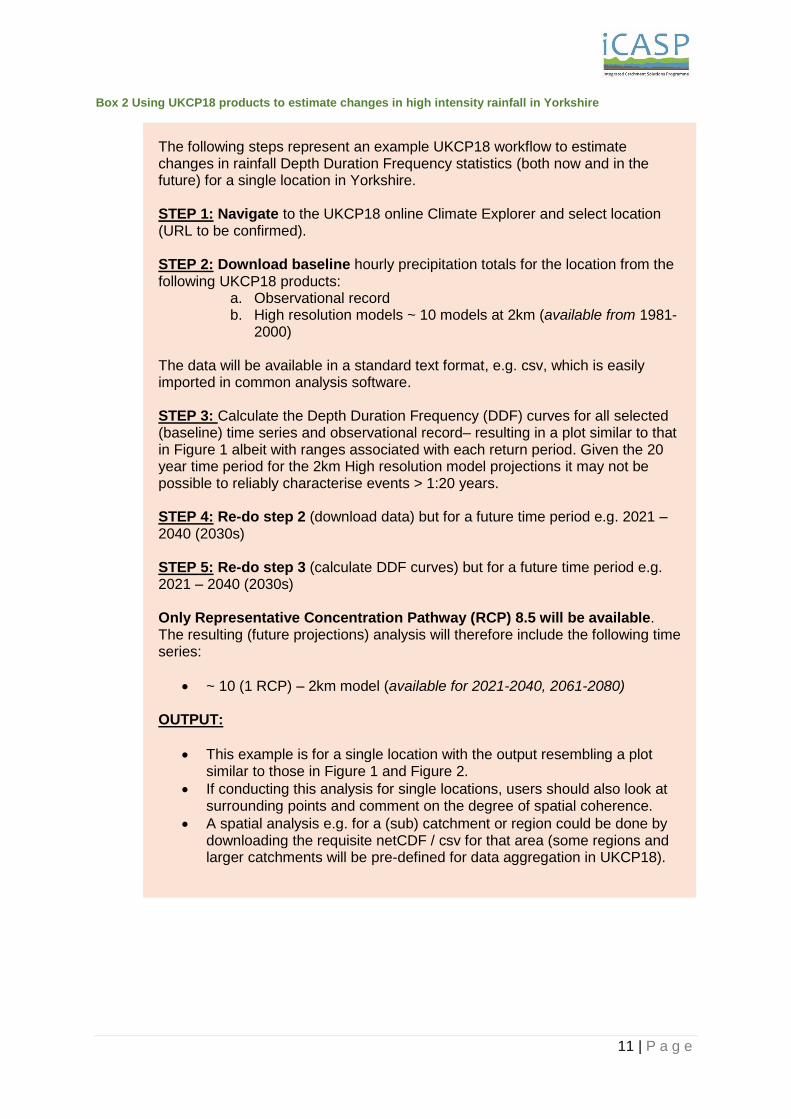
Box 2 Using UKCP18 products to estimate changes in high intensity rainfall in Yorkshire
The following steps represent an example UKCP18 workflow to estimate changes in rainfall Depth Duration Frequency statistics (both now and in the future) for a single location in Yorkshire. STEP 1: Navigate to the UKCP18 online Climate Explorer and select location (URL to be confirmed). STEP 2: Download baseline hourly precipitation totals for the location from the following UKCP18 products:
a. Observational record b. High resolution models ~ 10 models at 2km (available from 1981-
2000) The data will be available in a standard text format, e.g. csv, which is easily imported in common analysis software. STEP 3: Calculate the Depth Duration Frequency (DDF) curves for all selected (baseline) time series and observational record– resulting in a plot similar to that in Figure 1 albeit with ranges associated with each return period. Given the 20 year time period for the 2km High resolution model projections it may not be possible to reliably characterise events > 1:20 years. STEP 4: Re-do step 2 (download data) but for a future time period e.g. 2021 – 2040 (2030s) STEP 5: Re-do step 3 (calculate DDF curves) but for a future time period e.g. 2021 – 2040 (2030s) Only Representative Concentration Pathway (RCP) 8.5 will be available. The resulting (future projections) analysis will therefore include the following time series:
~ 10 (1 RCP) – 2km model (available for 2021-2040, 2061-2080) OUTPUT:
This example is for a single location with the output resembling a plot similar to those in Figure 1 and Figure 2.
If conducting this analysis for single locations, users should also look at surrounding points and comment on the degree of spatial coherence.
A spatial analysis e.g. for a (sub) catchment or region could be done by downloading the requisite netCDF / csv for that area (some regions and larger catchments will be pre-defined for data aggregation in UKCP18).

12 | P a g e
Figure 2: Rainfall Depth Duration curves (for a 1 in 30 year frequency event) for a modelled baseline and future (2100) period from a previous study using a high resolution Regional Climate Model (RCM) Convex. Rainfall depth estimated for the baseline period are represented by the solid black line and light grey band and the future period (2100) is shown by the dashed line and dark grey band. 11
3.2 Sense checking UKCP18 output
The Met Office are undertaking a rigorous process of model development, selection and
testing. Prudent users should also undertake their own Quality Assurance relevant to their
particular context and use case. It remains unclear how much the Met Office/ Defra will
provide resources to support these ‘sense checking’ procedures. It is likely that the
onus will fall on the user community. This means the procedures described below could be
the focus of Type 2 and Type 3 projects (See Table 2).
Sense-checking UKCP18 outputs will involve (at least) three steps:
1. Evaluate projections against observations – how well do the models recreate the
observed climate?
No example maps, figures or charts demonstrating model performance currently exist, but
these will likely form part of UKCP18 documentation. However, it is not clear at exactly what
scale model evaluation will be carried out (possibly model grid-scale). Users could also
conduct this exercise independently at Step 3 (see above) by comparing DDF curves from
the observational record with modelled baseline output.
2. Bias correction – models may do an appropriate job of representing weather
patterns and changes over time but ‘absolute’ levels of various parameters may be
11 Dale, M. et al. (2015). New climate change rainfall estimates for sustainable drainage. In Proceedings of the Institution of Civil Engineers-Engineering Sustainability. Thomas Telford Ltd. http://www.icevirtuallibrary.com/doi/abs/10.1680/jensu.15.00030 [Accessed 20.12.17]
13 | P a g e
inaccurate. It is common for statistical ‘corrections’ to be applied to ‘fix’ these
systematic biases.
Bias correction should be performed before post processing and derivation of other metrics –
i.e. before calculating DDF curves as detailed in Box 2. The most appropriate bias correction
methodology is context specific and the impact of using various methods on the end results
should be assessed. If there is only interest in the change between DDF curves, bias
correction is less important.
3. Check model projections represent the “full range of future climate
uncertainty” as sampled by PDFs - UKCP18 provides Probability Density
Functions (PDFs) for 25 km grid cells across the UK and selected river basins. These
show a ‘range of known uncertainty’ from models and Representative Concentration
Pathway (RCP) scenarios at each location.
PDFs are based on an up-to-date collection of Met Office climate simulations and the latest
IPCC-assessed simulations to account for model uncertainties. They also incorporate the
latest observations and estimates of carbon cycle feedbacks.
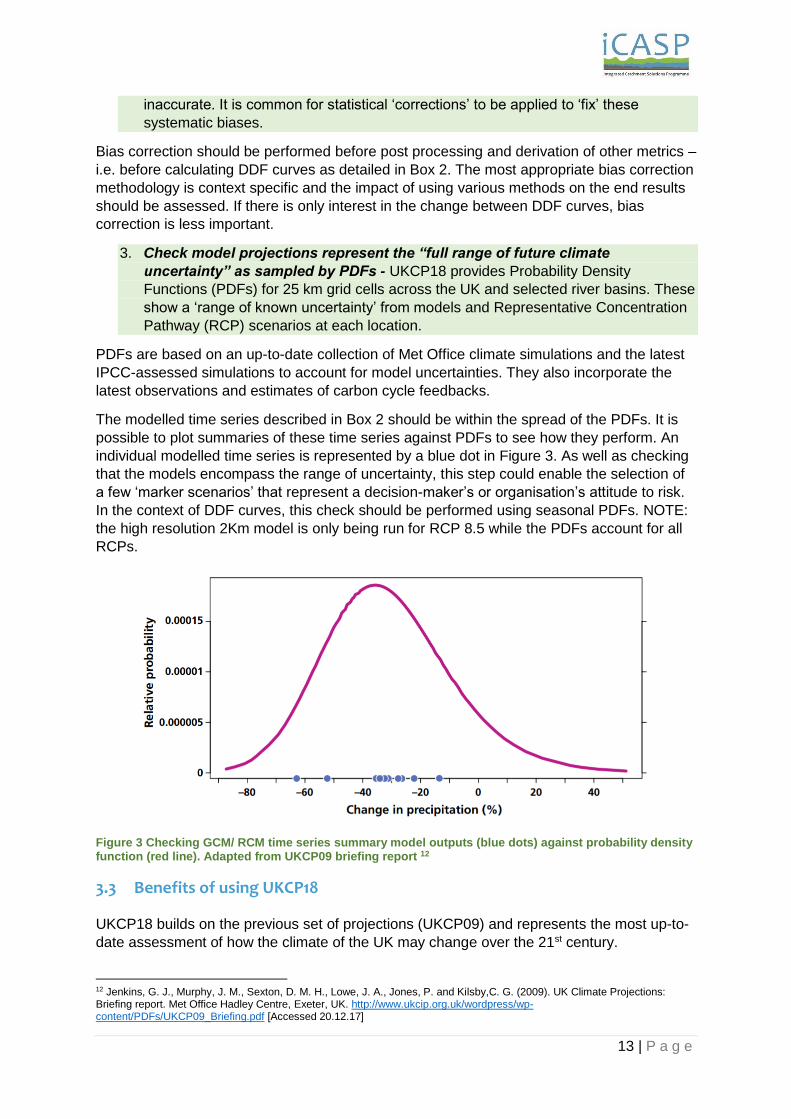
The modelled time series described in Box 2 should be within the spread of the PDFs. It is
possible to plot summaries of these time series against PDFs to see how they perform. An
individual modelled time series is represented by a blue dot in Figure 3. As well as checking
that the models encompass the range of uncertainty, this step could enable the selection of
a few ‘marker scenarios’ that represent a decision-maker’s or organisation’s attitude to risk.
In the context of DDF curves, this check should be performed using seasonal PDFs. NOTE:
the high resolution 2Km model is only being run for RCP 8.5 while the PDFs account for all
RCPs.
Figure 3 Checking GCM/ RCM time series summary model outputs (blue dots) against probability density function (red line). Adapted from UKCP09 briefing report 12
3.3 Benefits of using UKCP18
UKCP18 builds on the previous set of projections (UKCP09) and represents the most up-to-
date assessment of how the climate of the UK may change over the 21st century.
12 Jenkins, G. J., Murphy, J. M., Sexton, D. M. H., Lowe, J. A., Jones, P. and Kilsby,C. G. (2009). UK Climate Projections: Briefing report. Met Office Hadley Centre, Exeter, UK. http://www.ukcip.org.uk/wordpress/wp-content/PDFs/UKCP09_Briefing.pdf [Accessed 20.12.17]

14 | P a g e
Importantly, the products provide spatially (and temporally) coherent time series at a fine
scale.
In the past, simplified change factors have been applied to observed rainfall time series and
‘design events’ to assess the impact of climate change on surface water flooding (see Table
1). A change factor is a term used to describe the difference in average precipitation
conditions between current and future time periods. These are usually based on expert
interpretation of relatively coarse scale climate models which don’t account well for
convective rainfall. UKCP18 will allow the user to directly access fine-scale regional climate
models which represent the physical processes of convective rainfall - often driving the most
intense events. In doing so, the method will avoid some of the limitations associated with
statistical downscaling (e.g. the use of weather generators), such as the extrapolation of
hourly values from daily model output and the empirically defined relationships that constrain
how the weather generator responds to a climate change signal.
Novel probabilistic projections will indicate the range of uncertainty in our knowledge of the
climate system and natural variability through the 21st century by using PDFs to provide
information on how climate varies from month to month. These PDFs provide an important
context in which to assess the other UCKP18 products. The 10 model realisations used in
this modelling set-up will also provide an improved characterisation of uncertainty (albeit only
for 1 RCP).
4 Summary and conclusions
Climate change projections based on atmospheric models continue to inform risk and
opportunity assessments in Yorkshire and the UK. Advances in climate science have
motivated the development of a new set of national climate projections due for public release
in 2018. The projections, referred to as UKCP18, will update the UKCP09 projections over
UK land areas, giving greater regional detail and providing more information on potential
climate extremes. Importantly, several novel features of UKCP18 could provide insights on
certain aspects of climate risk which were unfeasible with UKCP09 projections.
This brief has outlined how the forthcoming UKCP18 high resolution regional climate
projections are anticipated to fill a key information gap found in previous national climate
projections, namely changes in the frequency and intensity of short-duration rainfall events.
Information on these events has been highlighted as a particular interest of several
organisation within Yorkshire, especially given past experience with high-intensity rainfall
and associated surface flooding. A draft methodology was constructed around one of the
identified uses of UKCP18 regional climate model projections and involved the development
of a series of depth-duration-frequency curves for present-day and future periods.
Although climate models are constantly being improved, they are not designed to predict
future climate conditions with a degree of confidence allowing precise adaptation decisions
to be made. Outputs from climate models often differ (as shown by the UKCP18 PDFs in
Figure 3), presenting users with a range of possible climate futures to consider. Given these
uncertainties, the focus should often be on identifying and implementing adaptation actions
which perform well both under current and over a range of possible future climatic
conditions. 13 Climate information like UKCP18 can be used to establish upper and lower
bounds for testing the effectiveness of adaptation options under an uncertain future climate.
13 Wilby, R. L. and Dessai, S. (2010). Robust adaptation to climate change. Weather, 65(7), pp. 180-185. http://onlinelibrary.wiley.com/doi/10.1002/wea.543/full [Accessed 20.12.17]
15 | P a g e
5 Acknowledgments
This brief report is part of a project funded under the Yorkshire Integrated Catchment
Solutions Programme (iCASP). The project involved a group of six iCASP stakeholders,
representing local government, major infrastructure owners and technical specialists. With
thanks to:
Amanda Crossfield, Lead Advisor for Climate Change Adaptation, Yorkshire Water.
Gail Hammond, Project Manager, Environment Programme, Environment Agency.
Robert Curtis, Sustainable Energy & Climate Change Team, Leeds City Council.
Dr Robert Lamb, Chief Scientist at JBA Group and Director of the JBA Trust.
Dr Tim Thom, Northern Regional Manager, Yorkshire Wildlife Trust.
James Copeland, Land Use Adviser, National Farmers’ Union.
The project also benefitted from the expertise offered by the following colleagues at the UK
Met Office and University of Leeds:
Jason Lowe, Chair of the Priestly International Centre for Climate, & Met Office.
Piers Forster, Professor of Physical Climate Change and Director of the Priestley
International Centre for Climate, School of Earth and Environment, University of
Leeds.
Amanda Maycock, NERC Independent Research Fellow and Associate Professor in
Climate Dynamics, Institute for Climate and Atmospheric Science (ICAS), University
of Leeds.
Mark Trigg, Academic Fellow, Department of Civil Engineering, University of Leeds.