pasta in europe: opportunities and … board 2014/pasta in europ… · pasta in europe:...
TRANSCRIPT

PASTA IN EUROPE: OPPORTUNITIES AND CHALLENGES FOR MANUFACTURERS
UNAFPA/SEMOULIERS AND IPO BOARD MEETING 23 MAY 2014 - LYON
ILDIKO SZALAI SENIOR ANALYST

© Euromonitor International
2
• Global provider of Strategic Market Intelligence
• 12 Regional offices - 800+ analysts in 80 countries
• Cross-country comparable data and analysis
• Consumer focused industries, countries and
consumers
• 5 - 10 year forecasts with matching trend analysis
• All retail channels covered
• Subscription services, reports and consulting
About Euromonitor International EUROMONITOR INTERNATIONAL London
Singapore
Shanghai
Dubai
Vilnius
Cape Town
San7ago
Tokyo
Sydney
Chicago
Bangalore
Sao Paulo

MARKET ENVIRONMENT
ADDING VALUE TO PASTA
LESSONS FROM BEYOND EUROPE
KEY TAKEAWAYS

© Euromonitor International
4
4.0%
2011
3.2%
2012
3.0%
2013
3.6%
2014
2014 Expected to Be Turning Point in Real GDP Growth Globally MARKET ENVIRONMENT
World: % Real GDP Growth

© Euromonitor International
5
Modest Recovery Expected in GDP Growth in Europe by 2019 MARKET ENVIRONMENT
5.4
2.9 3.3 3.7 4.6
2.4 2.0
-8
-6
-4
-2
0
2
4
6
8
Asia Pacific Australasia Eastern Europe
Latin America
Middle East and Africa
North America
Western Europe
% y
-o-y
gro
wth
% Year on Year Real GDP Growth by Region – 2009-2019
2009 2014 2019

© Euromonitor International
6
0.0
0.5
1.0
1.5
2.0
2.5
3.0
2011-12 2012-13 2013-14
% y
-o-y
gro
wth
World: Retail Volume Sales of Packaged Food Versus Pasta 2012-2014
Packaged Food Pasta
Pasta Volume Growth Remain Slower & Lower than Overall Food MARKET ENVIRONMENT
© Euromonitor International
7
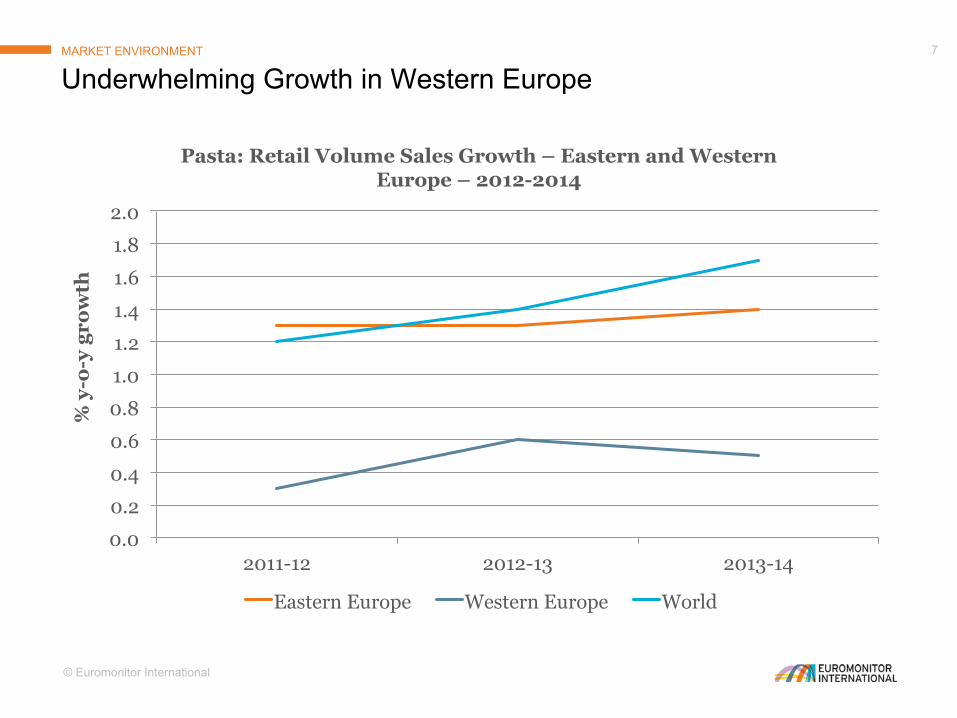
0.0
0.2
0.4
0.6
0.8
1.0
1.2
1.4
1.6
1.8
2.0
2011-12 2012-13 2013-14
% y
-o-y
gro
wth
Pasta: Retail Volume Sales Growth – Eastern and Western Europe – 2012-2014
Eastern Europe Western Europe World
Underwhelming Growth in Western Europe MARKET ENVIRONMENT

© Euromonitor International
8
0
20
40
2010 2011 2012 2013 2014
US
$ bn
rsp
Global Pasta Market Size by Category – Value 2010-2014
Dried Pasta Chilled/Fresh Pasta Canned/Preserved Pasta
0
10,000
20,000
2010 2011 2012 2013 2014
'00
0 t
onn
es
Global Pasta Market Size by Category – Volume 2010-2014
Dried Pasta Chilled/Fresh Pasta Canned/Preserved Pasta
Value Growth Outpace Volume in Global Pasta MARKET ENVIRONMENT
1.4% CAGR
5.8% CAGR

© Euromonitor International
9
2013 Global Pasta Retail
Value: US$27.9 billion
2018 Global Pasta Retail
Value: US$31.3 billion
-500 0 500 1,000 1,500 2,000 2,500 3,000 3,500 4,000
Absolute Market Value Growth by Region – 2013-2018
Middle East and Africa Latin America Eastern Europe Asia Pacific North America Australasia Western Europe
Europe Contributes Little to Global Pasta Value Growth up to 2018 MARKET ENVIRONMENT
© Euromonitor International
10
0
1
2
3
4
5
6
0
50
100
150
200
250
300
350
400
% C
AG
R 2
013
-20
18
US
$ m
n r
sp
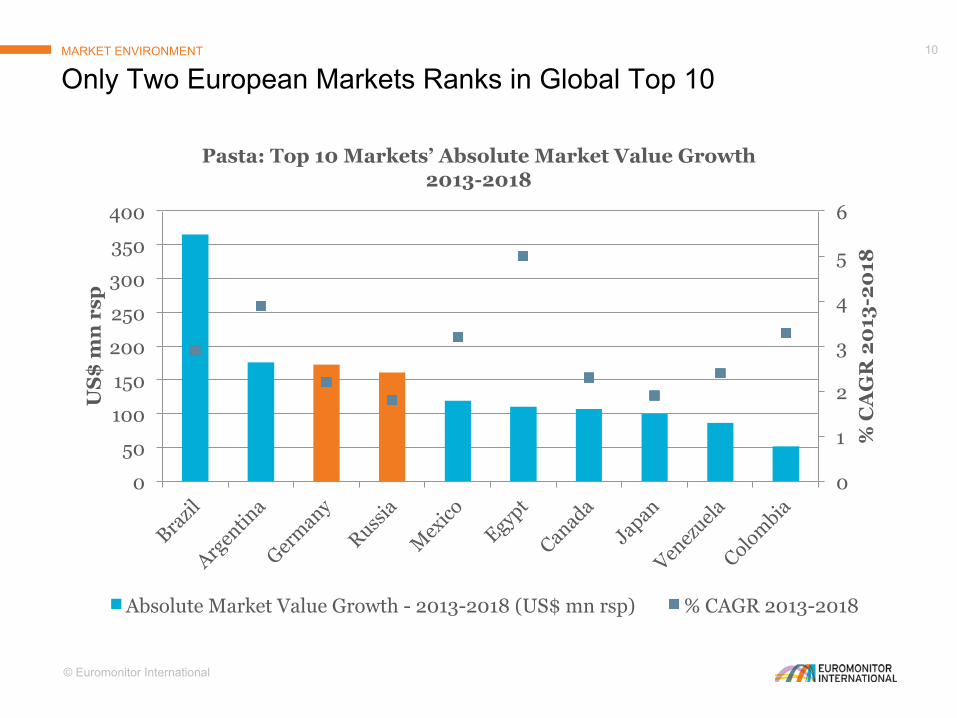
Pasta: Top 10 Markets’ Absolute Market Value Growth 2013-2018
Absolute Market Value Growth - 2013-2018 (US$ mn rsp) % CAGR 2013-2018
Only Two European Markets Ranks in Global Top 10 MARKET ENVIRONMENT

© Euromonitor International
11
Top Growth Markets in Europe – 2013-2018 MARKET ENVIRONMENT
Belarus 3.9%
Ukraine 3.3%
Serbia 2.7%
Austria 3.7%
Germany 2.2%
United Kingdom
0.9%
% CAGR 2013-2018, retail value terms, 2013 fixed exchange rate, US$ million

© Euromonitor International
12
-20
0
20
40
60
80
100
120
140
160
180
200
Germany Russia UK Austria Norway Ukraine Poland Belarus Serbia Portugal
Abs
olu
te M
arke
t V
alu
e G
row
th –
20
13-2
018
- U
S$
mn
rsp
Top 10 European Pasta Markets’ Growth Prospect by Category 2013-2018
Canned/Preserved Pasta Chilled/Fresh Pasta Dried Pasta
Still Dried Pasta Generates Most of European Growth MARKET ENVIRONMENT

© Euromonitor International
13
-600.0
-500.0
-400.0
-300.0
-200.0
-100.0
0.0
Italy Spain Switzerland Romania France
US
$ m
n r
sp
Five European Markets’ Negative Growth Prospects 2013-2018
Absolute Market Value Growth - 2013-2018 (US$ mn rsp)
Market Value Contraction in European Markets MARKET ENVIRONMENT

© Euromonitor International
14
0%
10%
20%
30%
40%
50%
60%
70%
80%
90%
100%
2010 2011 2012 2013
Axi
s T
itle
Western Europe Pasta Competitive Landscape
2010-2013
Top 10 Companies Private Label Others
0%
10%
20%
30%
40%
50%
60%
70%
80%
90%
100%
2010 2011 2012 2013
Axi
s T
itle
Eastern Europe Pasta Competitive Landscape
2010-2013
Top 10 Companies Private Label Others
Moderately Consolidated but Private Label Dominated Europe MARKET ENVIRONMENT

STILL UNSTABLE MARKET ENVIRONMENT
ADDING VALUE TO PASTA
LESSONS FROM BEYOND EUROPE
KEY TAKEAWAYS

© Euromonitor International
16
Convenience
Health Credentials
“Big Night- In”
Pasta Opportunities in the Gloomy Economy ADDING VALUE TO PASTA

© Euromonitor International
17
Smaller outlets lose share
Supermarkets/ hypermarkets stand up to discounters
0
10
20
30
40
2008 2013
% s
ales
Eastern Europe: Pasta Distribution Channel Breakdown – 2008/2013
Supermarkets
Hypermarkets
Discounters
Independent Small Grocers
Time Scarcity Drives Need for Convenient Shopping ADDING VALUE TO PASTA
0
20
40
60
2008 2013
% s
ales
Western Europe: Pasta Distribution Channel Breakdown – 2008/2013
Supermarkets
Hypermarkets
Discounters
Independent Small Grocers

© Euromonitor International
18
Pasta Meals: Convenient Cooking - Preparation ADDING VALUE TO PASTA
Pasta dish promotions
Cooking time promoted
front of package
Single portion – on-the-go
consumption

© Euromonitor International
19
-5
0
5
10
15
20
25
30
2008-09 2009-10 2010-11 2011-12 2012-13
% y
-o-y
gro
wth
Western Europe: Pasta Growth Performance by HW Category 2009-2013
Gluten-Free Pasta NH High Fibre Pasta Organic Pasta Pasta
0 1,000 2,000 3,000 4,000 5,000 6,000 7,000 8,000 9,000 10,000
Western Europe: Pasta Retail Value Sales by Category - 2013
Gluten-Free Pasta NH High Fibre Pasta Organic Pasta "Standard" Pasta
Premium Price of Healthy Pasta Offers Dynamic Growth – but on Small Scale
ADDING VALUE TO PASTA

© Euromonitor International
20
215
220
225
230
235
2009 2010 2011 2012 2013 2014
US
$ bi
llio
n
Western Europe: Total Retail Value Sales through Full-Service
Restaurants 2009-2014
• Challenging economy underpins home cooking trend
• Italian cuisine grows in popularity
0
10
20
30
2008 2013
% o
f to
tal c
hil
led
rea
dy
mea
ls
% Italian Chilled Ready Meal – 2008-2013
Austria Germany
Dried Pasta Eating into Share of Foodservice ADDING VALUE TO PASTA

© Euromonitor International
21
Natural ingredients
Variety of vegetable fillings No preservatives
Chilled Formats Thrive on Quality and Price in Germany ADDING VALUE TO PASTA
0
1
2
3
Germany Austria Germany Austria
Dried Pasta Chilled/Fresh Pasta Eu
ro /
40
0 g
pac
k
Dried vs Chilled/Fresh Pasta Unit Prices through Supermarket vs Discounter - 2013
Supermarket Discounter
Variety of Retail Formats

© Euromonitor International
22
Dried Pasta
Price
Dried formats are
the “real Italian style”
Benefits from
television cooking
New shapes, even for children
Wholegrain and organic
lines tap into health trend
“Big night in” occasions
Dried pasta outperformed chilled/fresh formats in the UK ADDING VALUE TO PASTA

© Euromonitor International
23
Austrian brands dominate
Innovation targets food intolerance consumer
group
Nostalgia in packaging
Pasta for less than €1 per kg
Strongest Western European Growth for Pasta - the Austrian Way ADDING VALUE TO PASTA

© Euromonitor International
24
0
500
1,000
1,500
2000 2001 2002 2003 2004 2005 2006 2007 2008 2009 2010 2011 2012 2013 2014
‘00
0 t
rip
s
Tourism Arrivals from Eastern Europe in Italy 2000-2014
Arrivals from Poland Arrivals from Russia
Travelling to Italy is expected to increase significantly because of safety concerns in competitor markets like Egypt and Tunisia.
Italian-travelled consumers in Eastern Europe are more receptive to pasta offerings than the rest of the population.
Increased Travel to Italy Inspires Eastern European Pasta Sales ADDING VALUE TO PASTA

© Euromonitor International
25
Russia: Pasta Dynamically Growing Source of Carbohydrate ADDING VALUE TO PASTA
-4
-3
-2
-1
0
1
2
3
4
5
6
-8,000
-6,000
-4,000
-2,000
0
2,000
4,000
6,000
8,000
10,000
12,000
Potatoes Pasta Rice
% C
AG
R 2
00
9-2
013
‘00
0 t
onn
es
Pasta Versus Rice and Potato in Russia. Retail Volume Growth – 2009-2013
Total Volume, 2013 % CAGR 2009-2013

© Euromonitor International
26
0
10
20
30
40
50
Russia Hungary Poland
% o
f p
asta
sal
es t
hro
ugh
In
dep
end
ent
Sm
all
Gro
cers
Pasta Sales Through Independent Small Grocers – 2008-2013
2008 2009 2010 2011 2012 2013
Consumers continue to be quite price sensitive and trade down to side dish staples during periods of economic duress
Low, competitive price at independent groceries is necessary
Eastern Europe: Expansion In Independent Groceries a challenge ADDING VALUE TO PASTA

© Euromonitor International
27
• Wholemeal, free-from, organic, fortified The health conscious
• Diverse distribution channel • Pasta for less than €1 per kg The price conscious
• Promote short cooking time/easy pasta recipes The time conscious
• Continuous expansion of premium fresh pasta offerings, e.g lamb-filled wine flavoured chilled pasta
The taste conscious
Europe: Producers Target Wider Consumer Range ADDING VALUE TO PASTA

STILL UNSTABLE MARKET ENVIRONMENT
ADDING VALUE TO PASTA
LESSONS FROM BEYOND EUROPE
KEY TAKEAWAYS

© Euromonitor International
29
Middle East and Africa & Latin America Drive Global Growth LESSONS FROM BEYOND EUROPE
992.3
1,825.1
72.0 482.5
Absolute Market Value Growth by Region – 2013/2018 - US$ mn rsp
Latin America
Middle East and Africa
Europe
Others

© Euromonitor International
30
Latin America Proven specially popular among less affluent consumers.
Mexico Versatility is a key driver of sales in the Mexican market.
Middle East & Africa Adoptable to a variety of traditional cuisine with sauces and fillings
Iran Diversification of products on store shelves & withdrawal of bread subsidies
Pasta Beyond Europe
Versatility and Adaptability the Key to Success LESSONS FROM BEYOND EUROPE

STILL UNSTABLE MARKET ENVIRONMENT
ADDING VALUE TO PASTA
LESSONS FROM BEYOND EUROPE
KEY TAKEAWAYS

© Euromonitor International
32
Western Europe: Largest Potential in Premium formats
Eastern Europe: Strike Balance between Quality and Price
Tailor and market offering to wide range of consumer segments
Retail Expansion is Key for Reaching New Consumers
Winning Strategies in Europe KEY TAKEAWAYS

THANK YOU FOR LISTENING Ildikó Szalai Senior Analyst Euromonitor International www.euromonitor.com [email protected] +44 (0) 20 7251 8024 EXT 2406