past windstorm occurrence trend, damage, and …jestec.taylors.edu.my/vol 11 issue 3 march...
TRANSCRIPT

Journal of Engineering Science and Technology Vol. 11, No. 3 (2016) 397 - 406 © School of Engineering, Taylor’s University
397
PAST WINDSTORM OCCURRENCE TREND, DAMAGE, AND LOSSES IN PENANG, MALAYSIA
MAJID, T. A.*, ZAKARIA, S. A. S., WAN CHIK, F. A., DERAMAN, S. N. C., MUHAMMAD, M. K. A.
School of Civil Engineering, Engineering Campus,
Universiti Sains Malaysia, 14300, Nibong Tebal, Penang, Malaysia
*Corresponding Author: [email protected]
Abstract
Windstorm occurrence in several parts of Malaysia, particularly in the northern region, has severely affected humans, causing damage to property as well as
fatality. This study aims to investigate the past windstorm occurrence trend,
including damage and losses, in Penang districts from 2010 to 2013. Data on
windstorm occurrence and on damages and losses from districts were collected
from the Land and District office and Social Welfare Department of Malaysia, Penang, Malaysia. The monthly windstorm occurrences in the districts were
compared. Windstorm likely occurs in during March, May, and November
annually. This windstorm occurrence indirectly contributes to the damage and
losses in that particular area. Therefore, this phenomenon must not be neglected
in Malaysia. The negative effects of this phenomenon become more severe with
increasing incidence. Therefore, disaster mitigation efforts should be exerted to reduce the disastrous consequences of windstorm.
Keywords: natural disaster; windstorm; damage and losses; disaster mitigation.
1. Introduction
Henderson and Ginger [1] classified windstorm as a tropical cyclone,
thunderstorm, tornadoes, monsoons, and gale. Windstorm occurrence increases
annually, leading to increased property damages and local economic
disruptions. EM-DAT [2] reported that the total damage caused by natural
disasters from 2012 to 2014 is higher in Asia than in other regions in the globe.
The Malaysian Meteorological Department (MET) is instrumental in delivering
early warning sign alerts on upcoming windstorm events through their website
and social media. This proactive approach creates and increases awareness

398 Majid, T. A. et al.
Journal of Engineering Science and Technology March 2016, Vol. 11(3)
among Malaysians and minimizes windstorm impact. Majid et al. [3] reported
that windstorm predominantly damages houses in the northern region of
Peninsular Malaysia.
As reported in previous studies, data were collected from newspaper articles
and published reports. A complete database on previous wind storm occurrence
in Malaysia remains unavailable. Eiser et al. [4] found that the quality of
available data to allow integrated risk assessments is uneven because of several
factors, such as lack of monitoring technologies, insufficient funding, and
suppression data and delay. The development of such a database is crucial to
provide information on windstorm distribution and damage level. This study
aims to assist weather forecasters, state authorities, manufacturers, insurance
companies, and the public toward disaster preparedness and mitigation.
This study focuses on windstorm occurrences and on number of houses,
damages, and losses in Penang, Malaysia. Windstorms in Malaysia must not be
neglected because the occurrence has initiated damage and losses to structures
and human life.
2. Methodology
Malaysia is situated in Southeast Asia and is divided by the South China Sea
into peninsular Malaysia and east Malaysia, Fig. 1(a). Peninsular Malaysia
shares a land and maritime border with Thailand and maritime borders with
Thailand, Vietnam, and Indonesia. East Malaysia shares land and maritime
borders with Brunei and Indonesia and a maritime border with the Philippines.
Penang is located in the northern peninsular Malaysia; the island portion is
separated by the Straits of Malacca adjoining the mainland. Penang has five
districts, two [Northeast Penang Island (TL) and Southwest Penang Island
(BD)] in the island portion and three [Northern Seberang Perai (SPU), Central
Seberang Perai (SPT) and Southern Seberang Perai (SPS) on the mainland
Fig. 1(b). The Land and District Office and Social Welfare Department of
Malaysia developed a database Appendix A.
Descriptive statistics was adopted in this research to analyze data on the (a)
cumulative monthly windstorm occurrence from year 2010 to 2013 (b) total house
damage and percentage from year 2010 to 2013 and (c) yearly number of
occurrence, house damage and losses.
Cumulative windstorm occurrence which referring to Figs. 2(a) and (b), is the
total sum of windstorm event takes place in every month that also represents each
district in Penang. Total house and damage and percentage represents house
damage addition for each district which reflects the total number of house damage
and plotted in percentage (Fig. 3). Meanwhile, for yearly number of occurrence,
house damage and losses shows the cumulative number of windstorm occurrence
related to house damage and losses yearly.

Past Windstorm Occurrence Trend, Damage, and Losses in Penang, Malaysia 399
Journal of Engineering Science and Technology March 2016, Vol. 11(3)
(a) Regional Map of Malaysia
(b) Focused Study Area
Fig. 1(a) Malaysia and Penang Districts Map
(www.malaysiatrack.com/2009/06/malaysia-in-map.html and
Fig. 1(b) en.wikipedia.org/wiki/Penang) Retrieved September 19, 2014.
3. Result and Discussion
3.1. Windstorm occurrences
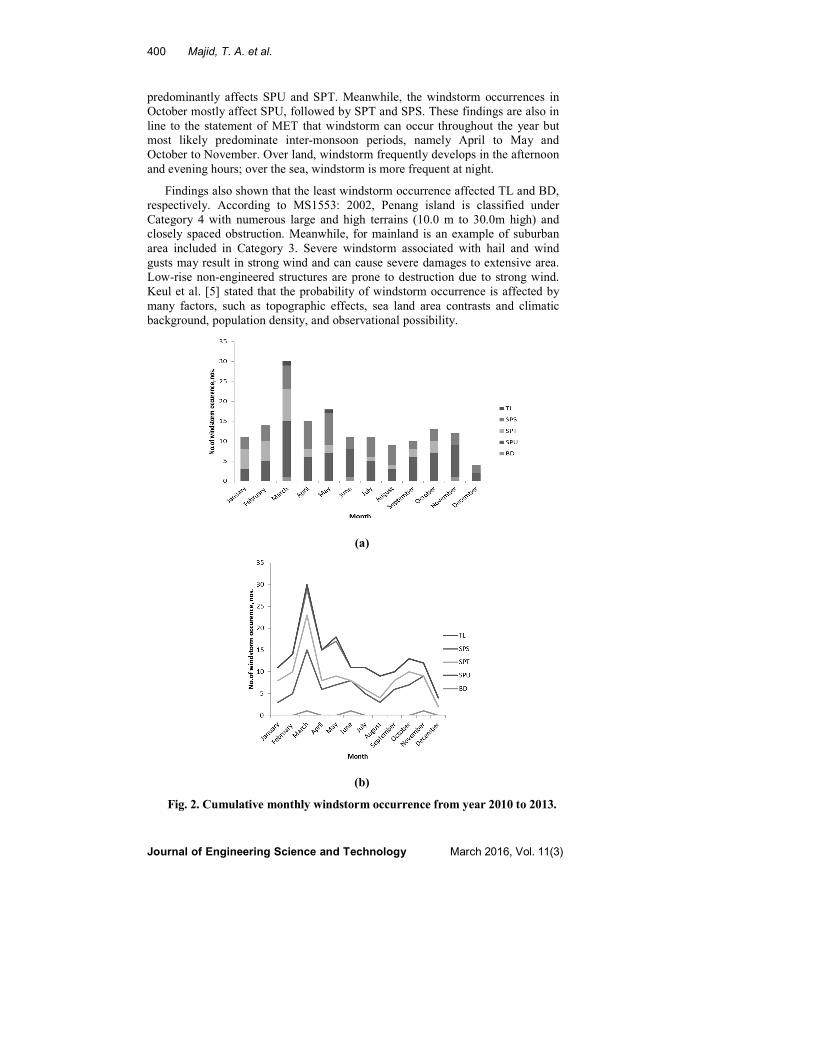
The graph was plotted to determine the monthly cumulative windstorm
occurrences for five districts in Penang from 2010 to 2013 (Figs. 2(a) and 2(b)).
The monthly frequency of windstorm occurrences was monitored. Windstorm
occurrence shows an increasing trend from January to March, with March having
the highest occurrence for each district. Windstorm occurrences gradually
decrease from May to August. The trends increase from September and peak in
October. The highest number of windstorm occurs in March, which
400 Majid, T. A. et al.
Journal of Engineering Science and Technology March 2016, Vol. 11(3)
predominantly affects SPU and SPT. Meanwhile, the windstorm occurrences in
October mostly affect SPU, followed by SPT and SPS. These findings are also in
line to the statement of MET that windstorm can occur throughout the year but
most likely predominate inter-monsoon periods, namely April to May and
October to November. Over land, windstorm frequently develops in the afternoon
and evening hours; over the sea, windstorm is more frequent at night.
Findings also shown that the least windstorm occurrence affected TL and BD,
respectively. According to MS1553: 2002, Penang island is classified under
Category 4 with numerous large and high terrains (10.0 m to 30.0m high) and
closely spaced obstruction. Meanwhile, for mainland is an example of suburban
area included in Category 3. Severe windstorm associated with hail and wind
gusts may result in strong wind and can cause severe damages to extensive area.
Low-rise non-engineered structures are prone to destruction due to strong wind.
Keul et al. [5] stated that the probability of windstorm occurrence is affected by
many factors, such as topographic effects, sea land area contrasts and climatic
background, population density, and observational possibility.
(a)
(b)
Fig. 2. Cumulative monthly windstorm occurrence from year 2010 to 2013.

Past Windstorm Occurrence Trend, Damage, and Losses in Penang, Malaysia 401
Journal of Engineering Science and Technology March 2016, Vol. 11(3)
3.2. Number of houses damaged
Figure 3 shows that number of houses damaged during windstorm events from
2010 to 2013 in SPU, SPT, SPS, TL, and BD. The number of houses damaged
was defined by the quantity of houses damaged in that particular district per
windstorm event and converted into percentage of the total number of houses
damaged. During this period, the highest number of houses damaged among the
five districts was recorded in SPU, with 538 (47%) of the total number of houses
damaged, followed by SPS, TL, SPT, and BD, with 226 (20%), 137 (12%), 126
(11%), and 111 (10%) of the total number of houses damaged, respectively.
Windstorm severely affect rural non-engineered buildings. Figure 4 shows
that the number of houses damaged by windstorm events annually increases
throughout the four-year data period. The number decreased in 2013 because the
data recorded were cut off by August. The majority of the houses damaged were
low-rise buildings. Figure 5 shows an image of the damage on the roofing system
on-site after a windstorm occurrence, i.e., roofs being blown-off and broken
trusses. The most common damages include roofing system failure, damage due
to flying debris, damage to building components, uprooted trees, power failure,
and fatalities. Building codes are important in decreasing the physical
vulnerability of houses and buildings [1, 6]. Henderson and Ginger [1] observed
that failure is caused by missing or poorly installed fasteners, poor roofing
structure, insufficient fasteners, and sub-standard roof sheathing, fasteners, and
nails. The loss of function of roof structures is often attributed to inadequate
nailing and connecting spacing. In cases where complete structural failure does
not occur, failure of the building envelope often allows wind-driven rain to
penetrate the building, leading to unserviceable conditions. For commonly used
range of roof pitches for residential structures, wind forces oriented normally to
the ridge of the roof cause wind uplift forces Simiu and Scanlan [7].
Fig. 3. Total of house damage and percentage from year 2010 to 2013.
Fig. 4. Yearly numbers of occurrence and house damage.

402 Majid, T. A. et al.
Journal of Engineering Science and Technology March 2016, Vol. 11(3)
Fig. 5. Failure of the roofing system due to windstorm.

Past Windstorm Occurrence Trend, Damage, and Losses in Penang, Malaysia 403
Journal of Engineering Science and Technology March 2016, Vol. 11(3)
3.3. Damage and losses
As shown in Fig. 6, the damage cost increases with increasing number of houses
involved during the windstorm for SPU, SPT, and SPS. For BD and TL, the
numbers of houses damaged are higher but the damage cost is lower compared with
those for the other districts. Low-rise buildings were predominantly damaged by
windstorm occurrences. Approximately 80% of the cases that incurred damages to
the roofing systems were caused by thunderstorms in Peninsular Malaysia. Damage
breakdown shows that 47% damage targeted the steel sheet roofing, 30% the truss
system, 13% the roof tiles, and 20% other related components [3]. Windstorm
occurrence in Malaysia must be taken seriously, and building codes and guidelines
in Malaysia need to be revised.
Figures 7(a) to 7(e) represent data on windstorm damages and losses in the
Penang from 2010 to 2013. Damage costs increased with increasing
windstorm occurrence rates. In SPU, 2011 incurred the largest damage cost,
with approximately 40% (RM 656,750) of the total damage estimation cost of
RM 1,659,450. The total damages increased by 22% from 2010 to 2011.
However, only 36% (RM 598, 500) of the total damage cost was recorded in
2012. In 2013, a small damage cost was recoded for SPU. This result may be
attributed to the cutoff data for 2013 being at the end of July. The damage
cost increased in the last quarter of the year because previous trends of
windstorm showed that the phenomenon occurs during November. SPU was
the worst affected district during windstorm because many damaged houses
were involved in the event Fig. 7(a).
As shown in Fig. 7(b), the slightest damage and lowest damage cost were
recorded in 2010. In April, the total damage cost was hampered by 46% (RM
265,500) and indicated the highest damage and cost imposed compared with those
recorded in 2012 and 2013. A slight increase of 26% (RM 158,520) to 28%
(RM 158,500) was observed from 2011 to 2012.
The total damage to SPS was approximately RM 696,000 throughout the
three-year data period Fig. 7(c). The second highest frequency of windstorm
occurrence was recorded in SPS among the five districts. The damage cost
in 2010 (RM 103,500, 15%) was lower than that in 2011 (RM 209,000, 30%)
and 2012 (RM 279,000, 40%). The damage cost increased in 2013 because
the availability of the existing data only cover up to August when this study
was conducted.
Figure 7(d) illustrates the lowest damage cost in TL among other districts in
Penang. The major damage cost, i.e., 83% of the total damage cost, was
recorded in 2010. A sudden drop of damage cost to only 17% (RM 4,000) was
observed in 2011. No damage cost was revealed in 2012 and 2013. Figure 7(e)
shows that the major contributor to damage cost was 2011, with RM 568,410
(68%) of the total damage cost of RM 829,410. A small damage cost (RM
65,000, 8%) was recorded in 2012. The damage cost in 2013 increased by
approximately 24% (RM 196,000).

404 Majid, T. A. et al.
Journal of Engineering Science and Technology March 2016, Vol. 11(3)
Fig. 6. Damages, losses and house damages represent for each district.
(a) SPU (b) SPT
(c) SPS (d) TL
(e) BD
Fig. 7. Damages and loss due to windstorm occurrences at (a) SPU, (b)
SPT, (c) SPS, (d) TL and (e) BD district from year 2010 to 2013.
Past Windstorm Occurrence Trend, Damage, and Losses in Penang, Malaysia 405
Journal of Engineering Science and Technology March 2016, Vol. 11(3)
4. Conclusion
Past windstorm occurrences are important to prepare for disasters and mitigate
their effects.
4.1. Windstorm occurrences
Windstorm predominantly occurs during April, May, and October, which cover
the inter-monsoon period. SPU suffered the highest windstorm intensity as
compared with other districts in Penang. Meanwhile, the lowest windstorm
occurrences were recorded throughout the three-year data period. However,
improvement of windstorm database remains a priority to further investigate
windstorm characteristics.
4.2. Number of houses damaged
The highest and lowest numbers of houses damaged were recorded in SPU and
SPT, representing 47% and 11% of the total houses damaged in Penang,
respectively. Compulsory use of building codes to the non-engineered rural
houses should be implemented, and the Malaysian code of building MS
1553:2002 [8] needs to be revised.
4.3. Damage and losses
An increase in severe windstorm events increases damage, losses, and even
mortality. Damage, losses, and social problems are related to this natural
disaster. Extensive damage was observed in rural non-engineered buildings in
Penang. In line with this finding, Henderson and Ginger [1] found that failure
is influenced by several factors, such as missing or poorly installed fasteners,
insufficient fasteners, and sub-standard roof sheathing, fasteners, and
nails. Kousky [9] classified damage to homes and contents as direct impacts
of the disaster.
Future works are encouraged to conduct a survey by distributing
questionnaires to practitioners regarding the current implementation of building
codes in Malaysia. A post disaster survey also needs to be conducted to gather
information on the type and level of damages. Thus, efforts on mitigation and
other prevention measures need to be exerted to minimize human damage and
economic losses, as well as prevent recurrence. Although Malaysia is not in the
cyclone-prone region, a good awareness should be taken to reduce the negative
impacts of windstorm.
Acknowledgement
The author would like to thank the Ministry of Education Malaysia under
MyBrain15 for providing financial support, Research Creativity and Management
Office, Universiti Sains Malaysia. The author also would like to express gratitude
to the Land and District Office and State Social Welfare Department of Malaysia
for providing useful data.

406 Majid, T. A. et al.
Journal of Engineering Science and Technology March 2016, Vol. 11(3)
References
1. Henderson, D.; and Ginger, H. (2008). Role of building codes and
construction standard in windstorm disaster mitigation, The Australian
Journal of Emergency Management, 23(2), 40-46.
2. EM-DAT - The OFDA/CRED International disaster database, Université
Catholique de Louvain - Brussels – Belgium. Retrieved March 30, 2014, from
http://www.em-dat.net
3. Majid, T.A.; Ramli, N.I.; Ali, M.I., Saad, M.S.H.; Hasim, M.; and Zakaria, I.
(2011). Malaysia Country Report 2010.
4. Eiser, J.R.; Bostrom, A.; Burton, I.; Johston, D.M.; McClure, J.; Paton, D.;
van der Pligt, P.; and White, M.P. (2012). Risk interpretation and action: A
conceptual framework for responses to natural hazards. International Journal
of Disaster Risk Reduction, 1, 15-16.
5. Keul, A.G.; Sioutas, M.V.; and Szilagyi, W. (2009). Prognosis of Central-
Eastern Mediterranean Waterspouts, Atmospheric Research, (93), 426-436.
6. Tingsanchali, T. (2012). Urban flood disaster management. Procedia
Engineering, 32, 25-37.
7. Simiu, E.; and Scanlan, R.H. (1986). Wind effects on structures, John
Wiley & Sons Inc., New York, Chichester, Brisbane, Toronto, Singapore.
8. MS1553: 2002. Code of Practice on Wind Loading for Building Structure,
Department of Standard Malaysia.
9. Kousky, C. (2014). Informing climate adaptation: A review of the economic
costs of natural disasters. Energy Economics, 46, 576-592.
Appendix A
Methodology Flowchart
Wind Disaster
Data Collection
-Date of Event
-Location
-Damage cost
-Trend of windstorm occurrence
-Yearly damage estimation
-Damage and losses
• Land and District office
• National Security Council
• Department of Welfare Malaysia