past the peak? trajectories of national coal fleets and coal ...a thesis submitted to the department...
TRANSCRIPT
A thesis submitted to the Department of Environmental Sciences and Policy of
Central European University in part fulfilment of the
Degree of Master of Science
Past the peak? Trajectories of national coal fleets
and coal-fired electricity generation between 1960
and 2020
Janna HOPPE
June, 2020
Budapest
CE
UeT
DC
olle
ctio
n
ii
Erasmus Mundus Masters Course in
Environmental Sciences, Policy and
Management
MESPOM
This thesis is submitted in fulfillment of the Master of Science degree awarded as a result of
successful completion of the Erasmus Mundus Masters course in Environmental Sciences,
Policy and Management (MESPOM) jointly operated by the University of the Aegean
(Greece), Central European University (Hungary), Lund University (Sweden) and the
University of Manchester (United Kingdom).
CE
UeT
DC
olle
ctio
n
iii
Notes on copyright and the ownership of intellectual property
rights
(1) Copyright in text of this thesis rests with the Author. Copies (by any process) either in
full, or of extracts, may be made only in accordance with instructions given by the Author and
lodged in the Central European University Library. Details may be obtained from the Librarian.
This page must form part of any such copies made. Further copies (by any process) of copies
made in accordance with such instructions may not be made without the permission (in writing)
of the Author.
(2) The ownership of any intellectual property rights which may be described in this thesis
is vested in the Central European University, subject to any prior agreement to the contrary,
and may not be made available for use by third parties without the written permission of the
University, which will prescribe the terms and conditions of any such agreement.
(3) For bibliographic and reference purposes this thesis should be referred to as:
Hoppe, J. 2020. Past the peak? Trajectories of national coal fleets and coal-fired electricity
generation between 1960 and 2020. Master of Science thesis, Central European University,
Budapest.
Further information on the conditions under which disclosures and exploitation may take place
is available from the Head of the Department of Environmental Sciences and Policy, Central
European University.
CE
UeT
DC
olle
ctio
n

iv
Author’s declaration
No portion of the work referred to in this thesis has been submitted in support of an application
for another degree or qualification of this or any other university or other institute of learning.
Janna HOPPE
CE
UeT
DC
olle
ctio
n
v
Abstract
ABSTRACT OF THESIS submitted by:
Janna HOPPE for the degree of Master of Science and entitled: Past the peak? Trajectories of
national coal fleets and coal-fired electricity generation between 1960 and 2020.
Month and Year of submission: June, 2020.
Coal-fired electricity generation is one of the main causes of anthropogenic climate change.
Nevertheless, the patterns and dynamics of coal fleet development have scarcely been
investigated via quantitative, multi-country comparisons. This exploratory study integrated
and analysed two datasets on electricity generating coal units worldwide to map the
trajectories of 32 national coal fleets and 6 main coal consuming regions. These trajectories
were evaluated through a novel framework combining theories on technology diffusion with
notions of technology decline and abandonment.
The principle findings were that, generally, units built since 1970 increased in size, adopted
more efficient combustion technologies, and became increasingly likely to be privately
owned. Geographically, the rate of units being constructed in Asia increased dramatically
while simultaneously falling in Europe and North America. Overall, countries are in different
phases of the coal technology lifecycle, exemplified by varying trajectories of total installed
capacity and net annual capacity growth over the last 40-60 years. Contributing to the
discussion on global coal decline, this study observed that total installed coal capacity for
several countries demonstrates an inverse S-curve of technology diffusion with coal fleets
shrinking slowly at first, but then more rapidly. Lastly, load factors (average utilization rates)
were found be lower in contracting rather than growing coal fleets.
These spatio-temporal patterns in coal capacity should be compared to trends in other coal-
related sectors, such as heat provision or mining, to provide further insights into how the
global phase-out of coal can be achieved.
Keywords: coal, energy transition, technology diffusion, electric capacity, phase-out
CE
UeT
DC
olle
ctio
n

vi
Acknowledgements
First and foremost, I want to thank my thesis supervisor Prof. Aleh Cherp, who’s kind and
tireless support has extended far beyond the writing of this thesis, and who is a true role model
in terms of rigorous scientific inquiry.
I would also like to thank all other CEU professors, who made me appreciate education and the
environment even more. Jessica Jewell has given me valuable advice on the premises of
research, and I greatly appreciated Vadim Vinichenko’s input on methodological questions.
Further, I would like to thank Christine Shearer for sharing Global Energy Monitor’s data with
me. Also, I am grateful to the countless scientists, environmental groups, and individuals who
dedicate so much time and energy to decarbonising global energy supply and fighting climate
change.
Finally, I would like to thank my parents for their unfailing encouragement and unconditional
support, as well as my friends, who I share so many unforgettable memories with. But most of
all, I thank my flatmate, my best friend, and my partner for being an inspiration in all aspects
of life, and for brightening up every single day.
CE
UeT
DC
olle
ctio
n
vii
List of Contents
1 Introduction ...................................................................................................................1
1.1 Anthropogenic Climate Change .........................................................................................1
1.2 The Role of Energy and Coal .............................................................................................3
1.2.1 The Power Sector.....................................................................................................3
1.2.2 The Coal Sector .......................................................................................................3
1.3 Research Questions and Objectives ....................................................................................5
1.3.1 Rationale .................................................................................................................5
1.3.2 Research Questions (RQ) .........................................................................................5
1.3.3 Research Objectives (RO) ........................................................................................5
1.4 Overview of Thesis ............................................................................................................6
2 Literature Review ..........................................................................................................8
2.1 Introduction to the Coal Complex ......................................................................................8
2.1.1 Historic Development of Coal Use ...........................................................................8
2.1.2 Economic Relevance.............................................................................................. 10
2.1.3 Electricity System Integration ................................................................................ 12
2.1.4 Energy and Climate Policies .................................................................................. 14
2.2 Energy System Change .................................................................................................... 15
2.2.1 The Rise of Energy Technologies........................................................................... 15
2.2.1.1 Innovation Studies and Technology Diffusion ......................................... 15 2.2.1.2 Temporal and Spatial Diffusion ............................................................... 18
2.2.2 The Stagnation and Persistence of Energy Technologies ........................................ 19
2.2.3 The Decline of Energy Technologies ..................................................................... 20
2.2.3.1 Regime Destabilisation and Exnovation .................................................. 20 2.2.3.2 Temporal and Spatial Decline ................................................................. 22
2.2.4 Empirical Evidence from Past Energy Transitions .................................................. 22
3 Theoretical Framework (TF) ...................................................................................... 24
3.1 Research Gap and Motivation .......................................................................................... 24
3.2 Theories and Hypotheses ................................................................................................. 24
3.3 Integration of TF and ROs ............................................................................................... 26
4 Methods and Results .................................................................................................... 28
4.1 Introduction and Outline .................................................................................................. 28
4.2 Datasets and Data Wrangling ........................................................................................... 28
4.3 RO 1: Characteristics of the Global Coal Fleet ................................................................. 31
4.3.1 Economic Factors .................................................................................................. 31
4.3.1.1 Capital Costs ........................................................................................... 31 4.3.1.2 Operating Costs and Revenues ................................................................ 32 4.3.1.3 Economic and System Costs.................................................................... 33 4.3.1.4 Ownership .............................................................................................. 33
4.3.2 Technological Factors ............................................................................................ 34
4.3.2.1 Technology and CCS .............................................................................. 34 4.3.2.2 Efficiencies ............................................................................................. 34 4.3.2.3 Utilization and Load Factors ................................................................... 35 4.3.2.4 Flexibility ............................................................................................... 36
CE
UeT
DC
olle
ctio
n
viii
4.3.3 Lifetimes and Retirement Ages .............................................................................. 37
4.3.3.1 Concepts ................................................................................................. 37 4.3.3.2 Lifetime and Retirement Age Estimates .................................................. 37 4.3.3.3 Age Structure .......................................................................................... 38
4.3.4 Premature Retirements and Stranded Assets ........................................................... 38
4.3.4.1 Definition and Relevance ........................................................................ 38 4.3.4.2 Causes .................................................................................................... 40 4.3.4.3 Estimates ................................................................................................ 40 4.3.4.4 Managing Losses .................................................................................... 41
4.4 RO 2: Development of Coal Capacity Characteristics ...................................................... 41
4.4.1 Methods................................................................................................................. 41
4.4.2 Results ................................................................................................................... 42
4.5 RO 3: Development of Lifetimes and Retirement Ages .................................................... 48
4.5.1 Methods................................................................................................................. 48
4.5.2 Results ................................................................................................................... 50
4.5.3 Limitations ............................................................................................................ 55
4.6 RO 4: Annual Capacity Additions, Retirements, and Total Installed Capacity .................. 56
4.6.1 Methods................................................................................................................. 56
4.6.2 Results ................................................................................................................... 56
4.7 RO 5: Relationship between Capacity Development and Coal-fired Electricity Generation
........................................................................................................................................ 61
4.7.1 Methods................................................................................................................. 61
4.7.2 Results ................................................................................................................... 62
5 Discussion ..................................................................................................................... 73
5.1 The Rise of Coal .............................................................................................................. 73
5.2 The Persistence of Coal ................................................................................................... 76
5.3 The Decline of Coal ......................................................................................................... 77
5.4 Further Considerations ..................................................................................................... 80
5.5 Synthesis ......................................................................................................................... 81
6 Conclusions .................................................................................................................. 85
6.1 Summary of Findings and Fulfilment of ROs ................................................................... 85
6.2 Limitations and Further Research .................................................................................... 87
6.3 Final Considerations ........................................................................................................ 88
References ........................................................................................................................... 91
Appendix ........................................................................................................................... 106
CE
UeT
DC
olle
ctio
n
ix
List of Figures
Figure 1: Diffusion process and phases of consumer adoption .......................................................... 16
Figure 2: Technology S-curves ......................................................................................................... 17
Figure 3: S-curves of Innovation and Exnovation ............................................................................. 25
Figure 4: Phases of technology adoption and abandonment .............................................................. 25
Figure 5: Integration of theoretical framework and research objectives ............................................. 27
Figure 6: Capacity additions by size and region for 1970-2020 .......................................................... 43
Figure 7: Capacity additions by size and combustion technology for 1970-2020 ................................ 44
Figure 8: Capacity additions by unit ownership (MW-weighted) for 1981-2020 ............................... 45
Figure 9: Capacity additions by fuel type for 1980-2020 ................................................................... 46
Figure 10: Age distribution and technology of the current operational fleet by region ........................ 47
Figure 11: Average age of national and regional coal fleets in 2019 ................................................... 48
Figure 12: Theoretical model for path analysis . ................................................................................ 49
Figure 13: Average retirement age of national and regional fleets since 1980 .................................... 51
Figure 14: Annual capacity retirements by retirement age category since 1990 ................................. 52
Figure 15: Distribution of retirement ages by region (since 1970) ...................................................... 53
Figure 16: Median and interquartile range for retirement age (since 1970) ........................................ 53
Figure 17: Results of path analysis ................................................................................................... 54
Figure 18: Global annual capacity additions and retirements by region . ............................................ 57
Figure 19: Annual capacity additions and retirements for each focus region ...................................... 58
Figure 20: Total installed coal capacity 1960-2019 (example countries) ............................................ 60
Figure 21: Total installed electric capacity since 2000 by source (example countries) ....................... 61
Figure 22: Normalised net annual capacity additions and coal-fired electricity generation.................. 66
Figure 23: National and regional average load factors for 2018 ........................................................ 68
Figure 24: Regional average load factors for 2000-2017 .................................................................... 69
Figure 25: Share of coal in total electric capacity and total electricity generation ............................... 72
Figure 29: Total installed coal capacity in 2020 relative to peak ....................................................... 84
Figure 30: Current operational fleet by ownership .......................................................................... 106
Figure 31: Current operational fleet by fuel type ............................................................................. 106
Figure 32: Development of retirement ages by focus region since 1980 ........................................... 107
Figure 33: Net annual capacity additions by country since 1980 ...................................................... 111
Figure 34: Total installed coal capacity since 1960 .......................................................................... 114
Figure 32: Total installed electric capacity since 2000 ..................................................................... 117
CE
UeT
DC
olle
ctio
n

x
List of Tables
Table 1: Country classification scheme I: Coal use ............................................................................ 30
Table 2: Country classification scheme II: Focus regions................................................................... 30
Table 3: Capacity and electricity generation development for DEC18 and COAL14 countries ........... 67
Table 4: National average load factors for all DEC18 and COAL14 countries for 2000-2017 ............ 70
Table 5: List of countries and ISO country codes............................................................................. 108
CE
UeT
DC
olle
ctio
n
xi
List of Abbreviations
AFOLU Agriculture, forestry, and other land use
BAU Business as usual
BECCS Bioenergy with carbon capture and storage
Btu British thermal unit
CCGT Combined cycle gas turbine
CCS Carbon capture and storage
CDR Carbon dioxide removal
CFI Comparative fit index
CHP Combined heat and power
CO2 Carbon dioxide
COAL14 Group of countries (see section 4.2)
COP Conference of the Parties
DEC18 Group of countries (see section 4.2)
DWLS Diagonally weighted least squares
FOM Fixed operations and maintenance
GCPT Global Coal Plant Tracker (database)
GDP Gross domestic product
GHG Greenhouse gas
Gt Gigaton
IEA International Energy Agency
IED Industrial Emissions Directive
IPCC Intergovernmental Panel on Climate Change
kWh Kilowatt hour
LCPD Large Combustion Plants Directive
ML Maximum likelihood
MLP Multi-Level Perspective
MW Megawatt
NDCs Nationally determined contributions
NOx Nitrogen oxides
OECD Organisation for Economic Co-operation and Development
PIK Potsdam Institute for Climate Impact Research
PPCA Powering Past Coal Alliance
CE
UeT
DC
olle
ctio
n
xii
R&D Research and development
RE Renewable energy
ROTW Rest of the world; group of countries (see section 4.2)
SEM Structural equation model
SO2 Sulphur dioxide
SRMR Standardised Root Mean Residual
TWh Terawatt hour
UNFCCC United Nations Framework Convention on Climate Change
VOM Variable operations and maintenance
VRE Variable renewable energy
WEPP World Electric Power Plants (Platts database)
CE
UeT
DC
olle
ctio
n
Introduction
1
1 Introduction
As one of the most serious threats to ecosystems and human life on earth, anthropogenic climate
change has become one of the most topical areas of research and contemporary discourse. In
the following section, I briefly present the impacts and drivers of climate change, highlight the
contribution of power supply and coal firing, and present options for deep emission reductions.
The following sections thus provide a rationale for undertaking this research project in the first
place and establish a broad context for all subsequent chapters.
1.1 Anthropogenic Climate Change
The accumulation of carbon dioxide (CO2) and other greenhouse gases (GHG) in the
atmosphere due to human activity has led to a global temperature rise of approximately 1°C
compared to pre-industrial times (IPCC 2018). The observed warming has increased the
frequency and intensity of extreme weather events, led to substantial sea level rise, ocean
acidification, and a decline in sea ice extent, as well as increased precipitation in some regions
of the world while others are experiencing more droughts (IPCC 2014; IPCC 2018; O’Neill et
al. 2017). The Intergovernmental Panel on Climate Change (IPCC), among others, further
expects climate change to cause an increase in the displacement of people, violent conflicts,
poverty, and economic instability (IPCC 2014).
This outlook has led to the formulation of the Paris Agreement in the context of the United
Nations Framework Convention on Climate Change’s (UNFCCC) 21st Conference of the
Parties (COP) in 2015. Its ratification constituted an important milestone in international
climate negotiations and provided the cornerstone of climate protection efforts today. Its
signatories pledge to limit global temperature rise to “well below” 2°C above pre-industrial
levels, and to “pursue efforts to limit the temperature increase even further to 1.5°C” (United
Nations 2015). However, global or country-specific pathways on how to meet this goal are
scarce (Rogelj et al. 2018).
Due to the quasi-linear relationships between cumulative CO2 emissions in the atmosphere and
global temperature rise (Matthews et al. 2009), the extent of future warming depends on past
and future emissions, but also to an uncertain degree on natural climate variability (IPCC 2014).
The carbon budget – i.e. the allowable amount of emissions for limiting global temperature rise
to 1.5°C / 2°C – is shrinking by approximately 42 GtCO2 every year (IPCC 2018). Despite
considerable disagreement with regards to the amount of carbon emissions compatible with a
CE
UeT
DC
olle
ctio
n
Introduction
2
66% chance of reaching the 1.5°C temperature goal (ranging from -200 to 800 GtCO2 in 2018)
as well as the ‘years left’ for the continuation of current emissions (ranging from -5 to 19 years)
(e.g. Millar et al. 2017; Schurer et al. 2018; Lowe and Bernie 2018; Rogelj et al. 2018; Peters
2018), even generous estimates call for fast and far reaching emission reductions (Hausfather
2018). This would necessitate a transformation of the global economy unprecedented in scale
(IPCC 2018): A 1.5°C warming may “not yet [be] a geophysical impossibility” (Millar 2017),
but more and more evidence points towards requiring “Herculean efforts” (Luderer et al. 2018,
632).
Limiting the extent of climate change requires a range of mitigation measures, in the centre of
which lie reductions in energy intensity of the global economy and in carbon intensity of energy
supply (IPCC 2018). This necessarily entails the shift away from fossil fuels and the large-scale
rollout of low-carbon energy technologies (Rogelj et al. 2018) as well as considerable and
structural changes on the demand side (Creutzig et al. 2018). But most mitigation pathways
also feature carbon dioxide removal (CDR) in the form of bioenergy with carbon capture and
storage (BECCS) and the agriculture, forestry, and land use (AFOLU) sector (IPCC 2018;
Rogelj et al. 2018). Delayed climate action increases the necessity to upscale CDR, which is
associated with “considerable implementation challenges” (IPCC 2018, 18) and carries several
sustainability concerns (Luderer et al. 2018).
Current mitigation and adaptation efforts are pursued via ‘Nationally Determined
Contributions’ (NDCs), which are voluntary national plans to reduce emissions and adapt to
the impacts of global warming under the Paris Agreement. In their current form, they are
projected to result in a global temperature increase of approximately 3°C by 2100 (IPCC 2018),
thereby falling short of being on track for meeting either one of the climate goals. This lack of
ambition is aggravated by several barriers to mitigation, such as inertia in social and economic
systems (IPCC 2014), or infrastructurally induced path dependencies (Luderer et al. 2018).
Especially soft constraints originating from societal and political domains are perceived as key
barriers to deep decarbonisation, making the 1.5 and 2°C climate targets less feasible (Jewell
and Cherp 2019). CE
UeT
DC
olle
ctio
n
Introduction
3
1.2 The Role of Energy and Coal
1.2.1 The Power Sector
As mentioned above, energy sector transformation lies at the heart of effective climate
protection. According to Hoesly et al. (2018), energy supply is responsible for approximately
45% of all energy-related CO2 emissions, of which the majority stem from the power sector
(Luderer et al. 2018). Further, CO2 emissions from the combustion of fossil fuels and industrial
activities account for 78% of the GHG emission increase between 1970 and 2010 (IPCC 2014).
Although reaching the climate goals requires emissions reductions on both the supply and
demand side (i.e. tackling the direct combustion of fossil fuels in the transport, industry, and
buildings sector), mitigation potentials are greater in energy supply (Bauer et al. 2017; Luderer
et al. 2018), while also being cost-efficient and providing more flexibility with regards to
technology choices (Krey et al. 2014; Williams et al. 2012). Prioritising the decarbonisation of
electricity supply further makes electrification measures especially in transport and heat
provision powerful mitigation options.
The composition of national energy systems greatly depends on socio-economic conditions, the
availability and price of energy resources, technological progress and innovation, and changes
in energy end-use (Bauer et al. 2017). It is thus important to understand socio-economic
developments to make predictions about future energy systems (Grubler 2012; Jakob et al.
2012). Various developments inside and outside of energy supply already exert substantial
pressures that affect the degree of lock-in of incumbent companies and energy carriers as well
as the diffusion of low-carbon technologies (Bauer et al. 2017).
1.2.2 The Coal Sector
In 2018, coal accounted for almost 40% of global power production (IEA 2019a), making it the
largest source of electricity in the world. Releasing 75% more CO2 per unit of energy than
natural gas (Gabbatiss 2020), it accounts for over a third of global CO2 emissions (Rauner et
al. 2020). Carbon dioxide emissions from coal peaked in 2013, but recently rebound after four
years of decline (Jackson et al. 2019). Additionally, a recent study finds that non-CO2 GHG
emissions, originating predominantly from methane leakage in coal mining, are substantially
higher than initially thought (Kholod et al. 2020).
Davis and Socolow (2014) popularised the concept of committed emissions, which are the
cumulative emissions a power plant fleet will emit over its life, assuming historic lifetimes and
CE
UeT
DC
olle
ctio
n
Introduction
4
utilization rates. Since then, several authors have calculated committed emissions from the
energy, electricity or coal sector (e.g. Pfeiffer et al. 2016; Pfeiffer et al. 2018; Edenhofer et al.
2018; Tong et al. 2019; Spencer et al. 2018; van Breevoort et al. 2015), and all concluded that
committed emissions from the existing and planned coal or power sector infrastructure
substantially exceed the power sector’s share of the 1.5°C and even 2°C carbon budget. While
all calculations are highly sensitive to underlying assumptions regarding lifetimes and load
factors (Tong et al. 2019; Pfeiffer et al. 2018; Davis and Socolow 2014), these calculations
effectively highlight the importance of short-term energy policy on long-term climate goals.
According to IPCC estimates, emissions from coal combustion for electricity generation must
fall by 80% by 2030 for a good chance of limiting global temperature increase to below 1.5°C
(Yanguas Parra et al. 2019). Delaying a global coal phase-out will either lead to overshooting
the carbon budget, a large-scale stranding of coal infrastructure, or result in a higher need for
negative emissions in the medium and long-term (van Breevoort et al. 2015). Since such
scenarios are highly contested for the adverse effects on public health and the economy, most
scholars view the accelerated phase-out of coal as one of the low-hanging fruit of climate
protection (CAN Europe 2018).
While the International Energy Agency (IEA) projects coal combustion for power generation
to stagnate over the next few years, they acknowledge that pressures on the coal industry have
accumulated. These pressures include public opposition to coal mining and combustion,
competition from renewables and natural gas, and environmental policies, such as air pollution
regulations or climate targets (IEA 2019a). Further, since the formation of the Powering Past
Coal Alliance (PPCA), 33 national governments and 27 subnational governments have pledged
to phase out coal completely (PPCA 2020). But, since these countries only account for a small
share of global coal capacity (4.4% in 2019) (Jewell et al. 2019), “globally phasing out coal
remains one of the hardest political nuts to crack” (PIK 2020). This is despite the fact that the
benefits of a global coal exit, stemming from the reduction of negative health and ecosystem
impacts, by far outweigh the costs of a phase-out, which are composed of economic growth
reduction and investments in energy systems (Rauner et al. 2020). CE
UeT
DC
olle
ctio
n
Introduction
5
1.3 Research Questions and Objectives
1.3.1 Rationale
A large proportion of research in the field of energy transitions is concerned with the emergence
of renewable energy technologies. Also, case study approaches dominate over large-N, multi-
country comparisons (see section 2.2). Meanwhile, research on coal is led by questions of past
and future emissions, its role in electricity supply, and regional transformation pathways. But
the economic, social, and environmental costs of continued coal plant construction and
associated combustion call for a thorough analysis of whether national coal fleets are growing
or shrinking, as well as at what rate and how they change. This thesis sets out to compare several
national and regional coal fleet trajectories to put respective developments into a global
perspective.
The following research questions and objectives are not only informed by the research
mentioned above (section 1.2.2), but by findings of several, multi-disciplinary studies, which
will be reviewed in later sections (2.1 and 4.3). Finally, the rationale for looking into the historic
development of coal capacity is that the past rise and decline of energy technologies can be
useful to estimate future pathways (Wilson et al. 2013; Grubler 2012).
1.3.2 Research Questions (RQ)
The overarching research questions that this thesis sets out to answer are:
• What are the spatio-temporal dynamics of global coal capacity development?
Particularly;
a. How have national and regional coal fleets changed; where, and at what rate
have they expanded or shrunk over the past decades?
b. What is the relationship between electricity generation from coal combustion
and coal capacity development?
1.3.3 Research Objectives (RO)
Following from the research questions are these specific research objectives:
1) Qualitatively investigate techno-economic characteristics of the global coal fleet in a
comprehensive literature review that serves as a basis for all following analyses;
2) Explore changes in unit size, technology, ownership, location, and combinations
thereof, in an exploratory, quantitative analysis using data on coal units worldwide;
CE
UeT
DC
olle
ctio
n
Introduction
6
3) Investigate the development of (average) retirement ages for selected countries over
time and identify predictors of retirement age in a path analysis;
4) Investigate the development of annual capacity additions and retirements, as well as
total installed electric and coal capacity on the country and regional level;
5) Explore the relationship between capacity development and electricity generation from
coal, including a calculation of load factors.
The temporal scope of this thesis spans the years between 1960 and today but differs depending
on the underlying research objective as well as the reliability and availability of data. The spatial
scope is global but focuses on main coal consuming regions as well as particularly interesting
national cases. This thesis is an exploratory research project that follows no other particular
study in its design. It combines qualitative and quantitative elements to provide a broad
overview of techno-economic aspects of coal capacity development.
1.4 Overview of Thesis
In the preceding Chapter 1, the motivation for studying this topic in the first place, namely
anthropogenic climate change (1.1) and the role of energy supply and coal combustion (1.2),
was presented. This was followed by the formulation of overarching research questions (1.3.2)
and five corresponding research objectives (1.3.3).
Chapter 2 reviews relevant literature on coal (2.1) and approaches to studying energy
transitions (2.2). The first half contains information on the historic development of coal use
(2.1.1), its economic relevance (2.1.2), its integration into the electricity system (2.1.3), and key
energy and climate policies (2.1.4). In the second half, light is shed on dynamics accompanying
the rise (2.2.1), stagnation (2.2.2) and decline (2.2.3) of energy technologies as well as on
empirical observations from past energy transitions (2.2.4).
In Chapter 3, the theoretical framework is introduced. It condenses main theories from section
2.2 with additional hypotheses regarding the decline and abandonment of energy technologies
(3.2). This chapter concludes by integrating the developed theoretical framework with the
research objectives (3.3).
Chapter 4 presents all methods and results. As a first step, the data and initial steps of data
wrangling are described (4.1-4.2). This is followed by a qualitative analysis of techno-economic
factors related to the operation of coal units (4.3), which includes sections on economic factors,
technological factors, lifetimes and retirement ages, and premature retirements and stranded
CE
UeT
DC
olle
ctio
n
Introduction
7
assets. Subsequent sections investigate the development of coal capacity characteristics (4.4),
the development of lifetimes and retirement ages (4.5), and annual capacity additions,
retirements, and total installed coal capacity (4.6). Finally, the relationship between coal
capacity and electricity generation from coal is explored (4.7).
In Chapter 5, all qualitative and quantitative results are integrated using the theoretical
framework. Specifically, this entails discussions on the rise (5.1), persistence (5.2), and decline
(5.3) of coal, as well as general dynamics spanning all three phases (5.4 and 5.5).
Chapter 6 sums up all findings and relates them to the research objectives (6.1). Further,
limitations and opportunities for further research are highlighted (6.2), alongside policy
recommendations and concluding remarks (6.3).
CE
UeT
DC
olle
ctio
n
Literature Review
8
2 Literature Review
2.1 Introduction to the Coal Complex
Before diving into more technical and capacity-related aspects of coal-fired electricity
generation, a brief review of the historic development of coal as an energy source is due.
Following this are sections on the economic relevance of the coal industry, coal’s integration
into the electricity system, as well as energy and climate policies to disincentivise the
combustion of coal for electricity generation. What should be noted here is that the subsequent
overview is deliberately held general, to provide a profound understanding of the use of coal
worldwide. If there is an interesting case in one particular country, it will be highlighted as
such.
2.1.1 Historic Development of Coal Use
The use of coal for energy purposes presumably dates back to China of 2000 BC (Dodson et al.
2014). Despite uncertainty as to when and by whom coal was first used, reliable artefacts
corroborate the combustion of coal around the world in the Middle Ages. Until the mid-1800s
however, wood remained the dominant energy resource for its low price and abundance
(Igliński et al. 2015), and the eventual transition from wood to coal took several decades to
unfold. Starting in the United Kingdom (UK), the price of coal declined and eventually sank
below that of wood, as a result of which coal was substituted for wood in residential heating
and cooking (Allen 2013). The increasing use of coal in households then drove investments in
the transport and production of coal, which lowered costs further and led to breakthrough
innovations in energy conversion technologies (ibid.). With James Watt’s development of the
steam engine and the extensive expansion of railroads, the industrial revolution of the 18th and
19th century kicked off. Coal not only fuelled critical improvements to steam power, but
supplied energy to all end-use sectors in the UK and beyond (Littlecott 2015).
The first steam-powered station was built in London in 1882, followed by a second unit starting
operation in New York City later that year (Drax 2016). These first coal-fired electric units
mainly powered lamps, and coal power played a major role in the gradual electrification
throughout the 20th century (Agora Energiewende 2016). The conversion of thermal energy into
mechanical energy also facilitated the establishment of the metallurgical industry. Due to the
low price of coal, high energy densities compared to wood, and commonly local deposits (ibid.),
coal remained the dominant electricity and heat provider in many European and North
CE
UeT
DC
olle
ctio
n
Literature Review
9
American countries up to the second half of the 20th century. In 1950, coal’s share in global
primary energy production was around 60% (Merrick 1984). During that time, coal
consumption was dominated by direct use (60%) and coke manufacturing (20%), and to a lesser
extent by power generation (15%) (ibid.).
The 1960s experienced a rapid deployment of natural gas and crude oil, which complemented
coal in satisfying steadily rising energy demand (Merrick 1984). Originally perceived as the
“black gold” from Montana to Poland (Chadwick 1973; Kuchler and Bridge 2018), coal lost
importance in its former strongholds. With the discovery of seemingly inexhaustible natural gas
and oil fields, as well as the eventual construction of nuclear reactors on a large scale, these
energy sources successively replaced coal in both electricity and heat supply, as well as in direct
use in the industrial, residential, and transport sector (Agora Energiewende 2016). The
dissolution of the Soviet Union in 1991 and the corresponding shift to a market economy in
many Eastern European countries (Pollitt 2012), as well as the Thatcher-Reagan period of
market liberalisation led to increased competition among energy utilities and major efficiency
gains, which substantially lowered the demand for coal. Meanwhile, many European economies
shifted away from heavy manufacturing and energy-intensive industries towards service-
oriented economies (Bloomberg 2016). In 1990, coal accounted for almost 40% of Europe’s
power supply (Alves Dias et al. 2018) but has since then declined by over 40% from 5,289
TWh to 3,055 TWh in 2015 (ibid.).
In China, coal was the main source of energy for power generation, railway transport, industry,
and residential heating for many decades (Thomson 2003). Since 1989, China is the largest
producer and consumer of coal. The stepwise introduction of oil, gas, hydro and later nuclear
power was rather slow due to limited natural gas and oil resources, as well as energy security
concerns. Additionally, a comprehensive fuel switch would have required substantial
investments in new technologies and infrastructures, while revenues from the export of oil were
heavily relied upon (ibid.). In the 1990s, China ramped up its effort in diversifying the energy
mix and now deploys renewables on a considerable scale (Tianjie 2017).
While the share of coal in global energy supply was reduced by various external pressures,
absolute coal use still demonstrated continuous growth in almost all world regions over the past
40 year and has only slowed down recently (Edenhofer et al. 2018). In 2015, the global use of
coal dropped for the first time (-2.3%), which led Greenpeace (2015) to announce, “coal’s
terminal decline”. According to their report, this decline was mainly driven by a lower than
CE
UeT
DC
olle
ctio
n
Literature Review
10
expected growth of coal use in China, brought about by economic restructuring, stringent air
pollution regulations, and the rise of the renewable energy industry. Similarly, the United States
(US) experienced a substantial drop in coal use as a response to public opposition, unfavourable
economics, and increased environmental regulation (Greenpeace 2015). Additionally, the shale
gas boom rendered many coal operations unprofitable (IEA 2019a), and climate policies in
several states accelerated the long-term structural decline (Wamsted et al. 2019). The low
profitability of the coal sector was likely “the most critical factor in coal plants’ shutdown
decision-making” in the US (Cui et al. 2020). In most PPCA countries, the transition away from
coal is accompanied by the halt of governmental subsidies supporting the coal sector (Alves
Dias et al. 2018), pollution controls (Wynn and Coghe 2017), declining efficiencies, rising
operating costs (Wamsted et al. 2019), and either stagnating or declining electricity demand
(Fleischman et al. 2013).
However, in 2018, Edenhofer et al. cautioned against Greenpeace’ optimism and argued that
“reports of coal’s terminal decline may be exaggerated” (p. 1). And indeed, after three years of
decline, coal use increased again by 1.1% from 2017 to 2018 (IEA 2019a). This “coal
renaissance” (Steckel et al. 2015) was mainly driven by developing countries in which total
electricity consumption dramatically increased as a result of growing per-capita consumption
and overall population growth (Caldecott et al. 2017). Whilst China and India account for a
substantial share in coal firing (57% of global electricity generation from coal, IEA 2020), they
are representative cases rather than sole drivers (Steckel et al. 2015). In India, coal use grew by
8.2% annually between 2005 and 2015, while China witnessed an annual increase of 6.5%
(Spencer et al. 2018). As extensive infrastructural projects are in the pipeline in China, India,
and Southeast Asia, total electricity demand and coal consumption is expected to increase over
the next years (IEA 2019a).
2.1.2 Economic Relevance
Despite vast empirical evidence, there is no consensus on whether a cause-effect relationship
from coal use to gross domestic product (GDP) exists (Li and Leung 2012; Wolde-Rufael 2010;
Kumar and Shahbaz 2012; Liu et al. 2009). Results of such analyses could be indicative of
whether the decline of coal industries, or the active enforcement of phase-out measures, has
negative effects on countries’ economies and wealth (Wolde-Rufael 2010; Liu et al. 2009), but
are thus far inconclusive. Such discussions, however, are somewhat misleading, as especially
coal mining but also coal combustion are regionally concentrated - making respective regional
CE
UeT
DC
olle
ctio
n
Literature Review
11
economies disproportionally affected by coal sector developments (Johnstone and Hielscher
2017).
Since 2000, the production of coal has doubled, as mechanization and technological progress
have improved overall productivity (Ritchie and Dowlatabadi 2017). However, available coal
reserves, which are recoverable coal resources, are only a fraction of geological coal classified
resources (ibid.). Due to increasing extraction costs, coal mines around the world have struggled
to remain profitable since the 1980s, but fewer mines closed as rational economic decision-
making would suggest (Carbon Tracker 2019).
The regional concentration of coal mining makes coal an important regional employer (Spencer
et al. 2018). In India, for example, 1 million people are employed in the coal sector, and the
income from coal mining accounts for up to 50% of total earnings for a number of states (ibid.)
The majority of mining employees are unskilled or semi-skilled workers with limited alternative
employment options (ibid.). This, and the century-long history of coal mining has equipped
trade unions with substantial negotiating power and leverage on regional and national
policymakers (Bernaciak and Lis 2017; Lis 2014). It is partly due to their influence that
vertically integrated utilities cross-subsidise unprofitable mining operations, and governments
support the mining industry with generous subsidies (Oei et al. 2019).
The coal industry has played a pivotal role in creating region’s cultural identities that are
inseparable from coal mining activities (Bell and York 2010). Creating such social and
economic identification prevents coal regions from diversifying their economies and searching
for novel ways of wealth generation and employment (Johnstone and Hielscher 2017; Oei et al.
2019; Andrews-Speed et al. 2005). Economic dependencies and job loss threats make their way
down the supply chain, affecting a variety of local businesses (Johnstone and Hielscher 2017).
and transport networks for domestic and international trade (Steckel et al. 2015): About 90%
of internationally traded coal is currently transported by ship, while domestic coal trade relies
on rail transport (Caldecott et al. 2016). Accordingly, the state and development of the coal
sectors has economic and organisational impacts on shipping companies, ports, railway
operators, and manufacturers of infrastructure components (ibid.). And finally, for many coal
exporting countries, such as Columbia, Indonesia, Mongolia, or South Africa, the export of coal
is an important foreign currency earner (Spencer et al. 2018).
It remains important to mention that coal mining and combustion are responsible for
considerable economic loss, for example through air pollution and associated health problems
CE
UeT
DC
olle
ctio
n
Literature Review
12
(Greenpeace 2015; Cui et al. 2019), acid rain that constrains agricultural production (You and
Xu 2010), land degradation, and water stress (Caldecott et al. 2017). A recent study by the
Potsdam Institute for Climate Impact Research (PIK) finds that the health and biodiversity
damage reductions of a global coal phase-out considerably outweigh the economic costs in form
of reduced GDP growth and energy system investments (Rauner et al. 2020).
2.1.3 Electricity System Integration
The majority of coal extracted today is used in power generation and to a lesser extent in iron
and steel production and in the cement industry (Rocha et al. 2016). Unlike in industry, vast
substitution opportunities exist for coal combustion in electricity generation, such as renewable
energy sources, nuclear power, and as a short-term substitution option natural gas. This would
not only tackle global GHG emissions efficiently and cost-effectively, but also yield a number
of co-benefits in public health and environmental protection (ibid.).
Traditionally, Europe’s power market predominantly consisted of national and regional
markets, with vertically integrated utilities and regional monopolies (Caldecott et al. 2017).
Since 1996, regulatory changes set out to increase competition, eradicate inefficiencies, and
establish an EU-wide interconnected electricity market (ibid.). Today, in most European
countries and other developed economies, electricity is dispatched according to a merit order
system. In such systems, utilities offer their electricity at marginal cost, which is the cost
incurred from producing one additional unit of energy, i.e. one additional kWh. Then, electricity
is purchased from the lowest bidder first, then the second lowest, and so on, until demand is
covered (DIW Berlin et al. 2019). The integration of renewables has (due to near-zero variable
costs) substantially lowered wholesale electricity prices, and reduces revenues for all generators
alike (Edmunds et al. 2015). Yet, especially the economic situation of generators with large
sunk costs, such as coal plants, is dire (ibid.).
In Germany’s merit order, coal generally ranks between PV, offshore and onshore wind,
biomass, hydropower, and nuclear on the lower, and natural gas and oil on the higher end (DIW
Berlin et al. 2019). The particular ordering of energy sources and technologies varies between
countries, but generally demonstrates a similar pattern, where renewables are cheaper, and other
fossil fuels more expensive. However, after the drastic collapse of oil prices in early 2020, coal
is now the most expensive (per barrel of oil equivalent) fossil fuel in the US (Bloomberg 2020),
which is likely to affect the price with which electricity from coal power stations is offered on
the market. Particularly in countries with low gas prices and increasing shares of renewables,
CE
UeT
DC
olle
ctio
n
Literature Review
13
coal generation with high variable costs is gradually displaced, leading to the underutilization
of coal power plants (Edmunds et al. 2015). A rising share of renewable energy in electricity
supply raises balancing and electric capacity requirements, but the latter also depend on the
size, interconnectedness, and flexibility of the electricity system (ibid.).
Many countries (including Australia, several US states, the UK, and various EU countries) have
implemented capacity mechanisms (Schlandt 2015), which greatly vary in design but generally
entail payments to utilities for providing secure generational capacity - rather than actual
electricity delivered - to prevent supply shortages (Caldecott et al. 2017). Capacity reserves, a
common type of capacity instruments, are perceived as alternatives to plant closures and
attractive options to utilities as incurred costs can be passed onto consumers via electricity
prices (DIW Berlin et al. 2019). There exist many disjointed national or regional initiatives,
which are not only incompatible with each other, but also incentivise the prolonged use of
inefficient plants (Caldecott et al. 2017). Additionally, capacity mechanisms are unreasonable
from a technical perspective, as coal capacity reserves are particularly expensive because coal
plants have long ramping up times and offer no solution to temporary shortfalls (IZES 2016 in
DIW Berlin et al. 2019).
In many Asian countries, such as China, the electricity price is still (partly) regulated, and state-
owned electric utilities shielded from considerable competition (Zhao et al. 2017). When the
price of coal in recent years declined, this was not reflected in the electricity price and led to a
distortedly high competitiveness of coal plants (Spencer et al. 2018). Electricity prices in China
are set by provincial regulators, which artificially lowers investment risks and guarantees stable
revenues for plant operators (Caldecott et al. 2017). Additionally, electric output is determined
by guaranteed operating hours (Kahrl and Wang 2015). These provisions and the nature of a
central planning system result in slow reaction times to changes in the market environment
(ibid.) and have provided favourable operating conditions for coal plants. In India, the levelized
costs (which are total costs; composed of capital costs, fixed costs, and variable costs) of solar
energy have fallen below the variable costs of most coal plants, yet, this has not translated to
an immediate substitution of coal for solar (Shrimali 2020). This has been attributed to a
malfunctioning electricity market, where regulated tariff contracts dominate, and dispatch takes
place at the state level (ibid.).
CE
UeT
DC
olle
ctio
n
Literature Review
14
2.1.4 Energy and Climate Policies
Policies aiming at reducing coal combustion and limiting its environmental impact vary greatly
between countries and over time. As a general rule, Edenhofer et al. (2018) recommend that
governmental measures should reduce political uncertainty and demonstrate commitment to the
long-term temperature targets. While a combination of different policies may be desirable to
provide utilities with some flexibility in timing and managing their losses (Benn et al. 2018),
restrictive policies should be evaluated carefully because they can result in significant
distributional impacts (Steckel et al. 2015).
Specific measures include performance benchmarks, and emissions limits and standards
(Pfeiffer et al. 2018; Cui et al. 2020), which have been implemented in over 20 countries as
well as the entire European Union. In the EU, the Large Combustion Plants Directive (LCPD)
of 2008 set limits to SO2, NOx, and particulate matter emissions, and was later replaced by the
overarching Industrial Emissions Directive (IED), setting even stricter limits (Drax 2016). The
Indian government mandated all new coal plants to use the more efficient supercritical
technology (Spencer et al. 2018) and the majority of global coal plants are required to be
equipped with pollution control technologies (Edenhofer et al. 2018). China has imposed
national limits on consumption as well as region-specific consumption reduction targets
(Spencer et al. 2018), while also granting plants with higher efficiencies grid priority in ten
Chinese provinces (NDRC 2007 in Caldecott et al. 2017).
Carbon prices, imposed through carbon taxes or trading schemes, ought to render coal power
production uncompetitive in comparison to low-carbon alternatives, but are by themselves often
insufficient in replacing coal by natural gas (Caldecott et al. 2015) or incentivising a low-carbon
transition (Pfeiffer et al. 2016). Removing alternative revenue sources such as capacity
payments, or introducing governmental take-overs and write-offs have been proposed as more
drastic measures of depriving coal its market base (Benn et al. 2018). Finally, some scholars
argue that providing governmental support to renewables, for example via de-risking
instruments, research and development (R&D) support, and subsidies, will enact the needed
regime shift, while others claim that resulting technological improvements and declining costs
are likely to be “too little, too late” to achieve the Paris goals (Edenhofer et al. 2018).
Coal sector policies that do not target the immediate operation of coal plants are less common.
They include coal moratoriums on new coal mines (Pfeiffer et al. 2018; Steckel et al. 2015),
divestment activities by development banks (Steffen and Schmidt 2019), licensing requirements
CE
UeT
DC
olle
ctio
n
Literature Review
15
for new power plants, or denying high emitters lifetime extensions (Pfeiffer et al. 2018). More
indirectly, the liberalisation of fuel and electricity markets exerts substantial pressure on coal
mining and combustion activities (Spencer et al. 2018). The downward trend of natural gas and
renewable prices renders coal production increasingly unprofitable (Benn et al. 2018), which
can only be cushioned by national governments to a limited extent. Additionally, energy
efficiency measures in the end use sectors reduce final electricity and thus coal demand. Citizen
opposition to coal mining and firing also has no immediate effect on their day-to-day operations
– with a few exceptions in which the supply infrastructure was interrupted (Welt.de 2019; The
Guardian 2019) – but a comprehensive shift of electricity consumers to ‘green’ competitors
leads to the erosion of the consumer base and reduces the leverage on policymakers (Benn et
al. 2018).
2.2 Energy System Change
The following sections provide a brief overview of popular concepts and theoretical
frameworks for studying, conceptualising, and understanding transitions in general and energy
system change in particular. Because there is no single transition theory that adequately captures
the complexity and diversity of energy transitions (Cherp et al. 2018), insights from multiple
disciplines will be integrated and structured according to the different stages of a technology’s
life; namely its rise, stagnation/persistence, and decline. Finally, empirical evidence from past
energy transitions mainly regarding their scope and speed will be presented.
Some theoretical contributions originate from research on energy transitions specifically, while
others stem from more general observations on technological change. In all following sections,
it will be assumed that these fully apply to energy systems. Further, some scholars refer to
individual technologies while others base their studies on entire industries or energy systems.
In order to integrate all findings, I assume that they equally apply to each other irrespective of
their scope or depth. Finally, one intuitively associates the rise of energy technologies with the
deployment of renewables, while relating decline to coal or nuclear. Even though many scholars
also follow this distinction, there is no fundamental rule dictating this.
2.2.1 The Rise of Energy Technologies
2.2.1.1 Innovation Studies and Technology Diffusion
Energy transitions typically begin with the emergence and diffusion of a new technology
(Markard 2018). The diffusion of an innovation is understood as the “process by which an
CE
UeT
DC
olle
ctio
n
Literature Review
16
innovation is communicated through certain channels over time among the members of a social
system” (Rao and Kishore 2010, 1070). Innovations themselves are the manifestations of
technological progress, which in turn is brought about by societal needs and pressures (Ayres
1988). The process of technology diffusion is composed of distinct phases, such as the pre-
development, take-off, acceleration, and stabilisation phase (van der Brugge and van Raak
2007), or the formative, upscaling and growth phase (Wilson et al. 2013).
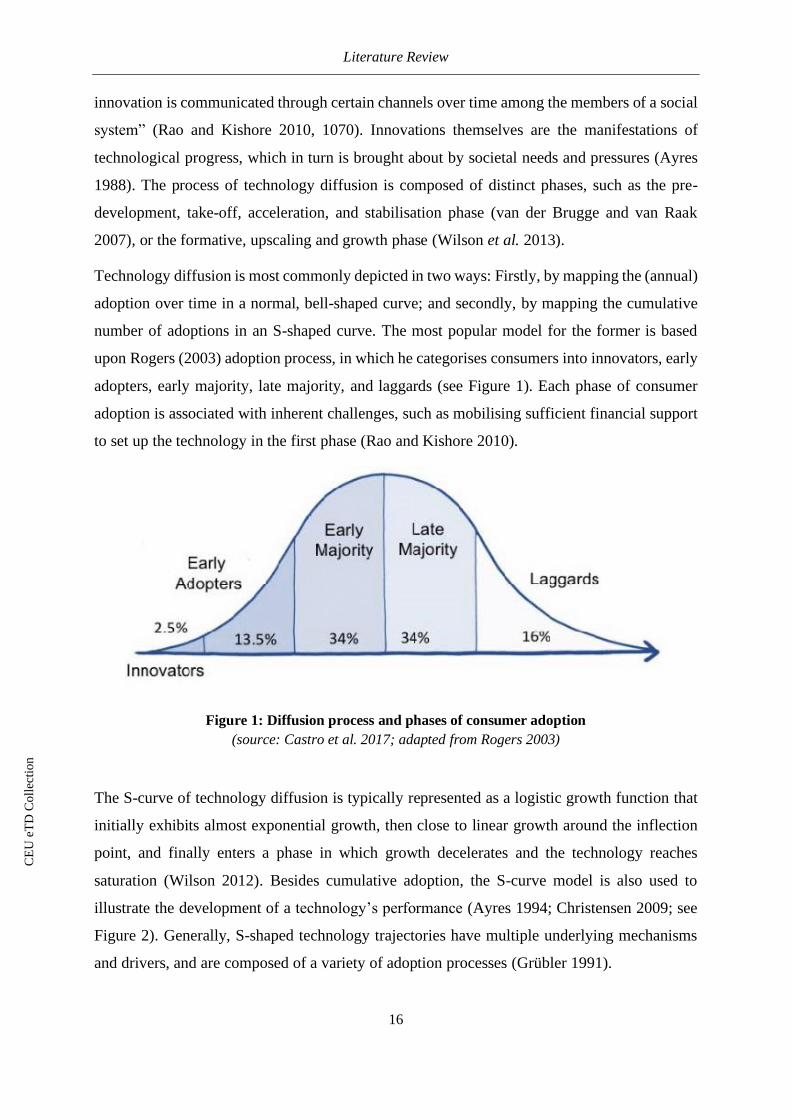
Technology diffusion is most commonly depicted in two ways: Firstly, by mapping the (annual)
adoption over time in a normal, bell-shaped curve; and secondly, by mapping the cumulative
number of adoptions in an S-shaped curve. The most popular model for the former is based
upon Rogers (2003) adoption process, in which he categorises consumers into innovators, early
adopters, early majority, late majority, and laggards (see Figure 1). Each phase of consumer
adoption is associated with inherent challenges, such as mobilising sufficient financial support
to set up the technology in the first phase (Rao and Kishore 2010).
Figure 1: Diffusion process and phases of consumer adoption
(source: Castro et al. 2017; adapted from Rogers 2003)
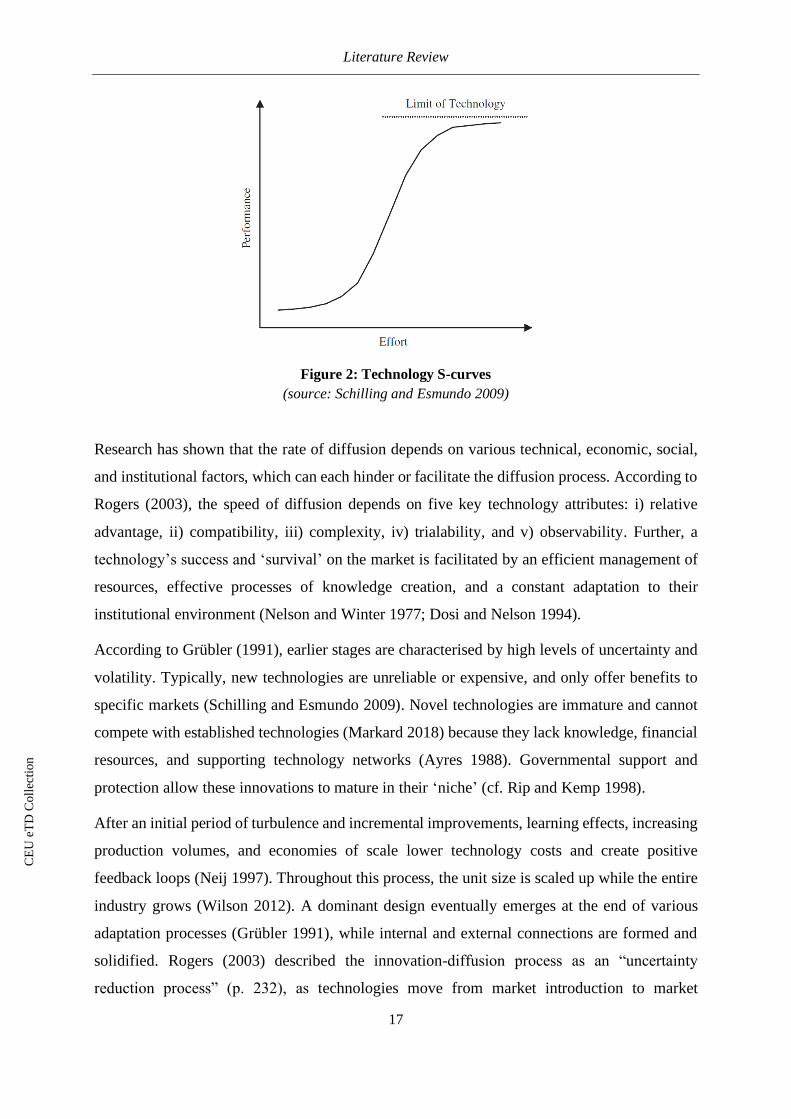
The S-curve of technology diffusion is typically represented as a logistic growth function that
initially exhibits almost exponential growth, then close to linear growth around the inflection
point, and finally enters a phase in which growth decelerates and the technology reaches
saturation (Wilson 2012). Besides cumulative adoption, the S-curve model is also used to
illustrate the development of a technology’s performance (Ayres 1994; Christensen 2009; see
Figure 2). Generally, S-shaped technology trajectories have multiple underlying mechanisms
and drivers, and are composed of a variety of adoption processes (Grübler 1991).
CE
UeT
DC
olle
ctio
n
Literature Review
17
Figure 2: Technology S-curves
(source: Schilling and Esmundo 2009)
Research has shown that the rate of diffusion depends on various technical, economic, social,
and institutional factors, which can each hinder or facilitate the diffusion process. According to
Rogers (2003), the speed of diffusion depends on five key technology attributes: i) relative
advantage, ii) compatibility, iii) complexity, iv) trialability, and v) observability. Further, a
technology’s success and ‘survival’ on the market is facilitated by an efficient management of
resources, effective processes of knowledge creation, and a constant adaptation to their
institutional environment (Nelson and Winter 1977; Dosi and Nelson 1994).
According to Grübler (1991), earlier stages are characterised by high levels of uncertainty and
volatility. Typically, new technologies are unreliable or expensive, and only offer benefits to
specific markets (Schilling and Esmundo 2009). Novel technologies are immature and cannot
compete with established technologies (Markard 2018) because they lack knowledge, financial
resources, and supporting technology networks (Ayres 1988). Governmental support and
protection allow these innovations to mature in their ‘niche’ (cf. Rip and Kemp 1998).
After an initial period of turbulence and incremental improvements, learning effects, increasing
production volumes, and economies of scale lower technology costs and create positive
feedback loops (Neij 1997). Throughout this process, the unit size is scaled up while the entire
industry grows (Wilson 2012). A dominant design eventually emerges at the end of various
adaptation processes (Grübler 1991), while internal and external connections are formed and
solidified. Rogers (2003) described the innovation-diffusion process as an “uncertainty
reduction process” (p. 232), as technologies move from market introduction to market
CE
UeT
DC
olle
ctio
n
Literature Review
18
domination. For a long while, the emergence of a novel technology does not dramatically affect
the strategic and every-day activities of incumbents, who in turn ignore or mildly oppose their
emerging competitors (Markard 2018). According to the Multi-Level Perspective (MLP), one
of the most popular frameworks for studying energy transitions, niche innovations break
through once a ‘window of opportunity’ opens up (Verbong and Geels 2007) after which they
replace incumbents to form a new ‘regime’ (Kemp et al. 1998).
Eventually, adverse social and environmental effects accumulate and create negative feedback
mechanisms (Grübler 1991). These slow down the growth of a technology by which it reaches
its inherent limit, or saturation point (Wilson 2012). While investments in early phases lead to
substantial increases in performance, equivalent investments made now harvest diminishing
returns (Ayres 1988; Schilling and Esmundo 2009). In this “era of incremental change”
(Anderson and Tushman 1990, 606), companies focus on refining their core competencies but
refrain from developing alternative ideas. This makes them vulnerable to changes in their
external environment and increasingly unable to respond to pressures (Henderson and Clark
1990). They are ‘locked-in’ or ‘too refined to innovate’ (Sundstrom and Allen 2019; Fath et al.
2015) but able to delay their decline and replacement through making incremental changes.
2.2.1.2 Temporal and Spatial Diffusion
Typically, innovations originate in a ‘core’ market, from which they gradually spread to the
‘rim’ (early adopters) and eventually to the ‘periphery’ (late adopters) (Grubler 2012). Due to
spill-over effects and the ability to build upon existing knowledge (Grubler 1991), energy
technologies diffuse faster in the periphery than in the core (Grubler 2012). They do not,
however, reach the same level of market penetration. The diffusion and maturation of entire
energy systems, as opposed to individual technologies, generally takes longer due to the
embeddedness in institutions, infrastructures, and existing knowledge (Grubler et al. 1999).
Wilson (2012), who splits the entire diffusion process into the formative, upscaling, and growth
phase, argues that the formative phase in the periphery is shorter or even omitted, but the
upscaling of any technology takes place over a similar timeframe in core and periphery. This is
because “[l]ocal knowledge and institutions are needed to develop, manufacture (or import),
adapt, install, and above all, use a new energy technology effectively” (Wilson 2012, 92).
Consequently, global technology diffusion relies on knowledge, hardware, and finance, but
most importantly the capacity to absorb new technologies and adapt them to suit local
conditions (Nordensvard et al. 2018).
CE
UeT
DC
olle
ctio
n
Literature Review
19
Studies on the diffusion of renewable energy (RE) technologies are numerous (Jacobsson and
Johnson 2000; Hekkert et al. 2007; Bergek et al. 2008; Schot and Geels 2008; Loorbach and
Raak 2006; Caniëls and Romijn 2008; Geels 2005). But interestingly, this kind of analysis does
not exist in comparable volume in the case of fossil fuel technologies. One exception to this is
Wilson et al. (2013), who find a consistent relationship between cumulative installed capacity
(extent) and how long this growth takes (duration) for several fossil fuel-based technologies.
The S-shaped relationship holds true for both energy supply and end-use technologies
(including natural gas, nuclear, coal, cars, refineries), as well as for all world regions (including
the core, rim, and periphery).
2.2.2 The Stagnation and Persistence of Energy Technologies
It is not uncommon for technologies to retain market dominance over long time periods despite
being inferior to alternatives (Arthur 1989). The two main reasons behind this are the effects of
lock-in and path dependency, for which research from the fields of evolutionary economics and
neo-institutional theory provide key insights. Companies’ activities are guided by
‘technological regimes’ (Nelson and Winter 1977), which are techno-economic conditions that
channel a firm’s everyday activities and long-term strategies into a particular direction, thereby
limiting their scope of actions and introducing path dependencies. This effect is aggravated by
the formation of technology clusters, which are comprised of different technologies that benefit
from each other’s existence and provide mutual support. This shields them from external
pressures and enables them to guard their market position from competitive new clusters,
effectively leading to a ‘lock-in’ of the dominant design (Grubler et al. 1999).
Firms in an industry are further influenced by shared beliefs and mindsets, as well as common
norms and identities (Dutton and Dukerich 1991). This transforms former technological
regimes into socio-technical ones and brings the interplay between agency and institutions into
the picture (Lawrence et al. 2009). Socio-technical regimes are “mainstream, highly
institutionalised way[s] of currently realising societal functions” (Smith et al. 2010, 443) and a
key cause of lock-in. The presence of a uniform mission and high internal commitment to
certain mental maps leads to cognitive inertia and a reluctance to reorient or restructure once
external pressures arise (Turnheim and Geels 2012). As a result, the activities by firms are
mainly incremental rather than architectural (Markard et al. 2020). Further, in this time of
temporary equilibrium or plateau, systems are characterised by low overall diversity (Fath et
al. 2015), while the concentration of power is high (ibid.; Markard et al. 2020).
CE
UeT
DC
olle
ctio
n
Literature Review
20
According to Scott (2008), there are three institutional pillars: regulative institutional elements,
normative elements, and cultural-cognitive elements. Cultural-cognitive elements are the most
difficult to change as they are deeply embedded in societies. Giddens' (1986) structuration
theory illustrates that actors are constrained by their respective socio-political structures, but
that they also play a key role in shaping them (Lawrence et al. 2006). When actors relate to the
existing structures, which they perceive as normality, they continuously reproduce and
strengthen existing institutions (Giddens 1986).
Gregory C. Unruh (2000) applies these principles to an energy context; arguing that lock-in is
brought about by interactions between a technological system and state institutions that
manifest themselves in laws and regulations. Dominant energy systems are advantaged as they
rely on already available infrastructures, perfectly align with legal and economic systems, and
resonate with organisational structures and user-behaviour (Clausen and Fichter 2016; Smith
and Stirling 2010). Energy regimes are reproduced by a variety of actions, including large
investment decisions of infrastructural projects as well as routine decisions by managers or end-
users (Smith and Stirling 2010). Meadowcroft (2009) further highlights that incumbent actors
have established a large network of partners over time, which can include close ties to
policymakers (Heyen 2017) and unlocks reinforcing mechanisms (Geels 2002).
2.2.3 The Decline of Energy Technologies
The majority of energy transition research is concerned with the emergence of (sustainable)
energy technologies, while the destabilisation and decline of incumbent energy technologies
such as fossil fuels and nuclear power is understudied (Markard et al. 2020; Heyen 2017) and
often expected to happen simultaneously (Turnheim and Geels 2012). Decline has only been
studied on a case study basis for specific technologies in specific regions (Markard et al. 2020).
Critics of this ‘innovation bias’ (Hermwille 2016; Geels and Schot 2007) have highlighted that
conceptually, energy transitions are ‘phase-in / phase-out’ processes (Bromley 2016) and have
unfolded accordingly in the past.
2.2.3.1 Regime Destabilisation and Exnovation
Turnheim and Geels (2012) define regime destabilisation as a process in which the reproduction
of key regime elements is weakened. There are several drivers behind such destabilisation,
some of which are political and governed while others are not. Following preceding
explanations, industry decline can be caused by limited access to resources, economic
CE
UeT
DC
olle
ctio
n
Literature Review
21
difficulties (Dosi and Nelson 1994), and eroding public legitimacy (Lounsbury and Glynn 2001;
Powell 1991), but also result from weakened commitment within industry. At the same time,
novel technologies pose a threat to the business model of incumbents, institutional structures
change more profoundly than before, and negative externalities accumulate (Markard 2018;
Markard et al. 2020). Industry decline is aggravated by delayed, inappropriate, or insufficient
responses by industry actors (Turnheim and Geels 2012). The likelihood of such decline is
higher in the case of various external pressures as industries cannot address multiple pressures
simultaneously, especially when they had not been anticipated (ibid.; Geels 2018).
Destabilisation is a longitudinal process that entails elements of coordination and chaos;
eventually leading to industry decline or reconfiguration (Turnheim and Geels 2012). When
comparing dynamics of decline with those of the emergence of a technology, fewer rules of
thumb and trends have been identified. According to Markard et al. (2020), processes of decline
may be similar (e.g. intensification of knowledge generation), inverted (losing as opposed to
gaining public legitimacy), or simply different. The decline of a technology necessarily affects
networks and institutions beyond core firms, which can lead to a “vicious circle of adverse
developments” (ibid., 2). If decline is inevitable, incumbent firms tend to ‘milk their assets’ and
call for governmental compensation payments.
The concept of ‘exnovation’ – as the antagonist to innovation – is closely related to that of
destabilisation but has a normative, intentional, and directional character. Exnovation “entails
actions to disrupt institutional structures in ways that serve to unseat the ideas associated with
maintaining those institutions, to allow for their replacement by new ones” (Davidson 2019,
255). Exnovation is often perceived as a process through which a certain technology is phased
out completely (Heyen 2017), but this must not be the case (Antes et al. 2012). A prominent
example is the politically intended phase-out of conventional light bulbs. There exists a large
toolbox of destabilisation and exnovation instruments, such as the phase-out of governmental
subsidies, divestment by public and private financing institutions, regulatory bans, withdrawals
of operating permits, limits, standards, taxes, emission trading schemes, or tariffs (Heyen 2017;
Rogge and Reichardt 2016; Pearson and Foxon 2012).
To counteract these, firms-in-an-industry make use of a variety of strategies that hinder or slow
down their decline (Turnheim and Geels 2012). These strategies range from defensive
strategies, such as incremental innovation or early diversification, to more confrontational
strategies, such as framing and storytelling, discrediting opponents, indulging in symbolic
CE
UeT
DC
olle
ctio
n
Literature Review
22
action, or even bribery and unconstitutional contributions to political parties (Geels 2014;
Hillman and Hitt 1999). Additional barriers to the decline of industries are the sheer number
and strength of internal and external connections (Heyen 2017), the regional concentration and
economic relevance of associated operations (Johnstone and Hielscher 2017; Spencer et al.
2018), and governmental support in the form of subsidies or exceptions from laws and
regulations. Another important finding is that decline is not automatically activated once critical
thresholds, such as the loss of cost-competitiveness, are reached (Grubler et al. 2016; Wilson
et al. 2013). This is mainly due to institutional inertia, infrastructurally-induced path
dependencies, incomplete information and high uncertainties (Metcalfe 1994, see section
2.2.2).
2.2.3.2 Temporal and Spatial Decline
Spatial decline – as opposed to spatial diffusion – is a widely neglected topic within energy
transition research. An exception to this is Grubler (2012), who investigated historic energy
transitions in Europe and found the decline of an energy technology to be “an inverted mirror
image of the previous core-diffusion geography” (p. 13), meaning that late adopters are also the
first ones to abandon the technology at hand. He bases his observations on the market share of
coal in primary energy demand, which early peaked in the UK (the ‘core’), and was later
adopted, but also earlier abandoned in Spain, Portugal, or Italy (the ‘rim’).
Another example is a study by Markard et al. (2020), who investigate decline in nuclear power
by analysing the development of annual electricity output, the number and concentration of
reactor types, and decisions by nation states to ban new or restrict existing operations. Apart
from several case studies of specific energy technologies in specific countries, no substantial
research has – to my knowledge – been directed at the rates, timescales, and spatial patterns of
energy technology decline.
2.2.4 Empirical Evidence from Past Energy Transitions
Considerable disagreement about the very definition of energy transitions as well as their scope
and agenda exists (Greenpeace 1993; Fabra et al. 2015; Grubler 2012; Hermwille 2016;
Meadowcroft 2009; Markard et al. 2012). For the remainder of this thesis, I draw upon Fouquet
and Pearson's (2012) comparatively broad definition of energy transitions as “the switch from
an economic system dependent on one or a series of energy sources and technologies to another”
CE
UeT
DC
olle
ctio
n
Literature Review
23
(p.1), as the depth and transformational character of energy system change is irrespective of its
contribution towards sustainability (Cherp et al. 2018).
Energy transitions differ across time periods and geographies, unfold according to their specific
contexts, and provide ample room for assertions regarding their respective causes and effects.
However, a number of communalities, such as high complexities, multi-decadal time scales,
and non-linear developments, have been identified (Wiek and Lang 2016; Fabra et al. 2015).
Influenced by “a myriad of drivers” (Child and Breyer 2017, 11) and deeply embedded in socio-
economic structures (Turnheim and Geels 2012), energy transitions have proven to be difficult
to govern (Laes et al. 2014). Further, a global energy transition will be the result of multiple
country-specific decarbonisation pathways, that spill over and influence each other (Kern and
Rogge 2016).
Fouquet and Pearson (2012) argue that most energy transitions have taken place over a time
period of 40 years. Grubler (2012) posits that it took 130 years for coal to replace traditional
renewables in primary energy supply in Europe, and then another 80 years for coal to be
replaced by oil, natural gas, and electricity. After Sovacool (2016) claimed that recent energy
transitions unfolded substantially faster than in the past, a heated scholarly debate broke out (cf.
Grubler et al. 2016; Smil 2016; Kern and Rogge 2016; Fouquet 2016; Sovacool and Geels
2016). What has been learned from this exchange, is that the speed of transitions depends on
the complexity of energy systems involved, as well as the geographic area in which they occur.
Generally, transitions in energy supply rather than end-use (Grubler 2012), those involving
advanced technologies, as well as those requiring large capital investments and lacking
adequate resources take longer to unfold (Bromley 2016).
Kern and Rogge (2016) believe that future transitions could well unfold faster than in the past,
because the momentum behind ongoing low-carbon transitions is unprecedented, and energy
systems are no longer dominated by just one energy carrier. Further, energy systems have
become more interconnected, involve a rising number of diverse actors, and encompass
multiple dynamic feedback mechanisms – all of which can potentially accelerate but also delay
a transition (ibid.). With these considerations in mind, it is reasonable to assume that “[r]ates of
change are slow, but not always” (Grubler 2012, 11).
CE
UeT
DC
olle
ctio
n
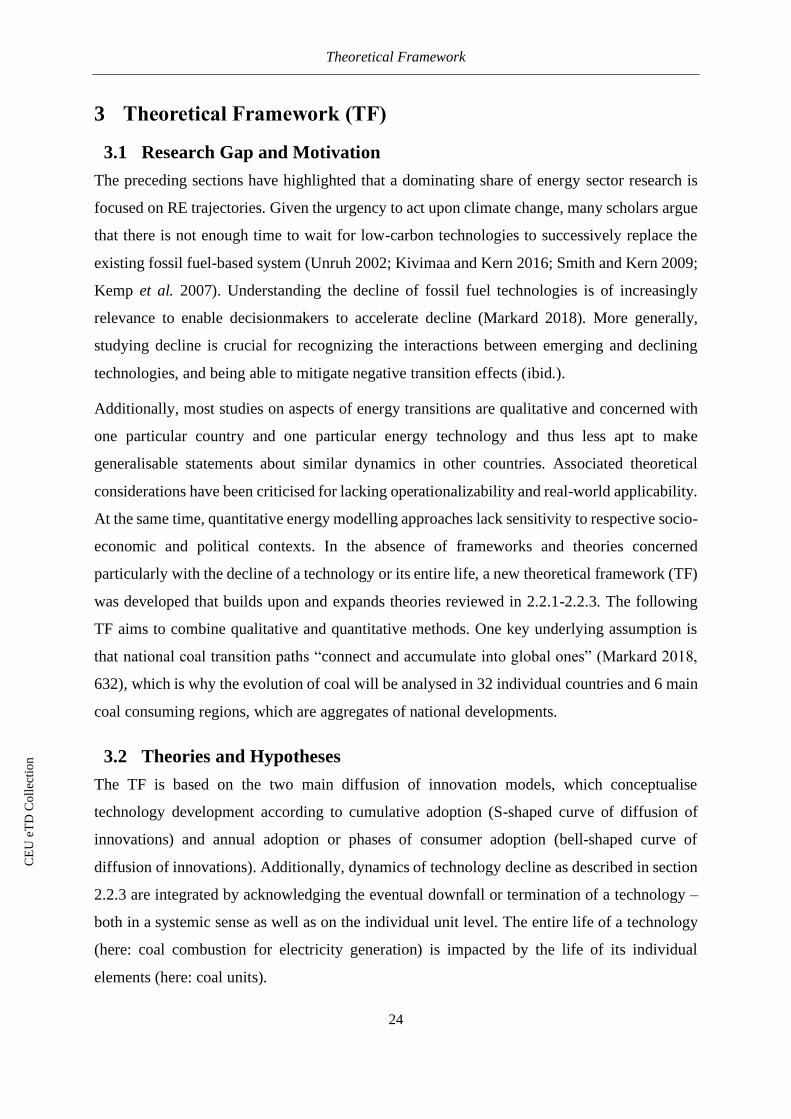
Theoretical Framework
24
3 Theoretical Framework (TF)
3.1 Research Gap and Motivation
The preceding sections have highlighted that a dominating share of energy sector research is
focused on RE trajectories. Given the urgency to act upon climate change, many scholars argue
that there is not enough time to wait for low-carbon technologies to successively replace the
existing fossil fuel-based system (Unruh 2002; Kivimaa and Kern 2016; Smith and Kern 2009;
Kemp et al. 2007). Understanding the decline of fossil fuel technologies is of increasingly
relevance to enable decisionmakers to accelerate decline (Markard 2018). More generally,
studying decline is crucial for recognizing the interactions between emerging and declining
technologies, and being able to mitigate negative transition effects (ibid.).
Additionally, most studies on aspects of energy transitions are qualitative and concerned with
one particular country and one particular energy technology and thus less apt to make
generalisable statements about similar dynamics in other countries. Associated theoretical
considerations have been criticised for lacking operationalizability and real-world applicability.
At the same time, quantitative energy modelling approaches lack sensitivity to respective socio-
economic and political contexts. In the absence of frameworks and theories concerned
particularly with the decline of a technology or its entire life, a new theoretical framework (TF)
was developed that builds upon and expands theories reviewed in 2.2.1-2.2.3. The following
TF aims to combine qualitative and quantitative methods. One key underlying assumption is
that national coal transition paths “connect and accumulate into global ones” (Markard 2018,
632), which is why the evolution of coal will be analysed in 32 individual countries and 6 main
coal consuming regions, which are aggregates of national developments.
3.2 Theories and Hypotheses
The TF is based on the two main diffusion of innovation models, which conceptualise
technology development according to cumulative adoption (S-shaped curve of diffusion of
innovations) and annual adoption or phases of consumer adoption (bell-shaped curve of
diffusion of innovations). Additionally, dynamics of technology decline as described in section
2.2.3 are integrated by acknowledging the eventual downfall or termination of a technology –
both in a systemic sense as well as on the individual unit level. The entire life of a technology
(here: coal combustion for electricity generation) is impacted by the life of its individual
elements (here: coal units).
CE
UeT
DC
olle
ctio
n
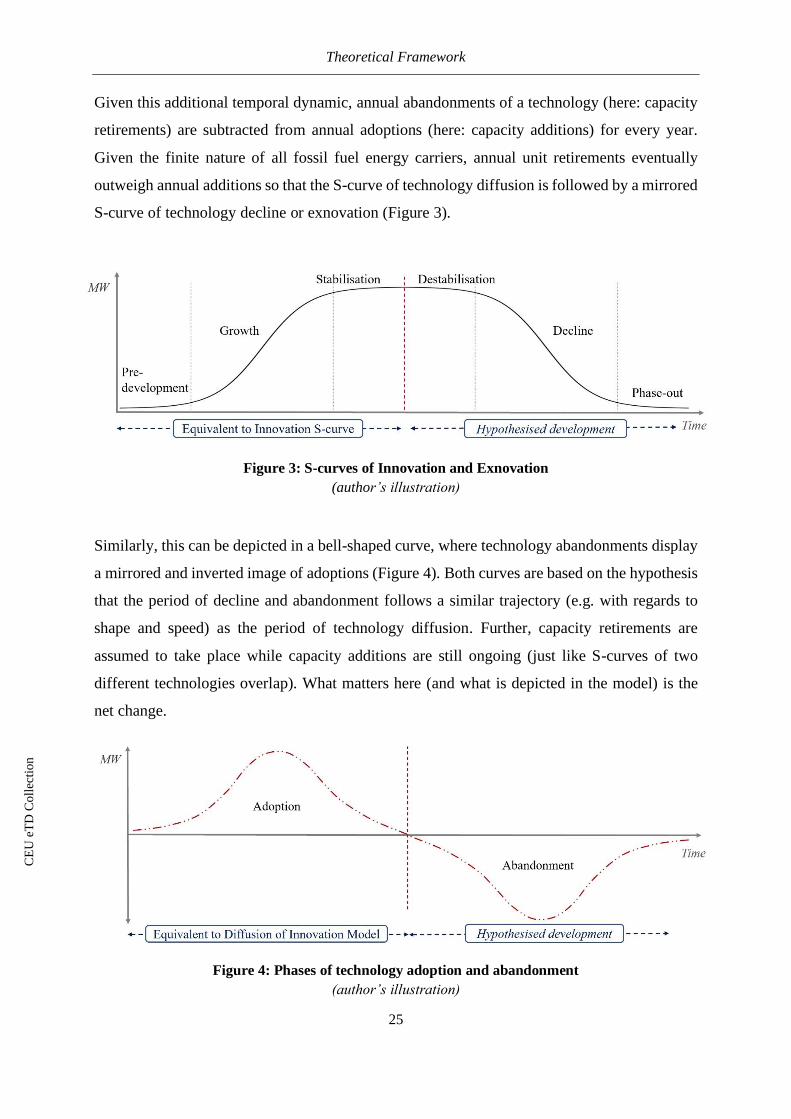
Theoretical Framework
25
Given this additional temporal dynamic, annual abandonments of a technology (here: capacity
retirements) are subtracted from annual adoptions (here: capacity additions) for every year.
Given the finite nature of all fossil fuel energy carriers, annual unit retirements eventually
outweigh annual additions so that the S-curve of technology diffusion is followed by a mirrored
S-curve of technology decline or exnovation (Figure 3).
Figure 3: S-curves of Innovation and Exnovation
(author’s illustration)
Similarly, this can be depicted in a bell-shaped curve, where technology abandonments display
a mirrored and inverted image of adoptions (Figure 4). Both curves are based on the hypothesis
that the period of decline and abandonment follows a similar trajectory (e.g. with regards to
shape and speed) as the period of technology diffusion. Further, capacity retirements are
assumed to take place while capacity additions are still ongoing (just like S-curves of two
different technologies overlap). What matters here (and what is depicted in the model) is the
net change.
Figure 4: Phases of technology adoption and abandonment
(author’s illustration)
CE
UeT
DC
olle
ctio
n
Theoretical Framework
26
With regards to spatial dynamics, I hypothesise that the core-to-periphery diffusion model is
mirrored in decline, so that the first adopters of a technology are the last ones to abandon it (see
also Grubler 2012). Further, and following Grubler (2012), I hypothesise that the saturation
level in the periphery is lower than in the core.
Following section 2.2.1, it is assumed that coal capacity is undergoing constant change, and
that a dominant design will emerge as the result of an ongoing adaptation process. This process
presumably unfolds differently in the countries of investigation, as energy sector developments
are substantially impacted by socio-economic and political contexts (sections 2.2.1-2.2.4).
Lastly, the phases rise, stagnation, and decline are not unambiguously separable. For example:
is the decline of coal enacted once annual adoption levels fall or turn negative, once total
installed capacity decreases, or once electricity generation from coal declines? As a result, all
three trajectories will be analysed and compared.
3.3 Integration of TF and ROs
A combination of the TF and the research objectives (section 1.3.3) is depicted below (Figure
5). The TF is concerned with patterns and rates of change, over time and across countries. It
provides a broad, techno-economic context (RO1); integrates qualitative aspects of coal fleet
development (RO2) with quantitative change over a technology’s life (RO4); shine light on the
lifetime of a unit (RO3); and explores the relationship between coal capacity and coal-fired
electricity generation (RO5).
CE
UeT
DC
olle
ctio
n
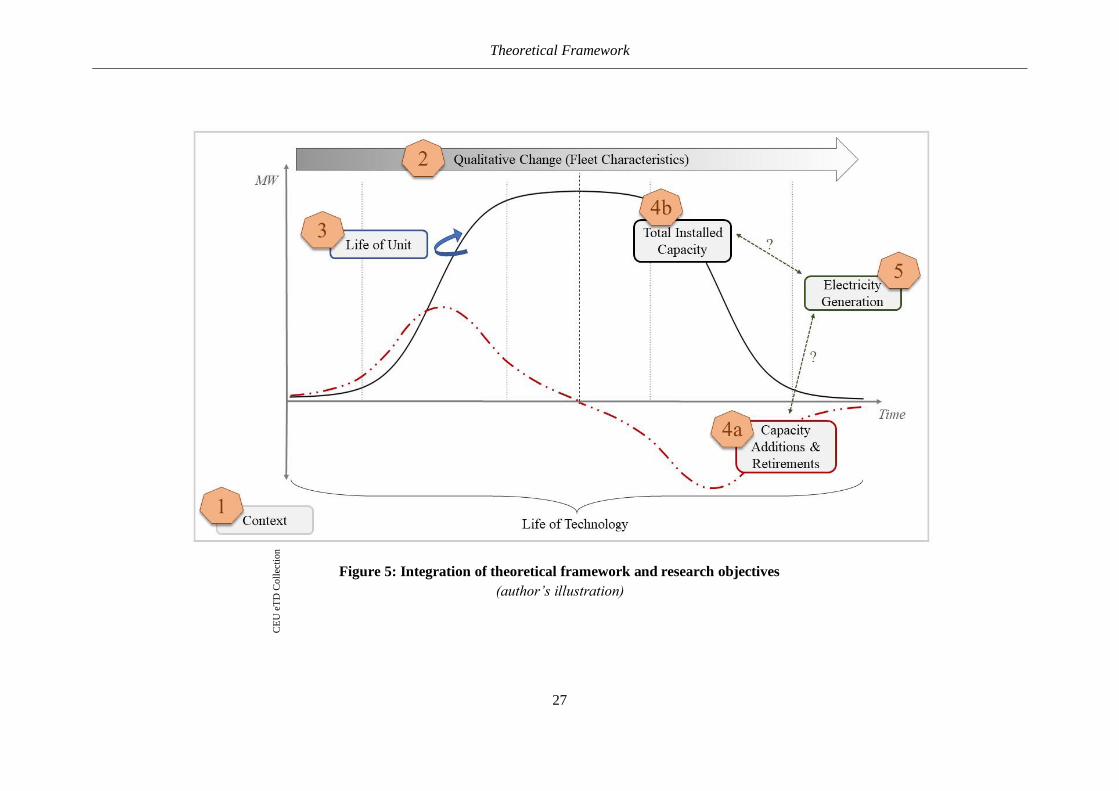
Theoretical Framework
27
Figure 5: Integration of theoretical framework and research objectives
(author’s illustration)
CE
UeT
DC
olle
ctio
n
Methods and Results
28
4 Methods and Results
4.1 Introduction and Outline
The first part of the results (section 4.3) is comprised of an analysis of literature on techno-
economic aspects of coal combustion and fleet development. This section ought to provide a
comprehensive overview of important factors that influence the short and long-term operating
context of coal plants. Not all aspects will be revisited in later analysis, but they are deemed
important to understand the internal and external factors affecting both day-to-day operations
and strategic decisions to construct or retire coal plants. Specifically, economic and
technological factors, lifetimes and retirement ages, as well as premature retirements and
stranded assets will be discussed.
For the quantitative analyses of sections 4.4-4.7, the time frame of investigation will span the
years of 1960 until today. Regarding the spatial scope, it will include all world regions but pay
particular attention to the largest coal consuming countries or regions as well as particularly
interesting cases. The analysis follows up with several ideas and findings from section 4.3 by
testing and expanding upon previous results. All following sections will be organised according
to the order of the formulated research objectives (section 1.3.3) and thus depart from the
conventional structure of a comprehensive overview of methods being followed by all results.
This is due to the chosen approach of exploratory data analysis, in which results from earlier
steps were taken into account in later analysis and in which findings successively build upon
another.
4.2 Datasets and Data Wrangling
The quantitative analyses are based on two datasets of coal power plants worldwide. One is
S&P Global Market Intelligence World Electric Power Plants (WEPP) Database from October
2017, which is a comprehensive global inventory of 219,500 electric units, of which 16,913 are
coal-fired stations. The other is Global Energy Monitor’s Global Coal Plant Tracker (hereafter
GCPT) database of January 2020, which lists 12,875 coal-fired electric units.
Given WEPP’s greater coverage and GCPT’s more recent update, the two datasets were
manually merged by maintaining WEPP as the main database, and updating information
(mainly statuses and operating or retirement years) with the use of GCPT. This was done by
manually matching unique unit names, and in the second instance confirming nameplate
capacity, operational year, and location. The update concerned about 1,500 units that changed
CE
UeT
DC
olle
ctio
n
Methods and Results
29
their status between 2016 and 2020, the majority of which can be ascribed to plants becoming
operational or retiring. About 6% of the plants listed in GCPT could not be matched to
respective counterparts in WEPP, which implies that they are either missing in WEPP or are
listed under a different name. Given the latter, as well as their generally smaller size, these
unmatched units were not included in the final dataset.
In the case of Chinese units, the matching yielded unsatisfactory results and consequently, data
on Chinese coal plants was not updated. Instead, anticipated changes in 2017 (e.g. units
becoming operational between 2017 and 2020) as listed in WEPP were assumed to realise
accordingly. Cross-checking these assumptions with a Carbon Brief analysis of global coal
plants (Evans and Pearce 2020), which is based on the GCPT database, suggests that retirements
of Chines units are underrepresented for 2017-2020, as well as units becoming operational in
2019. However, values for capacity additions and retirements also deviate for the time prior to
2017, which is presumably due to the use of different main data.
All units announced to retire or start operation in 2020 were assumed to do so this year. Had
units planned to become operational or retire before 2020 but were not updated accordingly,
the year 2020 was assigned. While it is not uncommon for units planned or under construction
to be cancelled (Shearer et al. 2020; Shearer et al. 2018), this number is presumably low for
plants within one year of operation start. Finally, for all units that were listed as retired but had
no explicit retirement year, a 40-year lifetime was assumed (following, for example, Farfan and
Breyer 2017) and the respective retirement year added. While this can be highly inaccurate on
the particular unit level, it is regarded reliable on a country or region level aggregate (Pfeiffer
et al. 2018). For all retired plants where the retirement year would have been in the future, the
retirement year was determined to be 2020. This necessarily leads to an overrepresentation of
retirements in 2020, but rightly includes units that would otherwise have been excluded.
Likewise, for retired units that had a known retirement but missing operational year, the latter
was added assuming a 40-year operational life.
One final caveat is that the WEPP dataset is not comprehensive regarding units built in the first
half of the 20th century, especially for non-OECD countries. Despite the limitations mentioned,
the final dataset is deemed fairly representative and for most countries accurate, especially on
the aggregate level.
Lastly, to enable a more systematic analysis, two different country classification schemes were
established (see Table 1 and 2).
CE
UeT
DC
olle
ctio
n
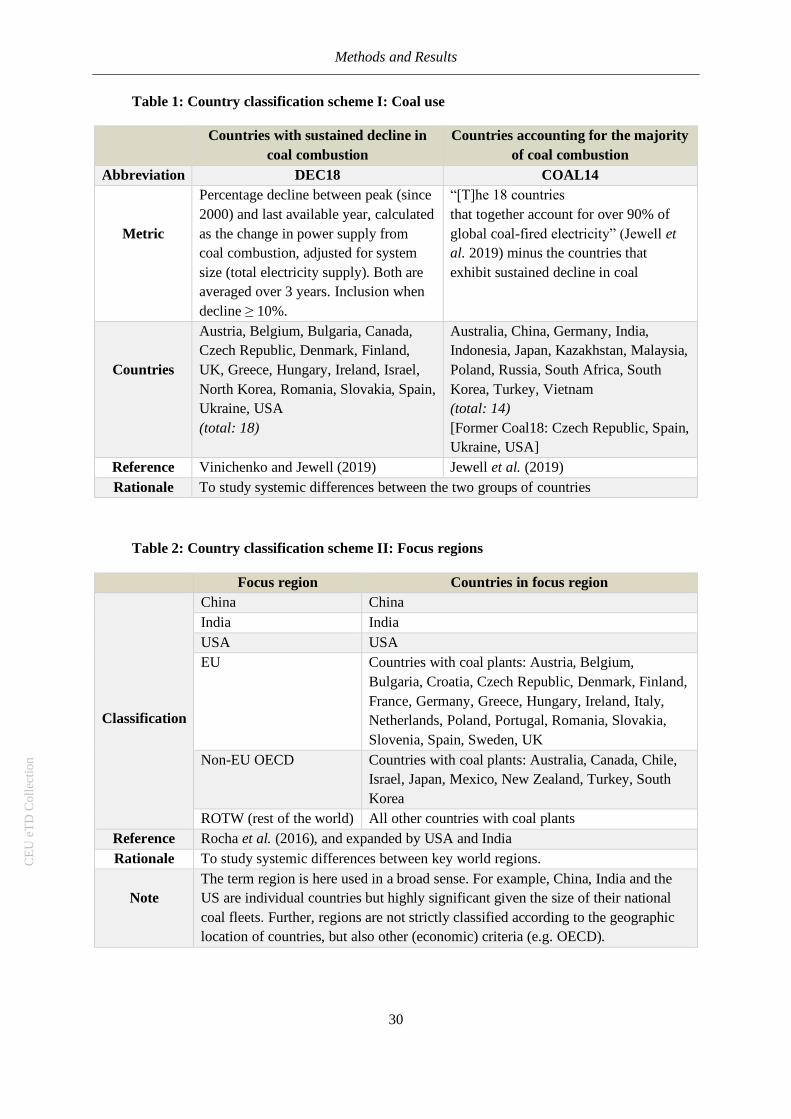
Methods and Results
30
Table 1: Country classification scheme I: Coal use
Countries with sustained decline in
coal combustion
Countries accounting for the majority
of coal combustion
Abbreviation DEC18 COAL14
Metric
Percentage decline between peak (since
2000) and last available year, calculated
as the change in power supply from
coal combustion, adjusted for system
size (total electricity supply). Both are
averaged over 3 years. Inclusion when
decline ≥ 10%.
“[T]he 18 countries
that together account for over 90% of
global coal-fired electricity” (Jewell et
al. 2019) minus the countries that
exhibit sustained decline in coal
Countries
Austria, Belgium, Bulgaria, Canada,
Czech Republic, Denmark, Finland,
UK, Greece, Hungary, Ireland, Israel,
North Korea, Romania, Slovakia, Spain,
Ukraine, USA
(total: 18)
Australia, China, Germany, India,
Indonesia, Japan, Kazakhstan, Malaysia,
Poland, Russia, South Africa, South
Korea, Turkey, Vietnam
(total: 14)
[Former Coal18: Czech Republic, Spain,
Ukraine, USA]
Reference Vinichenko and Jewell (2019) Jewell et al. (2019)
Rationale To study systemic differences between the two groups of countries
Table 2: Country classification scheme II: Focus regions
Focus region Countries in focus region
Classification
China China
India India
USA USA
EU Countries with coal plants: Austria, Belgium,
Bulgaria, Croatia, Czech Republic, Denmark, Finland,
France, Germany, Greece, Hungary, Ireland, Italy,
Netherlands, Poland, Portugal, Romania, Slovakia,
Slovenia, Spain, Sweden, UK
Non-EU OECD Countries with coal plants: Australia, Canada, Chile,
Israel, Japan, Mexico, New Zealand, Turkey, South
Korea
ROTW (rest of the world) All other countries with coal plants
Reference Rocha et al. (2016), and expanded by USA and India
Rationale To study systemic differences between key world regions.
Note
The term region is here used in a broad sense. For example, China, India and the
US are individual countries but highly significant given the size of their national
coal fleets. Further, regions are not strictly classified according to the geographic
location of countries, but also other (economic) criteria (e.g. OECD).
CE
UeT
DC
olle
ctio
n
Methods and Results
31
4.3 RO 1: Characteristics of the Global Coal Fleet
The following literature review briefly outlines relevant areas of research on coal capacity. It
serves as a qualitative basis for the following quantitative analysis. Not all topics reviewed will
be quantitatively investigated in the subsequent sections but are key to understanding the
operating environment of coal plants (e.g. economic factors). Other aspects will be revisited
and analysed using different data (e.g. capacity development), a more comprehensive or
different set of countries over a longer or different period of time (e.g. lifetimes, load factors,
infrastructure age).
4.3.1 Economic Factors
4.3.1.1 Capital Costs
The capital costs of a coal plant correspond to the initial investment required. Capital costs of
coal plants are substantially higher than those of natural gas plants (Hirth and Steckel 2016),
and yet higher for lignite rather than hard coal plants (DIW Berlin et al. 2019). Similarly, capital
costs for new, more efficient plants range above those of old and less efficient ones (Caldecott
et al. 2017) but vary substantially according to specific plant characteristics and have generally
increased over time. Lately, amortization periods extended beyond 20 years of operation
(Umweltbundesamt 2009). Long payback periods are problematic as utilities are more likely to
be legally entitled to governmental compensation payments when plants have to retire prior to
making profits (Schomerus and Franßen 2018). Unlike in the case of renewable energy
technologies, capital costs cannot dramatically fall as a result of mass production, and most
technological improvement options have already been exploited (Ellis et al. 2013).
In many Asian countries, coal has been the least-cost option for over a decade (World Energy
Council 2013). Nonetheless, should overall costs for renewables decline relative to coal,
Edenhofer et al. (2018) caution against believing that this would put a halt to all new coal
developments, as fossil fuel plant operators continue to access finance relatively effortlessly.
At the same time, capital market constraints in many developing countries prevent the large-
scale rollout of renewables (Schmidt 2014).
In most developed countries, the construction costs for coal units have “always been painfully
high” (Ellis et al. 2013, 7) due to the large size, complexity, and safety requirements. However,
investment risks were low, as electricity demand was projected to grow steadily. Additionally,
excess capacity was financed by ratepayers in monopoly-dominated electricity markets (ibid.).
CE
UeT
DC
olle
ctio
n
Methods and Results
32
These two conditions have dramatically changed in recent years and now provide more
favourable conditions for RE. These novel challenges could be one of the reasons why the
construction of new coal plants is now dominated by large companies (Urgewald 2019), who
have a greater capacity to tolerate economic losses.
4.3.1.2 Operating Costs and Revenues
The operating costs of a coal unit depend on multiple factors, such as size, location, combustion
technology, ownership, and environmental regulations. Operating costs include cash costs,
which are fuel costs and variable operations and maintenance (VOM) costs. Fuel costs depend
on the calorific value of coal, as well as the type and distance of transport. VOM costs cover
the purchase of water, chemicals, supplies, and waste disposal. But operating costs also include
costs associated with keeping a unit online, maintaining its performance, and complying with
environmental regulations (Gray and Watson 2018). Under normal utilization, fuel costs
constitute the largest share (~70%) of total operating costs, but fixed operations and
maintenance (FOM) costs per MWh of electricity rise with declining utilization rates (ibid.).
In energy-only markets, revenues are generated from electricity sales on the spot market and
should be high enough to cover both operational costs in the short term and capital costs in the
long term (DIW Berlin et al. 2019). Due to the increasing integration of renewables and the
corresponding decline of electricity wholesale prices, many plants struggle to recover even their
operating costs and fall back on capacity payments or revenues from heat supply (ibid.;
Caldecott et al. 2017). Generally, capital and FOM costs are only recoverable if units are
utilized at the rate they were designed for, but an increasing share of plants allocate these costs
over a decreasing number of hours (Gray and Watson 2018). Higher fuel costs for hard coal
plants outweigh benefits from lower capital costs so that the utilization rate of hard coal plants
typically lies below that of lignite plants (DIW Berlin et al. 2019).
According to a Carbon Tracker report (Gray et al. 2018), almost half (42%) of the global coal
fleet is unprofitable in 2018, and the number is expected to rise to 72% by 2040. As of now,
35% of coal capacity is presumed to have higher operating costs than renewables, which is
expected to increase to 72% in 2040. Countries in which renewables are already cheaper than
coal include Australia, China, India, South Africa, the United States and the EU (ibid.).
CE
UeT
DC
olle
ctio
n
Methods and Results
33
4.3.1.3 Economic and System Costs
A ‘domino effect’ (DIW Berlin et al. 2019) or a ‘death spiral’ (Caldecott et al. 2016) has been
observed among various coal value chains. Mining is only profitable if a certain output quantity
is reached, transport only economical under full load, and the operation of many plants only
cost-effective under high utilization rates (DIW Berlin et al. 2019). Thus, one struggling or
declining system element potentially takes up- and downstream sectors down, especially if they
are vertically integrated and lack alternative suppliers, customers, or contractors.
On the other hand, energy and climate scholars agree that early action on phasing out coal
lowers overall mitigation costs (Edenhofer et al. 2018) and reduces mitigation requirements in
the second half of the century (Bertram et al. 2015). Early action could take the form of
cancelling all coal plants currently planned or under construction, as well as discontinuing the
operation of unprofitable plants – unless they are crucial for reliable electricity provision
(Hughes 2016). Keeping unprofitable plants online is detrimental to regional businesses and
consumers that rely on affordable electricity, because a thwarted phase-out delays the
development of lower operational cost capacity (ibid.). The costs of stranded assets will be
revisited in section 4.3.4.
4.3.1.4 Ownership
The majority of coal capacity in operation or under construction (90%) is situated in regulated
or semi-regulated markets (Gray et al. 2018). This has impacts on the ownership structure,
which in turn affects the operating environment and utilization of coal plants. In liberal markets,
such as the US and UK, losses are suffered directly by companies and workers, whereas in
political economies with high levels of coordination between governmental and non-
governmental actors, more compensatory payments are made towards firms and coal sector
employees (Spencer et al. 2018). In an overview of ownership across world regions, Caldecott
et al. (2016) find that the majority of plants across China, India, and the EU are owned by the
state or by state-owned utilities.
In China, for example, state-owned companies face a substantially different operating
environment than foreign companies, which are more exposed to market forces (Caldecott et
al. 2017). State-owned enterprises also generally have easier access to credit and are enjoying
guaranteed returns on investment. This has led to the build-up of significant over-capacity in
China in times of declining power production from coal (Greenpeace 2015). In many countries
(e.g. China, South Africa, Germany, Spain, the Netherlands), electricity market concentration
CE
UeT
DC
olle
ctio
n
Methods and Results
34
is high and only few companies own more than half of operating capacity (Cui et al. 2020;
Wright et al. 2017). Lastly, it must be noted that countries might put domestic projects on halt
but continue to invest in coal projects abroad (Edenhofer et al. 2018).
4.3.2 Technological Factors
4.3.2.1 Technology and CCS
Coal plants have multiple generation units that are each equipped with a boiler (Campbell
2013). There are three main types of steam conditions, i.e. combustion technologies (ranging
from least to most efficient): subcritical, supercritical, and ultra-supercritical, which differ in
boiler temperature and pressure (Caldecott et al. 2017). Recently, countries have built more
supercritical and ultra-supercritical units, which have higher capital costs but are typically more
efficient and incur lower operating costs (ibid.). Coal is usually burned in steam-cycle plants,
while oil and natural gas stations rely on a broader set of technologies, including combined-
cycle, and open-cycle turbines (Kefford et al. 2018).
Equipping coal plants with carbon capture and storage (CCS) technology is a conceivable
option in the long-term future. However, no plants to date are CCS ready (Edenhofer et al.
2018) and such retrofits require substantial capital investments and reduce plant efficiency
(Johnson et al. 2015). Besides technological shortcomings (Agora Energiewende 2016), CCS
has a low social acceptance (Bertram et al. 2015) and is controversially discussed among
scholars (Stephens 2015). While CCS is “unlikely to play a significant role” in power
generation from coal (Caldecott et al. 2016, 24), CCS could be a viable option for the industry
sector and other applications with limited mitigation options.
4.3.2.2 Efficiencies
When talking about plant efficiencies, scholars generally refer to thermal efficiencies. Thermal
efficiencies state the amount of heat that becomes useful work, or the amount of work output
for a specific amount of heat input (Energy Education 2018). Lower heat rates are indicative of
more efficient combustion, because less heat input is required for the same output (Campbell
2013). European plant efficiencies range between 39% (9,186 Btu/kWh) for subcritical to 46%
(7,788 Btu/kWh) for ultra-supercritical units (Caldecott et al. 2017). Unit efficiency also
depends on the age, and maintenance efforts can only maintain initial efficiency levels over the
first 25 years, after which the performance is significantly reduced (Henderson 2013). These
reductions are mainly due to mechanical wear on individual components, as a result of which
CE
UeT
DC
olle
ctio
n
Methods and Results
35
greater heat loss occurs (Campbell 2013). Additionally, efficiencies depend on the quality of
fuel input, size of the plant, pollution control equipment (which increases electricity
consumption), operating practices, cooling water technologies, ambient temperature, flexibility
requirements, and plant materials (ibid.).
Inefficient plants report higher fuel consumption and higher overall operating costs, which
reduces profits for asset owners (Alves Dias et al. 2018). Subcritical units, for example, use
60% more water on average than ultra-supercritical units (Caldecott et al. 2015). Additionally,
inefficient plants cause higher CO2 emissions: Carbon intensities range between 880-1,120
kgCO2/MWh for new, efficient subcritical stations and over 1,340 kgCO2/MWh for old,
inefficient subcritical units (Caldecott et al. 2015). Caldecott et al. (2015) further find that an
average subcritical unit emits 75% more CO2 than an average ultra-supercritical one.
Particularly low average efficiencies of around 30% are found in India (CEA 2016) and in
Eastern European countries, while they are highest (~45%) in Germany and the Netherlands
(DIW Berlin et al. 2019; Alves Dias et al. 2018).
The World Coal Association (2020) claims that a 1% improvement in the thermal efficiency of
a coal plant results in a reduction of CO2 emissions of 2-3%. Plant efficiencies can be raised by
using renewables for heat or power provision, equipment refurbishments, improved
maintenance and operation schedules, and plant upgrades (Campbell 2013). The combined
provision of heat and power (CHP) raises the efficiency to 85-90%, but is an option mainly for
hard coal plants (DIW Berlin et al. 2019). Governments and local authorities can provide
incentives to improve efficiencies, such as setting efficiency standards or benchmarks
(Campbell 2013).
4.3.2.3 Utilization and Load Factors
The utilization rate of a power plant, often also referred to as load factor or capacity factor, is
the “ratio of its actual annual output to its maximum potential annual output according to its
nameplate capacity” (Caldecott et al. 2016, 108). Load factors vary greatly across regions and
over time, as they are a function of respective market conditions, fuel prices, electricity system
dynamics, and electricity demand.
Load factors in India, for example, dropped by 13% between 2010 and 2015 due to coal
shortages (Spencer et al. 2018). In China, the utilization rate of thermal plants fell below 50%
in 2016, which was the lowest rate since 1969 (Greenpeace 2016). In the US, it dropped from
70% to 60% between 2009 and 2012 (EIA n.d. in Wamsted et al. 2019). This trend of declining
CE
UeT
DC
olle
ctio
n
Methods and Results
36
load factors was not only observable on the national average, but 48 of the 50 biggest coal plants
in the US had a lower capacity factor in 2017 than they did on average between 2007 and 2017
(ibid.). In the UK, on the other hand, coal plant load factors rose from 39% in 2009 to 58% in
2013, while the load factor of natural gas plants declined from 64% to 28%. Littlecott (2015)
hypothesised that plant operators strategically maximised their output from the aging coal fleet
before scheduled closure under environmental regulations.
Low load factors are a concern to operators as efficiencies decline and revenues shrink (Zhao
et al. 2017). Many countries, for example China and Germany, experience an increasing
mismatch between coal capacity and coal power production, partly due to the expansion of
renewables which reduces operating hours of coal plants (Markewitz et al. 2018). At the same
time, proportionally more electric capacity is required to balance fluctuating RE supply from
wind and solar (ibid.). If plants are scarcely used, they are ramped up more often, which requires
extra fuel and wastes heat (Campbell 2013).
4.3.2.4 Flexibility
As a general rule, plants with liquid or gaseous fuels, i.e. oil or natural gas plants, are more
flexible than those with solid fuels (DIW Berlin et al. 2019). Lignite plants are most inflexible
due to their slow start up process and high minimum loads (Öko Institut 2017). The cold start
capability (which applies when plants have been shut for more than 48 hours) is 8-10 hours for
old and 5-8 hours for new lignite plants, and 5-10 hours for old and 3-6 hours for new hard coal
plants, which is significantly higher than that of combined-cycle gas turbines (CCGT) of under
1.5 hours, or that of open gas turbines of only a few minutes (Agora Energiewende 2017).
This disqualifies coal from providing flexible support to intermittent renewables (Kefford et al.
2018). While flexibility improvements are technologically possible, this would lead to heavier
equipment wear (DIW Berlin et al. 2019) or costly investments to retrofit (Cui et al. 2020). In
the past, the inflexibility of coal plants was not an issue, as most coal units covered the minimum
power demand and provided reliable and affordable baseload power (Ellis et al. 2013). Today,
however, low flexibility both with regards to ramping up times and minimum loads is highly
undesirable due to the curtailment of renewable energy (IRENA 2019a) and reductions in coal
plant profitability.
CE
UeT
DC
olle
ctio
n
Methods and Results
37
4.3.3 Lifetimes and Retirement Ages
4.3.3.1 Concepts
The concept of lifetimes of fossil fuel units is fluid and contested. Rode et al. (2017) criticise
that many scholars make judgement-based lifetime estimates instead of conducting a historical
analysis. Markewitz et al. (2018) similarly view lifetime assumptions as insufficiently
substantiated, as well as a generally neglected topic. Differentiations between the book life,
depreciable life, technical life, operational life, economic life, physical life exist but the terms
are incomprehensively demarcated from each other.
The technical or physical life typically refers to the potential operational life of a plant
irrespective of its economic situation, or the “period over which the plant is operating and
producing power in a business-as-usual (BAU) scenario” (Kefford et al. 2018). But Markewitz
et al. (2018) argue that this term is misleading. The technical lifetime is a well-established term
in engineering and applies to individual, highly stressed components. Since power plants are
composed of thousands of individual parts, the term technical lifetime is thus not applicable to
plants in their entirety (Markewitz et al. 2018). Additionally, the physical lifetime depends on
maintenance practices and capital investments, which in turn are influenced by regulations and
broader economic conditions (Rode et al. 2017).
Book life or depreciable life is defined as “the period over which fixed costs are assumed to be
recovered for accounting purposes” (Gitman 2009). The economic (useful) life captures both
physical lifetime factors and the economic value of remaining operational (Appraisal Institute
2013 in Rode et al. 2017). In very general terms, a plant’s lifetime is the time between the start
of commercial operation and its retirement or “the overall period during which it is capable of
producing electricity” (Rode et al. 2017). In the subsequent sections, I will use the term
operational lifetime – which is dependent on economic, regulatory, and technical factors – as
advised by Markewitz et al. (2018) and Farfan and Breyer (2017).
4.3.3.2 Lifetime and Retirement Age Estimates
The accuracy of lifetime estimates is crucial due to their frequent use in the development of
future energy scenarios as well as grid planning (Markewitz et al. 2018). But, not only
judgement-based estimates can be misleading: Cui et al. (2019) point out that historic lifetimes
are not necessarily representative of future ones, as policies change, technologies advance, and
market and economic conditions improve or deteriorate.
CE
UeT
DC
olle
ctio
n
Methods and Results
38
Rocha et al. (2016) calculated average (mean) lifetimes to be 41 years in Australia, 40 in
Canada, 56 in Russia, 54 in the US, and 46 as a global average. Tong et al. (2019) claim that
Chinese lifetimes have only been 24 years on average, mainly due to early retirements induced
by air pollution regulations. Davis and Socolow's (2014) global analysis determined a median
retirement age for coal plants of 32 years. Interestingly, Markewitz et al. (2018) find that
average lifetimes of German coal plants have increased by 7 years for lignite and 8 years for
hard coal between 1990-1999 and 2000-2014. The authors explain this with the lifetime-
extending installation of flue gas cleaning facilities. Other life extending measures include the
introduction of biomass for co-firing or a radical fuel switch (Alves Dias et al. 2018), which
impede environmental regulation induced closures.
As already indicated, unit age alone inadequately predicts retirement age, as size, efficiency,
pollution levels, environmental regulations (Cui et al. 2019), operational costs (Kefford et al.
2018), electricity and fuel market conditions (Markewitz et al. 2018), revenues, equipment
failure, and replacement costs (Davis and Socolow 2014) play an important role in the strategic
decision that is made for each unit individually (Markewitz et al. 2018).
4.3.3.3 Age Structure
Investigating the age structures of national coal fleets importantly highlights that the
distribution of unit ages differs substantially between countries. Half of today’s global
operational capacity was commissioned after 2004. But in China, 79% of all capacity and in
India, 69% of operational capacity was commissioned after 2004, which makes their national
fleets significantly younger than in the EU or US (Tong et al. 2019). If all coal plants currently
in operation were retired after a 35-year lifespan, almost 90% of US capacity would be retired
by 2030, in comparison to just 12% in China or 20% in India (Cui et al. 2019).
4.3.4 Premature Retirements and Stranded Assets
4.3.4.1 Definition and Relevance
Stranded assets are economic losses resulting from the premature retirement of assets (Cui et
al. 2020; Kefford et al. 2018) or the underutilisation of plants (Johnson et al. 2015). Benn et al.
(2018) differentiate between regulatory stranding, which occurs when policymakers pass laws
that impede plants from operating for their entire useful life, and economic stranding, which
occurs when high operational costs and low revenues render the continuation of operations
uneconomic. While stranded value (the “difference in expected and actual financial outcomes”,
CE
UeT
DC
olle
ctio
n
Methods and Results
39
Benn et al. 2018, 30) is “undesirable” (ibid., p. 69), stranding is also “a regular feature of
economic systems and […] a phenomenon inherent in the ‘creative destruction’ of economic
growth and technological change” (Caldecott and McDaniels 2014).
Premature retirements as a mitigation option have attracted far less attention from policymakers
than the support of low-carbon technologies despite being cost-effective and not relying on
technological progress (Kefford et al. 2018). Since premature retirements are unlikely to happen
in the required volume through economic pressures alone, Miller (2013) calls for regulatory
measures and incentives for coal plant closure, as well as compensation payments if necessary.
All coal projects currently under construction are likely to be retired prematurely, but more
interestingly, highlight that investors do not trust climate policies to restrict future operations
considerably (Edenhofer et al. 2018). This poses a challenge for determining the order in which
plants should be retired: While operators of old plants had more time to recover their initial
investment costs, the owners of newer assets should have internalised the risk of stranding
before starting construction (Benn et al. 2018). However, the governmental responsibility for
compensating plant owners for premature closure is limited after plants have recovered their
capital costs (Caldecott and Mitchell n.d. in Caldecott et al. 2017). Further, newer plants are
generally equipped with more efficient technologies and their higher capital costs suggest the
prioritisation of old coal plants for retirement (ibid.).
Whether or not large-scale stranding occurs additionally depends on energy market
characteristics. Stranding is less likely to occur in regulated markets where utilities can pass
costs on to ratepayers, coal companies are largely state-owned, and asset owners are isolated
from market forces (Benn et al. 2018). In liberalised markets, coal plants are exposed to fierce
price competition and are typically owned by independent power producers or pure financial
players, who have less stake in keeping operations running (ibid.). Consequently, uneconomic
plants in regulated markets are more likely to be mothballed, idled, or underutilized, whereas
uneconomic plants in liberalised markets are more likely to be retired.
Stranding assets will inevitably create winners and losers throughout society, creating the risk
of stranding human capital alongside physical assets (Caldecott et al. 2016). Write-offs and
financial losses of investors, Benn et al. (2018) argue, have not been sufficiently addressed,
despite ongoing debates on a ‘just transition’ for all stakeholders involved.
CE
UeT
DC
olle
ctio
n
Methods and Results
40
4.3.4.2 Causes
Predictors of early retirement include SO2 emission levels, electricity sector characteristics
(Mills et al. 2017), regulatory changes, a shifting economic environment (Benn et al. 2018),
present and future revenue expectations, and total installed electric capacity (Markewitz et al.
2018). Low prices for natural gas have been found to reduce coal-based electricity generation,
but there does not yet exist evidence for any causal effect on early coal plant retirements (Linn
et al. 2019). Celebi et al. (2010) find that merchant units (those relying on market revenues) are
more likely to retire than regulated units, and that high fuel prices, low heat rates, and stringent
environmental regulations act as retirement drivers. Low load factors can, but do not
necessarily, lead to premature retirements. The owners view on future profitability, which is
based on both anticipated electricity sales but also capacity market or other ancillary service
market payments, is ultimately decisive for retirement decisions (Edmunds et al. 2015).
Caldecott et al. (2016) develop a comprehensive list of risk factors for coal plants, such as
environmental change (e.g., climate change, natural capital depletion, freshwater availability),
governmental regulations (e.g., carbon prices, air pollution regulations, licence conditions for
operation), resources (price and availability), technological change (e.g., clean technology
costs, disruption by low-carbon technologies), social norms and consumer behaviour (e.g.,
divestment campaigns, certification schemes). These risks are exacerbated when plants are
located in densely populated areas and those with high levels of air pollution and water stress.
In another study, Caldecott et al. (2016) conduct interviews with industry representatives, who
identify falling clean technology costs, physical environmental change, market forces, and
socio-political pressures as the greatest risks to asset stranding. In yet another study, Caldecott
et al. (2017) argue that older plants are at higher risk of stranding for several financial and
political reasons, such as their higher likelihood of being shut down for maintenance needs,
higher repair costs, and elevated opportunity costs in the case of underperformance.
4.3.4.3 Estimates
Scholars agree that asset stranding of some degree is inevitable if climate targets are to be met.
Yet, varying estimates on the economic costs of such stranding exist, which is partly due to
country-specific lifetimes, regulatory conditions, and amortization periods (Cui et al. 2019).
Pfeiffer et al. (2018) find that even if all outstanding fossil fuel projects were immediately
cancelled, about 20% of the fossil fuel generating capacity would still need to be stranded for a
good chance of remaining under 2°C of global temperature rise. These results are, again, highly
CE
UeT
DC
olle
ctio
n
Methods and Results
41
sensitive to underlying assumptions: “[S]hould the share of generation-only budget be one
percentage point smaller […] or bigger […], the stranding estimated for the 430-480 ppm
scenario would change by 1.6 percentage points” (Pfeiffer et al. 2018, 8).
Spencer et al. (2018) found that installed electric power capacity must globally decrease by 4%
annually for limiting global warming to 1.5°C. To meet the Paris targets, Gray et al. (2018)
called for a 3-fold increase in retiring capacity, which would be a capital write-off
unprecedented in volume (Bertram et al. 2015). Gray et al. (2018) estimated that coal assets of
USD 267 billion are at risk in the 2°C scenario, while Kefford et al. (2018) found the value of
stranded fossil fuel investments to be USD 591 billion across China, India, the EU and the US
alone, of which 66% will occur in China and 31% in India.
4.3.4.4 Managing Losses
A number of studies developed prioritisation rules for the order of asset stranding. Cui et al.
(2020) identify old, small, inefficient plants in regions of high air pollution and water scarcity
as low hanging fruit. Pfeiffer et al. (2018) also suggest stranding old, inefficient plants first,
and further recommend retrofitting the existing fleet to enhance efficiency or implement CCS.
Other scholars make suggestions on how to minimize the negative economic and social effects
of asset stranding: Johnson et al. (2015) favour extending the lifetimes of existing plants over
the construction of new, efficient plants because it would reduce total premature retirements.
Following Cui et al. (2020), there is a trade-off between retirements and utilization rates:
guaranteed lifetimes can lower stranded assets, but that lowers the utilization rate and thus the
profits of each plant. Vice versa, high load factors of some plants would require the premature
retirement of others. Avoiding stranding assets altogether is undesirable, as it will shift
mitigation efforts to other sectors, which come at greater costs and greater risk to, for example,
food security (Binsted et al. 2020).
4.4 RO 2: Development of Coal Capacity Characteristics
4.4.1 Methods
The first step of the exploratory data analysis was comprised of investigating trends in capacity-
related characteristics, such as size, technology, ownership, or fuel type. All of these are
variables in the WEPP and/or GCPT datasets, but do not represent a comprehensive list of
aspects according to which capacity can be analysed. They do, however, provide a broad
overview of the composition of historic and current coal fleets. Specifically, units entering
CE
UeT
DC
olle
ctio
n
Methods and Results
42
operation were mapped over time (1970-2020) and against size (in MW), differentiated by focus
region (China, India, US, EU, OECD, and ROTW), or technology (subcritical, supercritical,
and ultra-supercritical). Additionally, annual capacity additions were summarised into 5-year
categories (for 1981-2020), MW-weighted, and categorised according to ownership for all
focus regions. Finally, annual capacity additions were analysed according to fuel types (lignite,
sub-bituminous, bituminous, and anthracite) for 1980-2020.
While past developments are indicative of the composition of the current coal fleet, not all units
that entered operation since 1970/80 are still operational, while some operational units of today
were built prior to that time. Thus, a brief investigation into the current operational coal fleet
followed, which included all units that are listed as ‘operational’ and thereby excluded units
that have been retired, mothballed, or idled. Additionally, the age distribution of today’s coal
fleet was analysed and differentiated by region.
4.4.2 Results
An increasing amount of coal capacity is built in China, India, and in the rest of the world, while
comparatively less units are built in the EU and US (Figure 6). Another trend that emerged is
that the average unit size increased over time. However, coal units with less than 250 MW
continue to be built around the world. The average nameplate capacity of coal units also varies
by region. Units in India, for example, tend to be smaller on average than those in other parts
of the world, whereas large coal units with over 1,000 MW are predominately located in China.
Finally, especially recently built units located in China and India are clustered around certain
capacities, such as 200, 330, 500, 660, or 1,000 MW with few unit sizes in between.
CE
UeT
DC
olle
ctio
n
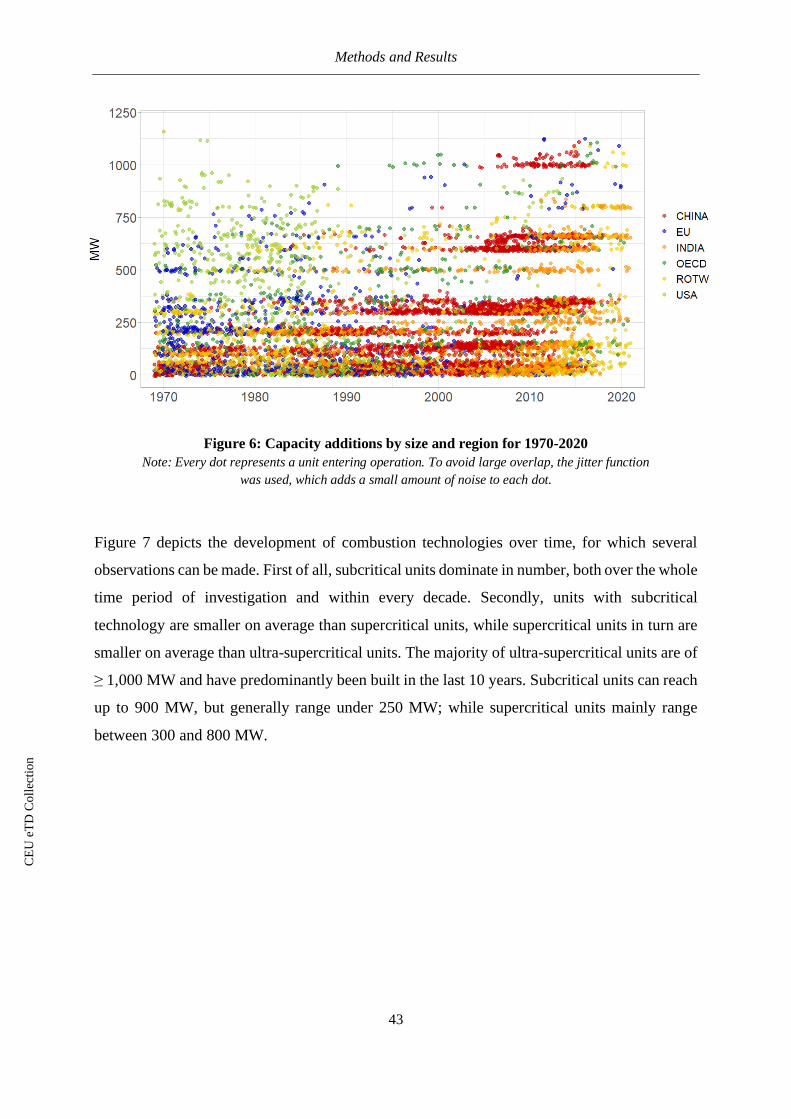
Methods and Results
43
Figure 6: Capacity additions by size and region for 1970-2020
Note: Every dot represents a unit entering operation. To avoid large overlap, the jitter function
was used, which adds a small amount of noise to each dot.
Figure 7 depicts the development of combustion technologies over time, for which several
observations can be made. First of all, subcritical units dominate in number, both over the whole
time period of investigation and within every decade. Secondly, units with subcritical
technology are smaller on average than supercritical units, while supercritical units in turn are
smaller on average than ultra-supercritical units. The majority of ultra-supercritical units are of
≥ 1,000 MW and have predominantly been built in the last 10 years. Subcritical units can reach
up to 900 MW, but generally range under 250 MW; while supercritical units mainly range
between 300 and 800 MW.
CE
UeT
DC
olle
ctio
n
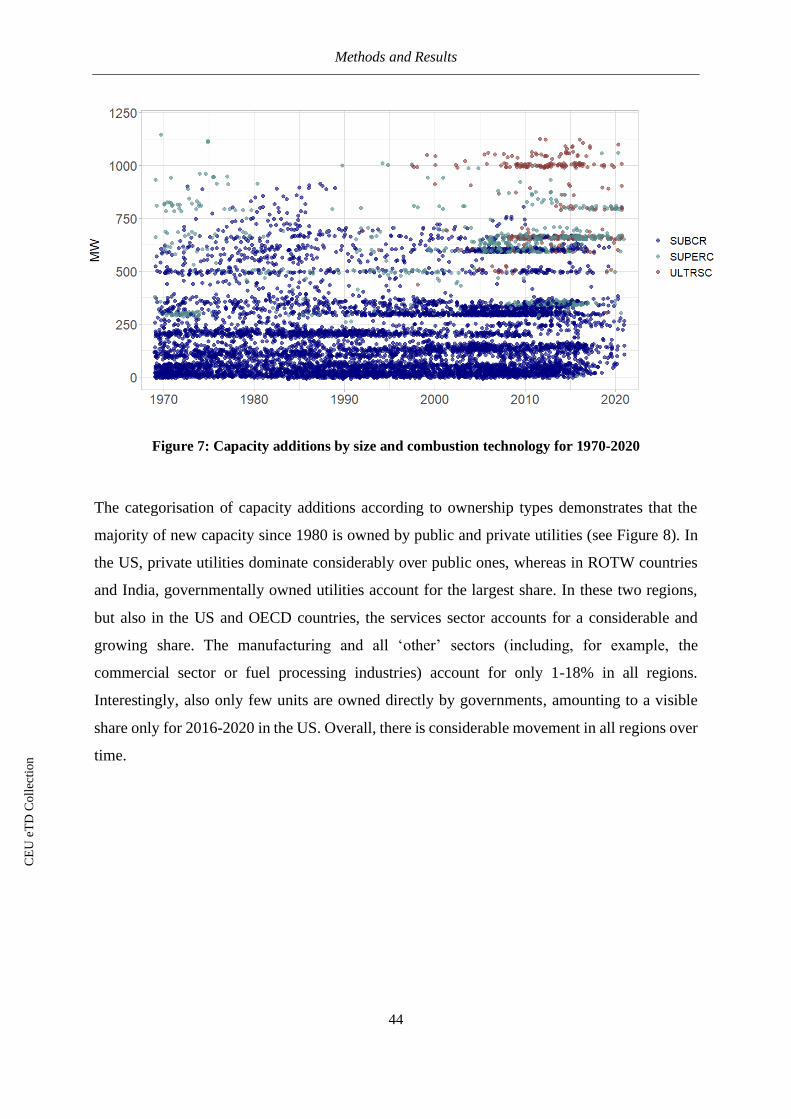
Methods and Results
44
Figure 7: Capacity additions by size and combustion technology for 1970-2020
The categorisation of capacity additions according to ownership types demonstrates that the
majority of new capacity since 1980 is owned by public and private utilities (see Figure 8). In
the US, private utilities dominate considerably over public ones, whereas in ROTW countries
and India, governmentally owned utilities account for the largest share. In these two regions,
but also in the US and OECD countries, the services sector accounts for a considerable and
growing share. The manufacturing and all ‘other’ sectors (including, for example, the
commercial sector or fuel processing industries) account for only 1-18% in all regions.
Interestingly, also only few units are owned directly by governments, amounting to a visible
share only for 2016-2020 in the US. Overall, there is considerable movement in all regions over
time.
CE
UeT
DC
olle
ctio
n
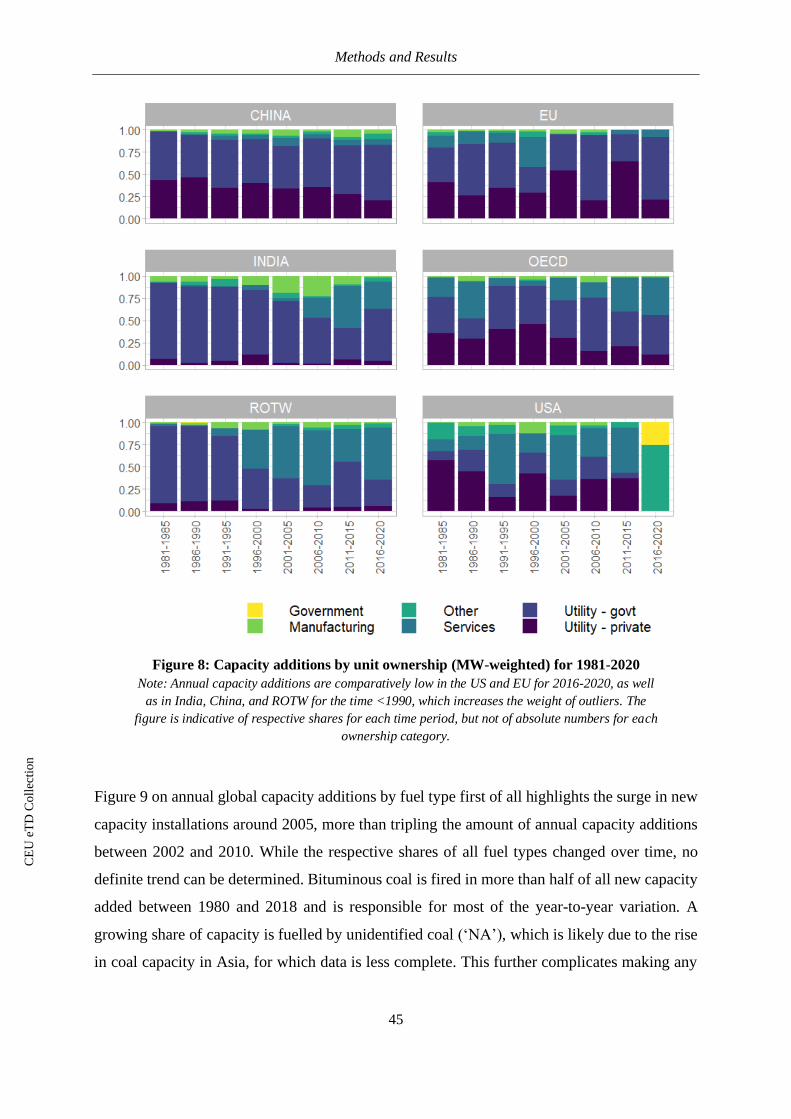
Methods and Results
45
Figure 8: Capacity additions by unit ownership (MW-weighted) for 1981-2020
Note: Annual capacity additions are comparatively low in the US and EU for 2016-2020, as well
as in India, China, and ROTW for the time <1990, which increases the weight of outliers. The
figure is indicative of respective shares for each time period, but not of absolute numbers for each
ownership category.
Figure 9 on annual global capacity additions by fuel type first of all highlights the surge in new
capacity installations around 2005, more than tripling the amount of annual capacity additions
between 2002 and 2010. While the respective shares of all fuel types changed over time, no
definite trend can be determined. Bituminous coal is fired in more than half of all new capacity
added between 1980 and 2018 and is responsible for most of the year-to-year variation. A
growing share of capacity is fuelled by unidentified coal (‘NA’), which is likely due to the rise
in coal capacity in Asia, for which data is less complete. This further complicates making any
CE
UeT
DC
olle
ctio
n
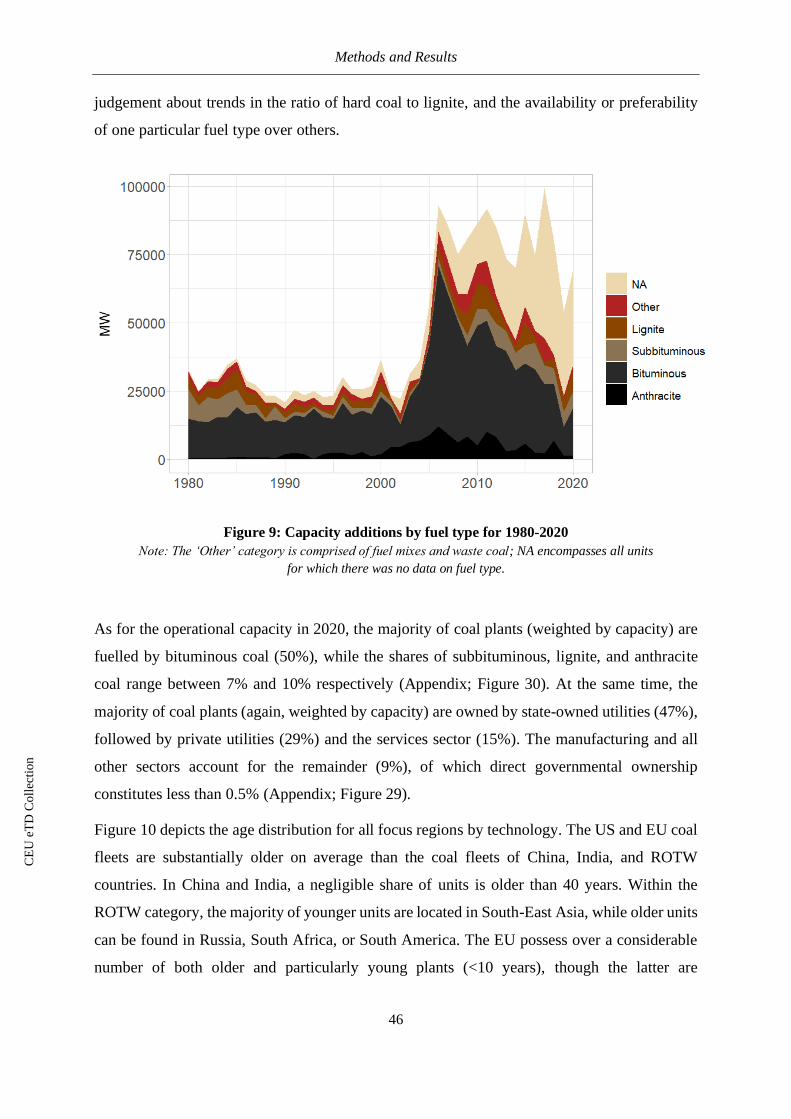
Methods and Results
46
judgement about trends in the ratio of hard coal to lignite, and the availability or preferability
of one particular fuel type over others.
Figure 9: Capacity additions by fuel type for 1980-2020
Note: The ‘Other’ category is comprised of fuel mixes and waste coal; NA encompasses all units
for which there was no data on fuel type.
As for the operational capacity in 2020, the majority of coal plants (weighted by capacity) are
fuelled by bituminous coal (50%), while the shares of subbituminous, lignite, and anthracite
coal range between 7% and 10% respectively (Appendix; Figure 30). At the same time, the
majority of coal plants (again, weighted by capacity) are owned by state-owned utilities (47%),
followed by private utilities (29%) and the services sector (15%). The manufacturing and all
other sectors account for the remainder (9%), of which direct governmental ownership
constitutes less than 0.5% (Appendix; Figure 29).
Figure 10 depicts the age distribution for all focus regions by technology. The US and EU coal
fleets are substantially older on average than the coal fleets of China, India, and ROTW
countries. In China and India, a negligible share of units is older than 40 years. Within the
ROTW category, the majority of younger units are located in South-East Asia, while older units
can be found in Russia, South Africa, or South America. The EU possess over a considerable
number of both older and particularly young plants (<10 years), though the latter are
CE
UeT
DC
olle
ctio
n
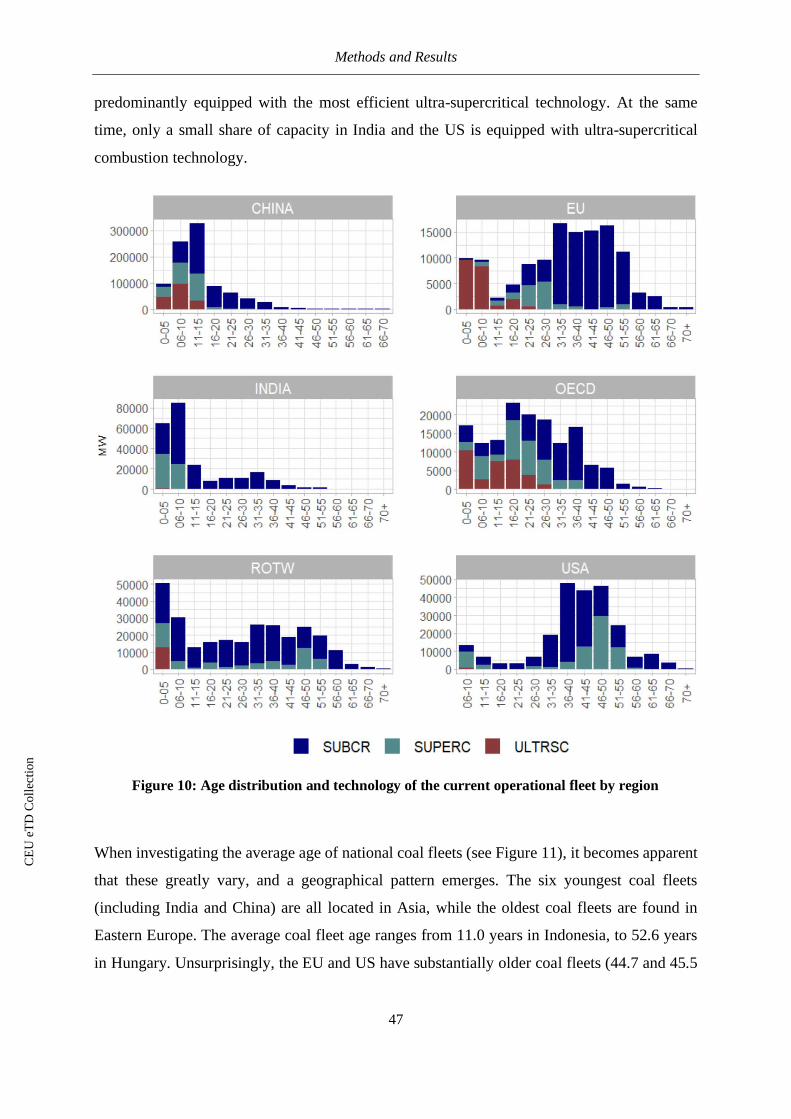
Methods and Results
47
predominantly equipped with the most efficient ultra-supercritical technology. At the same
time, only a small share of capacity in India and the US is equipped with ultra-supercritical
combustion technology.
Figure 10: Age distribution and technology of the current operational fleet by region
When investigating the average age of national coal fleets (see Figure 11), it becomes apparent
that these greatly vary, and a geographical pattern emerges. The six youngest coal fleets
(including India and China) are all located in Asia, while the oldest coal fleets are found in
Eastern Europe. The average coal fleet age ranges from 11.0 years in Indonesia, to 52.6 years
in Hungary. Unsurprisingly, the EU and US have substantially older coal fleets (44.7 and 45.5
CE
UeT
DC
olle
ctio
n
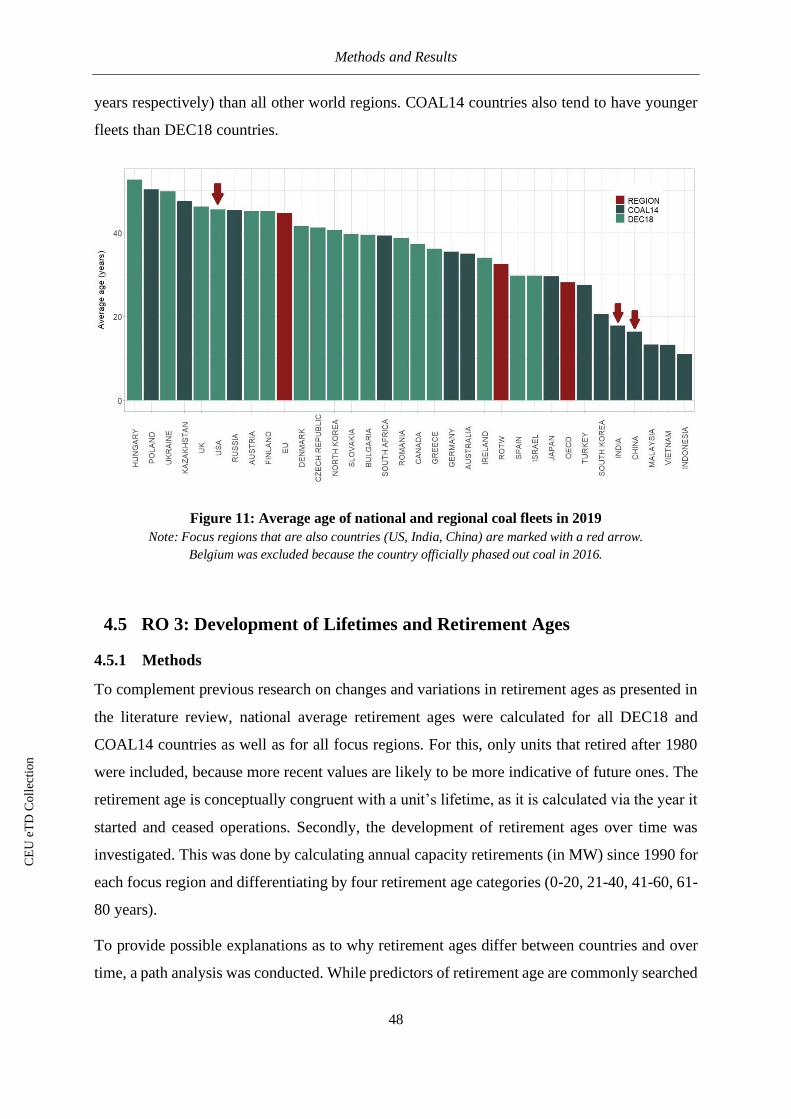
Methods and Results
48
years respectively) than all other world regions. COAL14 countries also tend to have younger
fleets than DEC18 countries.
Figure 11: Average age of national and regional coal fleets in 2019
Note: Focus regions that are also countries (US, India, China) are marked with a red arrow.
Belgium was excluded because the country officially phased out coal in 2016.
4.5 RO 3: Development of Lifetimes and Retirement Ages
4.5.1 Methods
To complement previous research on changes and variations in retirement ages as presented in
the literature review, national average retirement ages were calculated for all DEC18 and
COAL14 countries as well as for all focus regions. For this, only units that retired after 1980
were included, because more recent values are likely to be more indicative of future ones. The
retirement age is conceptually congruent with a unit’s lifetime, as it is calculated via the year it
started and ceased operations. Secondly, the development of retirement ages over time was
investigated. This was done by calculating annual capacity retirements (in MW) since 1990 for
each focus region and differentiating by four retirement age categories (0-20, 21-40, 41-60, 61-
80 years).
To provide possible explanations as to why retirement ages differ between countries and over
time, a path analysis was conducted. While predictors of retirement age are commonly searched
CE
UeT
DC
olle
ctio
n
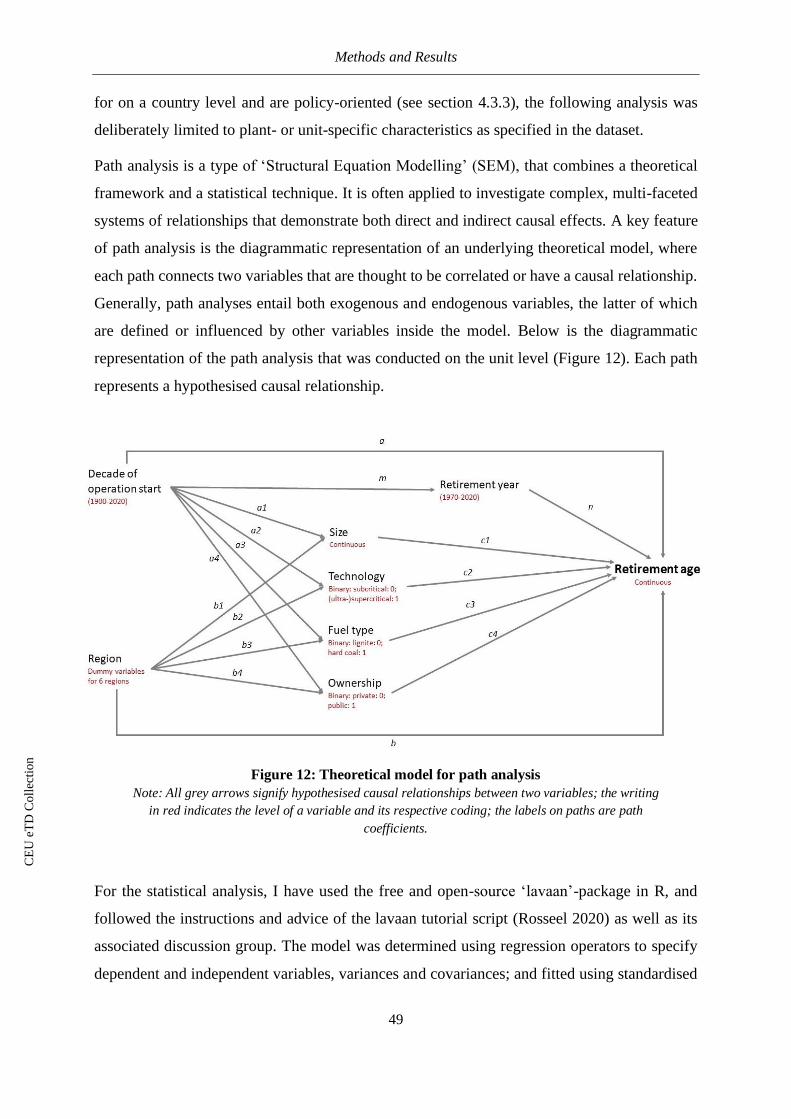
Methods and Results
49
for on a country level and are policy-oriented (see section 4.3.3), the following analysis was
deliberately limited to plant- or unit-specific characteristics as specified in the dataset.
Path analysis is a type of ‘Structural Equation Modelling’ (SEM), that combines a theoretical
framework and a statistical technique. It is often applied to investigate complex, multi-faceted
systems of relationships that demonstrate both direct and indirect causal effects. A key feature
of path analysis is the diagrammatic representation of an underlying theoretical model, where
each path connects two variables that are thought to be correlated or have a causal relationship.
Generally, path analyses entail both exogenous and endogenous variables, the latter of which
are defined or influenced by other variables inside the model. Below is the diagrammatic
representation of the path analysis that was conducted on the unit level (Figure 12). Each path
represents a hypothesised causal relationship.
Figure 12: Theoretical model for path analysis
Note: All grey arrows signify hypothesised causal relationships between two variables; the writing
in red indicates the level of a variable and its respective coding; the labels on paths are path
coefficients.
For the statistical analysis, I have used the free and open-source ‘lavaan’-package in R, and
followed the instructions and advice of the lavaan tutorial script (Rosseel 2020) as well as its
associated discussion group. The model was determined using regression operators to specify
dependent and independent variables, variances and covariances; and fitted using standardised
CE
UeT
DC
olle
ctio
n
Methods and Results
50
parameter values. Like most regression analyses, lavaan cannot process nominal data unless it
is dichotomous. Consequently, a number of variables were reduced to two dimensions (e.g.
private and public ownership; hard coal and lignite fuel; or subcritical and (ultra-)supercritical
technology). This inevitably reduced the depth and detail of the data and required making
several assumptions. To integrate location, dummy variables (value 0 or 1) for all six regions
were created and compared to one specific reference category. In this case, the UK was
excluded from the EU group and instead used as a reference point. The UK was chosen because
it had the third highest unit retirements after the USA and China since 1970.
Due to the abundance of categorical variables, the WLSMV estimator was applied, which uses
‘Diagonally Weighted Least Squares’ (DWLS) instead of the ML (maximum likelihood)
estimator in the case of continuous data. Results are standardised by rescaling the variance of
the observed variables to 1, which allows inferences about the direction and magnitude of a
relationship, but forbids interpretations in numeric terms. The Comparative Fit Index (CFI) is
a measure of model fit, which compares the fit of a proposed theoretical model with a baseline
one of poor fit (null/independence model). Ranging from 0 to 1, it is intuitively interpretable
and robust in its calculation (Jackson et al. 2009). Another commonly used measure of model
fit is the SRMR, or standardized root mean squared residual. Unlike the CFI, it measures misfit
and thus identifies discrepancies between the fitted model and the data structure. It can be
understood as the ‘average standardized residual covariance’ and is perceived as indicating
good fit if the SRMR value is below 0.08 (Shi et al. 2018).
The path analysis is based on the WEPP dataset, which includes 4,873 retired units, 2,896 of
which were retired after 1970 and had no missing values for the year of their operation start or
retirement. Finally, units with missing values for other variables were excluded, which led to a
final sample of 2,089 units.
4.5.2 Results
The average retirement age since 1980 ranges from 32.6 years in China to 48.2 years in the US
(see Figure 13). Most operational lifetimes, however, are situated between 35 and 43 years on
average. With India (41.3 years), all focus regions are widely spread across the retirement age
spectrum. There appears to be no significant difference between COAL14 and COAL18
countries.
CE
UeT
DC
olle
ctio
n
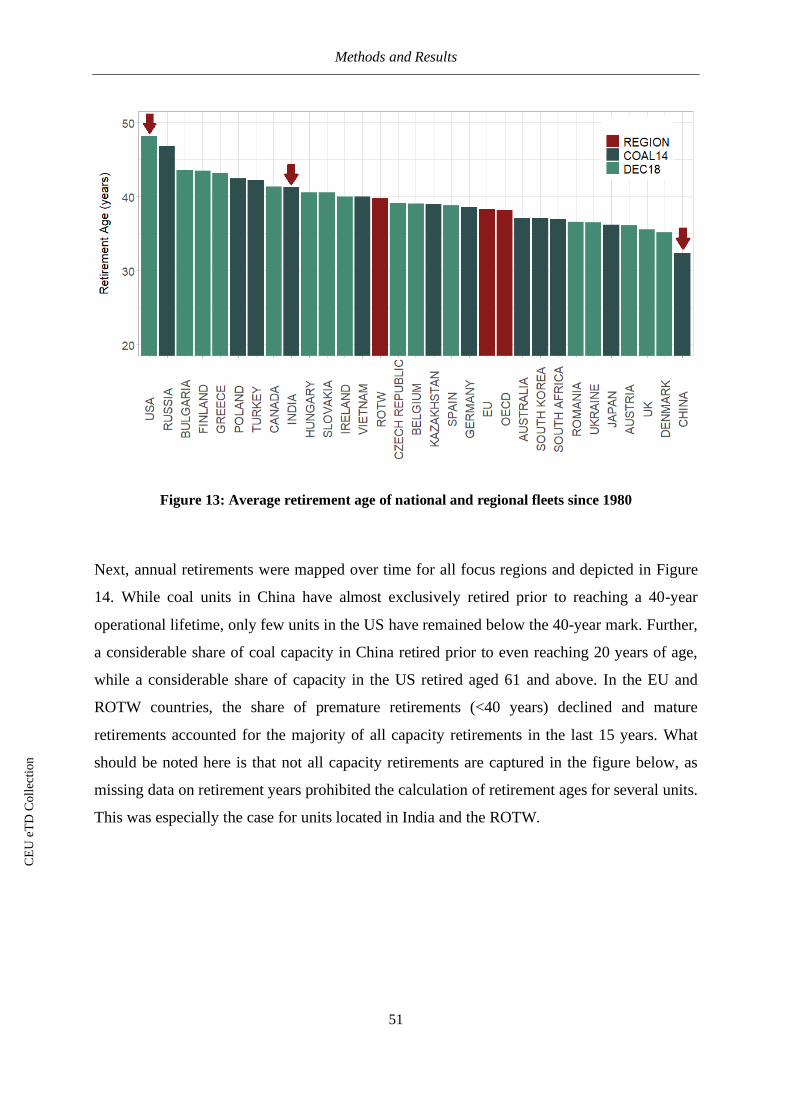
Methods and Results
51
Figure 13: Average retirement age of national and regional fleets since 1980
Next, annual retirements were mapped over time for all focus regions and depicted in Figure
14. While coal units in China have almost exclusively retired prior to reaching a 40-year
operational lifetime, only few units in the US have remained below the 40-year mark. Further,
a considerable share of coal capacity in China retired prior to even reaching 20 years of age,
while a considerable share of capacity in the US retired aged 61 and above. In the EU and
ROTW countries, the share of premature retirements (<40 years) declined and mature
retirements accounted for the majority of all capacity retirements in the last 15 years. What
should be noted here is that not all capacity retirements are captured in the figure below, as
missing data on retirement years prohibited the calculation of retirement ages for several units.
This was especially the case for units located in India and the ROTW.
CE
UeT
DC
olle
ctio
n
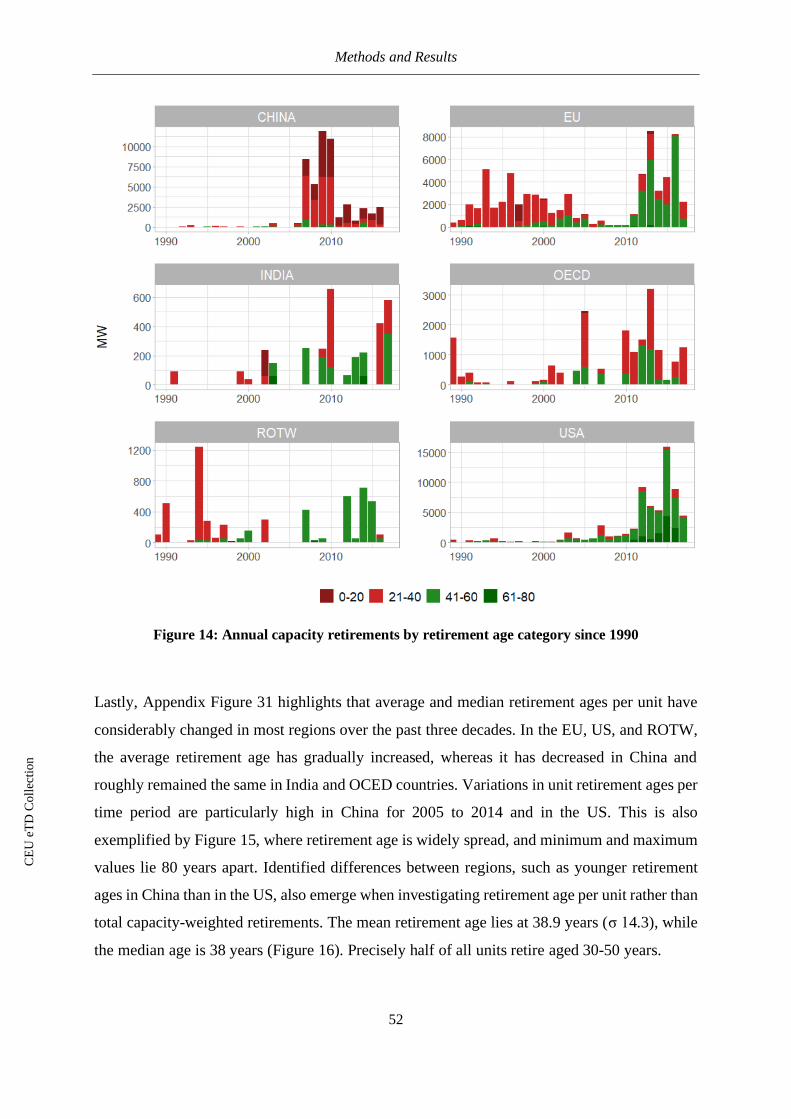
Methods and Results
52
Figure 14: Annual capacity retirements by retirement age category since 1990
Lastly, Appendix Figure 31 highlights that average and median retirement ages per unit have
considerably changed in most regions over the past three decades. In the EU, US, and ROTW,
the average retirement age has gradually increased, whereas it has decreased in China and
roughly remained the same in India and OCED countries. Variations in unit retirement ages per
time period are particularly high in China for 2005 to 2014 and in the US. This is also
exemplified by Figure 15, where retirement age is widely spread, and minimum and maximum
values lie 80 years apart. Identified differences between regions, such as younger retirement
ages in China than in the US, also emerge when investigating retirement age per unit rather than
total capacity-weighted retirements. The mean retirement age lies at 38.9 years (σ 14.3), while
the median age is 38 years (Figure 16). Precisely half of all units retire aged 30-50 years.
CE
UeT
DC
olle
ctio
n
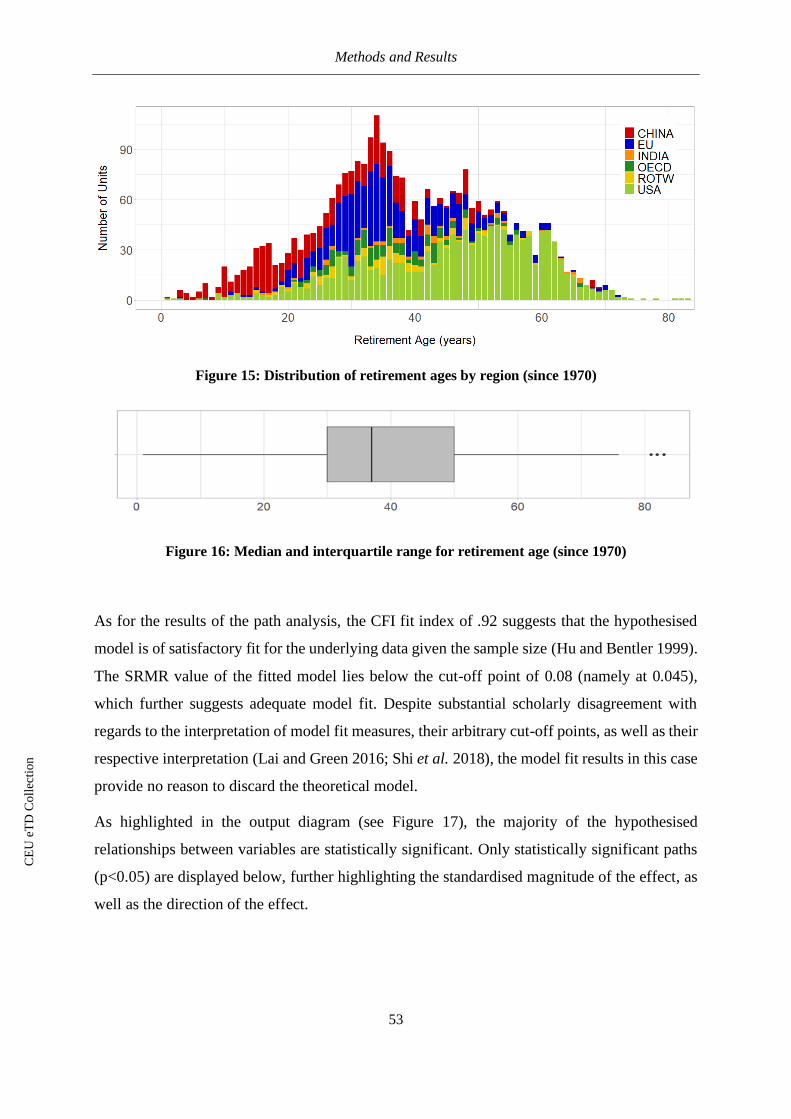
Methods and Results
53
Figure 15: Distribution of retirement ages by region (since 1970)
Figure 16: Median and interquartile range for retirement age (since 1970)
As for the results of the path analysis, the CFI fit index of .92 suggests that the hypothesised
model is of satisfactory fit for the underlying data given the sample size (Hu and Bentler 1999).
The SRMR value of the fitted model lies below the cut-off point of 0.08 (namely at 0.045),
which further suggests adequate model fit. Despite substantial scholarly disagreement with
regards to the interpretation of model fit measures, their arbitrary cut-off points, as well as their
respective interpretation (Lai and Green 2016; Shi et al. 2018), the model fit results in this case
provide no reason to discard the theoretical model.
As highlighted in the output diagram (see Figure 17), the majority of the hypothesised
relationships between variables are statistically significant. Only statistically significant paths
(p<0.05) are displayed below, further highlighting the standardised magnitude of the effect, as
well as the direction of the effect.
CE
UeT
DC
olle
ctio
n
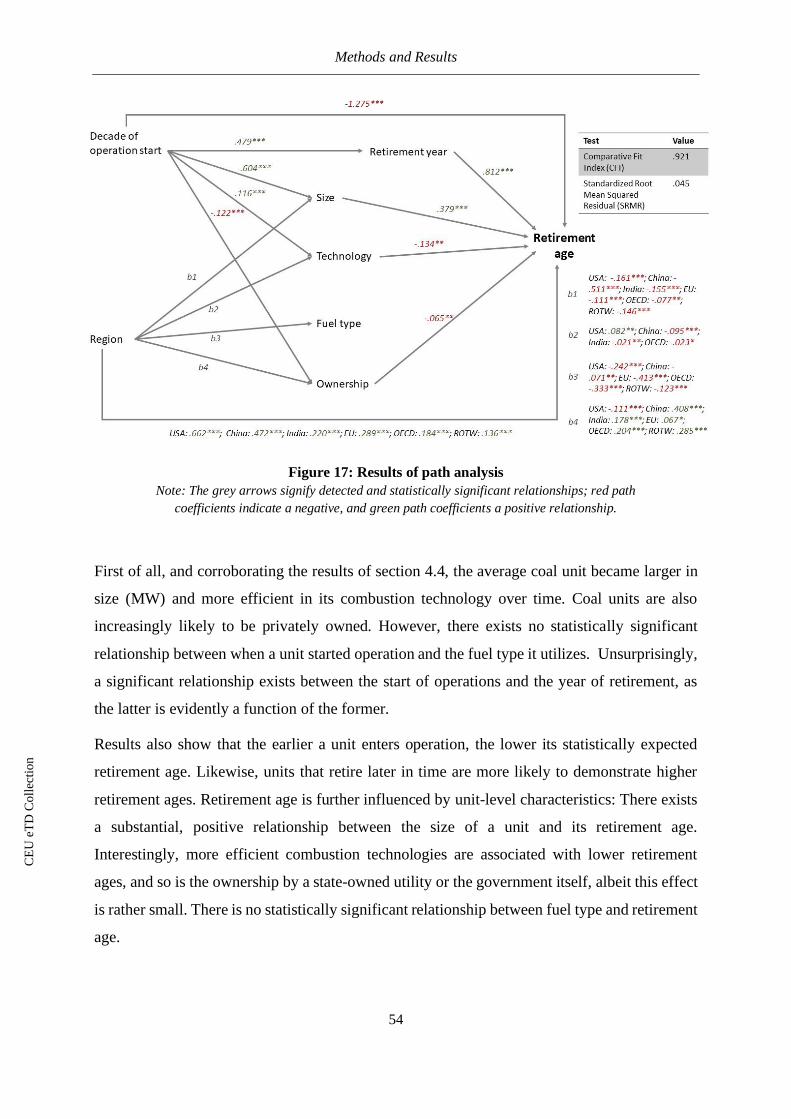
Methods and Results
54
Figure 17: Results of path analysis
Note: The grey arrows signify detected and statistically significant relationships; red path
coefficients indicate a negative, and green path coefficients a positive relationship.
First of all, and corroborating the results of section 4.4, the average coal unit became larger in
size (MW) and more efficient in its combustion technology over time. Coal units are also
increasingly likely to be privately owned. However, there exists no statistically significant
relationship between when a unit started operation and the fuel type it utilizes. Unsurprisingly,
a significant relationship exists between the start of operations and the year of retirement, as
the latter is evidently a function of the former.
Results also show that the earlier a unit enters operation, the lower its statistically expected
retirement age. Likewise, units that retire later in time are more likely to demonstrate higher
retirement ages. Retirement age is further influenced by unit-level characteristics: There exists
a substantial, positive relationship between the size of a unit and its retirement age.
Interestingly, more efficient combustion technologies are associated with lower retirement
ages, and so is the ownership by a state-owned utility or the government itself, albeit this effect
is rather small. There is no statistically significant relationship between fuel type and retirement
age.
CE
UeT
DC
olle
ctio
n
Methods and Results
55
On average, all six world regions have significantly smaller units than the reference category,
which was specifically the case for China. While US units were significantly more efficient
(used supercritical technology), units in China, India, and the OECD were significantly less
efficient. However, all regional effects on technology are comparatively small. Coal in five of
the regions was of lower quality, but especially so in the rest of the EU and OECD countries.
Finally, only US units are more likely to be privately owned, while they are more likely to be
state-owned in all other regions, especially in China. With regards to the direct effect of plant
location on the retirement age, all relationships are positive and highly significant.
4.5.3 Limitations
Evidently, the model relies on explanatory variables that are present in the available dataset,
but there are numerous additional variables or factors that are likely to have a significant effect
on the retirement age. Thus, like any other model, it is a simplification of reality and further
constrained by the number and quality of variables at hand. Additionally, the dominance of
categorical variables over continuous ones notably reduces the depth of data and further
complicates the interpretation of relationships between all variables. Similarly, dummy coding
regions prohibited the unmediated comparison between the focus regions, and using the UK as
a reference point may be problematic in some ways, as the UK possesses over a unique coal
history.
While path coefficients generally range between -1 and 1, the standardised path coefficient
between decade of operation start and retirement age has the value of -1.275. This is a rare, but
possible occurrence in any kind of regression analysis and does not refute the significant
relationship between two variables or the goodness of model fit. It could, however, point to
undetected collinearity between variables. Lastly, the sample size was substantially reduced
when cases with missing values were excluded, which affected the different regions to varying
extents. This analysis constitutes a first exploration into the predictors of retirement age using
this particular data, but could be expanded by integrating additional unit-level variables, such
as annual CO2 emissions, or economic factors.
CE
UeT
DC
olle
ctio
n
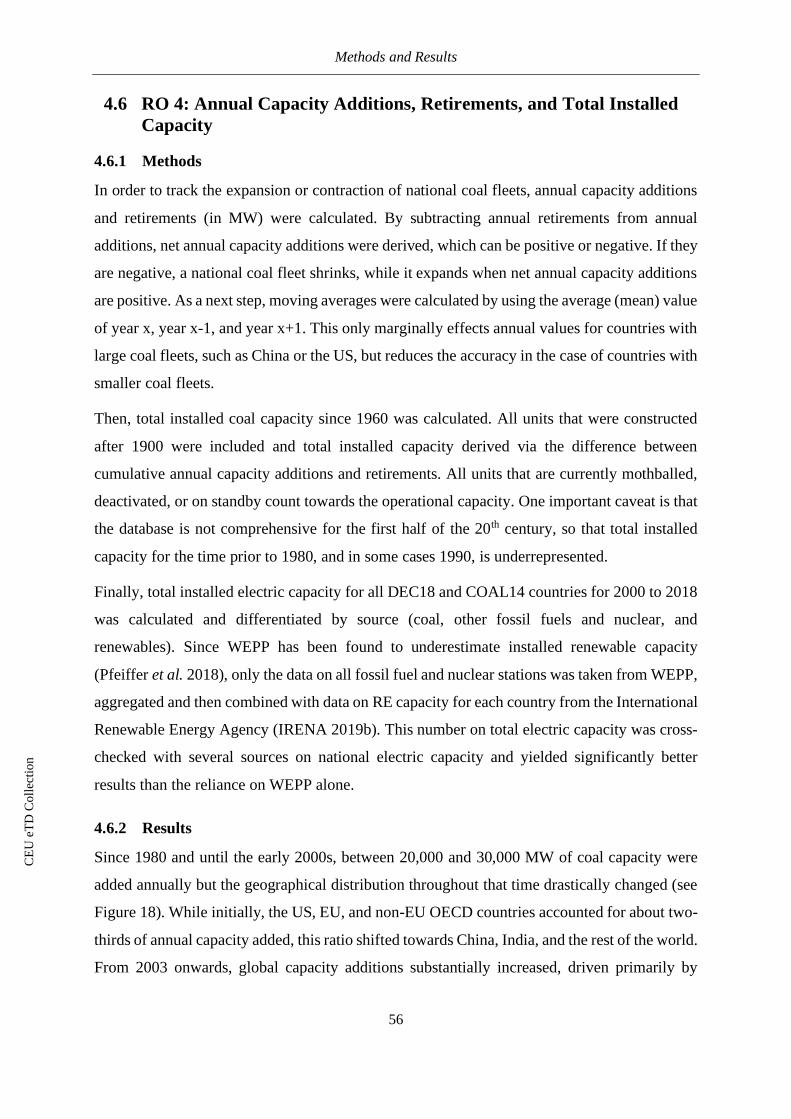
Methods and Results
56
4.6 RO 4: Annual Capacity Additions, Retirements, and Total Installed
Capacity
4.6.1 Methods
In order to track the expansion or contraction of national coal fleets, annual capacity additions
and retirements (in MW) were calculated. By subtracting annual retirements from annual
additions, net annual capacity additions were derived, which can be positive or negative. If they
are negative, a national coal fleet shrinks, while it expands when net annual capacity additions
are positive. As a next step, moving averages were calculated by using the average (mean) value
of year x, year x-1, and year x+1. This only marginally effects annual values for countries with
large coal fleets, such as China or the US, but reduces the accuracy in the case of countries with
smaller coal fleets.
Then, total installed coal capacity since 1960 was calculated. All units that were constructed
after 1900 were included and total installed capacity derived via the difference between
cumulative annual capacity additions and retirements. All units that are currently mothballed,
deactivated, or on standby count towards the operational capacity. One important caveat is that
the database is not comprehensive for the first half of the 20th century, so that total installed
capacity for the time prior to 1980, and in some cases 1990, is underrepresented.
Finally, total installed electric capacity for all DEC18 and COAL14 countries for 2000 to 2018
was calculated and differentiated by source (coal, other fossil fuels and nuclear, and
renewables). Since WEPP has been found to underestimate installed renewable capacity
(Pfeiffer et al. 2018), only the data on all fossil fuel and nuclear stations was taken from WEPP,
aggregated and then combined with data on RE capacity for each country from the International
Renewable Energy Agency (IRENA 2019b). This number on total electric capacity was cross-
checked with several sources on national electric capacity and yielded significantly better
results than the reliance on WEPP alone.
4.6.2 Results
Since 1980 and until the early 2000s, between 20,000 and 30,000 MW of coal capacity were
added annually but the geographical distribution throughout that time drastically changed (see
Figure 18). While initially, the US, EU, and non-EU OECD countries accounted for about two-
thirds of annual capacity added, this ratio shifted towards China, India, and the rest of the world.
From 2003 onwards, global capacity additions substantially increased, driven primarily by
CE
UeT
DC
olle
ctio
n
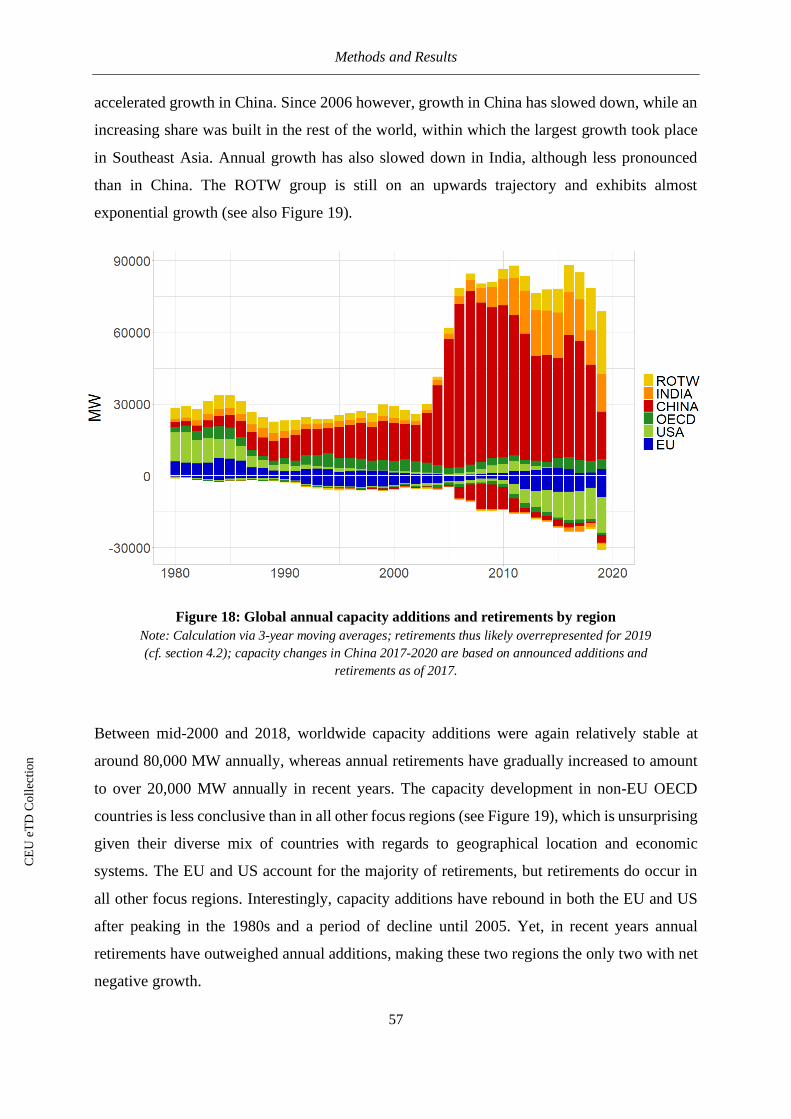
Methods and Results
57
accelerated growth in China. Since 2006 however, growth in China has slowed down, while an
increasing share was built in the rest of the world, within which the largest growth took place
in Southeast Asia. Annual growth has also slowed down in India, although less pronounced
than in China. The ROTW group is still on an upwards trajectory and exhibits almost
exponential growth (see also Figure 19).
Figure 18: Global annual capacity additions and retirements by region
Note: Calculation via 3-year moving averages; retirements thus likely overrepresented for 2019
(cf. section 4.2); capacity changes in China 2017-2020 are based on announced additions and
retirements as of 2017.
Between mid-2000 and 2018, worldwide capacity additions were again relatively stable at
around 80,000 MW annually, whereas annual retirements have gradually increased to amount
to over 20,000 MW annually in recent years. The capacity development in non-EU OECD
countries is less conclusive than in all other focus regions (see Figure 19), which is unsurprising
given their diverse mix of countries with regards to geographical location and economic
systems. The EU and US account for the majority of retirements, but retirements do occur in
all other focus regions. Interestingly, capacity additions have rebound in both the EU and US
after peaking in the 1980s and a period of decline until 2005. Yet, in recent years annual
retirements have outweighed annual additions, making these two regions the only two with net
negative growth.
CE
UeT
DC
olle
ctio
n
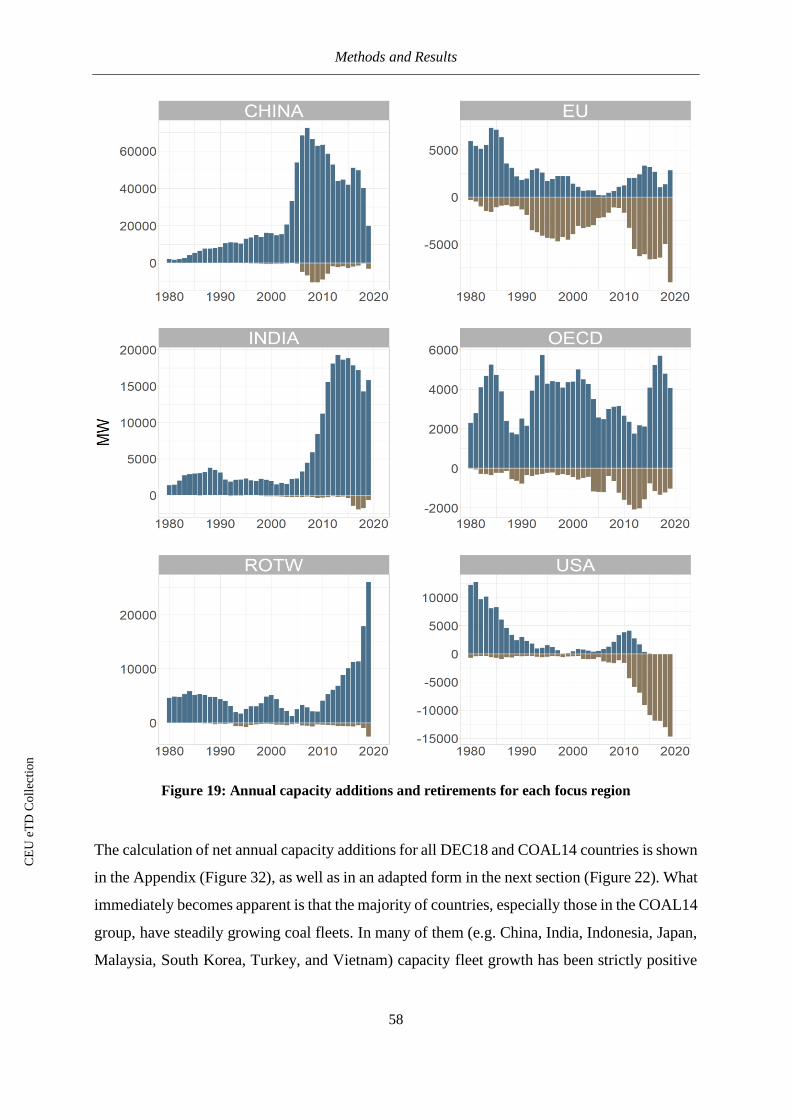
Methods and Results
58
Figure 19: Annual capacity additions and retirements for each focus region
The calculation of net annual capacity additions for all DEC18 and COAL14 countries is shown
in the Appendix (Figure 32), as well as in an adapted form in the next section (Figure 22). What
immediately becomes apparent is that the majority of countries, especially those in the COAL14
group, have steadily growing coal fleets. In many of them (e.g. China, India, Indonesia, Japan,
Malaysia, South Korea, Turkey, and Vietnam) capacity fleet growth has been strictly positive
CE
UeT
DC
olle
ctio
n
Methods and Results
59
over the whole time period of 1980 to 2019. While capacity growth has slowed down in some
of these countries, it has not done so in Indonesia, Malaysia, South Korea, Vietnam and Turkey.
There exist a handful of countries that exhibit a frequent change in trend and display both
periods of positive and negative growth, such as Australia, Germany, the Czech Republic, or
the Ukraine. In the former two countries, net capacity additions were predominantly positive in
the first half, and increasingly negative in the second half of the time period of investigation,
while the latter two countries exhibited growth in recent years.
In Austria, Canada, Denmark, Finland, Greece, Romania, Slovakia, and Spain (all DEC18
countries) coal fleets have been steadily and consistently shrinking for the last 20 years, while
in Belgium, the UK, and Hungary (also all DEC18) net capacity change was almost exclusively
negative over the last 40 years. For countries with smaller national coal fleets and fewer changes
to the coal fleet over 1980-2019 (e.g. Ireland, North Korea, Bulgaria), a trend is more difficult
to distinguish. Further, the effect of using 3-year moving averages becomes apparent (e.g.
Israel, Ireland), and should be kept in mind when interpreting absolute values.
With regards to total installed coal capacity, 16 of the 32 countries have presumably passed
their peak. In seven of them (Austria, Belgium, Canada, Denmark, Finland, Germany, and the
UK), total capacity has fallen below 87.5% of peak capacity, and in Austria, Belgium, Canada,
Denmark, and the UK, capacity has even fallen below 50%. While the first 25% of decline in
these countries took between 15 and 26 years (19.4 years on average), the second 25% of
decline took between 2 and 19 years (8.4 years on average), and the next 25% of decline even
shorter (6 years on average). While the latter is only based on observations from three countries
(Austria, Belgium, UK), there appears to be a general trend according to which the decline in
capacity starts off slowly and then accelerates. As of now, it is too early to establish whether
the decline in capacity slows down again for the last 25%, as would be suggested by an inverted
S-curve trajectory.
An observation that holds true for all countries that have passed their capacity peak or are likely
to do so soon is that the plateau period surrounding peak capacity lasts for a comparatively long
time. Here defined as the time in which capacity is ± 12.5% of its peak, the plateau generally
lasted over 20 years (25 years on average). Capacity has been particularly stable for a long time
in the Czech Republic, Romania, Spain, the Ukraine, and the US.
CE
UeT
DC
olle
ctio
n
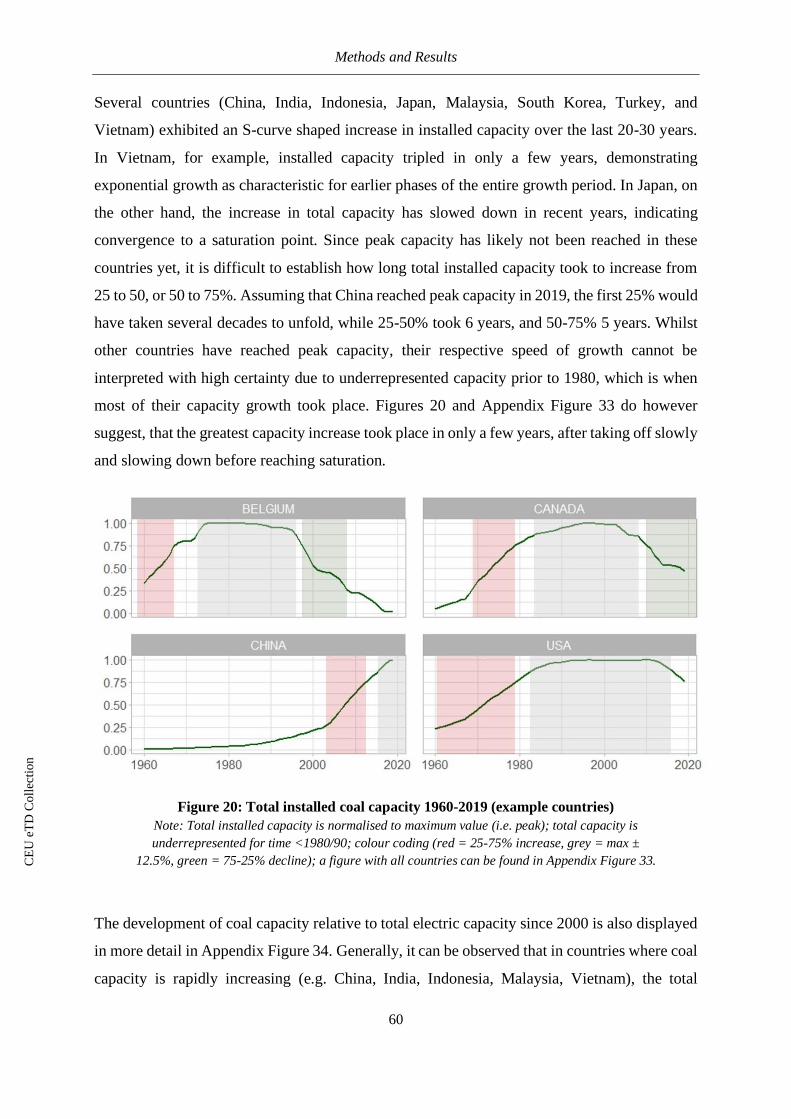
Methods and Results
60
Several countries (China, India, Indonesia, Japan, Malaysia, South Korea, Turkey, and
Vietnam) exhibited an S-curve shaped increase in installed capacity over the last 20-30 years.
In Vietnam, for example, installed capacity tripled in only a few years, demonstrating
exponential growth as characteristic for earlier phases of the entire growth period. In Japan, on
the other hand, the increase in total capacity has slowed down in recent years, indicating
convergence to a saturation point. Since peak capacity has likely not been reached in these
countries yet, it is difficult to establish how long total installed capacity took to increase from
25 to 50, or 50 to 75%. Assuming that China reached peak capacity in 2019, the first 25% would
have taken several decades to unfold, while 25-50% took 6 years, and 50-75% 5 years. Whilst
other countries have reached peak capacity, their respective speed of growth cannot be
interpreted with high certainty due to underrepresented capacity prior to 1980, which is when
most of their capacity growth took place. Figures 20 and Appendix Figure 33 do however
suggest, that the greatest capacity increase took place in only a few years, after taking off slowly
and slowing down before reaching saturation.
Figure 20: Total installed coal capacity 1960-2019 (example countries)
Note: Total installed capacity is normalised to maximum value (i.e. peak); total capacity is
underrepresented for time <1980/90; colour coding (red = 25-75% increase, grey = max ±
12.5%, green = 75-25% decline); a figure with all countries can be found in Appendix Figure 33.
The development of coal capacity relative to total electric capacity since 2000 is also displayed
in more detail in Appendix Figure 34. Generally, it can be observed that in countries where coal
capacity is rapidly increasing (e.g. China, India, Indonesia, Malaysia, Vietnam), the total
CE
UeT
DC
olle
ctio
n
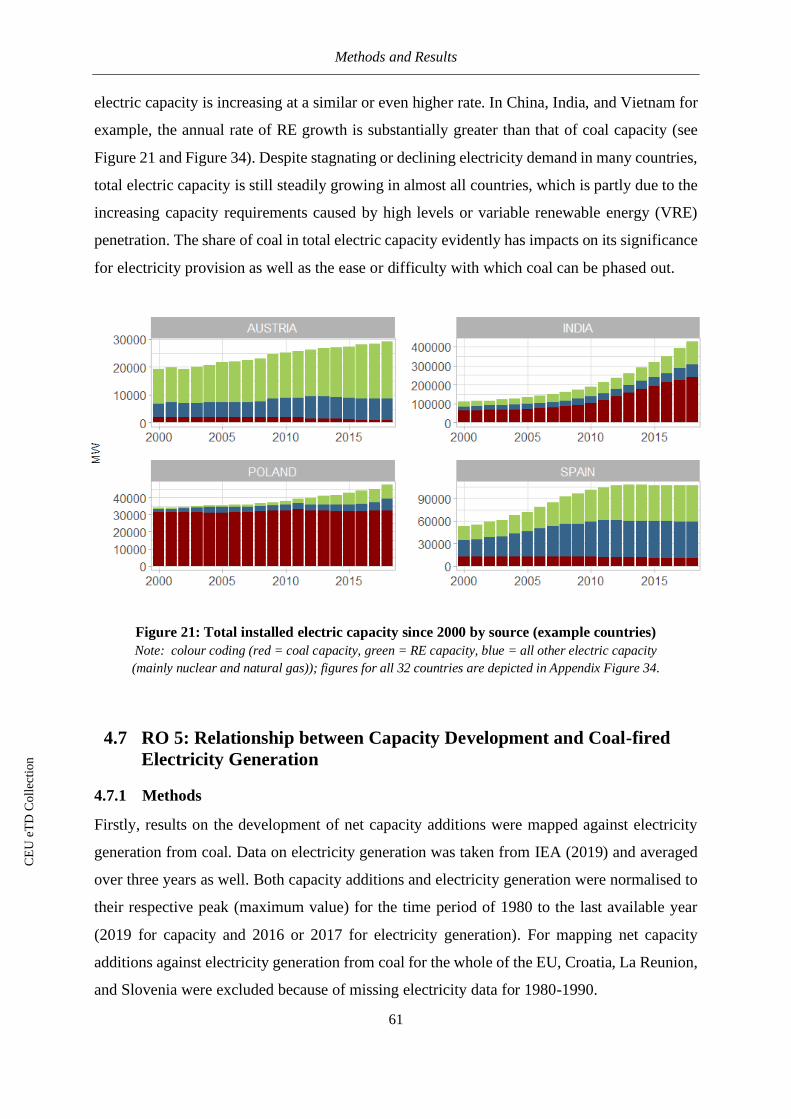
Methods and Results
61
electric capacity is increasing at a similar or even higher rate. In China, India, and Vietnam for
example, the annual rate of RE growth is substantially greater than that of coal capacity (see
Figure 21 and Figure 34). Despite stagnating or declining electricity demand in many countries,
total electric capacity is still steadily growing in almost all countries, which is partly due to the
increasing capacity requirements caused by high levels or variable renewable energy (VRE)
penetration. The share of coal in total electric capacity evidently has impacts on its significance
for electricity provision as well as the ease or difficulty with which coal can be phased out.
Figure 21: Total installed electric capacity since 2000 by source (example countries)
Note: colour coding (red = coal capacity, green = RE capacity, blue = all other electric capacity
(mainly nuclear and natural gas)); figures for all 32 countries are depicted in Appendix Figure 34.
4.7 RO 5: Relationship between Capacity Development and Coal-fired
Electricity Generation
4.7.1 Methods
Firstly, results on the development of net capacity additions were mapped against electricity
generation from coal. Data on electricity generation was taken from IEA (2019) and averaged
over three years as well. Both capacity additions and electricity generation were normalised to
their respective peak (maximum value) for the time period of 1980 to the last available year
(2019 for capacity and 2016 or 2017 for electricity generation). For mapping net capacity
additions against electricity generation from coal for the whole of the EU, Croatia, La Reunion,
and Slovenia were excluded because of missing electricity data for 1980-1990.
CE
UeT
DC
olle
ctio
n
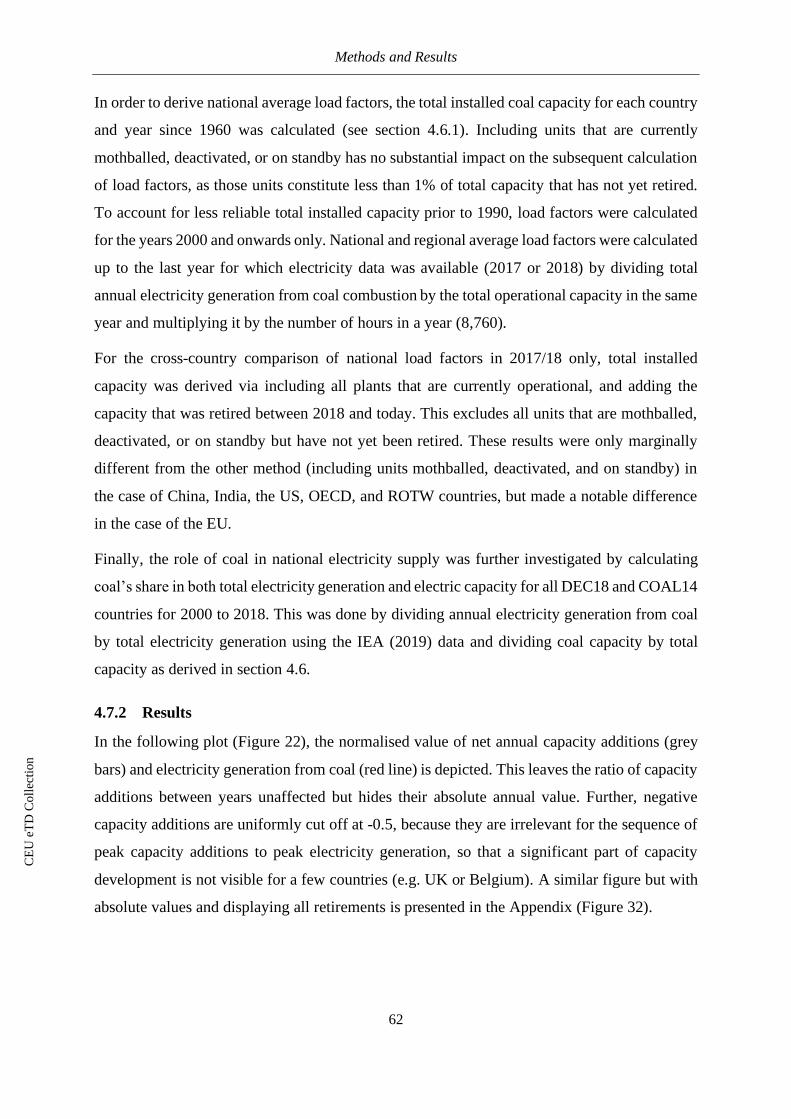
Methods and Results
62
In order to derive national average load factors, the total installed coal capacity for each country
and year since 1960 was calculated (see section 4.6.1). Including units that are currently
mothballed, deactivated, or on standby has no substantial impact on the subsequent calculation
of load factors, as those units constitute less than 1% of total capacity that has not yet retired.
To account for less reliable total installed capacity prior to 1990, load factors were calculated
for the years 2000 and onwards only. National and regional average load factors were calculated
up to the last year for which electricity data was available (2017 or 2018) by dividing total
annual electricity generation from coal combustion by the total operational capacity in the same
year and multiplying it by the number of hours in a year (8,760).
For the cross-country comparison of national load factors in 2017/18 only, total installed
capacity was derived via including all plants that are currently operational, and adding the
capacity that was retired between 2018 and today. This excludes all units that are mothballed,
deactivated, or on standby but have not yet been retired. These results were only marginally
different from the other method (including units mothballed, deactivated, and on standby) in
the case of China, India, the US, OECD, and ROTW countries, but made a notable difference
in the case of the EU.
Finally, the role of coal in national electricity supply was further investigated by calculating
coal’s share in both total electricity generation and electric capacity for all DEC18 and COAL14
countries for 2000 to 2018. This was done by dividing annual electricity generation from coal
by total electricity generation using the IEA (2019) data and dividing coal capacity by total
capacity as derived in section 4.6.
4.7.2 Results
In the following plot (Figure 22), the normalised value of net annual capacity additions (grey
bars) and electricity generation from coal (red line) is depicted. This leaves the ratio of capacity
additions between years unaffected but hides their absolute annual value. Further, negative
capacity additions are uniformly cut off at -0.5, because they are irrelevant for the sequence of
peak capacity additions to peak electricity generation, so that a significant part of capacity
development is not visible for a few countries (e.g. UK or Belgium). A similar figure but with
absolute values and displaying all retirements is presented in the Appendix (Figure 32).
CE
UeT
DC
olle
ctio
n
Methods and Results
63
CE
UeT
DC
olle
ctio
n
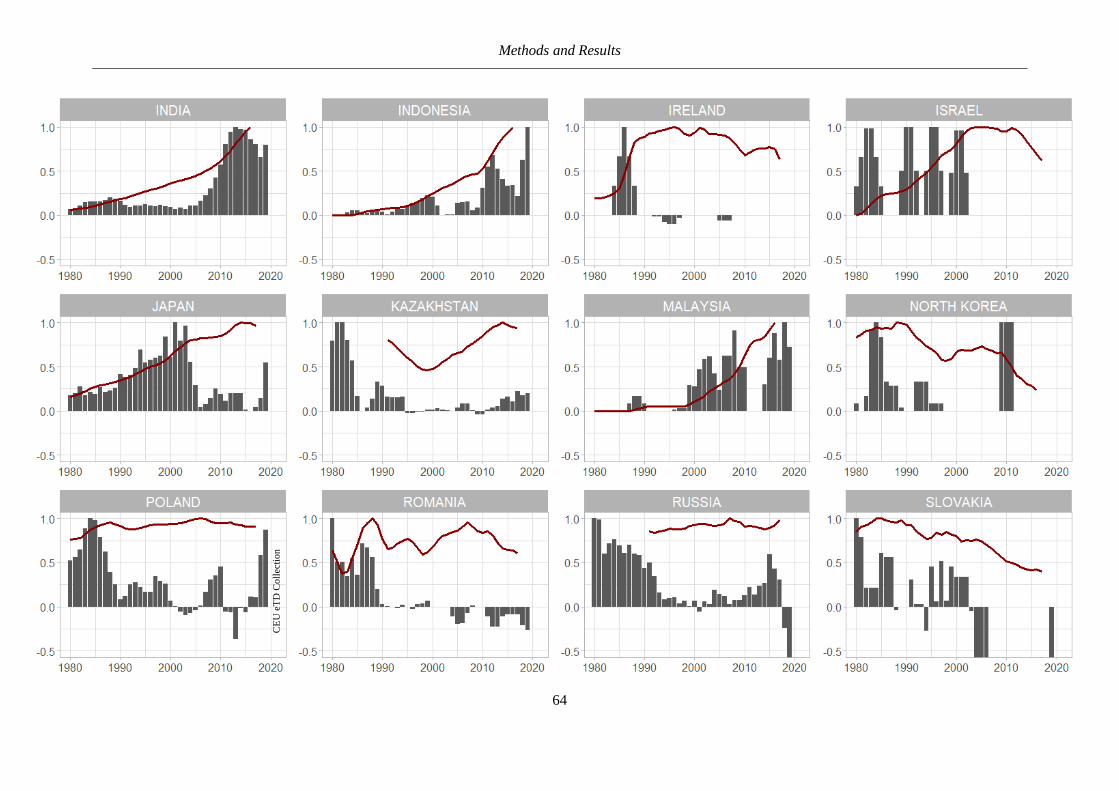
Methods and Results
64
CE
UeT
DC
olle
ctio
n
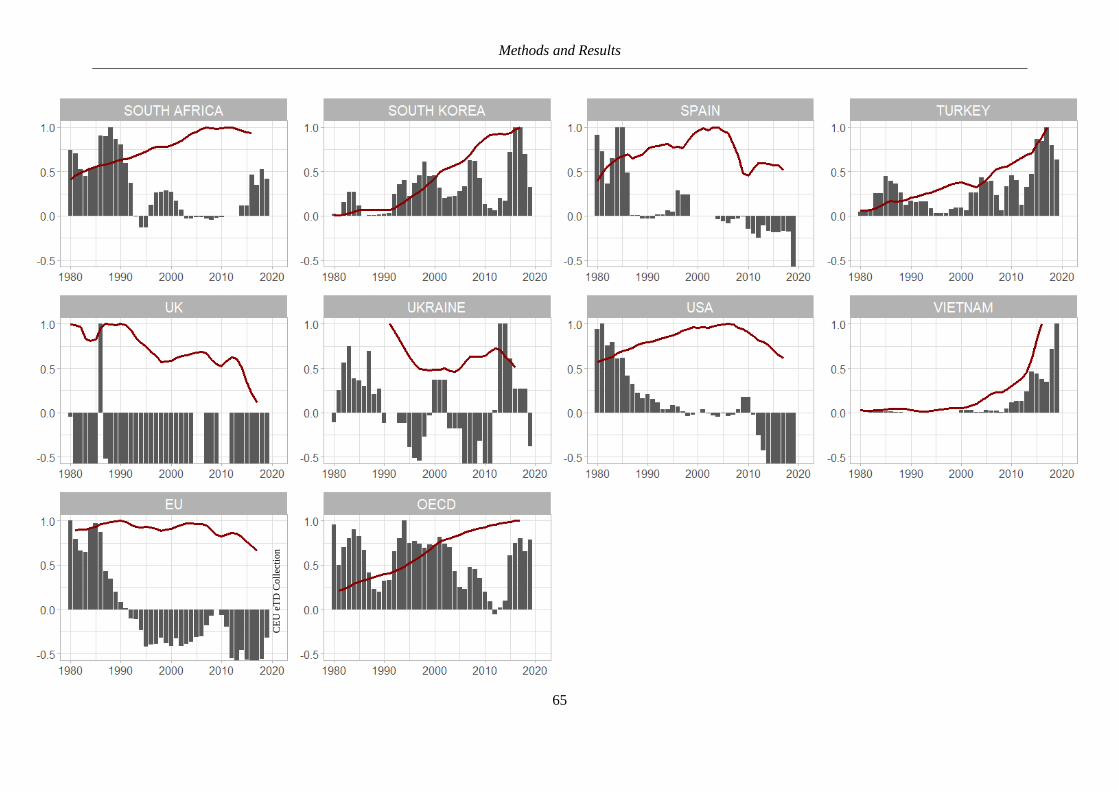
Methods and Results
65
CE
UeT
DC
olle
ctio
n
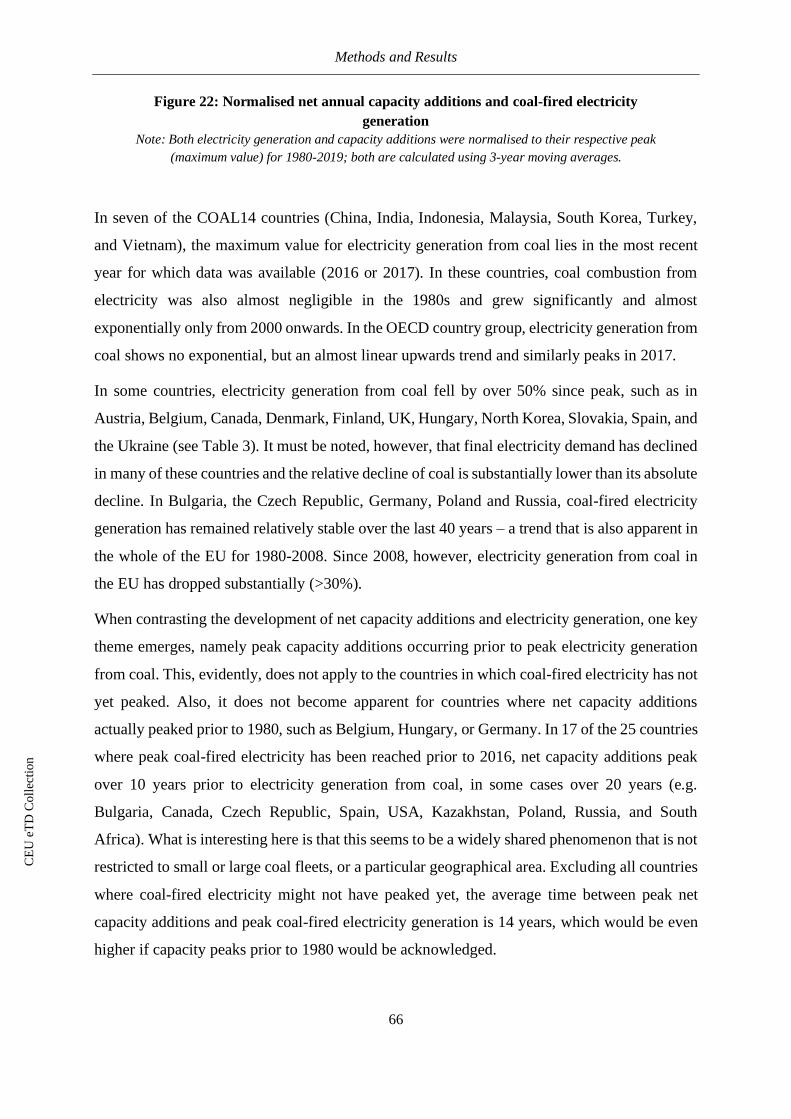
Methods and Results
66
Figure 22: Normalised net annual capacity additions and coal-fired electricity
generation
Note: Both electricity generation and capacity additions were normalised to their respective peak
(maximum value) for 1980-2019; both are calculated using 3-year moving averages.
In seven of the COAL14 countries (China, India, Indonesia, Malaysia, South Korea, Turkey,
and Vietnam), the maximum value for electricity generation from coal lies in the most recent
year for which data was available (2016 or 2017). In these countries, coal combustion from
electricity was also almost negligible in the 1980s and grew significantly and almost
exponentially only from 2000 onwards. In the OECD country group, electricity generation from
coal shows no exponential, but an almost linear upwards trend and similarly peaks in 2017.
In some countries, electricity generation from coal fell by over 50% since peak, such as in
Austria, Belgium, Canada, Denmark, Finland, UK, Hungary, North Korea, Slovakia, Spain, and
the Ukraine (see Table 3). It must be noted, however, that final electricity demand has declined
in many of these countries and the relative decline of coal is substantially lower than its absolute
decline. In Bulgaria, the Czech Republic, Germany, Poland and Russia, coal-fired electricity
generation has remained relatively stable over the last 40 years – a trend that is also apparent in
the whole of the EU for 1980-2008. Since 2008, however, electricity generation from coal in
the EU has dropped substantially (>30%).
When contrasting the development of net capacity additions and electricity generation, one key
theme emerges, namely peak capacity additions occurring prior to peak electricity generation
from coal. This, evidently, does not apply to the countries in which coal-fired electricity has not
yet peaked. Also, it does not become apparent for countries where net capacity additions
actually peaked prior to 1980, such as Belgium, Hungary, or Germany. In 17 of the 25 countries
where peak coal-fired electricity has been reached prior to 2016, net capacity additions peak
over 10 years prior to electricity generation from coal, in some cases over 20 years (e.g.
Bulgaria, Canada, Czech Republic, Spain, USA, Kazakhstan, Poland, Russia, and South
Africa). What is interesting here is that this seems to be a widely shared phenomenon that is not
restricted to small or large coal fleets, or a particular geographical area. Excluding all countries
where coal-fired electricity might not have peaked yet, the average time between peak net
capacity additions and peak coal-fired electricity generation is 14 years, which would be even
higher if capacity peaks prior to 1980 would be acknowledged.
CE
UeT
DC
olle
ctio
n
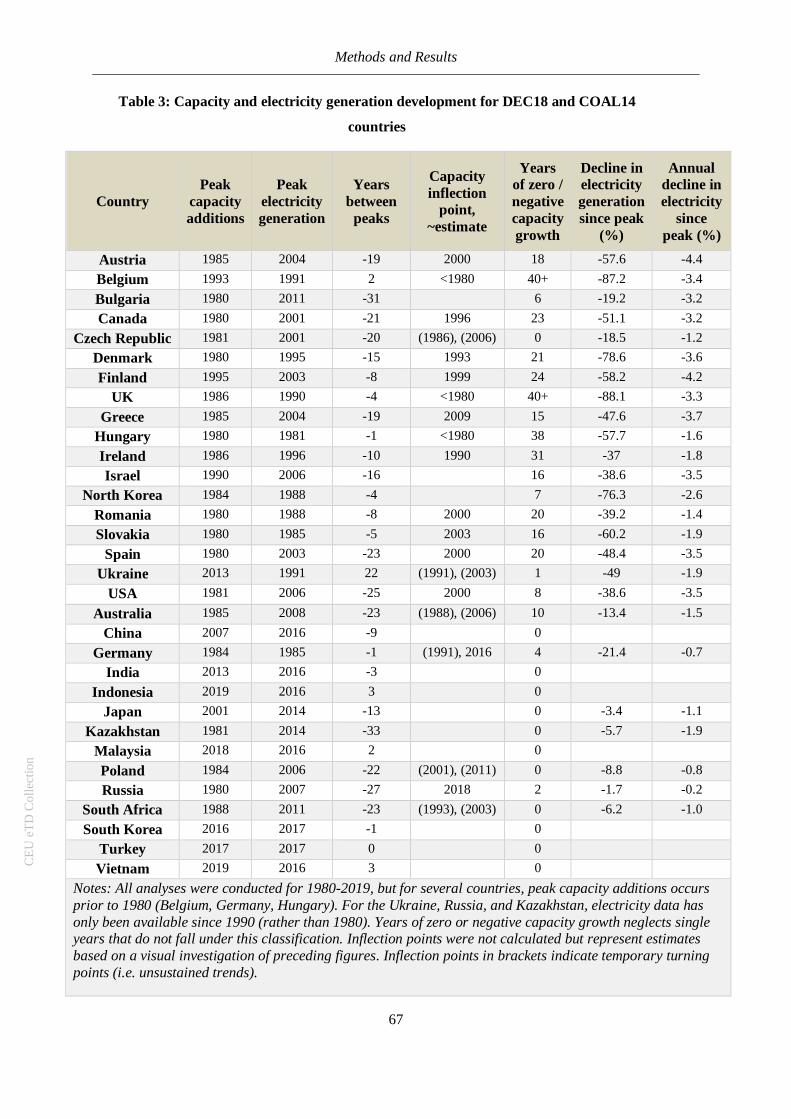
Methods and Results
67
Table 3: Capacity and electricity generation development for DEC18 and COAL14
countries
Country
Peak
capacity
additions
Peak
electricity
generation
Years
between
peaks
Capacity
inflection
point,
~estimate
Years
of zero /
negative
capacity
growth
Decline in
electricity
generation
since peak
(%)
Annual
decline in
electricity
since
peak (%)
Austria 1985 2004 -19 2000 18 -57.6 -4.4
Belgium 1993 1991 2 <1980 40+ -87.2 -3.4
Bulgaria 1980 2011 -31
6 -19.2 -3.2
Canada 1980 2001 -21 1996 23 -51.1 -3.2
Czech Republic 1981 2001 -20 (1986), (2006) 0 -18.5 -1.2
Denmark 1980 1995 -15 1993 21 -78.6 -3.6
Finland 1995 2003 -8 1999 24 -58.2 -4.2
UK 1986 1990 -4 <1980 40+ -88.1 -3.3
Greece 1985 2004 -19 2009 15 -47.6 -3.7
Hungary 1980 1981 -1 <1980 38 -57.7 -1.6
Ireland 1986 1996 -10 1990 31 -37 -1.8
Israel 1990 2006 -16
16 -38.6 -3.5
North Korea 1984 1988 -4
7 -76.3 -2.6
Romania 1980 1988 -8 2000 20 -39.2 -1.4
Slovakia 1980 1985 -5 2003 16 -60.2 -1.9
Spain 1980 2003 -23 2000 20 -48.4 -3.5
Ukraine 2013 1991 22 (1991), (2003) 1 -49 -1.9
USA 1981 2006 -25 2000 8 -38.6 -3.5
Australia 1985 2008 -23 (1988), (2006) 10 -13.4 -1.5
China 2007 2016 -9
0
Germany 1984 1985 -1 (1991), 2016 4 -21.4 -0.7
India 2013 2016 -3
0
Indonesia 2019 2016 3
0
Japan 2001 2014 -13
0 -3.4 -1.1
Kazakhstan 1981 2014 -33
0 -5.7 -1.9
Malaysia 2018 2016 2
0
Poland 1984 2006 -22 (2001), (2011) 0 -8.8 -0.8
Russia 1980 2007 -27 2018 2 -1.7 -0.2
South Africa 1988 2011 -23 (1993), (2003) 0 -6.2 -1.0
South Korea 2016 2017 -1
0
Turkey 2017 2017 0
0
Vietnam 2019 2016 3
0
Notes: All analyses were conducted for 1980-2019, but for several countries, peak capacity additions occurs
prior to 1980 (Belgium, Germany, Hungary). For the Ukraine, Russia, and Kazakhstan, electricity data has
only been available since 1990 (rather than 1980). Years of zero or negative capacity growth neglects single years that do not fall under this classification. Inflection points were not calculated but represent estimates
based on a visual investigation of preceding figures. Inflection points in brackets indicate temporary turning
points (i.e. unsustained trends).
CE
UeT
DC
olle
ctio
n
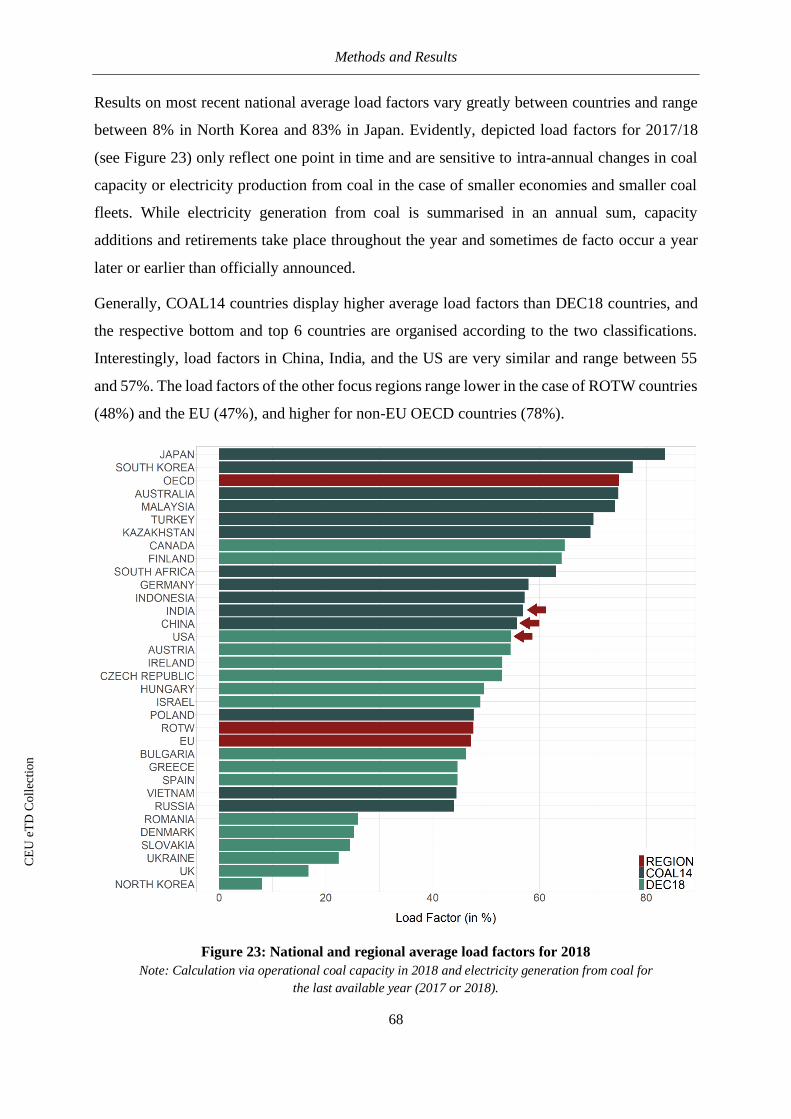
Methods and Results
68
Results on most recent national average load factors vary greatly between countries and range
between 8% in North Korea and 83% in Japan. Evidently, depicted load factors for 2017/18
(see Figure 23) only reflect one point in time and are sensitive to intra-annual changes in coal
capacity or electricity production from coal in the case of smaller economies and smaller coal
fleets. While electricity generation from coal is summarised in an annual sum, capacity
additions and retirements take place throughout the year and sometimes de facto occur a year
later or earlier than officially announced.
Generally, COAL14 countries display higher average load factors than DEC18 countries, and
the respective bottom and top 6 countries are organised according to the two classifications.
Interestingly, load factors in China, India, and the US are very similar and range between 55
and 57%. The load factors of the other focus regions range lower in the case of ROTW countries
(48%) and the EU (47%), and higher for non-EU OECD countries (78%).
Figure 23: National and regional average load factors for 2018
Note: Calculation via operational coal capacity in 2018 and electricity generation from coal for
the last available year (2017 or 2018).
CE
UeT
DC
olle
ctio
n
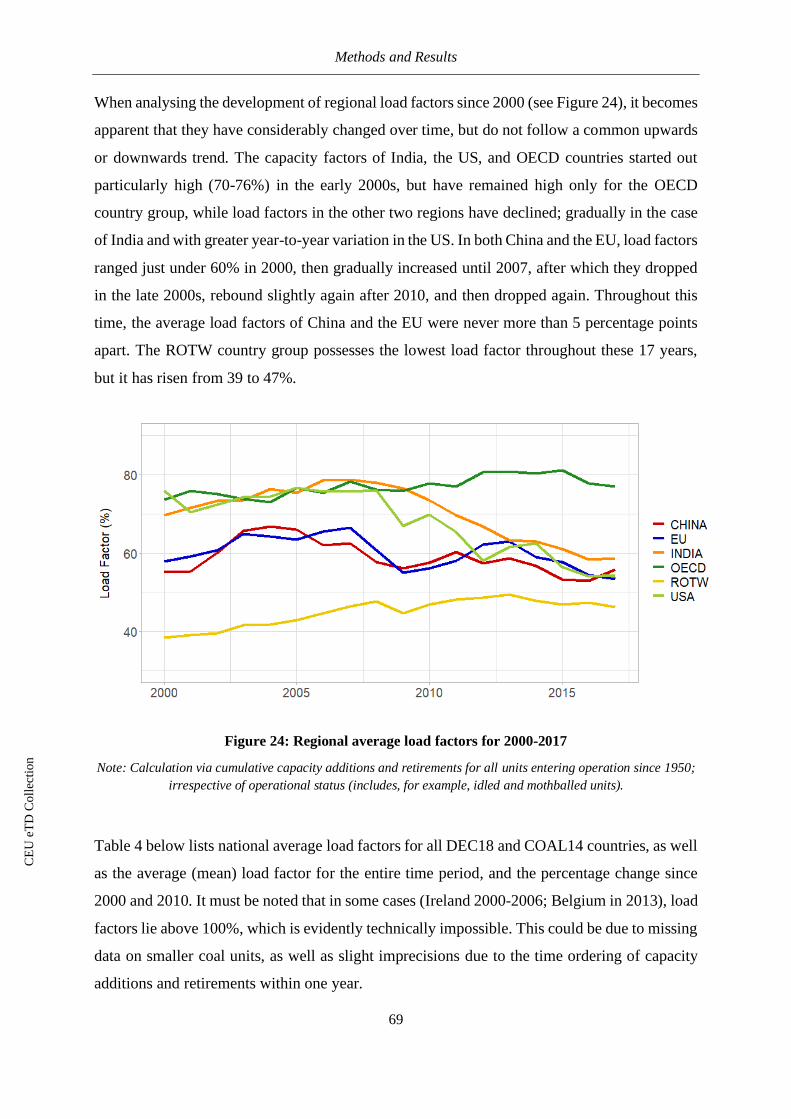
Methods and Results
69
When analysing the development of regional load factors since 2000 (see Figure 24), it becomes
apparent that they have considerably changed over time, but do not follow a common upwards
or downwards trend. The capacity factors of India, the US, and OECD countries started out
particularly high (70-76%) in the early 2000s, but have remained high only for the OECD
country group, while load factors in the other two regions have declined; gradually in the case
of India and with greater year-to-year variation in the US. In both China and the EU, load factors
ranged just under 60% in 2000, then gradually increased until 2007, after which they dropped
in the late 2000s, rebound slightly again after 2010, and then dropped again. Throughout this
time, the average load factors of China and the EU were never more than 5 percentage points
apart. The ROTW country group possesses the lowest load factor throughout these 17 years,
but it has risen from 39 to 47%.
Figure 24: Regional average load factors for 2000-2017
Note: Calculation via cumulative capacity additions and retirements for all units entering operation since 1950;
irrespective of operational status (includes, for example, idled and mothballed units).
Table 4 below lists national average load factors for all DEC18 and COAL14 countries, as well
as the average (mean) load factor for the entire time period, and the percentage change since
2000 and 2010. It must be noted that in some cases (Ireland 2000-2006; Belgium in 2013), load
factors lie above 100%, which is evidently technically impossible. This could be due to missing
data on smaller coal units, as well as slight imprecisions due to the time ordering of capacity
additions and retirements within one year.
CE
UeT
DC
olle
ctio
n
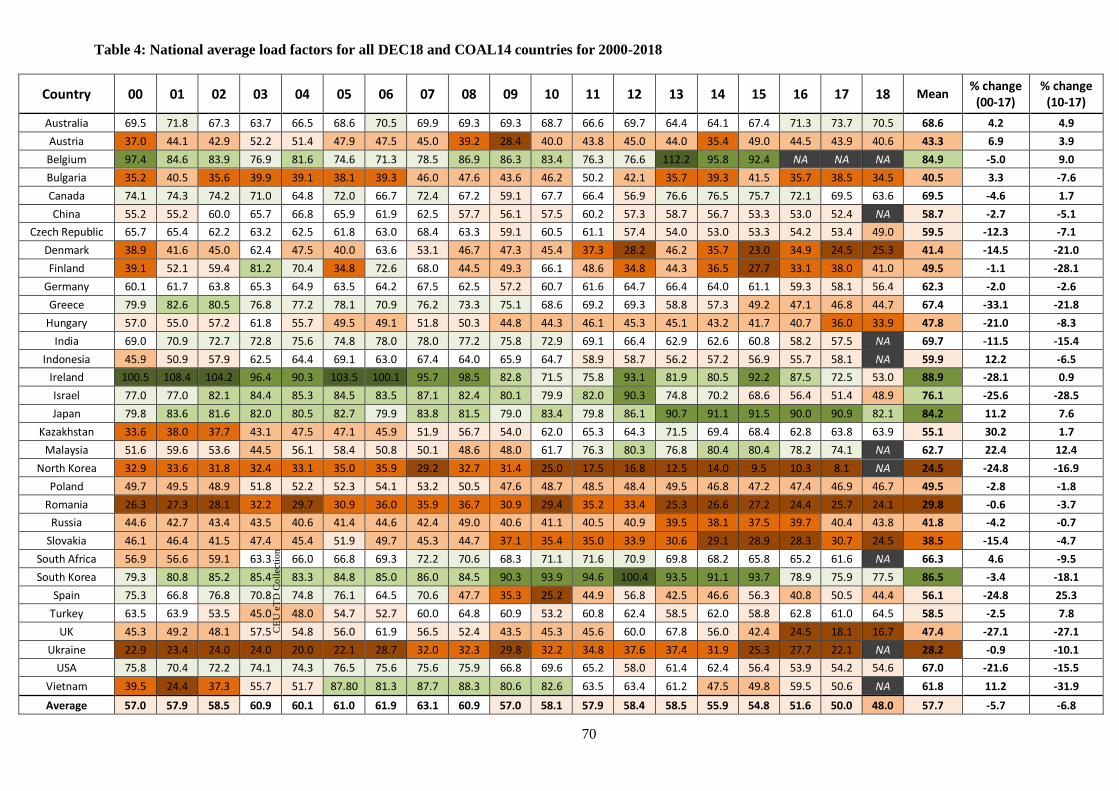
70
Table 4: National average load factors for all DEC18 and COAL14 countries for 2000-2018
Country 00 01 02 03 04 05 06 07 08 09 10 11 12 13 14 15 16 17 18 Mean % change
(00-17) % change
(10-17)
Australia 69.5 71.8 67.3 63.7 66.5 68.6 70.5 69.9 69.3 69.3 68.7 66.6 69.7 64.4 64.1 67.4 71.3 73.7 70.5 68.6 4.2 4.9
Austria 37.0 44.1 42.9 52.2 51.4 47.9 47.5 45.0 39.2 28.4 40.0 43.8 45.0 44.0 35.4 49.0 44.5 43.9 40.6 43.3 6.9 3.9
Belgium 97.4 84.6 83.9 76.9 81.6 74.6 71.3 78.5 86.9 86.3 83.4 76.3 76.6 112.2 95.8 92.4 NA NA NA 84.9 -5.0 9.0
Bulgaria 35.2 40.5 35.6 39.9 39.1 38.1 39.3 46.0 47.6 43.6 46.2 50.2 42.1 35.7 39.3 41.5 35.7 38.5 34.5 40.5 3.3 -7.6
Canada 74.1 74.3 74.2 71.0 64.8 72.0 66.7 72.4 67.2 59.1 67.7 66.4 56.9 76.6 76.5 75.7 72.1 69.5 63.6 69.5 -4.6 1.7
China 55.2 55.2 60.0 65.7 66.8 65.9 61.9 62.5 57.7 56.1 57.5 60.2 57.3 58.7 56.7 53.3 53.0 52.4 NA 58.7 -2.7 -5.1
Czech Republic 65.7 65.4 62.2 63.2 62.5 61.8 63.0 68.4 63.3 59.1 60.5 61.1 57.4 54.0 53.0 53.3 54.2 53.4 49.0 59.5 -12.3 -7.1
Denmark 38.9 41.6 45.0 62.4 47.5 40.0 63.6 53.1 46.7 47.3 45.4 37.3 28.2 46.2 35.7 23.0 34.9 24.5 25.3 41.4 -14.5 -21.0
Finland 39.1 52.1 59.4 81.2 70.4 34.8 72.6 68.0 44.5 49.3 66.1 48.6 34.8 44.3 36.5 27.7 33.1 38.0 41.0 49.5 -1.1 -28.1
Germany 60.1 61.7 63.8 65.3 64.9 63.5 64.2 67.5 62.5 57.2 60.7 61.6 64.7 66.4 64.0 61.1 59.3 58.1 56.4 62.3 -2.0 -2.6
Greece 79.9 82.6 80.5 76.8 77.2 78.1 70.9 76.2 73.3 75.1 68.6 69.2 69.3 58.8 57.3 49.2 47.1 46.8 44.7 67.4 -33.1 -21.8
Hungary 57.0 55.0 57.2 61.8 55.7 49.5 49.1 51.8 50.3 44.8 44.3 46.1 45.3 45.1 43.2 41.7 40.7 36.0 33.9 47.8 -21.0 -8.3
India 69.0 70.9 72.7 72.8 75.6 74.8 78.0 78.0 77.2 75.8 72.9 69.1 66.4 62.9 62.6 60.8 58.2 57.5 NA 69.7 -11.5 -15.4
Indonesia 45.9 50.9 57.9 62.5 64.4 69.1 63.0 67.4 64.0 65.9 64.7 58.9 58.7 56.2 57.2 56.9 55.7 58.1 NA 59.9 12.2 -6.5
Ireland 100.5 108.4 104.2 96.4 90.3 103.5 100.1 95.7 98.5 82.8 71.5 75.8 93.1 81.9 80.5 92.2 87.5 72.5 53.0 88.9 -28.1 0.9
Israel 77.0 77.0 82.1 84.4 85.3 84.5 83.5 87.1 82.4 80.1 79.9 82.0 90.3 74.8 70.2 68.6 56.4 51.4 48.9 76.1 -25.6 -28.5
Japan 79.8 83.6 81.6 82.0 80.5 82.7 79.9 83.8 81.5 79.0 83.4 79.8 86.1 90.7 91.1 91.5 90.0 90.9 82.1 84.2 11.2 7.6
Kazakhstan 33.6 38.0 37.7 43.1 47.5 47.1 45.9 51.9 56.7 54.0 62.0 65.3 64.3 71.5 69.4 68.4 62.8 63.8 63.9 55.1 30.2 1.7
Malaysia 51.6 59.6 53.6 44.5 56.1 58.4 50.8 50.1 48.6 48.0 61.7 76.3 80.3 76.8 80.4 80.4 78.2 74.1 NA 62.7 22.4 12.4
North Korea 32.9 33.6 31.8 32.4 33.1 35.0 35.9 29.2 32.7 31.4 25.0 17.5 16.8 12.5 14.0 9.5 10.3 8.1 NA 24.5 -24.8 -16.9
Poland 49.7 49.5 48.9 51.8 52.2 52.3 54.1 53.2 50.5 47.6 48.7 48.5 48.4 49.5 46.8 47.2 47.4 46.9 46.7 49.5 -2.8 -1.8
Romania 26.3 27.3 28.1 32.2 29.7 30.9 36.0 35.9 36.7 30.9 29.4 35.2 33.4 25.3 26.6 27.2 24.4 25.7 24.1 29.8 -0.6 -3.7
Russia 44.6 42.7 43.4 43.5 40.6 41.4 44.6 42.4 49.0 40.6 41.1 40.5 40.9 39.5 38.1 37.5 39.7 40.4 43.8 41.8 -4.2 -0.7
Slovakia 46.1 46.4 41.5 47.4 45.4 51.9 49.7 45.3 44.7 37.1 35.4 35.0 33.9 30.6 29.1 28.9 28.3 30.7 24.5 38.5 -15.4 -4.7
South Africa 56.9 56.6 59.1 63.3 66.0 66.8 69.3 72.2 70.6 68.3 71.1 71.6 70.9 69.8 68.2 65.8 65.2 61.6 NA 66.3 4.6 -9.5
South Korea 79.3 80.8 85.2 85.4 83.3 84.8 85.0 86.0 84.5 90.3 93.9 94.6 100.4 93.5 91.1 93.7 78.9 75.9 77.5 86.5 -3.4 -18.1
Spain 75.3 66.8 76.8 70.8 74.8 76.1 64.5 70.6 47.7 35.3 25.2 44.9 56.8 42.5 46.6 56.3 40.8 50.5 44.4 56.1 -24.8 25.3
Turkey 63.5 63.9 53.5 45.0 48.0 54.7 52.7 60.0 64.8 60.9 53.2 60.8 62.4 58.5 62.0 58.8 62.8 61.0 64.5 58.5 -2.5 7.8
UK 45.3 49.2 48.1 57.5 54.8 56.0 61.9 56.5 52.4 43.5 45.3 45.6 60.0 67.8 56.0 42.4 24.5 18.1 16.7 47.4 -27.1 -27.1
Ukraine 22.9 23.4 24.0 24.0 20.0 22.1 28.7 32.0 32.3 29.8 32.2 34.8 37.6 37.4 31.9 25.3 27.7 22.1 NA 28.2 -0.9 -10.1
USA 75.8 70.4 72.2 74.1 74.3 76.5 75.6 75.6 75.9 66.8 69.6 65.2 58.0 61.4 62.4 56.4 53.9 54.2 54.6 67.0 -21.6 -15.5
Vietnam 39.5 24.4 37.3 55.7 51.7 87.80 81.3 87.7 88.3 80.6 82.6 63.5 63.4 61.2 47.5 49.8 59.5 50.6 NA 61.8 11.2 -31.9
Average 57.0 57.9 58.5 60.9 60.1 61.0 61.9 63.1 60.9 57.0 58.1 57.9 58.4 58.5 55.9 54.8 51.6 50.0 48.0 57.7 -5.7 -6.8
CE
UeT
DC
olle
ctio
n
Methods and Results
71
Overall, load factors differed greatly between countries and even within countries over the last
18 years. They tended to be highest on average between 2003 and 2008, while dropping
substantially since then. Load factors have been highly variable in Austria, Denmark, Finland,
Ireland, Malaysia, Spain and Vietnam, which all have relatively small coal fleets and
experienced a sudden rise or generally high deployment of natural gas. In Australia, Canada,
China, Germany, and Poland, on the other hand, load factor variability has been low. These
countries possess over larger coal fleets and their natural gas use is rather stable or limited.
The final part of this RO was to investigate the role of coal capacity relative to total electric
capacity and electricity generation from coal relative to total electricity generation. In nine of
the analysed countries, coal accounts for more than half of total electricity generation, and is
particularly high in South Africa and Poland (Figure 25). Generally, COAL14 countries tend to
use coal for a greater share of their electricity generation, while in more than half of all DEC18
countries, coal contributes less than 20% of total electricity. An exception to this are the Czech
Republic and Bulgaria, where coal accounts for over 50% of electricity generation.
CE
UeT
DC
olle
ctio
n
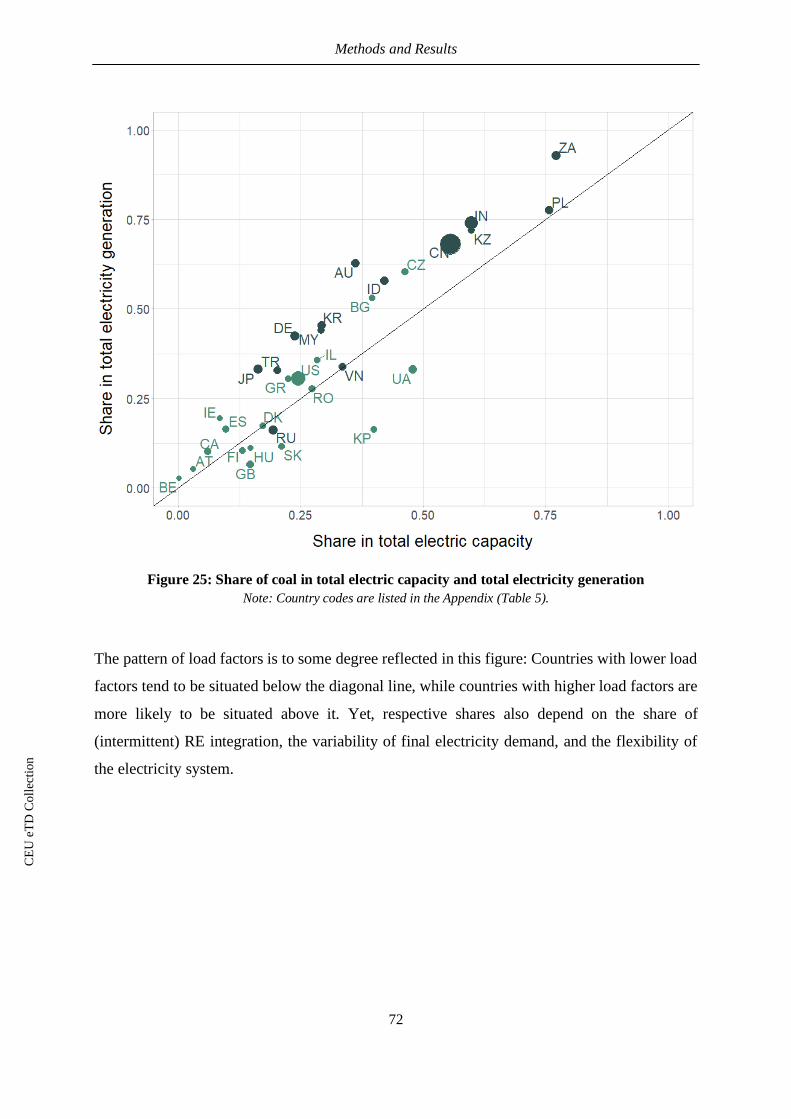
Methods and Results
72
Figure 25: Share of coal in total electric capacity and total electricity generation
Note: Country codes are listed in the Appendix (Table 5).
The pattern of load factors is to some degree reflected in this figure: Countries with lower load
factors tend to be situated below the diagonal line, while countries with higher load factors are
more likely to be situated above it. Yet, respective shares also depend on the share of
(intermittent) RE integration, the variability of final electricity demand, and the flexibility of
the electricity system.
CE
UeT
DC
olle
ctio
n
Discussion
73
5 Discussion
The overarching goals of this research project were to investigate how coal capacity
characteristics have changed on a temporal and spatial scale, to study the rate and extent of
growth and contraction of national coal fleets, and to explore the relationship between coal
capacity and coal-fired electricity generation. Several findings uncovered throughout sections
4.4-4.7 confirm or expand upon what previous studies (section 4.3) already established. Other
results are contradictory or only moderately instructive by themselves. In order to put the
various results into a broader context and provide possible explanations for their occurrence,
the theoretical framework from section 3 is used to structure and interpret the results. The
discussion is organised according to three phases of a technology’s life (rise, persistence, and
decline) and integrates findings from the literature review (sections 2.1 and 2.2), qualitative
analysis of coal capacity-related factors (RO1, section 4.3) and quantitative results from RO2-
5 (sections 4.4-4.7).
5.1 The Rise of Coal
First of all, drivers behind the rise of coal are numerous. They differ depending on local contexts
and between early and late adopters of coal technologies. In the UK, where coal combustion as
we know it today originated, positive feedbacks (cf. Neij 1997) were created in the context of
the industrial revolution. Coal mining, combustion, railway expansion, the rise of the
metallurgical industry and the development of the steam engine certainly formed a kind of
‘technology cluster’ (cf. Grubler et al. 1999), in which the different technologies mutually
supported each other. In the whole of Europe, North America, and later the rest of the world,
coal gained dominance in electricity supply as it developed a relative advantage (cf. Rogers
2003) over alternative means of electricity generation, typically over traditional renewables.
These advantages included increasing cost-competitiveness, opportunities to earn foreign
currency via coal exports, improvements in efficiency and performance, the provision of
regional jobs in coal mining, and the reliance on local fuels (cf. section 2.1). Additionally, and
particularly among late adopters (e.g. Asian economies), rapid population and economic growth
and the associated surge in electricity demand were key drivers. This makes the rise of coal a
result of both technological progress and societal needs (cf. Ayres 1988). Lastly, coal
combustion technologies are less complex (cf. Rogers 2003) than nuclear power, and the
required know-how was, as opposed to RE technologies, readily available in many countries –
making coal a favourable option in developing economies.
CE
UeT
DC
olle
ctio
n
Discussion
74
During and after the global take-off of coal combustion for electricity generation, coal units
underwent substantial changes in their design, which suggests the gradual emergence of a
dominant design (cf. Grübler 1991). For example, the average unit size significantly increased
between 1970 and 2020, and also became more standardized: Depending on the underlying
combustion technology, a rising share of units are built with a nameplate capacity of 330, 660
or 1000 MW (section 4.4). Standardisation generally involves learning effects, through which
performance increases and costs decline (cf. Markard et al. 2020). In the case of complex and
large technologies, such as coal-firing units, costs are typically further reduced through
upscaling and economies of scale (cf. Wilson 2012). However, due to increasing material costs,
long planning and permitting processes as a result of public opposition, and mounting safety
and environmental requirements, the capital costs of coal units have not declined with
increasing production volumes or increasing unit sizes (section 4.3).
There have, however, been improvements in the performance (cf. Ayres 1994; Christensen
2009), as exemplified by the increasing share of more efficient supercritical and ultra-
supercritical units (section 4.4). On one hand, these efficiency improvements can substantially
lower operating costs (due to lower fuel and water consumption) and lead to lower CO2
emissions per unit of electricity output. On the other hand, these typically large (ultra-
)supercritical units require higher capital investments, which complicates cost recovery in times
of accumulating external pressures. Further, their generally higher minimum loads demand
conditions of rising electricity demand and high load factors (sections 4.3.2, 4.7).
Moreover, an increasing share of coal units is owned by private utilities and the services sector
(section 4.4). This is not only famously the case for the US, but also applies to regions where
utilities were traditionally predominantly owned by governmental utilities. A possible
explanation behind this trend is that the investment environment has substantially changed, as
financing institutions have been put under pressure by environmental groups and the public to
divest from coal (Urgewald 2019). Additionally, entire economies and electricity markets
worldwide are becoming more liberalised. The above-mentioned changes in coal capacity with
regards to size, technology, and ownership (section 4.4) were confirmed in the path analysis of
section 4.5.
A key feature of the spatial diffusion of technologies is the adaptation to local conditions (cf.
Nordensvard et al. 2018). While some general trends are highlighted above, substantial
differences between national coal fleets exist. In India, for example, the average unit size is
CE
UeT
DC
olle
ctio
n
Discussion
75
smaller on average than in most other countries to suit the particular energy supply
requirements. In the EU, almost all units that were built over the last decade are equipped with
ultra-supercritical combustion technology, which is in line with the stringent air pollution
regulations in place, but also indicates that both know-how and financial resources exist to stem
these projects. Also, while there is no global trend in the use of coal types distinguishable
(sections 4.4), the geographical location does have an influence on the type of fuel used
nationally (section 4.5). This is unsurprising given the high costs of international coal transport
and the relevance of mining operations for regional value creation and the provision of jobs.
With regards to the time scale of technology diffusion and the resemblance with an S-curve (cf.
Rogers 2003), it is difficult to establish how long the upward trajectory of coal lasted on average
or per country. Most countries have either not reached their respective coal capacity peak yet,
or the growth period lies so far back that it is problematic to reliably determine the rate of
growth due to incomplete data. It does, however, seem to be the case that years of accelerated
growth account for a shorter time period that the years until a technology takes off, or years in
which it slowly reaches a saturation point (section 4.6). Further, as typical for dynamics of
spatio-temporal diffusion (cf. Grubler 2012), the time period of technology diffusion in the
periphery is shorter than in the core due to spill-over effects and the ability to build upon
existing knowledge. In the UK, for example, the rise of coal took several decades, while growth
rates in Vietnam or Indonesia were exponential within less than a decade (section 4.6).
Additionally, Grubler (2012) posits that saturation levels are lower in the periphery than in the
core. So far, it is too early to determine whether this holds true, and such investigation should
be adjusted for electricity system size. Yet, with the exception of India, it appears unlikely that
countries currently exhibiting substantial increases in coal capacity will reach a similar level of
domination of coal over other sources of electricity like in South Africa or Poland (>90% of
electricity supply). Theory (section 2.2.4) further suggests that saturation is reached earlier in
the case of smaller economies and those in which coal accounts for a comparatively small share
of total electric capacity. These two effects are reflected in the data: In Austria, for example,
coal only ever supplied a small share of total electricity, and coal capacity dramatically
increased in only a few years between 1980 and 1990. In Ireland, on the other hand, coal was
the main source of electricity for many decades, but coal capacity still more than tripled between
1980 and 1990. Generally, increases in total installed capacity are more gradual and span a
longer time period in larger economies, such as the US, Russia, or China (section 4.6).
CE
UeT
DC
olle
ctio
n
Discussion
76
In countries where coal is still on a steep upwards trajectory (several COAL14 countries), coal-
based electricity generation and coal capacity increase at a similar rate (section 4.7), leading to
relatively high average load factors that are generally associated with higher profitability. In
Malaysia, Kazakhstan, India, China, and Indonesia load factors were stable or increased since
2000 and generally ranged over 50% over the last 10 years. Many of these countries are late
adopters of coal but also RE electricity, so that the operation or their national coal fleets is less
impacted by the intermittent nature of VREs and the overall electric capacity requirements per
kWh of electricity are lower. In countries where coal is close to peak total installed capacity
(e.g. Poland, South Africa, Greece) the growth in annual capacity additions came to a halt, while
coal-fired electricity generation continued to rise slowly (section 4.7).
Finally, coal fleets that are rapidly growing are also typically younger on average than those
that are shrinking (section 4.4). India and China are among the six countries whose national
coal fleets are substantially younger than 20 years on average, which points towards continued
coal combustion from the available infrastructure until 2040 and beyond. This becomes even
more relevant when considering that these two countries are the world’s two largest coal
consumers.
5.2 The Persistence of Coal
Throughout the rise and maturation of coal technologies, they typically demonstrate a close fit
with their regulatory, economic, and institutional environment (cf. Rogers 2003; Turnheim and
Geels 2012), which leads to lock-in (cf. Unruh 2000). In India and China, for example, partly
regulated electricity prices, guaranteed operating hours, and favourable electricity market
conditions lower investments risks and incentivise the combustion of coal (sections 2.1 and
4.3). Similarly, in Europe and the Soviet Union, coal operations were long subsidised by
national governments, and environmental regulations did not considerably constrain coal
combustion for many decades. Cultural-cognitive institutional elements, which are most deeply
embedded in societies and most difficult to change (cf. Scott 2008), are exemplified by the
emotionalised debate and continued governmental support in the case of Australia, Poland, or
South Africa. This cognitive lock-in has prevented these economies from diversifying their
electricity supply earlier on, as a result of which they now face an immense decarbonisation
challenge.
Eventually, the adverse effects of coal combustion such as rising air pollution or climate change
accumulate (cf. Markard 2018), which typically leads countries towards a saturation point and
CE
UeT
DC
olle
ctio
n
Discussion
77
demonstrably contributed to the limited construction of new capacity (sections 4.3 and 4.6).
While many countries have passed peak electricity generation from coal (section 4.7) as well
as peak total installed capacity (section 4.6), their total operational capacity today still lies
within ± 12.5% of peak capacity. This plateau period lasts up to several decades, with 20 years
on average. Even though the construction of new coal plants becomes increasingly expensive,
operators of existing coal plants continue to burn coal in hope of recovering their initial
investments. Additionally, coal-firing is profitable if fuel prices are low, the impact of RE on
electricity wholesale prices limited, and asset owners receive payments via capacity
mechanisms. These could be possible explanations for why electricity generation from coal
continues to rise for a few years after peak total installed capacity is reached (e.g. Ireland,
Canada, Spain; see sections 4.6 and 4.7). On average, electricity generation from coal peaks 3
years after total installed capacity does, but then declines more rapidly.
MLP’s emphasis on the ‘window of opportunity’ (cf. Verbong and Geels 2007) in which
renewables quite rapidly replace fossil fuels thus seems somewhat optimistic. Fossil fuel
industries persist, and the replacement of carbon-intensive energy carriers by low-carbon
alternatives takes substantially longer than many studies suggest. Reasons behind the slow
decline of coal may also include that low-carbon electricity supply provides no tangible benefits
to electricity end-users (cf. Grubler 2012), and the operation of RE assets challenges the
conventional business model of incumbent utilities. Further, elevated RE deployment
complicates grid mechanics, balancing supply and demand, and requires investments in new,
more flexible infrastructure.
Since the lifespan of coal units generally lies between 30 and 50 years (section 4.5), coal
capacity built today sets countries on a path dependent trajectory, in which the premature
abandonment of coal units or the underutilization of coal capacity would prohibit the recovery
of investments and risk the occurrence of stranded assets. Capacity-related decisions made now
thus influence energy sector development and CO2 emissions for decades to come. If the
historic trend of net annual capacity additions peaking several years prior to peak coal-fired
electricity generation (section 4.7) continues in the future, many economies are nowhere near
peak coal combustion.
5.3 The Decline of Coal
The two main competitors to coal are natural gas and renewable energy, which have surpassed
coal in total electric capacity in various countries (section 4.6). While the operation of coal
CE
UeT
DC
olle
ctio
n
Discussion
78
plants becomes increasingly expensive, the natural gas boom and the cost decline in the
manufacturing of RE technologies make these alternatives increasingly attractive while
providing the same utility, i.e. electricity supply (cf. Anderson and Tushman 1990). There exist
several accelerators to the complete phase-out of coal: One is to remove the resources that coal
relies upon, such as halting governmental investments in coal mining and coal plant
construction, introducing capital market constraints, or removing its physical infrastructure by
directly or indirectly retiring plants prematurely. Additional measures include the introduction
of carbon prices and environmental fees, or the support of renewable energy technologies
(section 2.1.4). The unprofitability of mining operations and public opposition to mining and
combustion further drive the decline of coal, which constitute pressures that did not exist in
similar volume when coal was on the rise throughout the 20th century. Large, landscape-level
shocks (cf. Rip and Kemp 1998), such as the financial crisis of 2008/2009, have also contributed
to a (temporary) reduction in coal combustion: Regional average load factors declined across
all world regions (section 4.7) and most strongly in the US and EU. Overall, there are pressures
that affect coal operations similarly around the world, while others originate from particular
contexts, or have only arisen in more recent years.
Countries that exhibited a substantial decline in total installed coal capacity (-75% or more),
demonstrated an inverted S-curve shaped pattern, in which coal capacity first slowly declined,
but then accelerated. When, in a few years, more countries have phased out coal completely, it
would be interesting to examine whether this pattern will persist, and whether the last few
percent towards the complete phase out of coal are again relatively slow. While Rogers (2003)
described the diffusion of a technology as an ‘uncertainty-reduction process’, the decline of a
technology appears to be the opposite: National energy scenarios fail to specify coal reduction
plans or set contradictory energy sector targets, and the increasing affectedness by fuel prices
and climate policies complicates making predictions about the future of coal.
With regards to the spatial pattern of technology decline, results from section 4.6 are somewhat
contradictory to what Grubler (2012) found. Of the countries that exhibit the greatest decline in
total installed coal capacity (Austria, Belgium, Canada, Denmark, Finland, Germany, and the
UK), all have been pioneers or early adopters of coal-firing for electricity generation. Whether
this ‘first in – first out’ rule holds true for all countries remains to be seen, but the current
membership profile of the PPCA also reflects this pattern. However, if the Paris climate goals
are to be met, the overall lifetime of coal as a source of electricity will be substantially shorter
CE
UeT
DC
olle
ctio
n
Discussion
79
among late adopters compared to early adopters. This will presumably be reflected in rapid and
large-scale abandonments of coal units towards 2050.
Countries with declining electricity generation from coal (DEC18) generally exhibit lower
average load factors than COAL14 countries (section 4.7). This suggests that reductions in coal
capacity lag behind reductions in coal firing. While the dispatch of power plants is determined
by a continuous adaptation to electricity demand and RE supply for every minute of the day,
both construction and decommissioning of coal plants require several years of planning and
execution. Further, DEC18 countries typically demonstrate higher levels of RE adoption, which
necessitates additional electric capacity to ensure reliable electricity provision at all times.
Several countries (e.g. Czech Republic, Germany, Ukraine) have notably reduced their coal-
fired electricity generation, but sections 4.6-4.7 highlight that this decline was neither linear (cf.
Fabra et al. 2015), nor did annual capacity additions and retirements show a clear trend over
the past 40 years. For example, annual capacity additions in the EU and US steadily declined
but rebound around 2010. Observations like these caution against declaring ‘coal’s terminal
decline’ or basing optimistic outlooks on small, now coal-free economies like Austria and
Belgium. Further, renewables can either replace coal or act as add-ons to the existing regime
(cf. Geels 2018). Both effects can be observed among the studied countries: In Denmark or the
UK, renewables (particularly wind power) successively replaced coal, while shares of natural
gas and nuclear did not change dramatically. In Germany, on the other hand, renewables made
up for the diminishing share of nuclear power, while coal combustion for electricity generation
remained stable over decades.
DEC18 countries currently have older coal fleets on average than COAL14 countries (section
4.4). Having largely recovered their capital costs, retirements over the next decades are
associated with no or minimal economic loss. Exceptions to this are Israel and Spain (DEC18),
whose coal fleets are 30 years old on average. Given national pledges to phase out coal by 2030
(Spain) and 2025 (Israel), this will inevitably lead to premature retirements and stranded assets.
Exceptions at the other end of the scale are Poland and Kazakhstan with 47 and 50 year old
national coal fleets. Just like Hungary, Ukraine, and Russia, who have similarly old coal fleets,
these countries carry legacies from being members of or having been influenced by the Soviet
Union, where the majority of today’s operational capacity was built over a short time. After the
economic transition, increased efficiencies and lowered energy demand did not incentivise or
require the construction of many new coal plants. This is also reflected in their comparatively
CE
UeT
DC
olle
ctio
n
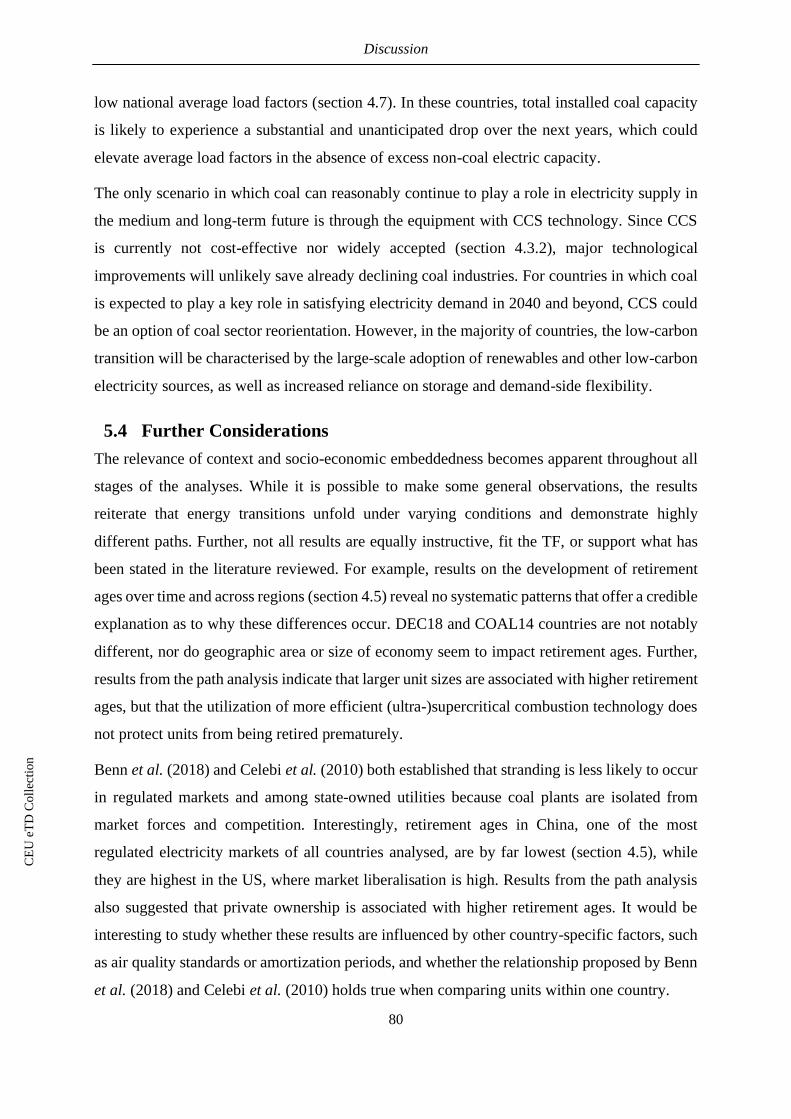
Discussion
80
low national average load factors (section 4.7). In these countries, total installed coal capacity
is likely to experience a substantial and unanticipated drop over the next years, which could
elevate average load factors in the absence of excess non-coal electric capacity.
The only scenario in which coal can reasonably continue to play a role in electricity supply in
the medium and long-term future is through the equipment with CCS technology. Since CCS
is currently not cost-effective nor widely accepted (section 4.3.2), major technological
improvements will unlikely save already declining coal industries. For countries in which coal
is expected to play a key role in satisfying electricity demand in 2040 and beyond, CCS could
be an option of coal sector reorientation. However, in the majority of countries, the low-carbon
transition will be characterised by the large-scale adoption of renewables and other low-carbon
electricity sources, as well as increased reliance on storage and demand-side flexibility.
5.4 Further Considerations
The relevance of context and socio-economic embeddedness becomes apparent throughout all
stages of the analyses. While it is possible to make some general observations, the results
reiterate that energy transitions unfold under varying conditions and demonstrate highly
different paths. Further, not all results are equally instructive, fit the TF, or support what has
been stated in the literature reviewed. For example, results on the development of retirement
ages over time and across regions (section 4.5) reveal no systematic patterns that offer a credible
explanation as to why these differences occur. DEC18 and COAL14 countries are not notably
different, nor do geographic area or size of economy seem to impact retirement ages. Further,
results from the path analysis indicate that larger unit sizes are associated with higher retirement
ages, but that the utilization of more efficient (ultra-)supercritical combustion technology does
not protect units from being retired prematurely.
Benn et al. (2018) and Celebi et al. (2010) both established that stranding is less likely to occur
in regulated markets and among state-owned utilities because coal plants are isolated from
market forces and competition. Interestingly, retirement ages in China, one of the most
regulated electricity markets of all countries analysed, are by far lowest (section 4.5), while
they are highest in the US, where market liberalisation is high. Results from the path analysis
also suggested that private ownership is associated with higher retirement ages. It would be
interesting to study whether these results are influenced by other country-specific factors, such
as air quality standards or amortization periods, and whether the relationship proposed by Benn
et al. (2018) and Celebi et al. (2010) holds true when comparing units within one country.
CE
UeT
DC
olle
ctio
n
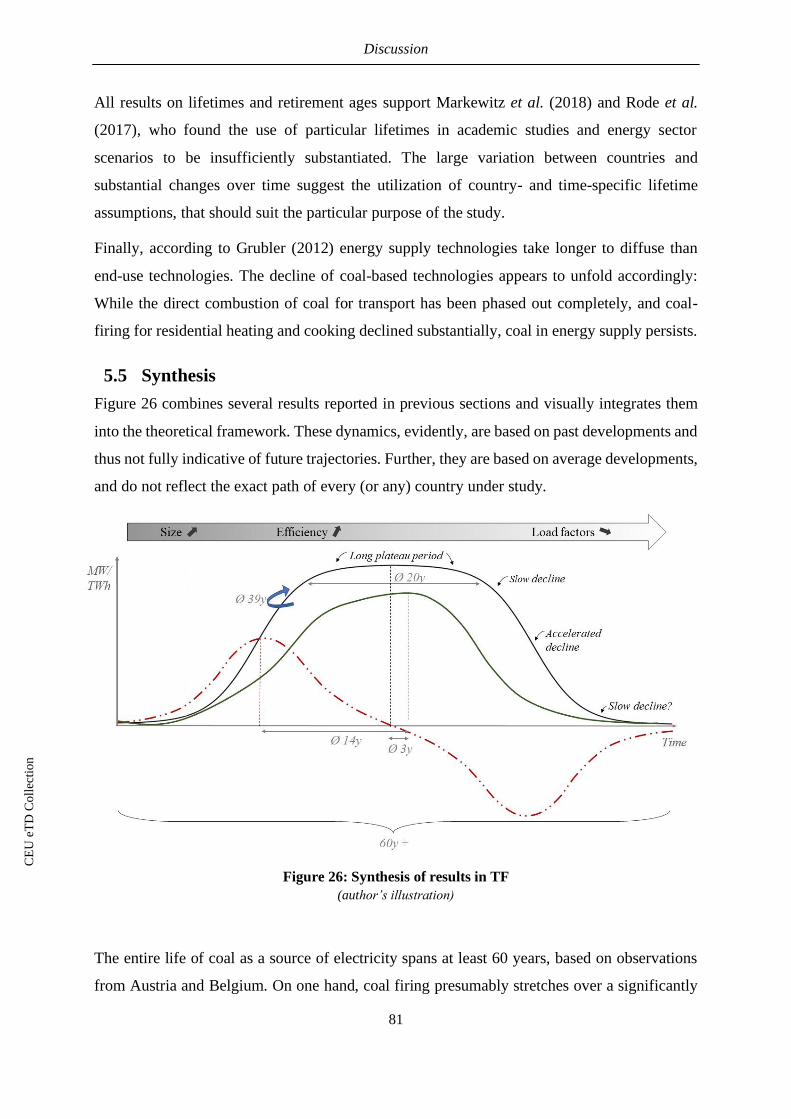
Discussion
81
All results on lifetimes and retirement ages support Markewitz et al. (2018) and Rode et al.
(2017), who found the use of particular lifetimes in academic studies and energy sector
scenarios to be insufficiently substantiated. The large variation between countries and
substantial changes over time suggest the utilization of country- and time-specific lifetime
assumptions, that should suit the particular purpose of the study.
Finally, according to Grubler (2012) energy supply technologies take longer to diffuse than
end-use technologies. The decline of coal-based technologies appears to unfold accordingly:
While the direct combustion of coal for transport has been phased out completely, and coal-
firing for residential heating and cooking declined substantially, coal in energy supply persists.
5.5 Synthesis
Figure 26 combines several results reported in previous sections and visually integrates them
into the theoretical framework. These dynamics, evidently, are based on past developments and
thus not fully indicative of future trajectories. Further, they are based on average developments,
and do not reflect the exact path of every (or any) country under study.
Figure 26: Synthesis of results in TF
(author’s illustration)
The entire life of coal as a source of electricity spans at least 60 years, based on observations
from Austria and Belgium. On one hand, coal firing presumably stretches over a significantly
CE
UeT
DC
olle
ctio
n
Discussion
82
longer period of time elsewhere, as coal never dominated electricity supply in Austria and
Belgium (nuclear and hydropower did) and the two countries are comparatively small
economies. On the other hand, long time frames introduce high sensitivities to future
uncertainties (e.g. changes in fuel or electricity prices or climate policies) and may shorten the
life of coal substantially.
Exemplary, the TF was applied to one specific country, namely the United States (Figure 27).
The US were chosen due to the considerable deployment of coal and relatively far progression
through the phases of the life cycle. The development of total installed capacity (black line)
demonstrates a highly similar path to that of the hypothesised development (grey dotted line).
Annual net capacity additions (grey bars) also resemble the hypothesised trajectory (red dotted
line) for the time period under investigation. Peak electricity generation from coal and peak
total installed coal capacity fall closely together (2008-2011). Finally, the average unit
retirement age increased from 38 years around 1980 to 46 years around 2000 to 55 years most
recently.
Figure 27: Comparison of TF and results (example country: USA)
Note: dotted grey and red line represent hypothesised development according to the TF; black and
green line and grey bars represent observed development. Values are represented in comparison
to respective peak (max) over the time period of investigation (1960-2019 for total installed
capacity; 1980-2019 for annual net capacity change and electricity generation).
CE
UeT
DC
olle
ctio
n
Discussion
83
For many other countries, overlapping the TF with the results reveals fewer striking similarities.
This is due to the fact that many countries possess over smaller coal fleets with greater year-to-
year variations, or that they have not yet reached a similar phase of decline. Also, Figure 27
only represents results for the timeframes studied throughout sections 4.4-4.7. The height of
annual capacity additions in the US, for example, is substantially higher prior to 1980 than this
representation suggests. Nonetheless, the proposed TF appears to provide a solid basis for
studying national or regional trajectories of coal development in the future.
Finally, Figure 28 reflects countries’ current state with reference to peak total installed coal
capacity. In cases where countries have passed their peak, their position is determined by the
share of today’s capacity of the initial peak, while the position of countries with growing coal
fleets is based on an estimate regarding the shape of their upwards trajectories and their
resemblance with the distinct phases of technology diffusion. It is thus not based on data on
coal units currently planned or under construction. While Figure 28 is unlikely to exactly
position countries on the upwards slope, representing planned capacity additions would also
not reliably reflect future capacity development as two-thirds of all proposed projects are never
implemented (Shearer et al. 2020).
Of all COAL14 countries, only Germany and Australia have passed peak capacity. With the
exception of North Korea, all DEC18 countries, on the other hand, are in the phase of stagnation
or decline. Overall, most countries are located above 75% of peak capacity, and only a few
countries have presumably not reached half of their future peak capacity yet (Vietnam,
Malaysia, Indonesia), while only five countries have dropped below 50% (Belgium, Austria,
UK, Denmark, and Canada).
CE
UeT
DC
olle
ctio
n
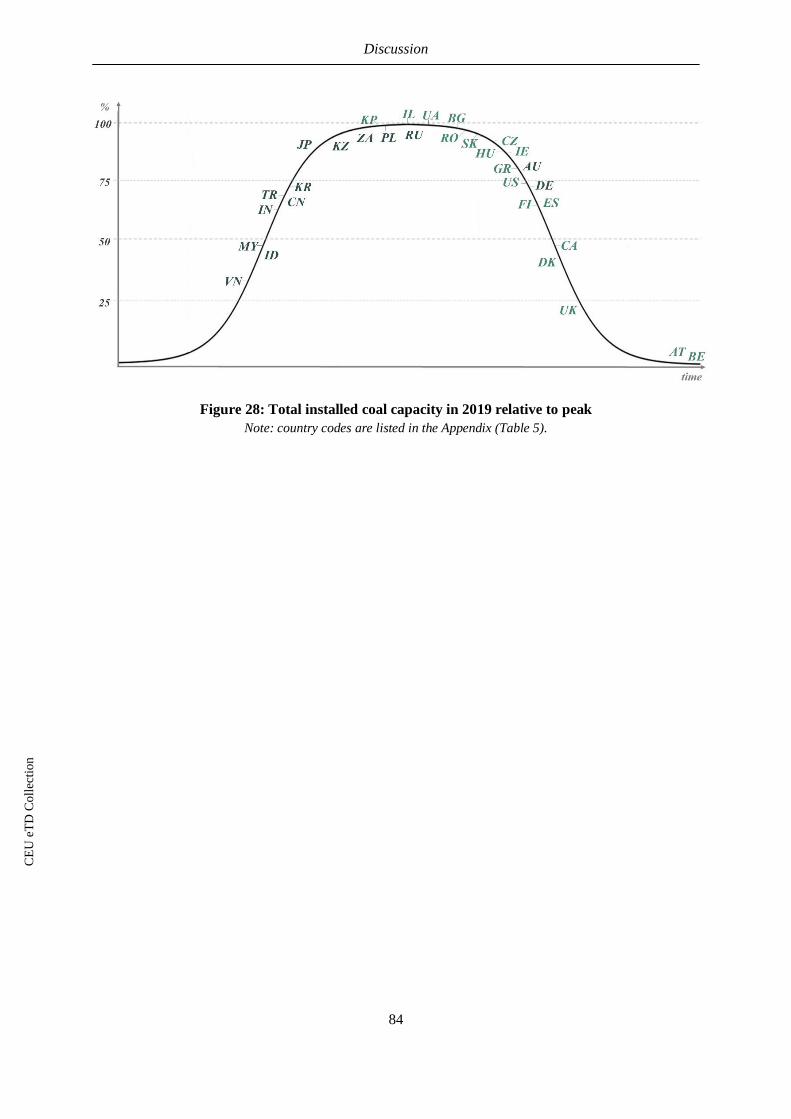
Discussion
84
Figure 28: Total installed coal capacity in 2019 relative to peak
Note: country codes are listed in the Appendix (Table 5).
CE
UeT
DC
olle
ctio
n
Conclusions
85
6 Conclusions
6.1 Summary of Findings and Fulfilment of ROs
The following section briefly summarises the main results and relates them to the five
overarching research objectives. Most analyses relied on the integration of the two most widely
used datasets on coal units worldwide (Platts World Electric Power Plant Database and Global
Energy Monitor’s Global Coal Plant Tracker) from 2017 and 2020 respectively. Further, data
on RE capacity from IRENA (2019b) was used as well as data on total and coal-fired electricity
generation (IEA 2019b). To systematically study differences between 32 countries, they were
aggregated into six main coal consuming regions (EU, US, OECD, China, India, ROTW), and
categorised into countries exhibiting a sustained decline in coal combustion (DEC18) and
countries accounting for the majority of coal-fired electricity generation (COAL14).
1) Qualitatively investigate characteristics of the global coal fleet in a comprehensive
literature review that serves as a basis for all following analyses
The qualitative analysis of coal fleet characteristics investigated economic factors (capital costs,
operating costs and revenues, economic and system costs, ownership); technological factors
(technology and CCS, efficiencies, utilization and load factors, flexibility); lifetimes and
retirement ages (concept, lifetime and retirement age estimates, age structure); and premature
retirements and stranded assets (definition and relevance, causes, estimates, managing losses).
This section highlighted that technical and economic factors substantially influence the
operation of coal plants, as well as the decision to construct new or retire existing ones. It also
provided a context for all subsequent analyses and facilitated the combination of findings in the
discussion.
2) Explore changes in unit size, technology, ownership, location, and combinations
thereof, in an exploratory, quantitative analysis using data on coal units worldwide
Since 1970, the average coal unit built has increased in size and is more likely to be equipped
with the more efficient (ultra-)supercritical combustion technology. There have been
considerable changes in the ownership structure over time, while no trend with regards to the
fuel type used could be distinguished. Overall, more units are built in China, India, and the
ROTW while less units are built in the EU, US, and other OECD countries. There are significant
differences in unit characteristics (size, technology, ownership, fuel type) between the analysed
focus regions. Further, the EU and US coal fleets are substantially older than those in China,
CE
UeT
DC
olle
ctio
n
Conclusions
86
India and the ROTW. The oldest national coal fleets are predominantly located in Eastern
Europe and the former Soviet Union, while younger coal fleets are found in Asia.
3) Investigate the development of (average) retirement ages for selected countries
over time and identify predictors of retirement age in a path analysis
Average retirement ages (since 1970) range from 33 years in China (where the majority of
capacity retires prior to reaching 40 years of age) to 48 years in the US (where the majority of
capacity retires 40 years of age or older). Average lifetimes have risen in the EU, US, and
ROTW and declined in China, while remaining relatively stable over the past 40 years in India
and OECD countries. The mean retirement age is 38.9 years and the median 38 years; the
interquartile range spans 30 to 50 years. Generally, smaller, more efficient, and publicly owned
units are associated with a lower retirement age. Globally, coal unit lifetimes have increased
over the last decades.
4) Investigate the development of annual capacity additions and retirements, as well
as total installed electric and coal capacity on the country and regional level
Globally, coal capacity additions surged around 2005, mainly driven by coal unit constructions
in China, and later India and the ROTW. In the EU and US, annual capacity retirements have
outweighed capacity additions over the last 8 years, and capacity retirements around the world
gradually increase. Most DEC18 countries have experienced 20 years or more of zero or net
negative capacity change, while all but two COAL14 countries exhibit sustained growth in total
installed capacity. But, countries with rapidly growing coal fleets also install more RE capacity,
which increases at a similar or even higher rate. Most countries that have passed peak capacity
underwent a period in which total installed capacity remained relatively stable for around 20
years. Then, coal capacity declines slowly at first, after which it accelerates. Only Belgium and
Austria have thus far phased out coal completely (in 2016 and 2020 respectively).
5) Explore the relationship between capacity development and electricity generation
from coal, including a calculation of load factors
Over the past two decades and among several COAL14 countries, net annual capacity additions
and electricity generation from coal have increased at a similar rate. On average, electricity
generation from coal peaks 14 years after peak net capacity additions and 3 years after peak
total installed capacity. Globally, load factors have recently declined and are particularly low
among DEC18 countries. Also, load factors differ considerable between and within countries,
especially in the case of smaller economies. Regionally, load factors of the US, EU, and China
CE
UeT
DC
olle
ctio
n
Conclusions
87
have converged around 54%, while they are highest in OECD countries (77%) and lowest in
ROTW countries (47%). Finally, coal still plays a key role in providing electricity worldwide,
as it accounts for over 40% of electricity supply in 12 of the 32 countries.
6.2 Limitations and Further Research
First of all, most analyses were conducted irrespective of system size and development, i.e.
national or regional total electricity supply or electric capacity. Acknowledging the respective
share of coal could have provided a more complete picture, mediated the results, and provided
some additional explanatory value. The main reasons for why this was not done lie in the
accuracy and availability of data. For example, WEPP is not comprehensive for small electric
stations while data on RE capacity from IRENA is only available from 2000 onwards.
Additionally, the GCPT dataset is limited to coal units only, but its integration and
corresponding update to the WEPP dataset to reflect recent changes (2017-2020) were thought
to outweigh the benefits of addressing system size with regards to installed electric capacity.
Moreover, the absolute value of coal-fired electricity generation is ultimately decisive for CO2
emissions, and that of total coal capacity indicative of future coal fleets and stranded assets.
Nonetheless, a prospective research project could incorporate these considerations and adjust
calculations for system size.
By focusing the analysis on 32 national coal fleets and six main coal consuming regions, key
communalities and differences could be detected and briefly discussed. At the same time, there
was insufficient room to discuss the findings for each particular country in detail or to
systematically compare two or more countries with regards to each research objective in great
depth. Similarly, providing an explanation for every individual finding lies beyond the scope
of this research project. But since it is an exploratory investigation into broader dynamics of
coal fleet development, it has the potential to stimulate further research into any particular
finding or aspect.
Some results, especially those concerning the temporal dynamics of the stagnation and
contraction of national coal fleets, are best understood as preliminary findings based on a small
number of observations. This is an inevitable caveat of studying transitions that are ongoing
rather than completed. Consequently, investigating the growth and contraction of national coal
fleets in a few years could confirm or challenge findings presented in this thesis, and further
initiate a search for general patterns throughout the decline of energy technologies.
CE
UeT
DC
olle
ctio
n
Conclusions
88
This thesis focused on techno-economic aspects in the operation of coal plants, but socio-
economic contexts and country-specific laws and regulations are highly influential regarding
future transition paths. While this is acknowledged, it has not been studied within this research
project despite presumably providing explanations for the observed results. Additionally,
economic aspects were only acknowledged by relying on available research, while the
incorporation of data on, for example, the profitability of coal plants or the development of
carbon, fuel, or electricity prices could uncover important insights.
Finally, it would be interesting to study the development of the entire coal industry with up-
and downstream affiliated sectors. Also, the use of coal in the industry or buildings sector could
be explored, since trends that were observed in electricity supply are not necessarily reflected
in end-use sectors. Lastly, heat supply was not investigated here but constitutes an important
element of any low-carbon energy transition.
6.3 Final Considerations
Globally, peak coal-firing for electricity generation has likely just been reached or lies in the
near-term future. But unlike natural gas, nuclear, or renewable sources for power generation,
coal combustion is in very different phases of development worldwide: While coal firing
exhibits exponential growth in some countries, it has been phased out completely in others.
Coal as a source of electricity has been around for over a century, but only started to play a
significant role in many emerging economies over the past 15 years, which has driven the global
surge in capacity additions since 2005. At the same time, only a few countries have pledged to
phase out coal by 2030 and taken corresponding steps. While these countries can lead the way
towards a global coal phase-out, their contribution to avoided climate change is rather limited
as they only account for a small share of total coal combustion. Nonetheless, their national
trajectories may provide insights regarding the speed and dynamics of declining coal industries.
Further, lessons learned can help accelerate coal’s decline while mitigating the negative (side-
)effects of such energy transition in other countries in the future.
Despite numerous and severe adverse social and environmental effects, coal combustion for
electricity generation persists. This is exemplified by several aspects and trends highlighted
throughout this thesis: First of all, coal units have a long life. Historically, the majority of units
operated for 30-50 years, with 39 years on average. What is more, larger units with higher
combustion volumes typically retire older; and both unit sizes and retirement ages have globally
increased over the last few decades. In the absence of political incentives to retire coal plants
CE
UeT
DC
olle
ctio
n
Conclusions
89
prematurely, asset owners will continue to burn coal as long as their operations remain
profitable, and even beyond the point of cost-competitiveness.
As a result, national coal fleets typically remain of constant size for several years. This period
of stagnation is characterised by years of incremental change, in which annual capacity
additions and retirements are low or outweigh another. Finally, the destabilisation and initial
decline of coal starts off rather reluctantly. This is not only due to the longevity of energy
infrastructures, but also due to inertia in socio-economic systems and institutions.
Understanding these barriers and temporal dynamics is crucial, as decisions regarding the
operation, construction, and retirement of coal plants impact electricity systems for decades to
come. Consequently, more attention should be payed to the medium- and long-term
development of electric assets as opposed to day-to-day operations or yearly electricity
production from coal. For example, annual power generation has very different implications in
10- versus 40-year old coal fleets, and national energy transitions will unfold at varying speeds
depending on the size of the economy and electricity system.
Specific measures to accelerate the decline of coal include the cancellation of the entire coal
pipeline, as well as the restriction of operating lifetimes. Further, the fuel switch to biomass or
natural gas could be a viable option, as long as it prioritises the operation of existing fossil fuel
plants over the construction of new ones. As external pressures accumulate, energy sector
decisions should increasingly anticipate long-term rather than short-term developments of
regulations, profits and energy demand. In the face of accelerating climate change, the shift
towards low-carbon electricity supply worldwide must be initiated now. This will not only
contribute to limiting the global temperature rise to below 1.5 or 2°C, but reduce the volume of
stranded assets and further lower expenditures on problems induced by air pollution and
environmental degradation. Delaying action on reducing coal firing prohibits regional
economies from diversifying and utilities from development new business models.
If climate goals are to be met, the premature retirement and stranding of coal assets will be a
major concern particularly to developing countries, who now possess over the world’s youngest
coal fleets. At the same time, alternative means of power production will have to be developed
and scaled up to satisfy growing electricity demand. International climate negotiations have
thus far not addressed the required scope of premature coal plant retirements, nor the
distribution of burdens of a global coal phase out. If developed countries only commit to weak
near-term climate actions and delay their coal phase-outs, the decarbonisation challenge is
CE
UeT
DC
olle
ctio
n

Conclusions
90
shifted to developing countries that have fewer resources to invest in alternatives and
compensate people and companies adversely affected by premature retirement decisions. This
highlights that national energy paths should always be studied and pursued in a global context,
and that a global coal phase-out necessitates a just distribution of burdens.
CE
UeT
DC
olle
ctio
n
References
91
References
Agora Energiewende. 2016. Eleven principles for a consensus on coal; concept for a stepwise
decarbonisation of the German power sector. Berlin: Agora Energiewende.
———. 2017. Flexibility in thermal power plants. With a focus on existing coal-fired power
plants. Berlin: Agora Energiewende.
Allen, R.C. 2013. Energy transitions in history: the shift to coal. RCC Perspectives, no. 2.
Rachel Carson Center: 11–16.
Alves Dias, P., Kanellopoulos, K., Medarac, H., Kapetaki, Z., Miranda-Barbosa, E., Shortall,
R., Czako, V., Telsnig, T., Vazquez-Hernandez, C., Lacal Arántegui, R., Nijs, W.,
Gonzalez Aparicio, I., Trombetti, M., and Mandras, G., Peteves, E., Tzimas, E. 2018.
EU coal regions: opportunities and challenges ahead, Publications Office of the
European Union, EUR 29292. doi:10.2760/064809, JRC112593.
Anderson, P., and Tushman, M.L. 1990. Technological discontinuities and dominant designs:
a cyclical model of technological change. Administrative Science Quarterly 35 (4):
604. doi:10.2307/2393511.
Andrews-Speed, P., Ma, G., Shao, B., and Liao, C. 2005. Economic responses to the closure
of small-scale coal mines in Chongqing, China. Resources Policy 30 (1): 39–54.
doi:10.1016/j.resourpol.2004.12.002.
Antes, R., Eisenack, K., and Fichter, K. 2012. Wirtschaftswissenschaftliche Ansätze zur
Gestaltung von Wandlungsprozessen. Ökologisches Wirtschaften-Fachzeitschrift 27
(August): 35. doi:10.14512/oew.v26i3.1221.
Arthur, W.B. 1989. Competing technologies, increasing returns, and lock-in by historical
events. The Economic Journal 99 (394): 116. doi:10.2307/2234208.
Ayres, R.U. 1988. Barriers and breakthroughs: an ‘expanding frontiers’ model of the
technology-industry life cycle. Technovation 7 (2): 87–115. doi:10.1016/0166-
4972(88)90041-7.
———. 1994. Toward a non-linear dynamics of technological progress. Journal of Economic
Behavior & Organization 24 (1): 35–69. doi:10.1016/0167-2681(94)90053-1.
Bauer, N., Calvin, K., Emmerling, J., Fricko, O., Fujimori, S., Hilaire, J., Eom, J., et al. 2017.
Shared socio-economic pathways of the energy sector – Quantifying the narratives.
Global Environmental Change 42 (January): 316–30.
doi:10.1016/j.gloenvcha.2016.07.006.
Bell, S.E., and York, R. 2010. Community economic identity: the coal industry and ideology
construction in west Virginia. Rural Sociology 75 (1): 111–43. doi:10.1111/j.1549-
0831.2009.00004.x.
Benn, A., Bodnar, P., Mitchell, J., and Waller, J. 2018. Managing the coal capital transition:
collaborative opportunities for asset owners, policymakers, and environmental
advocates. Rocky Mountain Institute.
Bergek, A., Jacobsson, S., Carlsson, B., Lindmark, S., and Rickne, A. 2008. Analyzing the
functional dynamics of technological innovation systems: a scheme of analysis.
Research Policy 37 (3): 407–29. doi:10.1016/j.respol.2007.12.003.
CE
UeT
DC
olle
ctio
n
References
92
Bernaciak, M., and Lis, A. 2017. Weak labour, strong interests: Polish trade unions and the
integration of EU energy and service markets: weak labour, strong interests. JCMS:
Journal of Common Market Studies 55 (3): 432–48. doi:10.1111/jcms.12506.
Bertram, C., Johnson, N., Luderer, G., Riahi, K., Isaac, M., and Eom, J. 2015. Carbon lock-in
through capital stock inertia associated with weak near-term climate policies.
Technological Forecasting and Social Change 90 (January): 62–72.
doi:10.1016/j.techfore.2013.10.001.
Binsted, M., Iyer, G., Edmonds, J., Vogt-Schilb, A., Arguello, R., Cadena, A., Delgado, R. et
al. 2020. Stranded asset implications of the Paris Agreement in Latin America and the
Caribbean. Environmental Research Letters 15 (4): 1-11. doi: 10.1088/1748-
9326/ab506d.
Bloomberg. 2016. New energy outlook 2016: watch the story unfold.
URL; https://about.bnef.com/blog/new-energy-outlook-2016-watch-the-story-unfold/.
———. 2020. Coal is world’s most expensive fuel after oil’s brutal collapse. Bloomberg.
URL; https://www.bloomberg.com/news/articles/2020-03-23/coal-is-world-s-most-
expensive-fuel-after-oil-s-brutal-collapse.
Bromley, P.S. 2016. Extraordinary interventions: toward a framework for rapid transition and
deep emission reductions in the energy space. Energy Research & Social Science 22
(December): 165–71. doi:10.1016/j.erss.2016.08.018.
Caldecott, B, Dericks, G., Tulloch, D.J., Liao, X., Kruitwagen, L., Bouveret, G., and Mitchell,
J. 2017. Stranded assets and thermal coal in China: an analysis of environment-
related risk exposure. Oxford, UK: Smith School of Enterprise and the Environment.
Caldecott, B., Dericks, G., Tulloch, D.J., Kruitwagen, L., Kok, I. 2016. Stranded assets and
thermal coal in Japan: an analysis of environment-related risk exposure. Oxford, UK:
Smith School of Enterprise and the Environment.
Caldecott, B., Dericks, G., and Mitchell, J. 2015. Subcritical coal in Australia: risks to
investors and implications for policymakers. Oxford, UK: Smith School of Enterprise
and the Environment.
Caldecott, B., Kruitwagen, L., Dericks, G., Tulloch, D.J., Kok, I., and Mitchell, J. 2016.
Stranded assets and thermal coal: an analysis of environment-related risk exposure.
SSRN Electronic Journal. doi:10.2139/ssrn.2724550.
Caldecott, B., and McDaniels, J. 2014. Financial dynamics of the environment: risks, impacts,
and barriers to resilience. Oxford, UK: Smith School of Enterprise and the
Environment.
Caldecott, B., Tulloch, D.J., Bouveret, G., Pfeiffer, A., Kruitwagen, L., McDaniels, J., and
Dericks, G. 2017. The fate of european coal-fired power stations planned in the Mid-
2000s: insights for policymakers, companies, and investors considering new coal.
SSRN Electronic Journal. doi:10.2139/ssrn.3019030.
Campbell, R.J. 2013. Increasing the efficiency of existing coal-fired power plants. CRS
Report. Congressional Research Service.
CAN Europe. 2018. Coal phase out. Climate Action Network Europe. URL;
http://www.caneurope.org/energy/coal-phase-out.
CE
UeT
DC
olle
ctio
n
References
93
Caniëls, M., and Romijn, H. 2008. Strategic niche management: towards a policy tool for
sustainable development. Technology Analysis & Strategic Management 20 (March):
245–66. doi:10.1080/09537320701711264.
Carbon Tracker. 2019. Four in five EU coal plants unprofitable as renewables and gas power
ahead. Carbon Tracker Initiative. URL; https://carbontracker.org/four-in-five-eu-coal-
plants-unprofitable-as-renewables-and-gas-power-ahead/.
Castro, L., Cox, L., and Fukumoto, G. 2017. Diffusion of an agricultural innovation: A case
study involving dry litter technology in American Samoa. Pacific Agriculture and
Natural Resources 1: 1-12.
CEA. 2016. Draft national electricity plan. Government of India, Ministry of Power, Central
Electricity Authority. URL; http://www.cea.nic.in/reports/committee/nep/nep_dec.pdf.
Celebi, M., Graves, F., Bathla, G., and Bressan, L. 2010. Potential coal plant retirements
under emerging environmental regulations. The Brattle Group.
Chadwick, R.A. 1973. Coal: Montana’s prosaic treasure. Montana: The Magazine of Western
History 23 (4): 18–31.
Cherp, A., Vinichenko, V., Jewell, J., Brutschin, E., and Sovacool, B. 2018. Integrating
techno-economic, socio-technical and political perspectives on national energy
transitions: a meta-theoretical framework. Energy Research & Social Science 37
(March): 175–90. doi:10.1016/j.erss.2017.09.015.
Child, M., and Breyer, C. 2017. Transition and transformation: a review of the concept of
change in the progress towards future sustainable energy systems. Energy Policy 107
(August): 11–26. doi:10.1016/j.enpol.2017.04.022.
Christensen, C.M. 2009. Exploring the limits of the technology S-curve. Part I: component
technologies. Production and Operations Management 1 (4): 334–57.
doi:10.1111/j.1937-5956.1992.tb00001.x.
Clausen, J., and Fichter, K. 2016. Pfadabhängigkeiten und evolutorische Ökonomik.
Inputpapier im Rahmen des Projekts Evolution2Green - Transformationspfade zu
einer Green Economy.
Creutzig, F., Roy, J., Lamb, W.F., Azevedo, I.M.L., Bruine de Bruin, W., Dalkmann, H.,
Edelenbosch, O.Y., et al. 2018. Towards demand-side solutions for mitigating climate
change. Nature Climate Change 8 (4): 260–63. doi:10.1038/s41558-018-0121-1.
Cui, R.N., Hultman, N., Jiang, K., McJeon, H., Yu, S., Cui, D., Edwards, M., et al. 2020. A
high ambition coal phase out in China: feasible strategies through a plant-by-plant
assessment. College Park, Maryland: Centre for Global Sustainability.
Cui, R.Y., Hultman, N., Edwards, M.R., He, L., Sen, A., Surana, K., McJeon, H., et al. 2019.
Quantifying operational lifetimes for coal power plants under the Paris goals. Nature
Communications 10 (1): 4759. doi:10.1038/s41467-019-12618-3.
Davidson, D.J. 2019. Exnovating for a renewable energy transition. Nature Energy 4 (4):
254–56. doi:10.1038/s41560-019-0369-3.
Davis, S.J., and Socolow, R.H. 2014. Commitment accounting of CO2 emissions.
Environmental Research Letters 9 (8): 084018. doi:10.1088/1748-9326/9/8/084018.
CE
UeT
DC
olle
ctio
n
References
94
DIW Berlin et al. 2019. Phasing out coal in the German energy sector. Interdependencies,
challenges and potential solutions. German Institute for Economic research (DIW
Berlin), Wuppertal Institute for Climate, Environment and Energy, Ecologic Institute.
Dodson, J., Li, X., Sun, N., Atahan, P., Zhou, X., Liu, H., Zhao, K., Hu, S., and Yang, Z.
2014. Use of coal in the bronze age in China. The Holocene 24 (5): 525–30.
doi:10.1177/0959683614523155.
Dosi, G., and Nelson, R.R. 1994. An introduction to evolutionary theories in economics.
Journal of Evolutionary Economics 4 (3): 153–72. doi:10.1007/BF01236366.
Drax. 2016. The turbulent history of coal. Drax. URL; https://www.drax.com/energy-
policy/the-turbulent-history-of-coal/.
Dutton, J.E., and Dukerich, J.M. 1991. Keeping an eye on the mirror: image and identity in
organizational adaptation. Academy of Management Journal 34 (3): 517–54.
doi:10.2307/256405.
Edenhofer, O., Steckel, J.C., Jakob, M., and Bertram, C. 2018. Reports of coal’s terminal
decline may be exaggerated. Environmental Research Letters 13 (2): 024019.
doi:10.1088/1748-9326/aaa3a2.
Edmunds, R., Davies, L., Deane, P., and Pourkashanian, M. 2015. Thermal power plant
operating regimes in future british power systems with increasing variable renewable
penetration. Energy Conversion and Management 105 (November): 977–85.
doi:10.1016/j.enconman.2015.08.067.
Ellis, K., Nissen, W., Taylor, L., Lange, N., Bennett, D., and Walton, I. 2013. Always on:
Reliable electricity in an age of coal plant retirement. ACEEE Summer Study on
Energy Efficiency in Industry.
Energy Education. 2018. Thermal efficiency - energy education. URL;
https://energyeducation.ca/encyclopedia/Thermal_efficiency.
Evans, S., and Pearce, R. 2020. Mapped: the world’s coal power plants in 2020. Carbon
Brief. URL; https://www.carbonbrief.org/mapped-worlds-coal-power-plants.
Fabra, N., Matthes, F., Newbery, D., Colombier, M., Mathieu, M., and Rüdinger, A. 2015.
The energy transition in Europe: initial lessons from Germany, the UK and France.
Towards a low carbon European power sector. Centre on Regulation in Europe
(CERRE), 152.
Farfan, J., and Breyer, C. 2017. Structural changes of global power generation capacity
towards sustainability and the risk of stranded investments supported by a
sustainability indicator. Journal of Cleaner Production 141 (January): 370–84.
doi:10.1016/j.jclepro.2016.09.068.
Fath, B.D., Dean, C.A., and Katzmair, H. 2015. Navigating the adaptive cycle: an approach to
managing the resilience of social systems. Ecology and Society 20 (2): art24.
doi:10.5751/ES-07467-200224.
Fleischman, L., Cleetus, R., Deyette, J., Clemmer, S., and Frenkel, S. 2013. Ripe for
retirement: an economic analysis of the U.S. coal fleet. The Electricity Journal 26
(10): 51–63. doi:10.1016/j.tej.2013.11.005.
Fouquet, R. 2016. Historical energy transitions: speed, prices and system transformation.
Grantham Research Institute on Climate Change and the Environment. URL;
CE
UeT
DC
olle
ctio
n
References
95
http://www.lse.ac.uk/GranthamInstitute/publication/historical-energy-transitions-
speed-prices-and-system-transformation/.
Fouquet, R., and Pearson, P.J.G. 2012. Past and prospective energy transitions: insights from
history. Energy Policy 50 (November): 1–7. doi:10.1016/j.enpol.2012.08.014.
Gabbatiss, J. 2020. Coal mines emit more methane than oil-and-gas sector, study finds.
Carbon Brief. URL; https://www.carbonbrief.org/coal-mines-emit-more-methane-
than-oil-and-gas-sector-study-finds.
Geels, F.W. 2002. Technological transitions as evolutionary reconfiguration processes: a
multi-level perspective and a case-study. Research Policy 31 (8–9): 1257–74.
doi:10.1016/S0048-7333(02)00062-8.
———. 2005. Technological transitions and system innovations: a co-evolutionary and
socio-technical analysis. Cheltenham, UK ; Northampton, MA: Edward Elgar
Publishing.
———. 2014. Reconceptualising the co-evolution of firms-in-industries and their
environments: developing an inter-disciplinary Triple Embeddedness Framework.
Research Policy 43 (2): 261–77. doi:10.1016/j.respol.2013.10.006.
———. 2018. Disruption and low-carbon system transformation: progress and new
challenges in socio-technical transitions research and the Multi-Level Perspective.
Energy Research & Social Science 37 (March): 224–31.
doi:10.1016/j.erss.2017.10.010.
Geels, F.W., and Schot, J. 2007. Typology of sociotechnical transition pathways. Research
Policy 36 (3): 399–417. doi:10.1016/j.respol.2007.01.003.
Giddens, A. 1986. The constitution of society: outline of the theory of structuration. URL;
http://linkinghub.elsevier.com/retrieve/pii/0260982786900406.
Gitman, L.J. 2009. Principles of managerial finance. Boston ; London : Pearson Prentice Hall.
URL; https://trove.nla.gov.au/work/3903353.
Gray, M, and Watson, L. 2018. Understanding the operating costs of coal power: US
example. Carbon Tracker Initiative. URL;
https://carbontracker.org/reports/understanding-operating-cost-coal-fired-power-us-
example/.
Gray, M., Ljungwaldh, S., Watson, L., and Kok, I. 2018. Powering down coal. Navigating the
economic and financial risks in the last years of coal power. Carbon Tracker.
Greenpeace. 1993. Towards a fossil free energy future the next energy transition.
Netherlands.
———. 2015. Coal’s terminal decline: how a bad year for coal in 2014 has been followed by
the biggest fall in consumption ever.
———. 2016. Study on economics of coal-fired power generation projects in China. Coal
Power Economics Study Group of North China Electric Power University. URL;
https://storage.googleapis.com/planet4-eastasia-stateless/2019/11/a97ea887-a97ea887-
study-on-economics-of-coal-fired-power-generation-projects-in-china-report.pdf.
Grübler, A. 1991. Diffusion: long-term patterns and discontinuities. In Diffusion of
Technologies and Social Behavior, edited by Nebojša Nakićenović and Arnulf
Grübler, 451–82. Berlin, Heidelberg: Springer. doi:10.1007/978-3-662-02700-4_18.
CE
UeT
DC
olle
ctio
n
References
96
———. 2012. Energy transitions research: insights and cautionary tales. Energy Policy 50
(November): 8–16. doi:10.1016/j.enpol.2012.02.070.
Grubler, A., Nakicenovic, N., and Victor, D.G. 1999. Dynamics of energy technologies and
global change. Energy Policy 27 (5). Elsevier: 247–80.
Grubler, A., Wilson, C., and Nemet, G. 2016. Apples, oranges, and consistent comparisons of
the temporal dynamics of energy transitions. Energy Research & Social Science 22
(December): 18–25. doi:10.1016/j.erss.2016.08.015.
Hausfather, Z. 2018. Analysis: how much ‘carbon budget’ is left to limit global warming to
1.5C? Carbon Brief. URL; https://www.carbonbrief.org/analysis-how-much-carbon-
budget-is-left-to-limit-global-warming-to-1-5c.
Hekkert, M.P., Suurs, R.A.A., Negro, S.O., Kuhlmann, S., and Smits, R.E.H.M. 2007.
Functions of innovation systems: a new approach for analysing technological change.
Technological Forecasting and Social Change 74 (4): 413–32.
doi:10.1016/j.techfore.2006.03.002.
Henderson, C. 2013. Upgrading and efficiency improvement in coal-fired power plants. IEA
Clean Coal Centre.
Henderson, R.M., and Clark, K.B. 1990. Architectural innovation: the reconfiguration of
existing product technologies and the failure of established firms. Administrative
Science Quarterly 35 (1): 9. doi:10.2307/2393549.
Hermwille, L. 2016. The role of narratives in socio-technical transitions—Fukushima and the
energy regimes of Japan, Germany, and the United Kingdom. Energy Research &
Social Science 11 (January): 237–46. doi:10.1016/j.erss.2015.11.001.
Heyen, D.A. 2017. Governance of exnovation: phasing out non-sustainable structures.
Working Paper no. 2. Berlin: Öko-Institut e.V.
Hillman, A.J., and Hitt, M.A. 1999. Corporate political strategy formulation: a model of
approach, participation, and strategy decisions. Academy of Management Review 24
(4): 825–42. doi:10.5465/amr.1999.2553256.
Hirth, L., and Steckel, J.C. 2016. The role of capital costs in decarbonizing the electricity
sector. Environmental Research Letters 11 (11): 114010. doi:10.1088/1748-
9326/11/11/114010.
Hoesly, R.M., Smith, S.J., Feng, L., Klimont, Z., Janssens-Maenhout, G., Pitkanen, T.,
Seibert, J.J., et al. 2018. Historical (1750–2014) anthropogenic emissions of reactive
gases and aerosols from the community emissions data system (CEDS). Geoscientific
Model Development 11 (1): 369–408. doi:10.5194/gmd-11-369-2018.
Hu, L., and Bentler, P.M. 1999. Cutoff criteria for fit indexes in covariance structure analysis:
conventional criteria versus new alternatives. Structural Equation Modeling 6 (1). US:
Lawrence Erlbaum: 1–55. doi:10.1080/10705519909540118.
Hughes, J.P. 2016. Regulatory treatment of uneconomic power plants. The Electricity Journal
29 (6): 28–32. doi:10.1016/j.tej.2016.07.008.
IEA. 2019a. Coal 2019. Analysis and forecast to 2024. International Energy Agency.
———. 2019b. World energy balances. IEA World Energy Stat Balances.
———. 2020. Data and statistics. IEA. URL: https://www.iea.org/data-and-statistics.
CE
UeT
DC
olle
ctio
n
References
97
Igliński, B., Piechota, G., and Buczkowski, R. 2015. Development of biomass in polish
energy sector: An Overview. Clean Technologies and Environmental Policy 17 (2):
317–29. doi:10.1007/s10098-014-0820-x.
IPCC. 2014. Climate change 2014: synthesis report. Contribution of working groups I, II and
III to the fifth assessment report of the Intergovernmental Panel on Climate Change
[Core Writing Team, R.K. Pachauri and L.A. Meyer (Eds.)]. Geneva, Switzerland:
IPCC.
———. 2018. Summary for policymakers. Global warming of 1.5°C. An IPCC special report
on the impacts of global warming of 1.5°C above pre-industrial levels and related
global greenhouse gas emission pathways, in the context of strengthening the global
response to the threat of climate change, sustainable development, and efforts to
eradicate poverty. Masson-Delmotte, V., P. Zhai, H.-O. Pörtner, D. Roberts, J. Skea,
P.R. Shukla, A. Pirani, W. Moufouma-Okia, C. Péan, R. Pidcock, S. Connors, J.B.R.
Matthews, Y. Chen, X. Zhou, M.I. Gomis, E. Lonnoy, M. Tignor, and T. Waterfield.
IRENA. 2019a. Flexibility in conventional power plants. Innovation landscape brief. Abu
Dhabi: International Renewable Energy Agency.
———. 2019b. Renewable capacity statistics 2019. Abu Dhabi: International Renewable
Energy Agency (IRENA).
Jackson, D.L., Gillaspy, J.A., and Purc-Stephenson, R. 2009. Reporting practices in
confirmatory factor analysis: an overview and some recommendations. Psychological
Methods 14 (1): 6–23. doi:10.1037/a0014694.
Jackson, R.B., Friedlingstein, P., Andrew, R.M., Canadell, J.G., Le Quéré, C., and Peters,
G.P. 2019. Persistent fossil fuel growth threatens the Paris Agreement and planetary
health. Environmental Research Letters 14 (12): 121001. doi:10.1088/1748-
9326/ab57b3.
Jacobsson, S., and Johnson, A. 2000. The diffusion of renewable energy technology: an
analytical framework and key issues for research. Energy Policy 28 (9): 625–40.
doi:10.1016/S0301-4215(00)00041-0.
Jakob, M., Haller, M., and Marschinski, R. 2012. Will history repeat itself? Economic
convergence and convergence in energy use patterns. Energy Economics 34 (1): 95–
104. doi:10.1016/j.eneco.2011.07.008.
Jewell, J., Vinichenko, V., Nacke, L., and Cherp, A. 2019. Prospects for powering past coal.
Nature Climate Change 9 (8): 592–97. doi:10.1038/s41558-019-0509-6.
Jewell, J., and Cherp, A. 2019. On the political feasibility of climate change mitigation
pathways: Is it too late to keep warming below 1.5°C? WIREs Climate Change 11 (1):
1-12. doi: 10.1002/wcc.621.
Johnson, N., Krey, V., McCollum, D.L., Rao, S., Riahi, K., and Rogelj, J. 2015. Stranded on a
low-carbon planet: implications of climate policy for the phase-out of coal-based
power plants. Technological Forecasting and Social Change 90 (January): 89–102.
doi:10.1016/j.techfore.2014.02.028.
Johnstone, P., and Hielscher, S. 2017. Phasing out coal, sustaining coal communities? Living
with technological decline in sustainability pathways. The Extractive Industries and
Society 4 (3): 457–61. doi:10.1016/j.exis.2017.06.002.
CE
UeT
DC
olle
ctio
n
References
98
Kahrl, F., and Wang, X. 2015. Integrating renewable energy into power systems in China: a
technical primer. Beijing, China: Regulatory Assistance Project. URL;
https://www.raponline.org/wp-content/uploads/2016/05/rap-e3-
chinaelectricityplanning-2015-oct.pdf.
Kefford, B.M., Ballinger, B., Schmeda-Lopez, D.R., Greig, C., and Smart, S. 2018. The early
retirement challenge for fossil fuel power plants in deep decarbonisation scenarios.
Energy Policy 119 (August): 294–306. doi:10.1016/j.enpol.2018.04.018.
Kemp, R., Rotmans, J., and Loorbach, D. 2007. Assessing the Dutch energy transition policy:
how does it deal with dilemmas of managing transitions? Journal of Environmental
Policy & Planning 9 (3–4). Routledge: 315–31. doi:10.1080/15239080701622816.
Kemp, R., Schot, J., and Hoogma, R. 1998. Regime shifts to sustainability through processes
of niche formation: the approach of Strategic Niche Management. Technology
Analysis & Strategic Management 10 (2): 175–98. doi:10.1080/09537329808524310.
Kern, F., and Rogge, K.S. 2016. The pace of governed energy transitions: agency,
international dynamics and the global Paris Agreement accelerating decarbonisation
processes? Energy Research & Social Science 22 (December): 13–17.
doi:10.1016/j.erss.2016.08.016.
Kholod, N., Evans, M., Pilcher, R.C., Roshchanka, V., Ruiz, F., Coté, M., and Collings, R.
2020. Global methane emissions from coal mining to continue growing even with
declining coal production. Journal of Cleaner Production 256 (May): 120489.
doi:10.1016/j.jclepro.2020.120489.
Kivimaa, P., and Kern, F. 2016. Creative destruction or mere niche support? Innovation
policy mixes for sustainability transitions. Research Policy 45 (1): 205–17.
doi:10.1016/j.respol.2015.09.008.
Krey, V., Luderer, G., Clarke, L., and Kriegler, E. 2014. Getting from here to there – Energy
technology transformation pathways in the EMF27 scenarios. Climatic Change 123
(3–4): 369–82. doi:10.1007/s10584-013-0947-5.
Kuchler, M., and Bridge, G. 2018. Down the black hole: sustaining national socio-technical
imaginaries of coal in Poland. Energy Research & Social Science 41 (July): 136–47.
doi:10.1016/j.erss.2018.04.014.
Kumar, S., and Shahbaz, M. 2012. Coal consumption and economic growth revisited:
structural breaks, cointegration and causality tests for Pakistan. Energy Exploration &
Exploitation 30 (3). SAGE Publications Ltd STM: 499–521. doi:10.1260/0144-
5987.30.3.499.
Laes, E., Gorissen, L., and Nevens, F. 2014. A comparison of energy transition governance in
Germany, The Netherlands and the United Kingdom. Sustainability 6 (3): 1129–52.
doi:10.3390/su6031129.
Lai, K., and Green, S.B. 2016. The problem with having two watches: assessment of fit when
RMSEA and CFI disagree. Multivariate Behavioral Research 51 (2–3): 220–39.
doi:10.1080/00273171.2015.1134306.
Lawrence, T.B., and Suddaby, R. 2006. Institutions and institutional work. The SAGE
Handbook of Organization Studies, 215–54.
CE
UeT
DC
olle
ctio
n
References
99
Lawrence, T.B., Suddaby, R., and Leca, B., eds. 2009. Institutional work: actors and agency
in institutional studies of organizations. Cambridge: Cambridge University Press.
doi:10.1017/CBO9780511596605.
Li, R., and Leung, G.C.K. 2012. Coal consumption and economic growth in China. Energy
Policy, Strategic Choices for Renewable Energy Investment, 40 (January): 438–43.
doi:10.1016/j.enpol.2011.10.034.
Linn, J., and McCormack, K. 2019. The roles of energy markets and environmental regulation
in reducing coal‐fired plant profits and electricity sector emissions. The RAND Journal
of Economics 50 (4): 733–67. doi:10.1111/1756-2171.12294.
Lis, A. 2014. Strategies of interest representation: Polish trade unions in EU governance.
Europe-Asia Studies 66 (3): 444–66. doi:10.1080/09668136.2014.891820.
Littlecott, C. 2015. G7 coal phase out: United Kingdom, A review from Oxfam.
Liu, W.-M., Wu, J.-J., Yang, K., and Hu, G.-Y. 2009. Econometrical analysis to the coal
consumption and economic growth in China. In 2009 Asia-Pacific Power and Energy
Engineering Conference, 1–6. Wuhan, China: IEEE.
doi:10.1109/APPEEC.2009.4918309.
Loorbach, D., and Raak, R. 2006. Strategic niche management and transition management:
different but complementary approaches, Discussion paper.
Lounsbury, M., and Glynn, M.A. 2001. Cultural entrepreneurship: stories, legitimacy, and the
acquisition of resources. Strategic Management Journal 22 (6–7): 545–64.
doi:10.1002/smj.188.
Lowe, J.A., and Bernie, D. 2018. The impact of earth system feedbacks on carbon budgets
and climate response. Philosophical Transactions of the Royal Society A:
Mathematical, Physical and Engineering Sciences 376 (2119): 20170263.
doi:10.1098/rsta.2017.0263.
Luderer, G., Vrontisi, Z., Bertram, C., Edelenbosch, O.Y., Pietzcker, R.C., Rogelj, J., De
Boer, H.S., et al. 2018. Residual fossil CO2 emissions in 1.5–2 °C pathways. Nature
Climate Change 8 (7): 626–33. doi:10.1038/s41558-018-0198-6.
Markard, J. 2018. The next phase of the energy transition and its implications for research and
policy. Nature Energy 3 (8). Nature Publishing Group: 628–33. doi:10.1038/s41560-
018-0171-7.
Markard, J., Bento, N., Kittner, N., and Nuñez-Jimenez, A. 2020. Destined for decline?
Examining nuclear energy from a technological innovation systems perspective.
Energy Research & Social Science 67 (September): 101512.
doi:10.1016/j.erss.2020.101512.
Markard, J., Raven, R., and Truffer, B. 2012. Sustainability transitions: an emerging field of
research and its prospects. Research Policy 41 (6): 955–67.
doi:10.1016/j.respol.2012.02.013.
Markewitz, P., Robinius, M., and Stolten, D. 2018. The future of fossil fired power plants in
Germany—A lifetime analysis. Energies 11 (6): 1616. doi:10.3390/en11061616.
Matthews, H.D., Gillett, N.P., Stott, P.A., and Zickfeld, K. 2009. The proportionality of
global warming to cumulative carbon emissions. Nature 459 (7248): 829–32.
doi:10.1038/nature08047.
CE
UeT
DC
olle
ctio
n
References
100
Meadowcroft, J. 2009. What about the politics? Sustainable development, transition
management, and long term energy transitions. Policy Sciences 42 (4): 323.
doi:10.1007/s11077-009-9097-z.
Merrick, D. 1984. Coal combustion and conversion technology. Macmillan International
Higher Education.
Metcalfe, J.S. 1994. Evolutionary economics and technology policy. The Economic Journal
104 (425): 931. doi:10.2307/2234988.
Millar, R. 2017. Why the 1.5C warming limit is not yet a geophysical impossibility. Carbon
Brief. URL; https://www.carbonbrief.org/guest-post-why-the-one-point-five-warming-
limit-is-not-yet-a-geophysical-impossibility.
Millar, R.J., Fuglestvedt, J.S., Friedlingstein, P., Rogelj, J., Grubb, M.J., Matthews, H.D.,
Skeie, R.B., Forster, P.M., Frame, D.J., and Allen, M.R. 2017. Emission budgets and
pathways consistent with limiting warming to 1.5 °C. Nature Geoscience 10 (10):
741–47. doi:10.1038/ngeo3031.
Miller, K. 2013. Putting down a coal plant: retiring a utility asset. URL;
https://nanopdf.com/download/putting-down-a-coal-plant-retiring-a-utility-asset_pdf.
Mills, A.D., Wiser, R.H., and Seel, J. 2017. Power plant retirements: trends and possible
drivers. Energy Analysis and Environmental Impacts Division, Lawrence Berkeley
National Laboratory. doi:10.2172/1411667.
Neij, L. 1997. Use of experience curves to analyse the prospects for diffusion and adoption of
renewable energy technology. Energy Policy 25 (13): 1099–1107. doi:10.1016/S0301-
4215(97)00135-3.
Nelson, R.R., and Winter, S.G. 1977. In search of useful theory of innovation. Reserach
Policy 6: 41.
Nordensvard, J., Zhou, Y., and Zhang, X. 2018. Innovation core, innovation semi-periphery
and technology transfer: the case of wind energy patents. Energy Policy 120
(September): 213–27. doi:10.1016/j.enpol.2018.04.048.
Oei, P.-Y., Brauers, H., and Herpich, P. 2019. Lessons from Germany’s hard coal mining
phase-out: policies and transition from 1950 to 2018. Climate Policy, November, 1–
17. doi:10.1080/14693062.2019.1688636.
Öko Institut. 2017. Die deutsche Braunkohlenwirtschaft. Historische Entwicklungen,
Ressourcen, Technik, wirtschaftliche Strukturen und Umweltauswirkungen. URL;
https://www.oeko.de/publikationen/p-details.
O’Neill, B.C., Oppenheimer, M., Warren, R., Hallegatte, S., Kopp, R.E., Pörtner, H.O.,
Scholes, R., et al. 2017. IPCC reasons for concern regarding climate change risks.
Nature Climate Change 7 (1): 28–37. doi:10.1038/nclimate3179.
Pearson, P.J.G., and Foxon, T.J. 2012. A low carbon industrial revolution? Insights and
challenges from past technological and economic transformations. Energy Policy 50
(November): 117–27. doi:10.1016/j.enpol.2012.07.061.
Peters, G.P. 2018. Beyond carbon budgets. Nature Geoscience 11 (6): 378–80.
doi:10.1038/s41561-018-0142-4.
Pfeiffer, A., Hepburn, C., Vogt-Schilb, A., and Caldecott, B. 2018. Committed emissions
from existing and planned power plants and asset stranding required to meet the Paris
CE
UeT
DC
olle
ctio
n
References
101
Agreement. Environmental Research Letters 13 (5): 054019. doi:10.1088/1748-
9326/aabc5f.
Pfeiffer, A., Millar, R., Hepburn, C., and Beinhocker, E. 2016. The ‘2°C Capital Stock’ for
electricity generation: committed cumulative carbon emissions from the electricity
generation sector and the transition to a green economy. Applied Energy 179
(October): 1395–1408. doi:10.1016/j.apenergy.2016.02.093.
PIK. 2020. Coal exit benefits outweigh its costs. Potsdam Institute for Climate Impact
Research. URL; https://www.pik-potsdam.de/news/press-releases.
Pollitt, M.G. 2012. The role of policy in energy transitions: lessons from the energy
liberalisation era. Energy Policy 50 (November): 128–37.
doi:10.1016/j.enpol.2012.03.004.
Powell, W.W. 1991. Expanding the scope of institutional analysis. In The New
Institutionalism in Organizational Analysis. Chicago: University of Chicago Press.
PPCA. 2020. Powering Past Coal Alliance | Working towards the global phase-out of
unabated coal power. Powering Past Coal Alliance (PPCA). URL;
https://poweringpastcoal.org.
Rao, K.U., and Kishore, V.V.N. 2010. A review of technology diffusion models with special
reference to renewable energy technologies. Renewable and Sustainable Energy
Reviews 14 (3): 1070–78. doi:10.1016/j.rser.2009.11.007.
Rauner, S., Bauer, N., Dirnaichner, A., Dingenen, R.V., Mutel, C., and Luderer, G. 2020.
Coal-exit health and environmental damage reductions outweigh economic impacts.
Nature Climate Change 10 (4): 308–12. doi:10.1038/s41558-020-0728-x.
Rip, A., and Kemp. 1998. Technological change. In Human Choice and Climate Change. 2:
Resources and Technology, edited by Steve Rayner. Columbus, Ohio: Battelle Press.
Ritchie, J., and Dowlatabadi, H. The 1,000 GtC coal question: are cases of high future coal
combustion plausible? Discussion Paper RFFDP 16-45. Washington: Resources for
the Future.
Rocha, M., Hare, B., Yanguas Parra, P.A., Roming, N., Ural, U., Ancygier, A., Cantzler, J.,
Sferra, F., Li, H., and Schaeffer, M. 2016. Implications of the Paris Agreement for
coal use in the power sector. Climate Analytics.
Rode, D.C., Fischbeck, P.S., and Páez, A.R. 2017. The retirement cliff: power plant lives and
their policy implications. Energy Policy 106 (July): 222–32.
doi:10.1016/j.enpol.2017.03.058.
Rogelj, J., Popp, A., Calvin, K.V., Luderer, G., Emmerling, J., Gernaat, D., Fujimori, S., et al.
2018. Scenarios towards limiting global mean temperature increase below 1.5 °C.
Nature Climate Change 8 (4): 325–32. doi:10.1038/s41558-018-0091-3.
Rogers, E.M. 2003. Diffusion of Innovations, 5th Edition. Simon and Schuster.
Rogge, K.S., and Reichardt, K. 2016. Policy mixes for sustainability transitions: an extended
concept and framework for analysis. Research Policy 45 (8): 1620–35.
doi:10.1016/j.respol.2016.04.004.
Rosseel, Y. 2020. The lavaan tutorial. Department of Data Analysis, Ghent University,
Belgium.
CE
UeT
DC
olle
ctio
n
References
102
S&P Global Platts. 2017. World Electric Power Plants Data Base (WEPP).
Schilling, M.A., and Esmundo, M. 2009. Technology S-curves in renewable energy
alternatives: analysis and implications for industry and government. Energy Policy 37
(5): 1767–81. doi:10.1016/j.enpol.2009.01.004.
Schlandt, J. 2015. Capacity markets around the world. Clean Energy Wire. URL;
https://www.cleanenergywire.org/factsheets/capacity-markets-around-world.
Schmidt, T. 2014. Low-carbon investment risks and de-risking. Nature Climate Change 4
(March). doi:10.1038/nclimate2112.
Schomerus, T., and Franßen, G. 2018. Klimaschutz und die rechtliche Zulässigkeit der
Stilllegung von Braun- und Steinkohlekraftwerken. Heinemann & Partner
Rechtsanwälte Partnerschaftsgesellschaft mbB.
Schot, J., and Geels, F.W. 2008. Strategic niche management and sustainable innovation
journeys: theory, findings, research agenda, and policy. Technology Analysis &
Strategic Management 20 (5): 537–54. doi:10.1080/09537320802292651.
Schurer, A.P., Cowtan, K., Hawkins, E., Mann, M.E., Scott, V., and Tett, S.F.B. 2018.
Interpretations of the Paris climate target. Nature Geoscience 11 (4): 220–21.
doi:10.1038/s41561-018-0086-8.
Scott, W. 2008. Institutions and organizations: ideas and interests. Institutions and
Organizations: Ideas and Interests, January. URL;
https://digitalcommons.usu.edu/unf_research/55.
Shearer, C., Mathew-Shah, N., Myllyvirta, L., Yu, A., and Nace, T. 2018. Boom and bust
2018. Tracking the global coal plant pipeline.
Shearer, C., Myllyvirta, L., Yu, A., Aitken, G., Mathew-Shah, N., Dallos, G., and Nace, T.
2020. Boom and bust 2020. Tracking the global coal plant pipeline.
Shi, D., Maydeu-Olivares, A., and DiStefano, C. 2018. The relationship between the
standardized root mean square residual and model misspecification in factor analysis
models. Multivariate Behavioral Research 53 (5): 676–94.
doi:10.1080/00273171.2018.1476221.
Shrimali, G. 2020. Making India’s power system clean: retirement of expensive coal plants.
Energy Policy 139 (April): 111305. doi:10.1016/j.enpol.2020.111305.
Smil, V. 2016. Examining energy transitions: a dozen insights based on performance. Energy
Research & Social Science 22 (December): 194–97. doi:10.1016/j.erss.2016.08.017.
Smith, A., and Kern, F. 2009. The transitions storyline in Dutch environmental policy.
Environmental Politics 18 (1). Routledge: 78–98. doi:10.1080/09644010802624835.
Smith, A., and Stirling, A. 2010. The politics of social-ecological resilience and sustainable
socio-technical transitions. Ecology and Society 15 (1): art11. doi:10.5751/ES-03218-
150111.
Smith, A., Voß, J.-P., and Grin, J. 2010. Innovation studies and sustainability transitions: the
allure of the multi-level perspective and its challenges. Research Policy, Special
Section on Innovation and Sustainability Transitions, 39 (4): 435–48.
doi:10.1016/j.respol.2010.01.023.
CE
UeT
DC
olle
ctio
n
References
103
Sovacool, B.K. 2016. How long will it take? Conceptualizing the temporal dynamics of
energy transitions. Energy Research & Social Science 13 (March): 202–15.
doi:10.1016/j.erss.2015.12.020.
Sovacool, B.K., and Geels, F.W. 2016. Further reflections on the temporality of energy
transitions: a response to critics. Energy Research & Social Science 22 (December):
232–37. doi:10.1016/j.erss.2016.08.013.
Spencer, T., Colombier, M., Sartor, O., Garg, A., Tiwari, V., Burton, J., Caetano, T., Green,
F., Teng, F., and Wiseman, J. 2018. The 1.5°C target and coal sector transition: at the
limits of societal feasibility. Climate Policy 18 (3): 335–51.
doi:10.1080/14693062.2017.1386540.
Steckel, J.C., Edenhofer, O., and Jakob, M. 2015. Drivers for the renaissance of coal.
Proceedings of the National Academy of Sciences 112 (29): E3775–81.
doi:10.1073/pnas.1422722112.
Steffen, B., and Schmidt, T. 2019. A quantitative analysis of 10 multilateral development
banks’ investment in conventional and renewable power-generation technologies from
2006 to 2015. Nature Energy 4 (January). doi:10.1038/s41560-018-0280-3.
Stephens, J.C. 2015. Carbon capture and storage: a controversial climate mitigation approach.
The International Spectator 50 (1). Routledge: 74–84.
doi:10.1080/03932729.2015.994336.
Sundstrom, S.M., and Allen, C.R. 2019. The adaptive cycle: more than a metaphor.
Ecological Complexity 39 (August): 100767. doi:10.1016/j.ecocom.2019.100767.
The Guardian. 2019. Extinction Rebellion activists stop coal train in Brisbane | Environment |
The Guardian. URL;
https://www.theguardian.com/environment/2019/apr/19/extinction-rebellion-activists-
stop-coal-train-in-brisbane.
Thomson, E. 2003. The Chinese coal industry: an economic history. Routledge.
Tianjie. 2017. President Xi champions low-carbon development at Davos. China Dialogue.
URL; https://www.chinadialogue.net/article/show/single/en/9553-President-Xi-
champions-low-carbon-development-at-Davos.
Tong, D., Zhang, Q., Zheng, Y., Caldeira, K., Shearer, C., Hong, C., Qin, Y., Davis, S.J.
2019. Committed emissions from existing energy infrastructure jeopardize 1.5°C
climate target. Nature 572 (7769): 373-77. doi: 10.1038/s41586-019-1364-3.
Turnheim, B., and Geels, F.W. 2012. Regime destabilisation as the flipside of energy
transitions: lessons from the history of the British coal industry (1913–1997). Energy
Policy 50 (November): 35–49. doi:10.1016/j.enpol.2012.04.060.
Umweltbundesamt. 2009. Klimaschutz und Versorgungssicherheit. Climate Change, 13/2009.
Umweltbundesamt. URL;
https://www.umweltbundesamt.de/publikationen/klimaschutz-versorgungssicherheit.
United Nations. 2015. Paris Agreement. URL;
https://unfccc.int/sites/default/files/english_paris_agreement.pdf.
Unruh, G.C. 2000. Understanding carbon lock-in. Energy Policy 28 (12): 817–30.
doi:10.1016/S0301-4215(00)00070-7.
CE
UeT
DC
olle
ctio
n
References
104
———. 2002. Escaping carbon lock-in. Energy Policy 30 (4): 317–25. doi:10.1016/S0301-
4215(01)00098-2.
Urgewald. 2019. Companies driving the world’s coal expansion revealed: NGOs release new
global coal exit list for finance industry.
van Breevoort, P., Blok, K., Hagemann, M., Fekete, H., Höhne, N., Hare, B., Schaeffer, M.,
Rocha, M., and Jeffery, L. 2015. The coal gap: planned coal-fired power plants
inconsistent with 2˚C and threaten achievement of INDCs. Climate Action Tracker,
10.
van der Brugge, R., and van Raak, R. 2007. Facing the adaptive management challenge:
insights from transition management. Ecology and Society 12 (2): art33.
doi:10.5751/ES-02227-120233.
Verbong, G., and Geels, F. 2007. The ongoing energy transition: lessons from a socio-
technical, multi-level analysis of the Dutch electricity system (1960–2004). Energy
Policy 35 (2): 1025–37. doi:10.1016/j.enpol.2006.02.010.
Vinichenko, V., and Jewell, J. 2019. The political feasibility of climate targets in light of
historical experience of fossil fuel decline. Pap Present ECPR Gen Conf 2019.
Wamsted, D., Feaster, S., and Schlissel, D. 2019. Coal outlook 2019: domestic market decline
continues. Institute for Energy Economics and Financial Analysis (IEEFA).
Welt.de. 2019. Klima-Proteste: Aktivisten von „Ende Gelände“ Blockieren Kohlekraftwerk -.
URL; https://www.welt.de/politik/deutschland/article197919667/Klima-Proteste-
Aktivisten-von-Ende-Gelaende-blockieren-Kohlekraftwerk.html.
Wiek, A., and Lang, D.J. 2016. Transformational sustainability research methodology. In
Sustainability Science, edited by Harald Heinrichs, Pim Martens, Gerd Michelsen, and
Arnim Wiek, 31–41. Dordrecht: Springer Netherlands. doi:10.1007/978-94-017-7242-
6_3.
Williams, J.H., DeBenedictis, A., Ghanadan, R., Mahone, A., Moore, J., Morrow, W.R.,
Price, S., and Torn, M.S. 2012. The technology path to deep greenhouse gas emissions
cuts by 2050: the pivotal role of electricity. Science 335 (6064): 53–59.
doi:10.1126/science.1208365.
Wilson, C., Grubler, A., Bauer, N., Krey, V., and Riahi, K. 2013. Future capacity growth of
energy technologies: are scenarios consistent with historical evidence? Climatic
Change 118 (2): 381–95. doi:10.1007/s10584-012-0618-y.
Wilson, C. 2012. Up-scaling, formative phases, and learning in the historical diffusion of
energy technologies. Energy Policy 50 (November): 81–94.
doi:10.1016/j.enpol.2012.04.077.
Wolde-Rufael, Y. 2010. Coal consumption and economic growth revisited. Applied Energy 87
(1): 160–67. doi:10.1016/j.apenergy.2009.05.001.
World Coal Association. 2020. Pathway towards zero emissions from coal. Solutions to
climate change will come through technological change and action on all low emission
technologies. World Coal Association. URL; https://www.worldcoal.org/home.
World Energy Council. 2013. World energy perspective: cost of energy technologies. London,
UK: World Energy Council. https://www.worldenergy.org/publications/entry/world-
energy-perspective-cost-of-energy-technologies.
CE
UeT
DC
olle
ctio
n
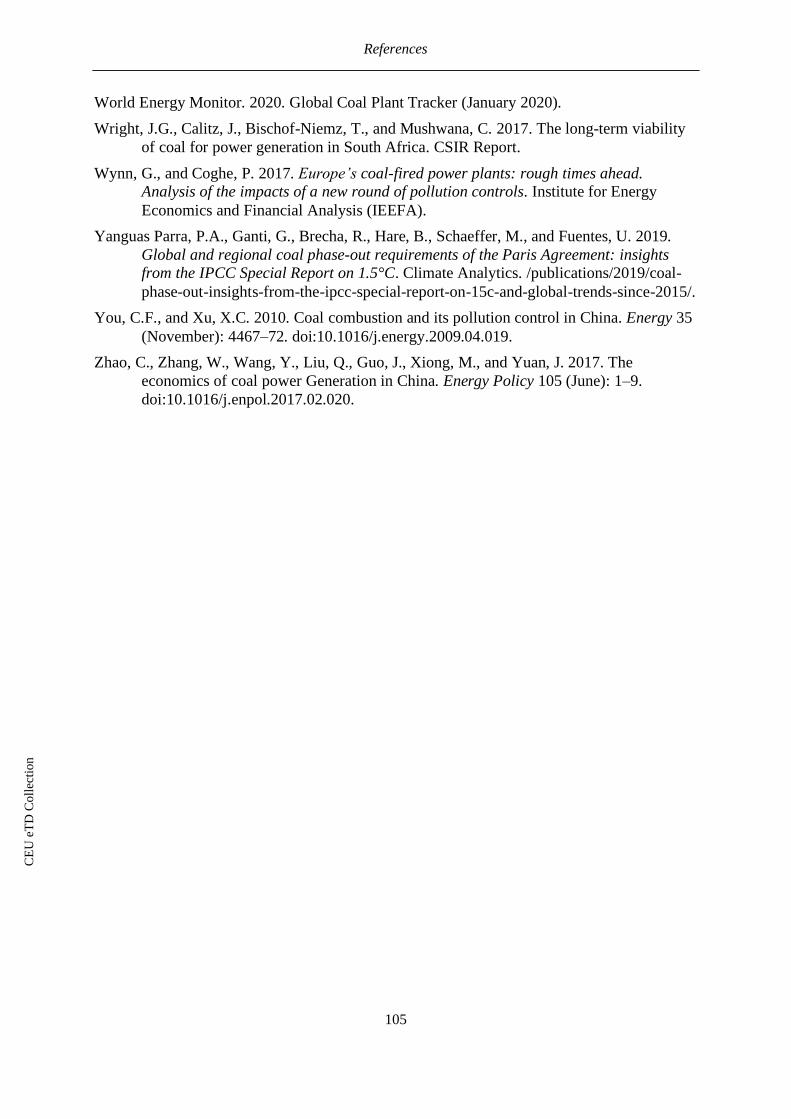
References
105
World Energy Monitor. 2020. Global Coal Plant Tracker (January 2020).
Wright, J.G., Calitz, J., Bischof-Niemz, T., and Mushwana, C. 2017. The long-term viability
of coal for power generation in South Africa. CSIR Report.
Wynn, G., and Coghe, P. 2017. Europe’s coal-fired power plants: rough times ahead.
Analysis of the impacts of a new round of pollution controls. Institute for Energy
Economics and Financial Analysis (IEEFA).
Yanguas Parra, P.A., Ganti, G., Brecha, R., Hare, B., Schaeffer, M., and Fuentes, U. 2019.
Global and regional coal phase-out requirements of the Paris Agreement: insights
from the IPCC Special Report on 1.5°C. Climate Analytics. /publications/2019/coal-
phase-out-insights-from-the-ipcc-special-report-on-15c-and-global-trends-since-2015/.
You, C.F., and Xu, X.C. 2010. Coal combustion and its pollution control in China. Energy 35
(November): 4467–72. doi:10.1016/j.energy.2009.04.019.
Zhao, C., Zhang, W., Wang, Y., Liu, Q., Guo, J., Xiong, M., and Yuan, J. 2017. The
economics of coal power Generation in China. Energy Policy 105 (June): 1–9.
doi:10.1016/j.enpol.2017.02.020.
CE
UeT
DC
olle
ctio
n
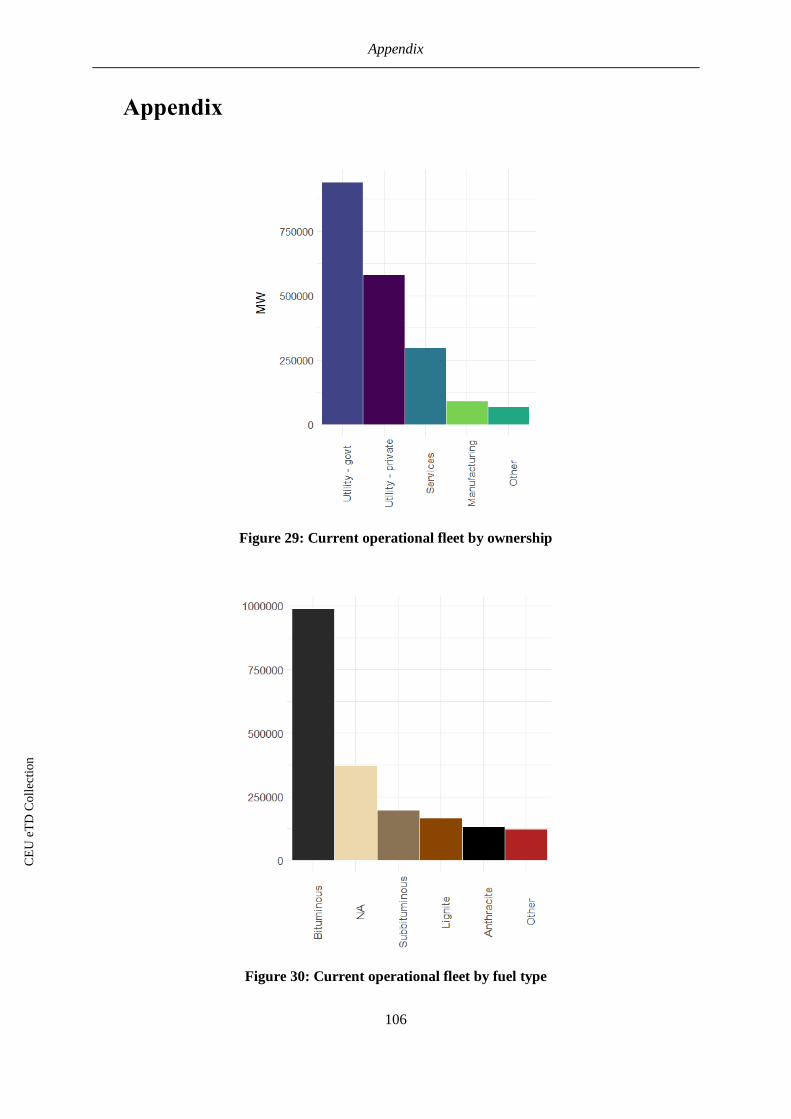
Appendix
106
Appendix
Figure 29: Current operational fleet by ownership
Figure 30: Current operational fleet by fuel type
CE
UeT
DC
olle
ctio
n
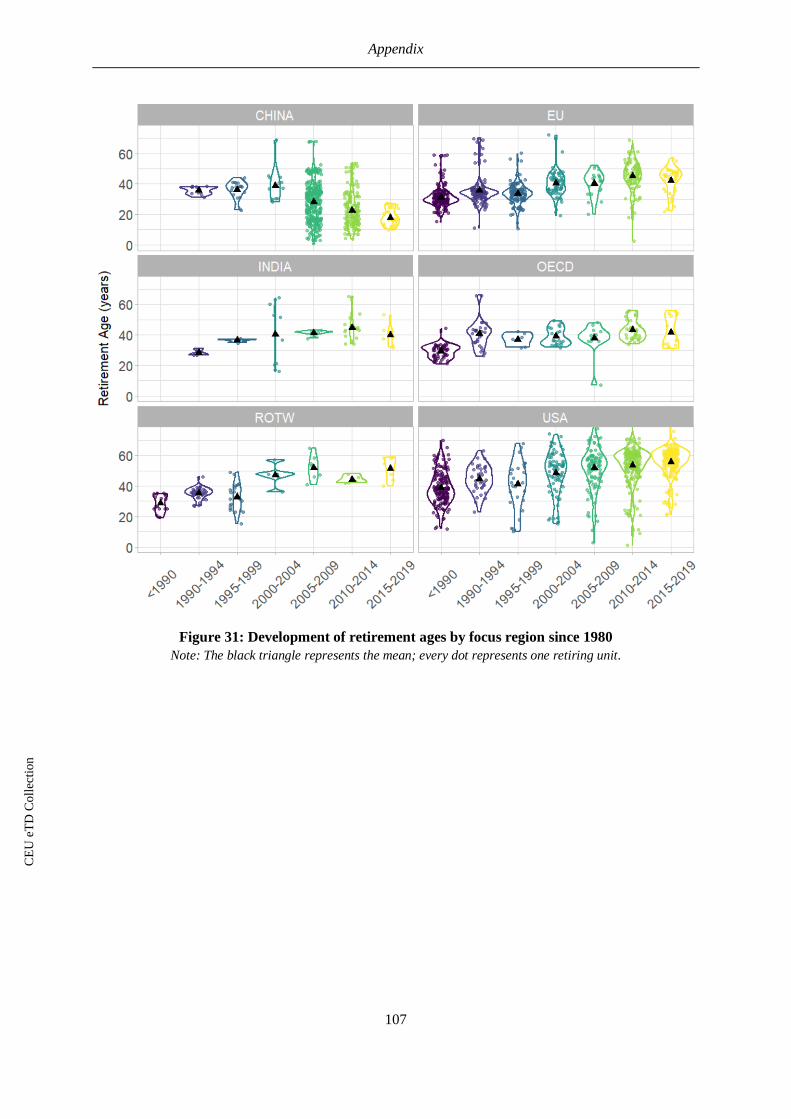
Appendix
107
Figure 31: Development of retirement ages by focus region since 1980
Note: The black triangle represents the mean; every dot represents one retiring unit.
CE
UeT
DC
olle
ctio
n
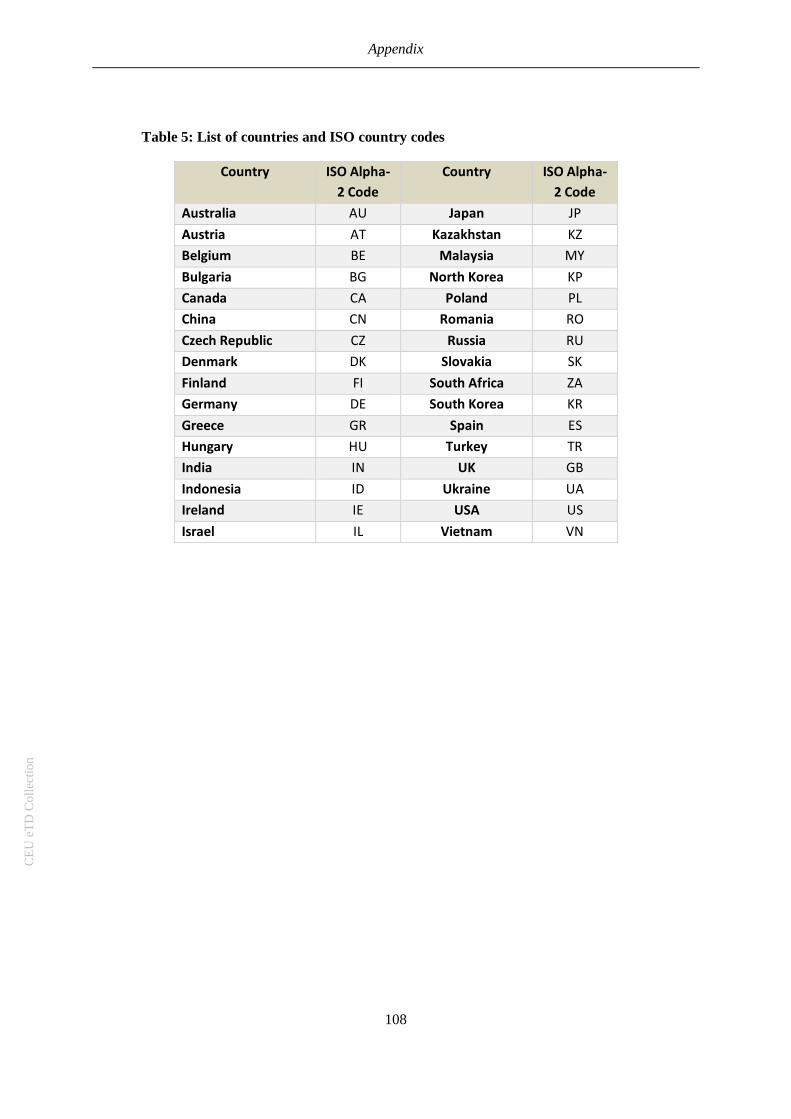
Appendix
108
Table 5: List of countries and ISO country codes
Country ISO Alpha-
2 Code
Country ISO Alpha-
2 Code
Australia AU Japan JP
Austria AT Kazakhstan KZ
Belgium BE Malaysia MY
Bulgaria BG North Korea KP
Canada CA Poland PL
China CN Romania RO
Czech Republic CZ Russia RU
Denmark DK Slovakia SK
Finland FI South Africa ZA
Germany DE South Korea KR
Greece GR Spain ES
Hungary HU Turkey TR
India IN UK GB
Indonesia ID Ukraine UA
Ireland IE USA US
Israel IL Vietnam VN
CE
UeT
DC
olle
ctio
n
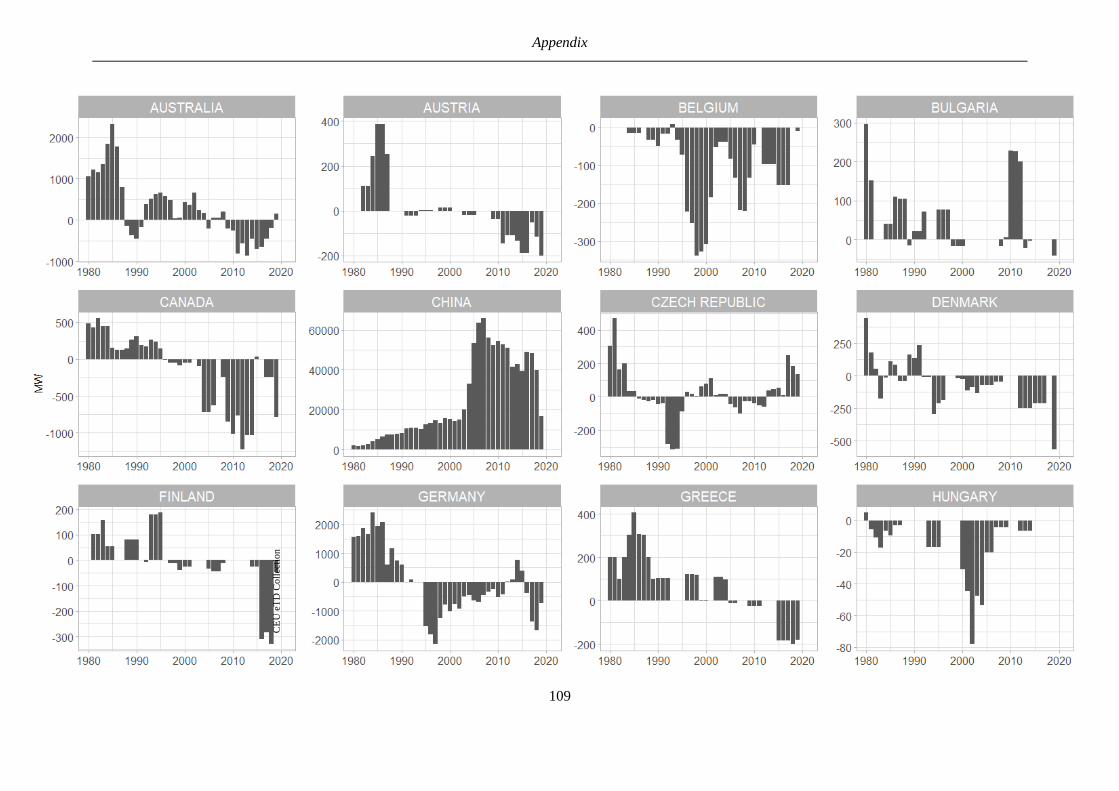
Appendix
109
CE
UeT
DC
olle
ctio
n
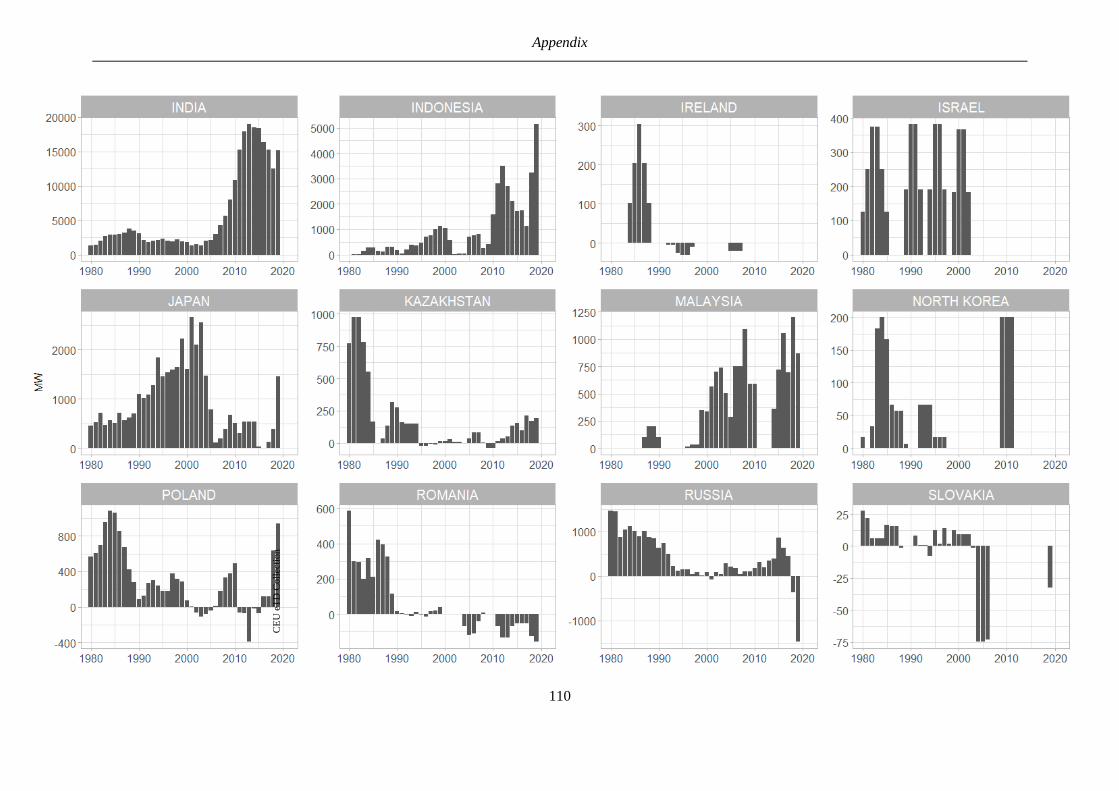
Appendix
110
CE
UeT
DC
olle
ctio
n
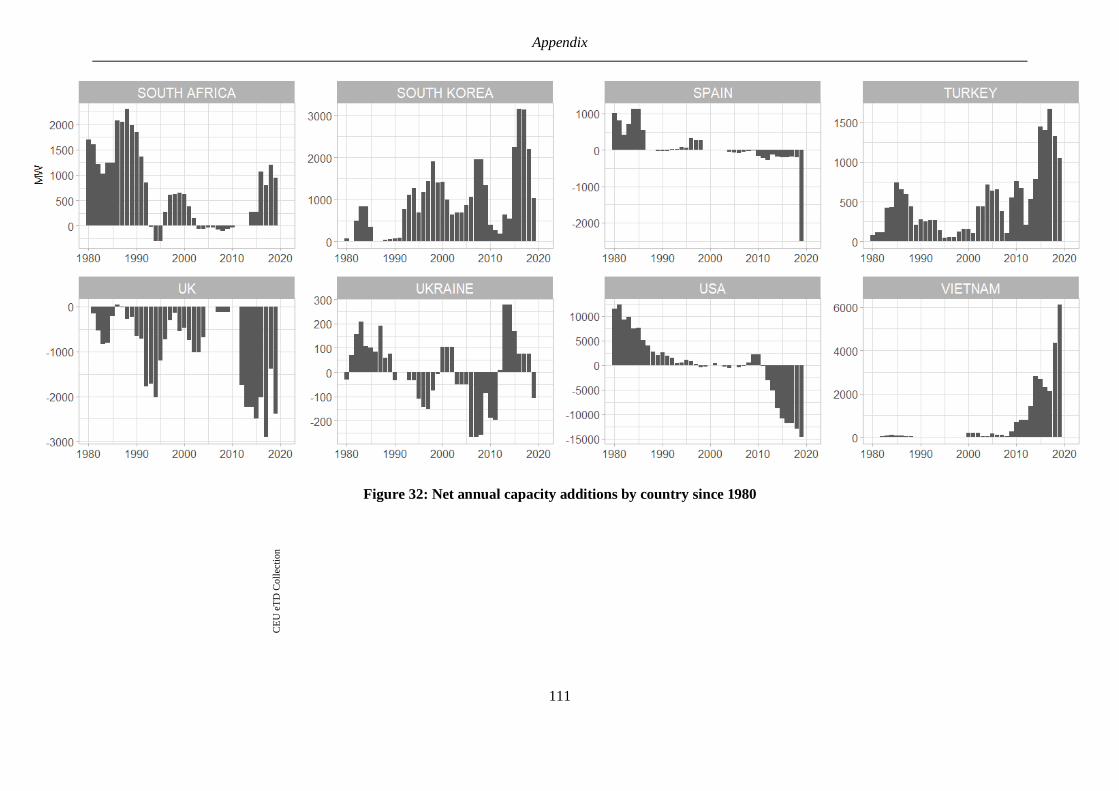
Appendix
111
Figure 32: Net annual capacity additions by country since 1980
CE
UeT
DC
olle
ctio
n
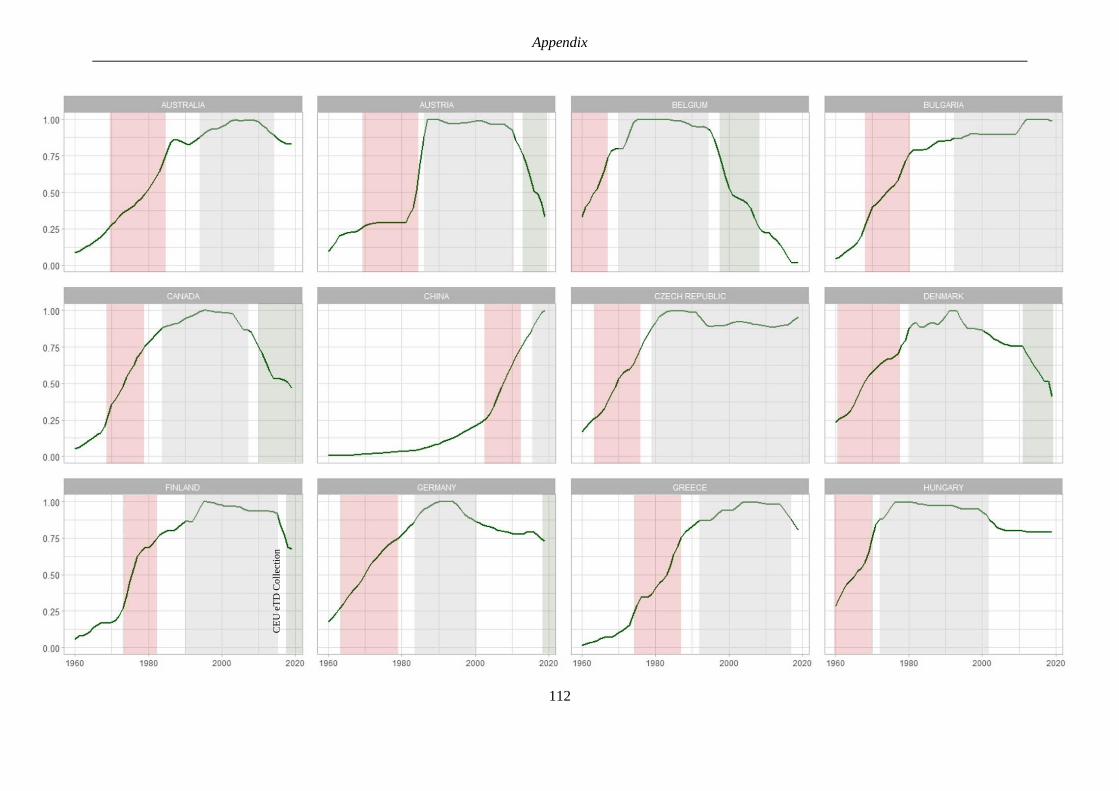
Appendix
112
CE
UeT
DC
olle
ctio
n
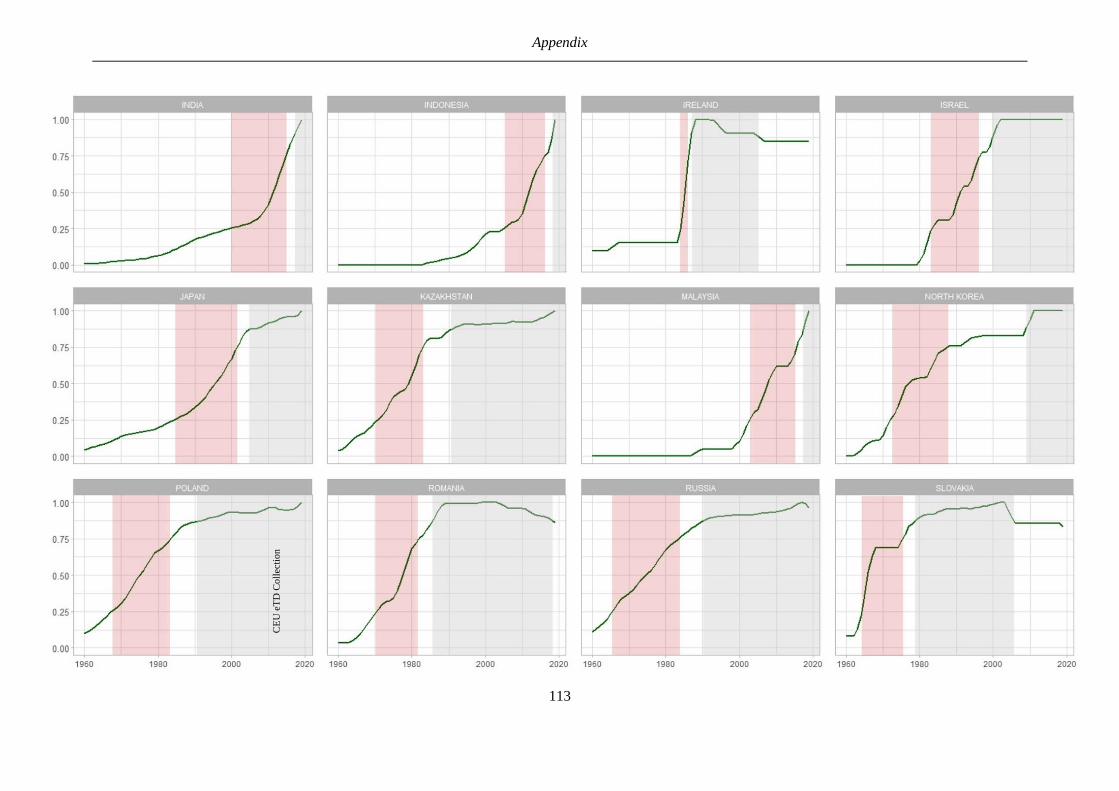
Appendix
113
CE
UeT
DC
olle
ctio
n
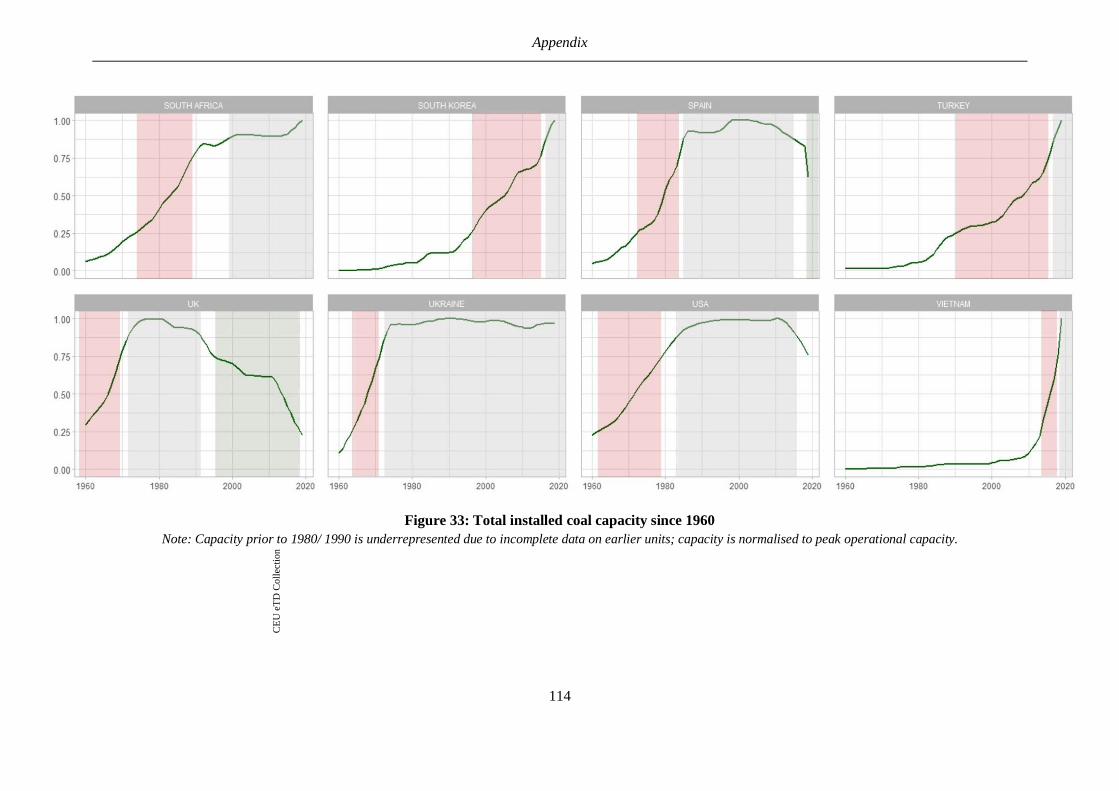
Appendix
114
Figure 33: Total installed coal capacity since 1960
Note: Capacity prior to 1980/ 1990 is underrepresented due to incomplete data on earlier units; capacity is normalised to peak operational capacity.
CE
UeT
DC
olle
ctio
n
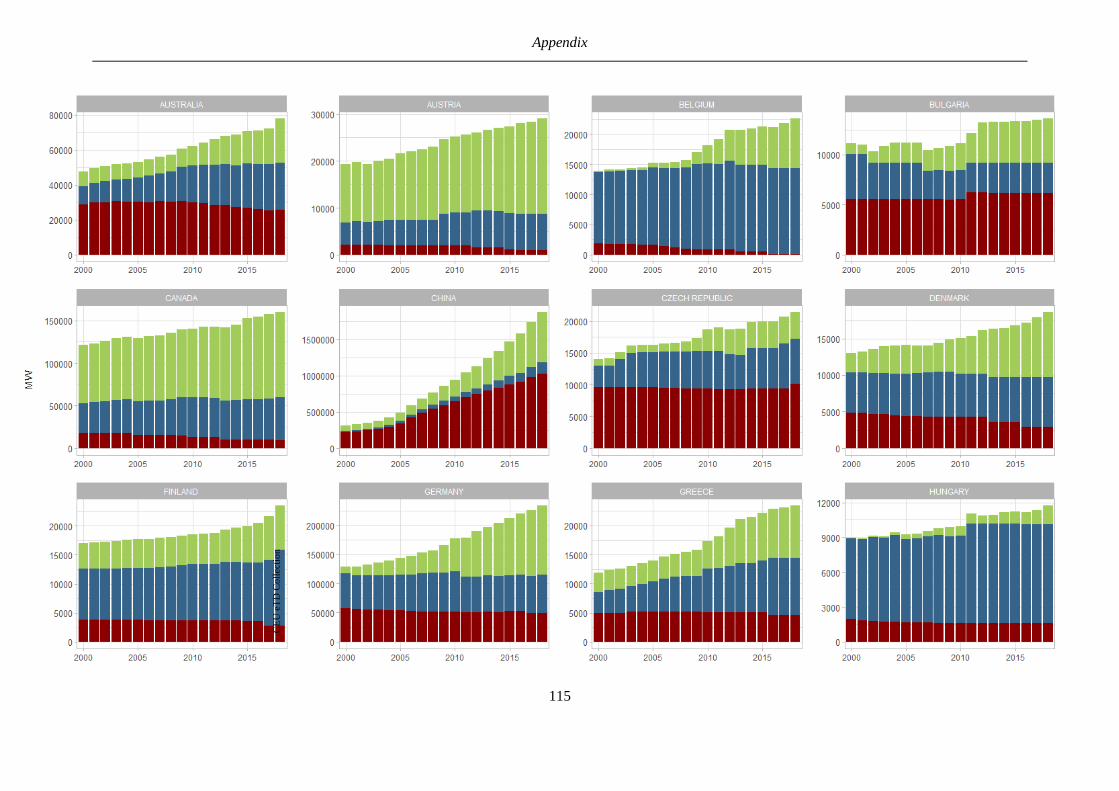
Appendix
115
CE
UeT
DC
olle
ctio
n
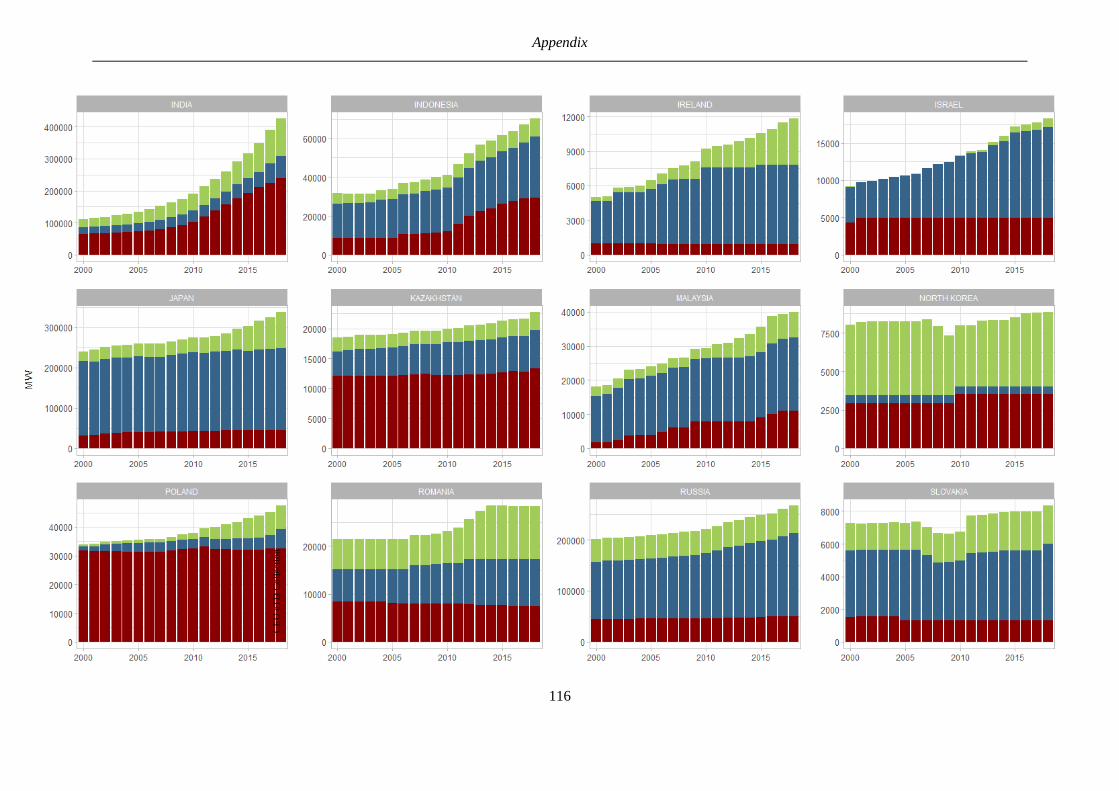
Appendix
116
CE
UeT
DC
olle
ctio
n
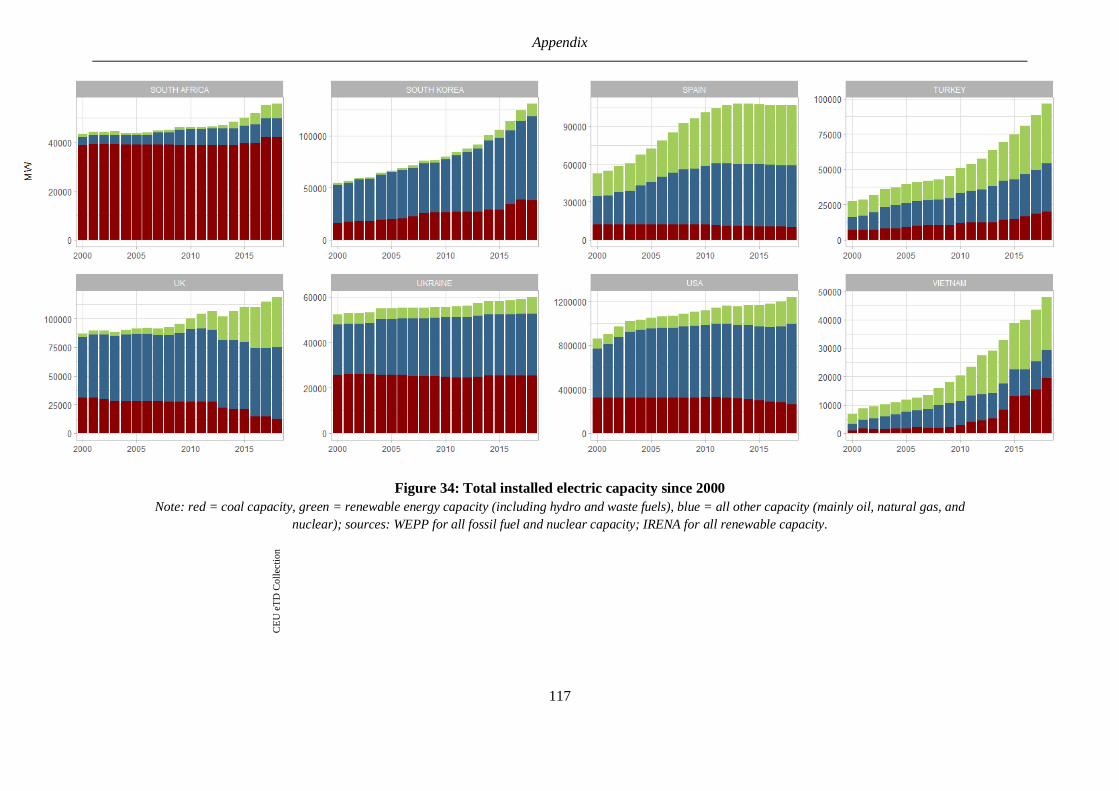
Appendix
117
Figure 34: Total installed electric capacity since 2000
Note: red = coal capacity, green = renewable energy capacity (including hydro and waste fuels), blue = all other capacity (mainly oil, natural gas, and
nuclear); sources: WEPP for all fossil fuel and nuclear capacity; IRENA for all renewable capacity.
CE
UeT
DC
olle
ctio
n