party expenditure and electoral prospects: a national level analysis of britain
TRANSCRIPT

Electoral Studies 18 (1999) 519–532www.elsevier.com/locate/electstud
Party expenditure and electoral prospects: anational level analysis of Britain
Justin FisherDepartment of Politics and Modern History, London Guildhall University, Old Castle Street, London,
E1 7NT, UK
Abstract
The effectiveness of campaign spending is a hotly contested issue. Much of that debateconcentrates upon predetermined or assumed campaign periods. Yet, in a party and electoralsystem such as Britain, parties are continually campaigning. Party expenditure may thereforehave a constant and cumulative effect. This article examines whether increased party spendingat the national level is electorally significant. It analyses annual data from 1959 to 1994 andconcludes that there is insufficient consistent evidence wholly to support this proposition.1999 Elsevier Science Ltd. All rights reserved.
Keywords:Elections; Party finance; Incumbents; Challengers; National
1. Introduction
Herbert Alexander, a prominent writer in the field of political finance, has arguedthat political power is built upon three constituencies: the electoral, the financial andthe organisational. Money is an element of political power because it buys what isnot or cannot be volunteered (Adamany and Agree, 1975, p. 3; Alexander, 1984, p.3). Moreover, money is the most important constituent because finance also domi-nates the organisational and electoral aspects of political life (Alexander, 1989, pp.10–12). The importance of money in politics is fundamental, for it can affect politicalspending and contributes to debates concerning political equality. Some claim thatmoney distorts this equality. They argue that since all citizens have an equal rightto political participation, so all interests should receive financial support in proportionto their adherents. The reality is, however, that wealthy groups are represented
0261-3794/99/$ - see front matter 1999 Elsevier Science Ltd. All rights reserved.PII: S0261 -3794(99 )00021-9

520 J. Fisher /Electoral Studies 18 (1999) 519–532
beyond the proportion of their number. Inequalities in money are greater than anyother inequalities of the resources that go into political life, because money can buyvirtually all of the resources that are given directly by citizens (Paltiel, 1981; Adam-any and Agree, 1975). Money is essential for the very existence and survival ofpolitical parties, but debate has tended to suggest that disparities in the financialendowment of parties distorts electoral competition in favour of the most wealthyparty. The logic of this argument is simple—namely that increased spending capacityprovides parties with greater opportunities to promote themselves to voters and theexploitation of such opportunities will result in electoral payoffs. Consequently, itis argued that unregulated political finance fails to guarantee a level playing field inthe competition for power, thus undermining the right to equal political participation.
Claims that party expenditure may be electorally significant are based upon theidea that money is a constant sum. The implicit assumption is that a resource (inthis case money) will be used with equal degrees of skill. However, there is a goodtheoretical case to be made against this assumption. For example, if I were to give£100 each to three election candidates with the instruction to use that money topromote their candidature, it might be that each would choose a different manner inwhich to promote themselves. Candidate A might produce 1000 leaflets, CandidateB might produce one large poster and Candidate C might spend the money on aloudhailer for his or her campaign vehicle. Although the initial sums are the same,their electoral impact might not be identical. Money would not therefore be a constantsum. Even if all three candidates produced 1000 leaflets, there is no guarantee thatthe leaflets would be equally well received or that they would have an equal impacton the vote, since the leaflets could be produced with varying degrees of skill. Not-withstanding these arguments however, there is some evidence to suggest that partyspending does have an impact upon electoral outcomes.
2. Comparative evidence
Jacobson (1980) tests the significance of financial endowment in terms of electoralsuccess. Using data from congressional elections in the United States, he argues thatif money is significant in the electoral prospects of candidates, then it will be ofgreater significance for challengers than for incumbents. All other things being equal,voters will favour candidates about whom they have the most information. Sinceincumbents use their office to publicise themselves, such candidates should requireless publicity (and therefore funds) during an election. Moreover, incumbents willbe likely to spend less if they feel that their re-election is reasonably assured. Con-versely a challenger, who has not enjoyed the benefits of incumbent publicity, willhave greater need for campaign finance (Jacobson, 1980, pp. 36–37). As a result,money spent by challengers should have a greater electoral impact than that spentby incumbents. Jacobson’s testing tends to confirm his hypothesis. Moreover, whilsthis analysis is centred around individual candidates in congressional elections, heargues that the incumbency effect upon the relative need for campaign expenditurewill also be reflected in broader terms (Jacobson, 1980, p. 37).

521J. Fisher /Electoral Studies 18 (1999) 519–532
Jacobson’s work has not been without its critics, however. Green and Krasno(1988, 1990) argue that incumbent spending is more significant than Jacobson hadclaimed and that challenger spending is less significant and subject to diminishingreturns. Gerber (1998) (p. 402) also questions Jacobson’s position. He argues firstly,that while incumbents may be well-known and therefore have an information advan-tage, challengers can spend money to address new issues which may not be on theestablished political agenda. Thus, challengers have a theoretical advantage of estab-lishing themselves as champions of a particular cause. Secondly, campaigning maynot only be positive, promoting one’s own cause, but also negative—highlightingdamaging information about an opponent. Thus incumbents have an advantage wherechallengers are less well known since they have a greater opportunity to shape prefer-ences about that candidate. Thirdly, incumbents in theory should be more effectivein their spending since they will typically be better organised. Finally, Gerber drawsupon simple pleas to ‘common sense’—if incumbent spending is so futile, why doso many raise and spend so much money? This final claim is certainly the leastrobust of Gerber’s criticisms, since the mere fact that people do something does notprove its effectiveness, even if the assumptions of the significance of campaignspending may suggest rationality on the part of these candidates.
Gerber (1998) (p. 401) also questions Jacobson’s approach by suggesting the ideathat campaign spending is exogenous is an erroneous assumption. He points out thatmost models of party spending have assumed the exogenous nature of spendinglevels. In fact, Jacobson (1990) (p. 335) accepts that his model may not be entirelywatertight. In particular, he highlights the fact that the relationship between moneyand electoral popularity may be reciprocal. Thus, there is likely to be a relationshipbetween how a candidate is likely to perform on election day and how much he orshe can raise. In turn, this will affect how much he or she can spend, which in turnmay affect how well he or she performs electorally.
In Britain there is repeated evidence at constituency level that general electionparty expenditure can influence electoral outcomes (Johnston, 1985, 1986; Johnstonand Pattie, 1995; Pattie et al., 1995). These analyses show that on average the Con-servatives spend most per constituency (Johnston and Pattie, 1995, p. 262) and thegreatest proportion of the maximum permitted by electoral law (Johnston and Pattie,1995, p. 263; Pattie et al., 1995, pp. 971–972). For all parties, increased spendingat constituency level improves electoral performance within that constituency(Johnston and Pattie, 1995, p. 269). That said, the effect is stronger amongst chal-lengers than amongst incumbents, where the impact of increased expenditure ismixed (Pattie et al., 1995, pp. 979–980). This is consistent with Jacobson’s argumentthat high incumbent spending may be interpreted as a sign of electoral weaknessrather than strength, since incumbents tend to spend more when under a sustainedchallenge.
3. National level analysis
In this article, the intention is to move from examining local and candidate levelelectoral effects to those at national level. Thus, the focus of this analysis will differ
522 J. Fisher /Electoral Studies 18 (1999) 519–532
from the existing literature in three principal respects. First, it will focus uponnational level spending and national level vote share. Secondly, unlike the candidate-based analyses in the work from the United States, this analysis focuses upon parties,in a manner similar to Johnston and his colleagues. Thirdly, the focus is not simplyupon official campaigns, but upon annual levels of electoral popularity. Notwith-standing these differences, however, the analysis will attempt to establish whetherthe findings of these previous studies hold in the national environment.
The contention in this article is that party campaigning is something of a constant,rather than an activity existing only at certain points of a cycle. Party spending willnecessarily be linked to this activity. Thus, whilst parties concentrate most attentionupon general elections and to lesser extent, the other elections occurring during thiscycle, they do not only operate and campaign at these times. Parties are continuallycompeting to win the support of public opinion. To use a sporting analogy, partiesare not simply playing friendlies between general elections, they are in the qualifyingstages for the World Cup. Party expenditure may be seen therefore, as having longer-term impact upon electoral choice rather than just a short-term impact at general elec-tions.
Moreover, continually good party performance, especially at the electoral level,will enhance voters’ opinions of that party when they come to make electoral choices.An analogy would be with a corporation that performed consistently well in a varietyof markets. Consistent performance would promote consumer confidence in thatbrand. Such confidence in the party will assist in voters’ decision-making. Forexample, under a Downsian model, should ideological distance between parties besuch that a voter is unable to make a choice, then the voter will judge the credibilityof parties to pursue their programmes (Downs, 1957, pp. 41–45; Laver, 1997, pp.99–100). It is likely that continually good performance will contribute to such evalu-ations of credibility.
3.1. Party expenditure at the national level in Britain
Running a political party is an expensive activity. Competitive political partiesrequire funds for three purposes: to fight election campaigns, to maintain viableinterelection organisations and to provide research and other assistance to the leader-ship and representatives of the party (Paltiel, 1981, p. 139). As the 1966 BarbeauCommittee Report on Canadian Political Finance observed:
The elector cannot make a sensible choice unless he is well informed. Keepingthe electorate well informed means using the great communications media: radio,television, newspapers, printed flysheets, billboards etc. If these media are to beused well, parties and candidates must spend very considerable sums of money.The sums are essential expenses in informing the public. (Quoted in Ewing, 1992,p. 47)
Yet, in order to achieve these aims, political parties require considerable amountsof money. In short, politics is an expensive activity and money is indispensable

523J. Fisher /Electoral Studies 18 (1999) 519–532
(Alexander, 1989, p. 13; Ewing, 1992, p. 61; Paltiel, 1981, p. 138; Fisher, 1996a,p. 200). A regular flow of income is vital for the survival of political parties. Thisthen leads to the institutionalisation of political parties and the development andmaintenance of parties’ central bureaucracies (Panebianco, 1988, pp. 58–59).
Panebianco’s claims are borne out in the British case. Most spending is routine:generally constituting around 80% of Conservative and Labour central expenditure.Even in the 1992 general election year, routine expenditure by the Conservativeswas far greater than that spent upon campaigning. The second point to note is thatwhilst most campaigning is still undertaken in general elections, a significant amountoccurs in between. Thus, £2.2 million was spent by the Conservatives in the non-general election year 1993/94 and £737,000 by Labour; whilst in the European elec-tion year of 1994/95, the Conservatives spent £4.4 million and Labour £2.5 million.The effect is that constant levels of spending will help ensure that parties remainprominent in voters’ minds.
Fig. 1 illustrates levels of real terms central expenditure over the period of theanalysis. Spending peaks at general elections and falls directly afterwards, with thepeaks and troughs being more pronounced in the case of the Conservative Party.Secondly, there is significant spending between general elections. Thirdly, we cansee that as at local level, Conservative spending has consistently been above that ofLabour, to the extent that until 1974 Conservative troughs were higher than Labourpeaks. More recently, the spending gap has closed somewhat, though Conservativespending in the run-up to the 1992 General Election was notably high1.
Fig. 1. Conservative and Labour central expenditure (real terms) 1959–1994.
1 It appears from the graph that Labour spending outstripped that of the Conservatives in 1992. Thereason for this is that the Conservative financial year has run to the end of March since 1967 whereasLabour’s runs to the end of December. For comparison, therefore, Conservative spending is classified as

524 J. Fisher /Electoral Studies 18 (1999) 519–532
Fig. 2 gives a clearer indication of the closing spending gap, showing Labourexpenditure expressed as a percentage of that of the Conservatives. The referenceline at 100% indicates equal spending. Year on year, the electoral playing field hasbecome more level, at least for the two principal parties, but the Conservatives haveretained an advantage at general elections. Of course, if elected, this allows for theadvantages of incumbency.
3.2. Hypotheses and methodology
The general problem to be tested is whether a party’s annual expenditure caninfluence its annual popularity in the opinion polls. The models employed are basedupon the work of Johnston et al. (Johnston, 1985, 1986; Johnston and Pattie, 1995;Pattie et al., 1995)2 and Jacobson (Jacobson, 1980, 1990). Thus, the hypothesis isthat electoral popularity is a function of party spending, spending by the principalopponent and existing party strength.
POLL 5 a 1 b1PS1 b2PE 2 b3OPE1 e (1)
wherea is a constant, POLL is the share of the poll for Partya, PS is the electoralstrength of Partya (measured here by the poll rating 1 year previously), PE is expen-
Fig. 2. Labour expenditure as a percentage of Conservative expenditure 1959–1994.
being in the year in which the financial year is largely concerned. For example, the financial year 1991/92is classified as being 1991 since 9 months fell in that year. Thus, much of the spending by the Conserva-tives in the run-up to the 1992 election is classified as having taken place in 1991.
2 Johnston and Pattie (1995) calculate the dependent variable as the share of the two-party vote, ratherthan vote share overall. All estimates were run using both vote share and share of the two-party vote,i.e. Labour share of Conservative1 Labour. The results were almost identical.

525J. Fisher /Electoral Studies 18 (1999) 519–532
diture by Partya, OPE is expenditure by Partyb, e is the error term, andb1–3 areregression coefficients. In this model, the expectation is that PE and PS will bepositively signed, suggesting that a party’s expenditure and its existing electoralstrength will have a positive effect on its vote share. Conversely, the expectation isthat OPE will be negatively signed, suggesting that spending by the principalopponent will have a negative impact.
Analysing national level spending presents some methodological difficulties, how-ever. First, there is no pre-defined campaign period. Spending is not regulated andunlike at local level, parties are not required to submit returns for campaign expendi-ture. Second, as with all analyses of spending, one cannot adequately control for‘non-partisan’ political campaigning. For example, during the 1992 General Election,the public-sector union NALGO mounted a strong anti-Conservative campaign,which took out more press advertisements than the Conservatives and Liberal Demo-crats combined. However, since the union was not affiliated to the Labour Party andsince the campaign did not explicitly endorse any party, there are methodologicalproblems in measuring the positive effects at least of such campaigns. This is acommon problem. Gidlund notes that in Sweden, despite the fact that the Liberalparty had sought to limit corporate income and the Conservative Party eliminate itcompletely, corporate donations continued to be made to business groups which rannominally independent political campaigns for which the political support was plain.Moreover, this form of support is in a state of rapid development (Gidlund, 1991).Such developments have also in the past been evident with the rise of corporatePACs in the USA, and in the past in West Germany, Norway and Japan (Nassmacher,1993, p. 253).
This analysis however, is able to compensate for the first problem and partiallyso for the second by examining party performance on an annual basis. Since politicalparties do not only operate in electoral cycles but as more of a constant, we canalleviate difficulties presented by the absence of pre-defined campaign periods3. Sec-ondly, whilst we cannot entirely control for ‘non-partisan’ effects, this analysis canat least assess whether the standing of parties can be affected on a year-on-year basisby the amounts that parties spend. Non-partisan spending by way of contrast is morelikely to be concentrated at the time of key—usually general—elections.
Jacobson’s key assumption, however, as we have seen is that campaign spendingwill be of greater significance for challengers than for incumbents. On this basis, hehypothesises that the amount spent by challengers will have a greater impact on theoutcome of an election than that spent by incumbents, controlling for the incumbent’sexpenditure and the previous electoral strength of the challenger. The changes to thebasic model are then as follows:
3 Although party spending is continual, it is nevertheless clear that it peaks at the time of generalelections. It has been suggested, therefore, that a dummy variable be included in the models to captureelection year effects. This is problematic since there is no defined point at which election spending begins.The impact of the dummy variable would therefore be unpredictable. Nevertheless, the models were testedwith such a dummy variable, but its inclusion had no substantive impact upon the results.
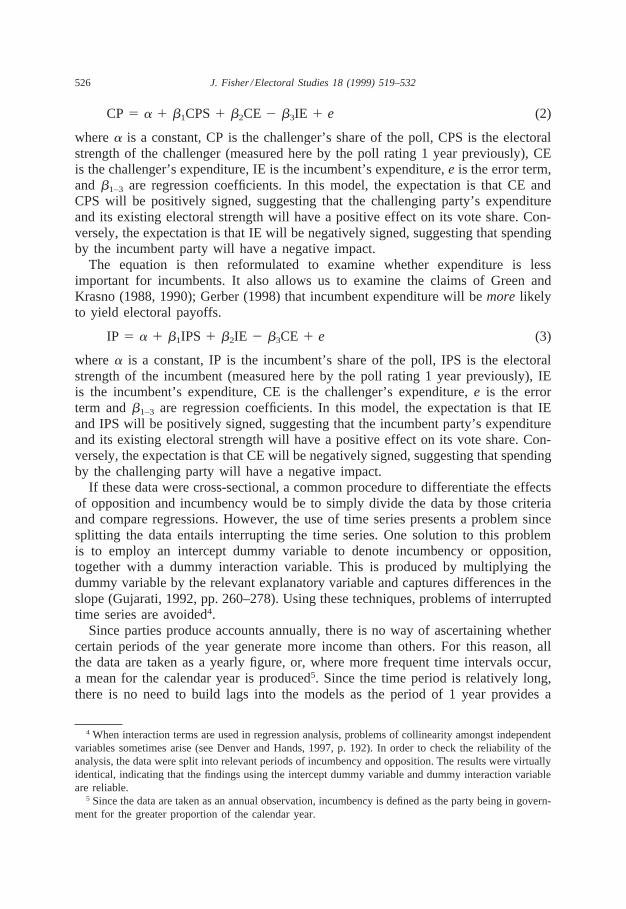
526 J. Fisher /Electoral Studies 18 (1999) 519–532
CP 5 a 1 b1CPS1 b2CE 2 b3IE 1 e (2)
wherea is a constant, CP is the challenger’s share of the poll, CPS is the electoralstrength of the challenger (measured here by the poll rating 1 year previously), CEis the challenger’s expenditure, IE is the incumbent’s expenditure,e is the error term,and b1–3 are regression coefficients. In this model, the expectation is that CE andCPS will be positively signed, suggesting that the challenging party’s expenditureand its existing electoral strength will have a positive effect on its vote share. Con-versely, the expectation is that IE will be negatively signed, suggesting that spendingby the incumbent party will have a negative impact.
The equation is then reformulated to examine whether expenditure is lessimportant for incumbents. It also allows us to examine the claims of Green andKrasno (1988, 1990); Gerber (1998) that incumbent expenditure will bemore likelyto yield electoral payoffs.
IP 5 a 1 b1IPS 1 b2IE 2 b3CE 1 e (3)
wherea is a constant, IP is the incumbent’s share of the poll, IPS is the electoralstrength of the incumbent (measured here by the poll rating 1 year previously), IEis the incumbent’s expenditure, CE is the challenger’s expenditure,e is the errorterm andb1–3 are regression coefficients. In this model, the expectation is that IEand IPS will be positively signed, suggesting that the incumbent party’s expenditureand its existing electoral strength will have a positive effect on its vote share. Con-versely, the expectation is that CE will be negatively signed, suggesting that spendingby the challenging party will have a negative impact.
If these data were cross-sectional, a common procedure to differentiate the effectsof opposition and incumbency would be to simply divide the data by those criteriaand compare regressions. However, the use of time series presents a problem sincesplitting the data entails interrupting the time series. One solution to this problemis to employ an intercept dummy variable to denote incumbency or opposition,together with a dummy interaction variable. This is produced by multiplying thedummy variable by the relevant explanatory variable and captures differences in theslope (Gujarati, 1992, pp. 260–278). Using these techniques, problems of interruptedtime series are avoided4.
Since parties produce accounts annually, there is no way of ascertaining whethercertain periods of the year generate more income than others. For this reason, allthe data are taken as a yearly figure, or, where more frequent time intervals occur,a mean for the calendar year is produced5. Since the time period is relatively long,there is no need to build lags into the models as the period of 1 year provides a
4 When interaction terms are used in regression analysis, problems of collinearity amongst independentvariables sometimes arise (see Denver and Hands, 1997, p. 192). In order to check the reliability of theanalysis, the data were split into relevant periods of incumbency and opposition. The results were virtuallyidentical, indicating that the findings using the intercept dummy variable and dummy interaction variableare reliable.
5 Since the data are taken as an annual observation, incumbency is defined as the party being in govern-ment for the greater proportion of the calendar year.

527J. Fisher /Electoral Studies 18 (1999) 519–532
Table 1The impact of spending on Conservative and Labour poll ratings: Eq. (1) (n 5 35)
Conservative poll Labour poll
b t p b t p
Constant 12.159 (1.551) 12.991 (1.839) *Poll ratingt−1 0.666 (4.056) *** 0.664 (4.010) ***Conservative expenditure 0.003 (1.487) 0.001 (0.323)Labour expenditure 20.004 (21.271) 0.000 (0.087)Adjustedr2 0.407 0.348Durbin–Watson statistic 1.358 1.553
***Significant at 0.01 level; **significant at 0.05 level; *significant at 0.1 level.
sufficient internal lag. The following variables are used: Conservative central expen-diture in real terms (standardised at 1963 prices by the RPI); Conservative opinionpoll rating; Labour central expenditure in real terms (standardised at 1963 prices bythe RPI); Labour opinion poll rating6.
For all analyses, Ordinary Least Squares (OLS) is employed. Since the modelsinclude a lagged endogenous variable (poll rating 1 year previously), the problem ofautocorrelation can be alleviated. In all tables, unstandardised regression coefficientsare reported together witht statistics and their associated levels of significance.
4. Results
The results for Model 1 (Eq. (1)) are illustrated in Table 1. This covers the wholeperiod for both parties. Taking the impact on Conservative poll ratings, Conservativeexpenditure is correctly signed as having a positive impact and Labour spending iscorrectly signed as negative. Neither parameter, however, is statistically significant. ForLabour poll ratings, neither expenditure variable has any discernible impact, confirmedby the fact that both fail to reach statistical significance. Only previous electoral strengthprovides any significant effect in either model. Thus, without controls for incumbencyor challenge, it seems that increased party spending may not be effective.
In Tables 2 and 3 the impact of spending is analysed according to the status ofthe parties as incumbents or opposition as described in Models 2 and 3 (Eqs. (2)and (3)). Dummy intercept and dummy interaction variables are employed to denoteparty status. For example the following model is employed to examine periods ofConservative incumbency:
CONPOLLt 5 a 1 b1CONPOLLt 2 1 1 b2Dt 1 b3CONEXPt
2 b4LABEXPt 1 b5(D*t CONEXPt) 2 b6(D*
t LABEXPt) 1 et
6 The sources of these data are Butler and Butler (1994); Fisher (1996a, b); Pinto-Duschinsky (1981,1985, 1989) and Gallup.

528 J. Fisher /Electoral Studies 18 (1999) 519–532
Table 2The impact of spending on Conservative poll ratings controlling for status (n 5 35)
Conservative opposition (Eq. (2)) Conservative incumbent (Eq. (3))
b t p b t p
Constant 7.731 (1.164) 25.365 (3.290) ***Poll ratingt−1 0.657 (4.763) *** 0.657 (4.763) ***Incumbency/opposition dummy 17.635 (3.456) ***217.635 (21.329) ***Conservative opposition
20.004 (21.456) x xexpenditureLabour incumbent expenditure 20.008 (21.127) x xConservative incumbent
x x 0.004 (2.402) **expenditureLabour opposition expenditure x x 20.002 (20.593)Adjustedr2 0.589 0.589Durbin-Watson statistic 1.334 1.334
***Significant at 0.01 level; **significant at 0.05 level; *significant at 0.1 level; x variable not in model.
Table 3The impact of spending on Labour poll ratings controlling for status (n 5 35)
Labour opposition (Eq. (2)) Labour incumbent (Eq. (3))
b t p b t p
Constant 3.071 (0.346) 14.617 (2.058) **Poll ratingt−1 0.687 (4.182) *** 0.687 (4.182) ***Incumbency/opposition dummy 11.546 (1.925) * 211.546 (21.925) *Labour opposition expenditure 20.001 (0.166) x xConservative incumbent
20.000 (20.218) x xexpenditureLabour incumbent expenditure x x 0.007 (0.793)Conservative opposition
x x 0.005 (1.373)expenditureAdjustedr2 0.368 0.368Durbin-Watson statistic 1.407 1.407
***Significant at 0.01 level; **significant at 0.05 level; *significant at 0.1 level; x variable not in model.
wherea is a constant, CONPOLLt is the Conservative poll ratings, CONPOLLt−1 isthe Conservative poll ratings lagged by 1 year,Dt is the dummy intercept term (15 Conservative incumbent; 05 Conservative opposition), CONEXPt is Conserva-tive real terms expenditure, LABEXPt is Labour real terms expenditure, (Dt
*
CONEXPt)is the interaction variable of CONEXPt multiplied by Dt, (Dt*LABEXPt)
is the interaction variable of LABEXPt multiplied by Dt, et is the error term, andb1–6 are regression coefficients. The same form of model is then run on Labour pollratings. Results are reported for both opposition and incumbency for ease of interpret-ation.

529J. Fisher /Electoral Studies 18 (1999) 519–532
Table 2 illustrates the effects of spending by both parties on Conservative pollratings during periods of Conservative opposition and incumbency. During periodsof Conservative opposition, Labour spending is correctly signed as having a negativeeffect upon Conservative poll ratings. Conservative spending is, however, incorrectlysigned, suggesting that as the Conservative Party increases its spending in opposition,it performs less well in the opinion polls—a counter-intuitive finding. Both para-meters however, fail to reach statistical significance.
However, the results in Table 2 indicate that increased spending by the Conserva-tive Party when it is the incumbent does appear to improve poll ratings, though thateffect is small. All other variables remaining equal, an increase in spending of £1000per annum at 1963 prices (£10,560 at 1994 prices) would produce a 0.004% increasein Conservative poll ratings. Spending by Labour in opposition is also correctlysigned, suggesting that an increase in Labour spending hinders the Conservatives.This parameter is not, however, statistically significant.
Table 3 illustrates the effects of spending by both parties on Labour poll ratings.When Labour is in opposition, Conservative expenditure is correctly signed as havinga negative impact upon Labour poll ratings but is not statistically significant.Labour’s spending is incorrectly negatively signed as having a negative impact onLabour poll ratings. This is counter-intuitive but again, it is not statistically signifi-cant. When Labour is the incumbent party, its expenditure is correctly signed, sug-gesting a positive impact. Conservative spending in opposition is, however, incor-rectly signed as also having a positive impact. That said, neither parameters arestatistically significant. Overall, expenditure by either party does not appear to affectLabour’s poll ratings.
Thus, it appears that the central thrust of Jacobson’s findings—that challengerspending is most significant—does not hold in these scenarios. Challenger spendingfails to reach statistical significance in both sets of estimations. Model 3 (Eq. (3))does, however, produce estimates which fit the broad hypothesis, namely that inperiods of Conservative incumbency at least, the party is marginally more popularwhen it spends more money. This is consistent with both Green and Krasno andGerber’s assertions that it is incumbent rather than challenger spending which ismost likely to yield electoral payoffs. That said, this finding does not hold in periodsof Labour incumbency.
An initial overall interpretation of these results might be, therefore, that spendingat national level has little demonstrable electoral impact. There are, however, certainfactors which should be borne in mind. First, the analysis attempted to control fornon-partisan campaigning by examining electoral or poll success on a year on yearbasis; the logic being that non-partisan campaigning of significance tends to occurat times of general elections. However, it cannot wholly eliminate these effects, norcan it control for partisanship within the press, which though heightened at generalelections, still continues throughout the electoral ‘cycle’. This is a potential problem,since press and media coverage can affect parties’ abilities to promote their message.Opinion is divided upon the electoral effects of the press (see, for example Curticeand Semetko, 1994). Nevertheless, estimates have been made which suggest that‘party funding in kind’ can potentially be significant. One such estimate utilises

530 J. Fisher /Electoral Studies 18 (1999) 519–532
Precis, a technique developed in the United States and used by Ross Perot in 1992.The technique assesses not just column inches, but the size and position of articlesas well as assessments of their positivity or negativity for the client (in this casepolitical parties). Using this technique, Linton estimates that favourable newspapercoverage in the 1992 General Election was worth £16 million to the Conservativesand £5 million to Labour (Linton, 1994, pp. 29–31). If this technique is reliable,then of course the models tested here do not incorporate this additional ‘expenditure’.
Yet in spite of these potential drawbacks, the results may well illustrate a veryreal phenomenon, namely that resources and party expenditure are not a constantsum. Despite that fact that parties spend different amounts, they may also do so withdiffering degrees of skill and effectiveness. The results should not be interpreted asimplying that national party expenditure makes little or no difference to electoraloutcomes; clearly a party that spent nothing would be likely to fare badly. It issimply to suggest that expenditure differentialsper semay not be as critical as isoften argued (Linton, 1994; Ewing, 1992), since parties, like any other organisationor individual will use money with varying degrees of skill. After all, in anecdotalterms, whilst Labour spent less than the Conservatives in the 1987 General Election,it was generally judged to have ‘won’ the campaign. It lost the election.
5. Conclusions
The results reported here suggest that increased party expenditure can have a posi-tive effect, but that this is difficult to show on a consistent basis. Certainly, it wouldappear that the Conservatives can help maintain their national profile when in govern-ment (measured by opinion polls) by increasing party expenditure. Overall, however,it appears that the case suggesting that national party expenditure has a positiveeffect on electoral fortunes is difficult to sustain. That said, the data are limited toan extent by the fact that they need to be taken as an annual observation. This meansthat we cannot capture shorter term electoral effects of increases in party spending.Moreover, annual data restricts the number of observations. For those reasons, somecaution at least should be registered. However, the results here are indicative anddo suggest that party spending at national level may not be as effective in electoralterms as is often suggested7.
A consequence of this is that the commonly argued case for state funding; thatof a ‘level electoral playing field’, is more difficult in empirical terms to justify.Notwithstanding the added problems of attempting to enforce ceilings upon nationalexpenditure, these results indicate that between the main two British parties at least,
7 Aggregate control variables of alternative predictors of party support have not been used in thisanalysis. The reason for this is twofold. First, the analysis seeks to establish whether spendingcouldpotentially have an impact. As the results show, this is generally not the case. Secondly, the most obviousaggregate control variable, personal economic evaluations, cannot be used as that time series only com-mences in 1974. Since there is no consistent empirical evidence that objective economic indicators areuseful over this entire period, it was decided not to include them.

531J. Fisher /Electoral Studies 18 (1999) 519–532
the advantage of increased national party expenditure is unclear. That is not to say,of course, that state funding of parties is undesirable—merely that disparities innational party expenditure may not provide a convincing case for its extended adop-tion.
Acknowledgements
I am most grateful for the valuable advice provided by both the anonymous ref-erees and the editors in the preparation of this article.
References
Adamany, D.W., Agree, G.E., 1975. Political Money. John Hopkins University Press, Baltimore.Alexander, H.E., 1984. Financing Politics. CQ Press, Washington.Alexander, H., 1989. Money and politics: rethinking a conceptual framework. In: Alexander, H. (Eds.),
Comparative Political Finance in the 1980s. Cambridge University Press, Cambridge, pp. 9–23.Butler, D., Butler, G., 1994. British Political Facts 1900–1994. MacMillan, London.Curtice, J., Semetko, H., 1994. Does it matter what the papers say? In: Heath, A., Jowell, R., Curtice, J.
(Eds.), Labour’s Last Chance? Dartmouth, Aldershot, pp. 43–63.Denver, D., Hands, H., 1997. Challengers, incumbents and the impact of constituency campaigning in
Britain. Electoral Studies 16, 175–193.Downs, A., 1957. An Economic Theory of Democracy. Harper and Row, New York.Ewing, K., 1992. Money, Politics and Law. Clarendon Press, Oxford.Fisher, J., 1996a. British Political Parties. Prentice Hall, Hemel Hempstead, UK.Fisher, J., 1996b. Party finance. In: Norton, P. (Ed.), The Conservative Party. Prentice Hall, Hemel
Hempstead, UK, pp. 157–169.Gerber, A., 1998. Estimating the effect of campaign spending on Senate election outcomes using instru-
mental variables. American Political Science Review 92, 401–412.Gidlund, G., 1991. The nature of public financing in Nordic states. In: Wiberg, M. (Ed.), The Public
Purse and Political Parties. Finnish Political Science Association, Helsinki, pp. 173–186.Green, D.P., Krasno, J.S., 1988. Salvation for the spendthrift incumbent: reestimating the effects of cam-
paign spending in House elections. American Journal of Political Science 32, 884–907.Green, D.P., Krasno, J.S., 1990. Rebuttal to Jacobson’s ‘New evidence for old arguments’. American
Journal of Political Science 34, 363–372.Gujarati, D., 1992. Essentials of Econometrics. McGraw Hill, Singapore.Jacobson, G.C., 1980. Money in Congressional Elections. Yale University Press, New Haven.Jacobson, G.C., 1990. The effects of campaign spending in House Elections: New Evidence for Old
Arguments. American Journal of Political Science 34, 334–362.Johnston, R.J., 1985. The Geography of English Politics. Croom Helm, London.Johnston, R.J., 1986. A further look at British political finance. Political Studies 34, 466–473.Johnston, R., Pattie, C., 1995. The impact of spending on party constituency campaigns in recent British
general elections. Party Politics 1, 261–273.Laver, M., 1997. Private Desires, Political Action. Sage, London.Linton, M., 1994. Money and Votes. IPPR, London.Nassmacher, K.H., 1993. Comparing party and campaign finance in western democracies. In: Gunlicks,
A.B. (Ed.), Campaign and Party Finance in North America and Western Europe. Westview Press,Boulder, pp. 233–267.
Paltiel, K.Z., 1981. Campaign finance: contrasting practices and reforms. In: Butler, D., Penniman, H.R.,Ranney, A. (Eds.), Democracy at the Polls. American Enterprise Institute, Washington, pp. 138–173.

532 J. Fisher /Electoral Studies 18 (1999) 519–532
Panebianco, A., 1988. Political Parties. Organization and Power. Cambridge University Press, Cambridge.Pattie, C., Johnston, R., Fieldhouse, E., 1995. Winning the local vote: the effectiveness of constituency
campaign spending in Britain, 1983–1992. American Political Science Review 89, 969–983.Pinto-Duschinsky, M., 1981. British Political Finance 1830–1980. American Enterprise Institute, London.Pinto-Duschinsky, M., 1985. Trends in British political funding 1979–1983. Parliamentary Affairs 38,
329–347.Pinto-Duschinsky, M., 1989. Trends in British party funding 1983–1987. Parliamentary Affairs 42,
197–212.