upgrading britain: the effect of capital expenditure trends on productivity, profitability and...
TRANSCRIPT

Upgrading Britain?The effect of capital expenditure trends on productivity, profitability and competitivenessA report from the Economist Intelligence Unit Sponsored by Lombard

Upgrading Britain?The effect of capital expenditure trends on productivity, profitability and competitiveness
© The Economist Intelligence Unit Limited 20111
About the study
Upgrading Britain? The effect of capital expenditure trends on productivity, profitability and competitiveness is an Economist Intelligence Unit report, sponsored by Lombard, part of the Royal
Bank of Scotland Group. The report reviews the capital expenditure plans of British businesses to gauge spending trends, as well as related challenges and opportunities.
The research draws on several inputs, including:
l A survey of 392 firms operating in the UK. Firms of all sizes were represented: 25% were relatively small, with revenue under £100m; 42% had revenue of between £100m and £1bn; and 34% were large, with £1bn or more in revenue. All major sectors were represented, with a weighting towards IT & technology (21%); manufacturing (16%); transport and logistics (15%); and financial services (11%). The survey sample was very senior: all respondents were from a management function, with 48% representing the board or C-suite.
l An analysis of 251 UK-listed companies that had reported 2010 data with regard to cash on their balance sheets, along with wide-ranging desk research.
l Interviews with 12 executives and experts. We would like to thank the following people for their time and insight (listed alphabetically, by organisation):
l Meziane Lasfer, professor, Cass Business School
l Andrew Kakabadse, professor, Cranfield University School of Management
l Bob Shanks, vice-president and controller, Ford Motor Company
l Marc Silvester, senior vice-president and global chief technology officer, Fujitsu UK
l Peter Cole, chief investment officer, Hammerson
l Andrew Walker, chairman, Metalrax plc
l Mike Tholen, economics and commercial director, Oil & Gas UK
l Paul Harrison, group finance director, Sage

Upgrading Britain?The effect of capital expenditure trends on productivity, profitability and competitiveness
© The Economist Intelligence Unit Limited 20112
l Andrew Pimblett, managing director, Street Crane Company
l Colin McLean, founding partner and managing director, SVM Asset Management
l Richard Dear, business manager, Ultra Electronics (CEMS)
l Nick Mair, sales and marketing manager, Ultra Electronics (CEMS)
l Julie Adams, managing partner, Menzies
The author of the report is James Watson and the editor is Monica Woodley. James Gavin and Sarah Fister Gale conducted a few of the interviews for this report.

Upgrading Britain?The effect of capital expenditure trends on productivity, profitability and competitiveness
© The Economist Intelligence Unit Limited 2011�
One of the indicators of a healthy economy is a sufficient level of capital investment, both from government and the private sector. Such investment is crucial to maintaining the long-term
competitiveness of both the country and individual businesses. This Economist Intelligence Unit report, sponsored by Lombard (part of The Royal Bank of Scotland
Group), reviews capital expenditure (CapEx) patterns within corporate Britain as the economy moves slowly out of recession while still facing daunting headwinds. This report considers whether firms are planning to increase CapEx and in which areas, and how the decision-making process has changed since the financial crisis.
The key findings from the research include:
l Capital expenditure is lagging confidence and capital levels. Planned increases in CapEx do not reflect the degree of confidence that management hold in the economy, or the cash held on many balance sheets. While more than two-thirds (67%) of respondents express confidence about the future economic climate for their business and a similar number (70%) are holding cash, just 36% plan to increase capital expenditure. For a similar number (37%), CapEx will remain flat. In part, this is because many firms still have spare capacity, as demand remains below 2007/08 levels. Just 23% plan to cut back or eliminate it entirely (4%).
l Most, but not all, UK firms cut capital expenditure during the recession. Nearly two-thirds (63%) of firms cut back investment during the financial crisis and subsequent recession. One-quarter of survey respondents cut back all but the most essential of spending, while 38% simply pressed pause on all new investments. Overall UK investment fell by 29% from a quarterly peak of nearly £38bn in late 2007 to just under £27bn in late 2009. However, not everyone was so cautious: some (14%) firms took advantage of the climate to invest for a competitive advantage, while nearly one-quarter of firms maintained all planned investments.
l Businesses are slowly, but surely, modernising their physical assets. There is a small, but clear shift in CapEx allocation plans, with a trend towards acquiring new assets, whether IT systems, equipment and machinery, or telecommunications infrastructure, rather than simply spending on maintenance.
Executive summary

Upgrading Britain?The effect of capital expenditure trends on productivity, profitability and competitiveness
© The Economist Intelligence Unit Limited 20114
l Meeting the demands of existing customers is the main driver for investment. Two-thirds of respondents agree that this has been the key motivation for capital spending. However, keeping pace with technology or delivering more innovative products may be the real motivation, rather than increased capacity. Improved efficiency and expanding the business are also cited as reasons for CapEx by 61% and 53%, respectively.
l A significant minority of companies are concerned that their lower level of CapEx is negatively affecting their businesses. About four in ten (39%) believe they are falling behind their competitors because of reduced investment levels, while about one-third (34%) say they have been unable to expand into new markets (34%) or to expand their range of products and/or services (31%).
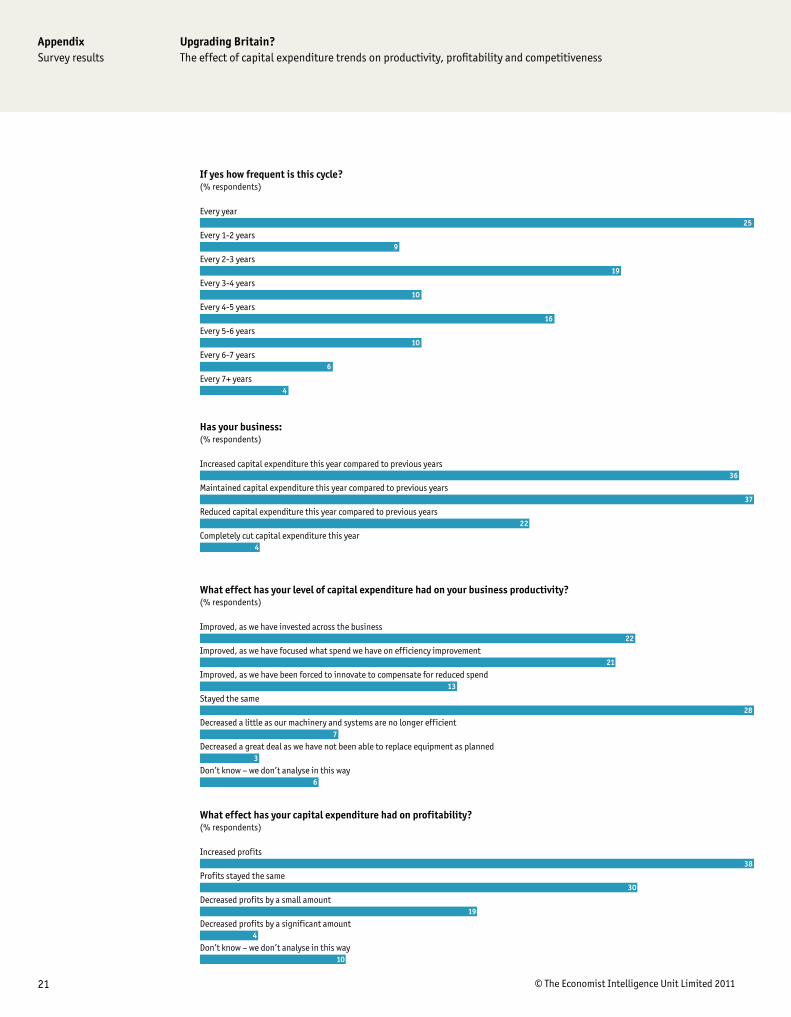
l Reducing capital expenditure has bolstered profits, with many corporate balance sheets showing strong cash positions. About four in ten (38%) firms say that spending cuts have boosted their profitability, with a further 30% saying this has at least helped to maintain consistent profits. Reduced CapEx has contributed to rising levels of cash on many balance sheets. In an analysis of 251 listed companies carried out for this report, cash levels rose by an average of 7% in 2010 compared with 2009 levels.
l Most firms believe belt-tightening has boosted productivity. Over one-third (34%) of respondents have seen productivity improve where they have focused on innovation or efficiency improvement during the downturn. A further 28% say productivity has stayed the same. The key question is how long this cycle can be stretched out, as this is not a sustainable strategy for the long term.
Upgrading Britain?The effect of capital expenditure trends on productivity, profitability and competitiveness
© The Economist Intelligence Unit Limited 20115
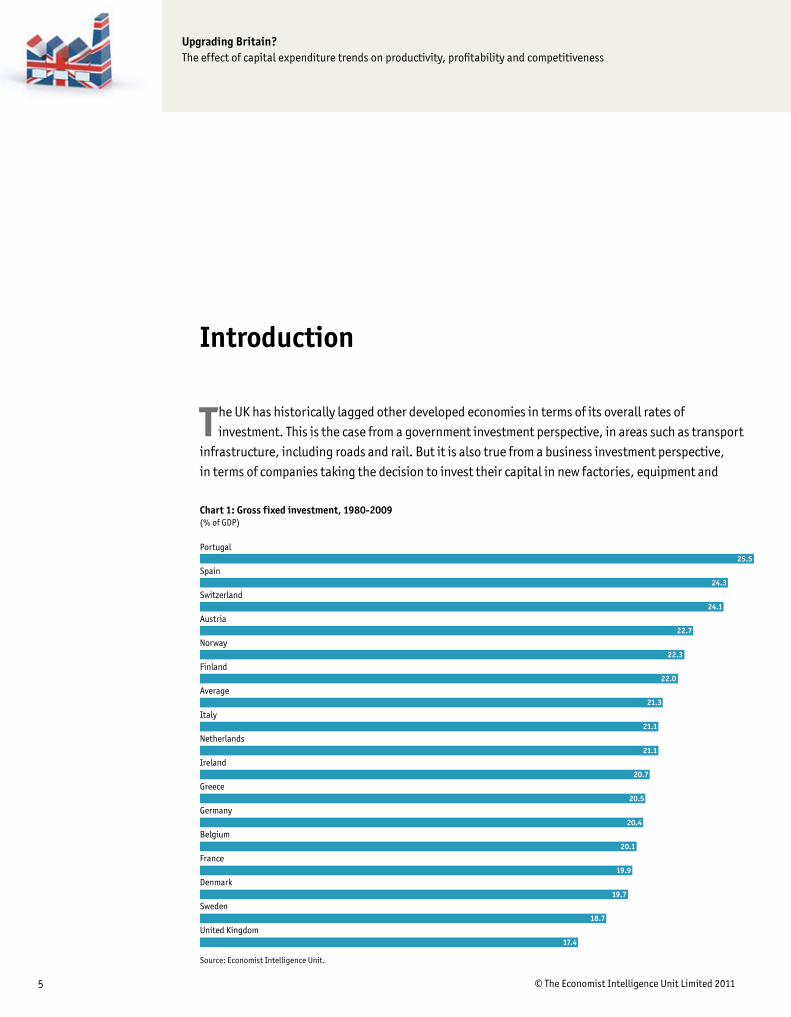
The UK has historically lagged other developed economies in terms of its overall rates of investment. This is the case from a government investment perspective, in areas such as transport
infrastructure, including roads and rail. But it is also true from a business investment perspective, in terms of companies taking the decision to invest their capital in new factories, equipment and
Introduction
25.5
24.3
24.1
22.7
22.3
20.1
19.9
19.7
18.7
17.4
22.0
21.3
21.1
21.1
20.7
20.5
20.4
Portugal
Spain
Switzerland
Austria
Norway
Finland
Average
Italy
Netherlands
Ireland
Greece
Germany
Belgium
France
Denmark
Sweden
United Kingdom
Chart 1: Gross fixed investment, 1980-2009 (% of GDP)
Source: Economist Intelligence Unit.

Upgrading Britain?The effect of capital expenditure trends on productivity, profitability and competitiveness
© The Economist Intelligence Unit Limited 20116
machinery, information technology and other areas. Such investment is crucial for improving efficiency and competitiveness, and expanding overall capacity to cater for future growth.
From a macroeconomic perspective, the UK’s total investment, which is almost wholly comprised of the two elements above, as well as housing investment, is in fact the lowest of any country in western Europe. The UK’s fixed investment as a percentage of GDP between 1980 and 2009 averaged around 17.4%, in comparison with an average of 21%, with some rates as high as 24%, across the 15 major European economies (see chart 1). During the past decade, levels of government investment in the UK tripled, while investment in housing soared during the property boom. However, both of these are now being constrained, especially given the government’s plans to cut spending sharply in order to reduce its budget deficit substantially.
In terms of business investment, which accounts for about 60% of total UK investment, the long-term trend shows several periods of pick-up, all of which have ultimately stalled. In both the 1980s and 1990s, investment started increasing, with the latter closely linked to the dotcom boom and an associated surge in IT-related investments. More recently, a rise in capital expenditure during the 2000s has once again been cut short by the severe financial crisis that started in 2008 (see chart 2). As of the fourth quarter of 2010, total business investment was around £30bn, about the same at the end of 2001.
This holds critical implications for the overall performance of the economy, as investment accounts for a sizeable proportion of overall demand. More importantly, it is also a key determinant of future supply: business investment helps to expand capacity by enabling firms to either supply more goods overall as demand increases, or to supply the same amount of goods with fewer inputs through increased efficiency. While capacity concerns have been low during the recent recessionary period, a failure to invest will leave many businesses exposed if a pick-up in the global economy gathers pace and demand returns.
Chart 2: Total UK business investment (£ m)
Source: Office for National Statistics.
0
5,000
10,000
15,000
20,000
25,000
30,000
35,000
40,000
0
5,000
10,000
15,000
20,000
25,000
30,000
35,000
40,000
10080604022000989694929088868482807876747270681966

Upgrading Britain?The effect of capital expenditure trends on productivity, profitability and competitiveness
© The Economist Intelligence Unit Limited 20117
The state of the UK economyTaking the decision to commit to investing capital is largely driven by the level of confidence that business leaders have in the overall economy, along with their companies’ prospects for growth both domestically and abroad. Quite simply, managers facing uncertainty or volatility in their industry are unlikely to sign off on major capital spending plans for new production capacity, larger premises or other similar investments. This link with confidence is reflected in the fact that levels of business investment over the past two decades have been highly volatile.
In terms of the overall economy, the picture is distinctly mixed. After real GDP contracted by 4.9% in 2009, the largest annual fall since the second world war, growth in the UK resumed in 2010 at 1.3%. This was sustained in part by government spending, as well as robust gains in the manufacturing sector in particular. But the underlying picture remains fragile, not least as government stimulus spending nears an end and the outlook for domestic consumer demand remains weak. Growth of 0.5% in the first quarter of 2011 followed a contraction of 0.5% in the last quarter of 2010—avoiding a double-dip recession but doing little to reassure that the economy is back on course. Forecast GDP growth for 2011 is the same as last year’s, at 1.3%, while in 2012 the rate is forecast to rise slightly to 1.7% (see table 1).
Nevertheless, one of the core aims of the current coalition government is to rebalance the economy through the diversification of business investment and exports, in order to reduce the concentration of economic activity in a few sectors like financial services. Already, the UK has seen a bounceback in the manufacturing sector during 2010, although the sector’s absolute levels of production remain about 10% below their 2008 peak. Some comeback was inevitable after the recession, but a sharp drop in the value of sterling against the US dollar from its peak in 2007 has also given manufacturers a competitive boost. However, manufacturers have been battling with rising commodity prices, including a spike in oil prices, which has affected their input costs. This is particularly the case for those manufacturers
Table 1: Key UK data and forecasts (as of June 1st 2011)2006 2007 2008 2009 2010 2011 2012
Gross domestic product
Nominal GDP (£bn) 1,328 1,405 1,446 1,395 1,454 1,510 1,576
Real GDP (% change) 2.8 2.7 -0.1 -4.9 1.3 1.3 1.7
Expenditure on GDP
Gross fixed investment (% real change) 6.4 7.8 -5 -15.4 3.0 5.8 3.6
Exports of goods & services 11.1 -2.6 1 -10.1 5.3 7.5 6.8
Imports of goods & services 9.1 -0.8 -1.2 -11.9 8.5 5.1 4.5
Origin of GDP (% real change)
Agriculture 0.7 -4.8 0.2 -6.8 -1.0 1.0 2.0
Industry 0.3 0.9 -2.5 -10 3.0 1.9 0.8
Services 3.5 3.7 1.4 -3.6 1.1 1.1 1.9
Prices and financial indicators
Exchange rate US$:£ (av) 1.84 2 1.86 1.56 1.55 1.63 1.61
Exchange rate €:£ (av) 1.47 1.46 1.26 1.12 1.17 1.19 1.28
Source: Economist Intelligence Unit, (2011-12 are forecasts).

Upgrading Britain?The effect of capital expenditure trends on productivity, profitability and competitiveness
© The Economist Intelligence Unit Limited 20118
having to import raw materials. “Raw materials are going up quite significantly in price,” notes Andrew Walker, the chairman of Metalrax plc, a Birmingham-based supplier of specialist engineering and consumer durables, and a non-executive director of several other firms. “Quite a few of the businesses deal with polymers and they’re up 40-50% in the last year.”
Bulging corporate balance sheetsOne of the other factors weighing on capital investment considerations is that many businesses have built up significant cash reserves on their balance sheets. This has been a natural reaction to the recession, with firms seeking to stockpile cash in order to ensure that they can ride out the downturn. Many planned projects were scrapped because firms simply did not know whether they would achieve expected returns given an uncertain demand outlook. In addition, given the restriction of credit as banks sought to rebuild their own balance sheets, businesses decided they would rather hold onto their capital .
By the middle of 2010, UK non-financial firms had amassed more than £140bn in cash, the highest level since 1998, according to Morgan Stanley, an investment bank. Precise data on corporate cash levels are limited, but an analysis of 251 UK-listed firms that had reported their financial data for 2010 showed that firms had increased the amount of cash or cash equivalents on their balance sheets by an average of 7%, or £16.7m, from 2009 levels. The aggregate increase of nearly £4bn took total cash on hand to nearly £29bn across the group.
Of course, many firms are far from cash-flush, relying on what credit facilities they can get or simply surviving on month-by-month cash flows. But for those with excess cash on their books, the question is what to do with it, especially given low interest rates. Sage, a business software firm headquartered in Newcastle Upon Tyne, has substantially reduced its net debt through strong cash generation. Consequently, net debt is at modest levels today. Shareholders are supportive of this but of course expect the capital to be deployed in some way over time, or else will start demanding it back. “But I don’t think we are there yet,” says Paul Harrison, the firm’s group finance director (see case study).
But such pressures are building within many firms. “The puzzle now for firms is do they invest, or give money back to shareholders, or do something else with it,” says Professor Meziane Lasfer, a corporate finance specialist at Cass Business School.
Broadly speaking, there are five main options for business leaders:
l Reduce liabilities. Those firms with high levels of debt may take the chance to pare that back and repair their balance sheets. Of the 392 firms surveyed for this report, 18% are planning to pay down debt. Alternatively, it will be used to prop up other liabilities, such as pension funds, according to 7% of firms polled.
l Explore mergers and acquisitions (M&A). Eighteen percent of firms are looking at using their cash to acquire rivals. Indeed, M&A deal volumes in the UK in 2010 increased by 10% over 2009, according to PricewaterhouseCoopers, and have continued to grow in 2011 so far.
l Return cash to shareholders. Some capital will be returned to shareholders, mainly in the form of increased dividends, which is being considered by 14% of firms. This also may be done via other
Upgrading Britain?The effect of capital expenditure trends on productivity, profitability and competitiveness
© The Economist Intelligence Unit Limited 2011�
mechanisms, such as share buybacks, with a view to propping up share prices. In the US, share buybacks have soared over the past year.
l Fund innovation. Others will seek to bolster their research and development efforts, to increase competitiveness. Some 10% of firms polled say they are exploring this option.
l Increase capital expenditure. Finally, some will be diverted back into increased capital expenditure, in order to bolster efficiency, replace worn out equipment or IT systems that have come to the end of their life, or add new capacity in expectation of a pick up in demand. Just over one in three firms (36%) overall plan to increase their capital expenditure in the year ahead.
The rest of this report considers this final option more closely, exploring which industries have the most appetite for capital investment; what this spending will be directed towards; and how the CapEx decision-making process has changed.
case study: Sage Group – After strengthening the balance sheet, options for cash return
Sage, one of the UK’s biggest business software firms with 6.3m customers worldwide, is not a traditionally CapEx-intensive business. But Sage’s group finance director, Paul Harrison, acknowledges the impact of the recession on spending plans, reinforcing a focus on constraining costs and removing debt from the balance sheet. “If we go back 18 months to two years and there were all sorts of reasonably dramatic prognoses around, this inevitably left businesses in a cautious state,” he says. “Certainly we recognised that in the markets we serve, our customers would scale back their investment in the software part of the business and that would slow down new growth, which it did.”
In response, Sage cut significant costs from the business during the recession. As a firm that has used acquisitions as a key strategy,
it pared back M&A. The main aim was to ensure that customer service was not compromised, so investment was sustained in providing frontline customer services. As a result, the firm was able to pay down its net debt quite aggressively, to £106m at the end of March, from £219.8m at the end of last September. “Our net debt was never at troublesome levels. Nonetheless, it made sense to us to knuckle down, to take costs out, to reduce net debt,” says Mr Harrison.
Having now emerged with its balance sheet in stronger shape, Sage is planning to use its capital for a more concerted M&A push. “Today we have a very low level of net debt, and, quite reasonably, the agenda with some of our shareholders is slowly but surely moving back to how we intend to deploy the cash,” says Mr Harrison. “Quite rightly, shareholders want to be confident that you are using their money wisely, but what I don’t feel from shareholders is undue pressure to be acquisitive. More than anything, shareholders want to ensure that management is taking appropriate decisions.”

Upgrading Britain?The effect of capital expenditure trends on productivity, profitability and competitiveness
© The Economist Intelligence Unit Limited 201110
As the financial crisis in 2008 quickly lead to uncertainty over the broader state of the economy and then the longest recession in the UK since modern records began in 1950, business investment in
the UK plummeted. From a quarterly peak of nearly £38bn in late 2007, investment fell by 29% to just under £27bn in late 2009, its lowest point, according to the Office of National Statistics (ONS). Of the firms surveyed for this report, nearly two-thirds (63%) reported cutting back their capital investment during this period. One-quarter cut back all but the most essential spending, while 38% simply pressed pause on all new investments, although they continued to maintain existing equipment. Logistics and transport firms were the most likely to halt investment: about one-half of firms in that sector stopped all investment, twice the overall average.
The most direct reason for this was the sharp fall in demand. Mr Walker recounts the sudden change among the various businesses with which he works: “By the time you got to Easter 2009, their turnover rates were about 70% of their levels in 2007 or early 2008.” As a result, many firms suddenly found themselves with spare capacity, and the pressure to maintain CapEx spending in order to bolster capacity simply dried up.
Not all firms took this approach, however a small minority (14%) sought to take advantage of the situation in order to try and squeeze out a competitive advantage over rivals, while nearly one in four (23%) firms maintained all planned investments. This has been particularly the case for those firms that were less reliant on domestic demand and more focused on exports, especially to emerging markets that were largely immune to the recession.
Capital investment: A return to spending?
25
38
23
14
We halted all planned investment until we fully understood the effect of the financial crisis on our company, unless it was of critical importance
We maintained all planned investments through the financial crisis and recession
We took advantage of opportunities presented by the recession (eg, better deals), and as such increased investment during the crisis
We continued with regular maintenance of existing equipment, or replaced old equipment, but did not commit to any new investments during therecession, even those that we had originally planned
Chart 3: Which of the following statements best describes your company’s position on investing in the business during the financial crisis and recession? (% respondents)

Upgrading Britain?The effect of capital expenditure trends on productivity, profitability and competitiveness
© The Economist Intelligence Unit Limited 201111
One such example was the Street Crane Company, a Derbyshire-based manufacturer of specialist cranes and hoists. Over the past decade, it has steadily refocused its business on the export market, especially to Asia and the Gulf. “We’ve certainly not touched the brakes, quite the reverse, as we’ve seen the opportunity,” says Andrew Pimblett, the firm’s managing director. The majority of its spending has gone into R&D, to ensure that its products remain competitive in the international market, but the company has also invested in building additional production space. Now, as demand is returning from its UK-based clients, the company is well placed to deliver given its investments during the downturn. “We’re now seeing some small manufacturing businesses investing in cranes again. It’s been quite noticeable since Christmas especially, from the private sector and relatively small manufacturers,” says Mr Pimblett.
CapEx plans in the year aheadThe degree to which such pick-up occurs across the broader economy, and feeds back into business confidence, will be the defining factor affecting a pick-up in business investment. And although two-thirds of executives polled express confidence about the future economic climate for their business, the mixed economic outlook still clouds CapEx decisions to a degree.
Overall, slightly over one-third (36%) plan to increase capital expenditure in the year ahead, even though six in ten respondents agree that new investment in their business would be worthwhile right now. Overall, the sense is that companies are coasting—taking a foot off the brakes, but stopping short of actually pressing the accelerator—with 37% of firms maintaining CapEx levels compared with the previous year. “It’s not to say investments aren’t going ahead, but they are the sort of investments one might have ordinarily expected so there isn’t a great splurge,” says Mr Walker. “There is continued investment, but at a much lower, slower level,” adds Julie Adams, a partner at Menzies, a financial consultancy.
Nevertheless, the proportion of firms planning to maintain or increase spending outweigh the one-quarter (26%) planning to cut back to some degree. This by itself is an indication of improved confidence, not least as 2010 saw an improvement in business investment overall. Spending in the fourth quarter of 2010 was up by more than 12% on the same quarter in 2009, according to the ONS, although it remains far below the peak established in 2007. Another aspect driving a pick-up is an improvement in firms’ risk appetites. The latest Deloitte CFO survey from April 2011 notes that although confidence remains low, risk appetites have risen sharply, in part owing to strong corporate balance sheets.
A key reason that firms are not ramping up investment relates to their spare capacity which means
36
37
22
4
Increased capital expenditure this year compared to previous years
Maintained capital expenditure this year compared to previous years
Reduced capital expenditure this year compared to previous years
Completely cut capital expenditure this year
Chart 4: Has your business: (% respondents)

Upgrading Britain?The effect of capital expenditure trends on productivity, profitability and competitiveness
© The Economist Intelligence Unit Limited 201112
they do not need to invest immediately, even as demand returns. Assessing the level of spare capacity in the economy is difficult, but the Bank of England Inflation report from February 2011 suggests that it is likely that companies’ supply capacity remains below pre-recession levels. Colin McLean, founding partner and managing director of SVM Asset Management, an investment firm, adds that many firms will be focusing more on realigning their portfolios and improving their margins, ahead of investing for growth. “For the industrial, chemicals and engineering businesses, a lot of those are still below their peak margins of the last cycle,” he says.
Mr Walker notes that the firms of which he is a non-executive director are running at about 90-95% of their peak capacity, which leaves some slack for growth. Of Brintons, he adds: “The real issue is that while relatively little amounts of capacity were totally taken out in the recession, in that people might have been laid off but the machinery still exists, we had the capacity to do about 105% of what we did in 2007 and 2008 and we are not back there yet.” Added to this, the firm also focused on efficiency gains during the downturn, such as better products and improved processes, which has further improved overall capacity.
This tallies with the views of executives surveyed for the report. A higher proportion of respondents see improved efficiency as a main driver for investment, than those who see it as necessary for actually expanding the business. The largest proportion, however, say CapEx is necessary for helping them to meet the demands of their clients. This may not necessarily be associated with increased capacity, but rather in order to keep pace with technology or deliver more innovative products.
An example of this is Ultra Electronics (CEMS), a contract electronics manufacturer with facilities in several parts of the UK. It supplies specialist manufacturing services to a range of industries, including aerospace and defence, energy and transport, among others. The company invested in its growth, both in terms of a 2010 acquisition and also new production capacity in 2009, as it navigated the recession largely unscathed. However, while part of this has been about expansion, it has also been necessary to cater for constant advances in technology. “Our 2010 acquisition has helped to diversify our business, by extending the range of technologies and offerings we provide to our clients,” says Richard Dear, the firm’s business manager. Backing this up has been specific CapEx investments, such as in advanced component coating machinery. “We used to outsource a lot of this work, but we spent so much on this [acquisition] that we’ve decided to invest in this technology,” says Nick Mair, the firm’s head of sales.
Indeed, an inability to innovate is one of the threats that firms face from under-investment. Nearly four in ten (39%) of the companies polled believe they are falling behind their competitors because of reduced investment levels. Mr Pimblett of Street Crane believes that says it is one aspect that has helped to differentiate his firm from rivals in the field. “Many crane manufacturers have not invested in development, and so their products have become uncompetitive and out of date regarding international standards,” he says.
Where is CapEx being directed? After several years of tight spending controls, one likely change in the year ahead is a move away from maintaining and towards investing in new assets. In comparing last year’s spending priorities with the coming year, executives surveyed note a drop in spending on maintaining IT systems, with

Upgrading Britain?The effect of capital expenditure trends on productivity, profitability and competitiveness
© The Economist Intelligence Unit Limited 201113
a corresponding rise in new IT assets. The same is seen in telecoms infrastructure, as well as plant machinery and equipment.
At an aggregate level, CapEx spending on maintaining IT systems is expected to drop by 4 percentage points in the year ahead, compared with the last financial year, while new IT spending is up by 5 percentage points. For machinery and equipment, maintenance falls by 4 percentage points, while new equipment is up by 3 percentage points, as is the acquisition of specialist equipment. The same holds in telecoms, with new telecoms spending up by 3 percentage points, and maintenance down by 2 percentage points. This replacement trend has already led to a strong pick-up in both computer software and hardware investment in 2010, compared with 2009 levels. Data from the ONS business investment results (March 2011) show that spending on software increased by 12.3% to £6.49bn in 2010, whereas hardware spending rose by 12.6% to £5.98bn.
Nevertheless, spending in nearly all of these areas remains below the levels that executives see as their normal levels. Spending on maintenance, especially, is far below normal levels, down by 10 percentage points on IT, and by 9 percentage points on equipment and machinery. In part, this may well be driven by those firms with cash on their books. “When you have cash, you will buy assets to replace old ones. When you don’t, you will maintain it,” says Professor Lasfer.
Within specific industries, such trends vary more widely (see table 2), for a variety of reasons. In financial services, for example, spending on maintaining IT systems will fall 11 percentage points, while new IT spending will shoot up 14 percentage points. This is due not only to a rapid recovery in the sector, but also in order to cater for new regulations increasing the amount of data that must be held, which will require additional technology resources.
Table 2: Change in investment spending across key sectors
Percentage point (pp) change in spending, next financial year over previous financial year
Tech & telecomsTransport &
logisticsManufacturing
Financial
services
New IT Up 1pp Up 1pp Up 10pp Up 14pp
Maintaining IT Down 4pp Down 5pp Down 3pp Down 11pp
New machinery and equipment Up 1pp Down 2pp Up 9pp Down 3pp
Maintaining machinery and equipment Up 4pp Flat Down 18pp Flat
New telecoms Flat Up 5pp Down 2pp Up 7pp
Maintaining telecoms Up 1pp Down 4pp 1 Up 7pp Down 7pp
Source: Economist Intelligence Unit.

Upgrading Britain?The effect of capital expenditure trends on productivity, profitability and competitiveness
© The Economist Intelligence Unit Limited 201114
case study: Ford – Investing through the downturn
Even before the recession set in, Ford, a US carmaker, was in a bad place. In 2005, corporate rating agencies downgraded its bonds to junk status, based on its huge labour costs and liabilities, falling market share and ongoing losses. In January 2006, the firm set out its “Way Forward” plan, aimed at cutting fixed capital costs and returning the firm to profitability by resizing the company, shedding non-core assets and consolidating production lines globally, including in the UK where it is the country’s biggest carmaker, employing 15,000 people.
To fund this restructuring, the firm took on US$23.5bn in loans in 2006, while credit was still cheap and available. “We knew we were going to need an extraordinary amount of cash on hand to support the process, as it wasn’t going to be just a one-year exercise, but several years,” says Bob Shanks, the company’s vice-president and controller. “It was really fortuitous we did that because we realised
we would need the cash to do everything we wanted to do, including protecting the company from unseen events, which is of course what happened in 2008/09.”
With capital on hand, despite enduring several years of steep losses, the recession did not derail the firm’s CapEx plans, but rather acted as a catalyst to accelerate them. “It made us challenge things that maybe we would have normally just thought of as given, as we looked for anything that could improve the business and our cash [situation],” says Mr Shanks. In the third quarter of 2009, Ford posted its first quarterly profit in four years and expects to be “solidly profitable” during 2011. Its restructuring is now also supporting strong capital investment going forward. “Our outlook for the full year around the world is about US$5bn-5.5bn of capital spending,” says Mr Shanks. “Before, we were more in restructuring mode, now we’re transitioning into growth.” The firm’s healthier cash position is also now being used to reduce its overall leverage and restore its balance sheet to health.

Upgrading Britain?The effect of capital expenditure trends on productivity, profitability and competitiveness
© The Economist Intelligence Unit Limited 201115
Some degree of confidence may have returned, but for most firms the operating environment remains challenging. Forecasting an upturn in the economy and related demand is difficult at the
best of times. But against the backdrop of a government slashing public spending and adopting other severe measures to rein in a massive budget deficit, it is especially difficult. Nearly one-half (46%) of executives polled agree that concerns about the economy are holding back investment in their industry, more than twice as many as those who think it does not matter. There is much less certainty, however, about the impact of proposed government spending cuts: 38% agree that this is causing uncertainty over investment, compared with 34% who disagree.
One particularly CapEx-intensive sector that will be affected by the UK government’s efforts to raise revenue is oil and gas. Capital investment in this industry has risen by 60% over the last two years, from just under £5bn in 2009, and could reach £8bn during 2011, according to Oil & Gas UK, an industry trade association. Energy firms have been grappling with rapid input cost inflation, while most oilfields that remain to be exploited are far more technically challenging than before. All this has prompted a surge in spending, most of which is planned over a long-term basis. “As you don’t get any money for not finishing an oilfield, you have to go and finish it, so you can produce,” says Mike Tholen, an economics and commercial director at Oil & Gas UK. However, the government’s 2011 budget, in recognition of rapidly rising oil prices, implemented a surprise tax rise on energy firms, which is expected to cost the industry some £2bn. In addition, although the majority of spending is locked in until around 2015, the decision may well affect any future CapEx decisions, not least because of added
Investment decision-making: Volatility, financing and uncertainty
I’m confident about the future economic climate for our business
New investment in our business would be worthwhile at the current time
Borrowing money to invest in our business is the right decision at this time
Improving efficiency/effectiveness is a main driver for our business investment
Expanding the business is a main driver for our capital expenditure
Chart 5: Do you agree or disagree with the following statements?Please rate on a scale from 1 to 5, where 1 = strongly agree, 3 = neither agree nor disagree and 5 = strongly disagree. (% respondents)
32
20
9
25
23
2
2
11183626
2
102035
92840
152236
5113030
1 Strongly agree 2 3 Neither agree nor disagree 4 5 Strongly disagree

Upgrading Britain?The effect of capital expenditure trends on productivity, profitability and competitiveness
© The Economist Intelligence Unit Limited 201116
uncertainty. “People are going to scrutinise decisions very heavily now,” says Mr Tholen. For the majority of businesses, however, government efforts are perceived as being business-
friendly, not least its headline cuts in corporate tax rates. But from a macroeconomic perspective, concerns about overall inflation and particularly rapidly rising commodity prices, as well as currency exchange risks, all weigh on CapEx decisions. “For companies, we are seeing not just a bit more fear over currencies, but a lot of uncertainty over raw material costs. Companies have to price more frequently or change price, so that is causing a bit more concern,” says Mr McLean of SVM.
The finance challengeAlthough many firms appear to be sitting on substantial cash reserves, it is still an uphill battle to find credit on reasonable terms. This is reflected across the industry: 38% of respondents agree that companies in their sector are slowed from increasing investment because of credit constraints. This rises to 57% among firms with less than £100m in turnover.
Lord Adair Turner, the head of the UK Financial Services Authority, has noted that although bank lending in the UK tripled in the decade before the crisis, it was all targeted at the property boom. Total lending to manufacturing companies, by contrast, was lower in 2007 than in 1997. Interviewees’ views on credit varied, but suggest that although credit availability has improved, it remains challenging. “The banks are very choosy about what they are prepared to invest in. It’s just not as free-flowing as they suggest,” says Ms Adams of Menzie.
Lack of credit for UK businesses has become the target of criticism from politicians, with the business secretary, Vince Cable, arguing that banks are not meeting the lending targets set by the Project Merlin accord agreed between the banking industry and government in February. In June, the prime minister, David Cameron, threatened banks with new taxes if the targets were not met. But according to figures for the quarter to March, banks seem to be on track to meet the annual target for overall corporate lending of £190bn, lending £47.3bn in the quarter. However, banks are falling short on the target of £76bn for lending to small and medium-sized businesses, lending just £16.8bn in the first quarter.
Against this backdrop there remains some uncertainty about whether borrowing to invest at this time is the right decision. Overall, firms are divided over whether this is a good time to borrow to invest: 36% agree that it is, whereas 29% disagree. Views vary widely between specific industries, however. Transport and logistics firms are far more strongly in favour than financial services firms, for example (see table 3). But an appetite for this appears to be rising in general. Deloitte’s CFO survey suggests a (slight) positive balance of executives planning to increase gearing in their companies, for the first time in two and a half years.
Table 3: This is the right time to borrow to invest…
% respondents agreeing vs disagreeing
Tech & telecoms Transport & logistics Manufacturing Financial services
Agree 36% 57% 35% 23%
Disagree 26% 11% 16% 46%
Source: Economist Intelligence Unit.

Upgrading Britain?The effect of capital expenditure trends on productivity, profitability and competitiveness
© The Economist Intelligence Unit Limited 201117
Nevertheless, it is clear that the general preference for funding is from overall reserves, used by seven in ten firms overall last year. A further one-quarter (26%) also relied on bank loans, rising to one-third (35%) among companies with revenue between £250m and £1bn. For listed firms, equity-based transactions are also popular, selected by 29% overall, rising to 35% among large firms with revenue of £1bn or more. For 16%, asset finance was used to fund CapEx. One in five smaller companies, with revenue below £100m, also relied on director’s guarantees.
Tighter scrutiny over decision-makingGiven this backdrop, scrutiny of any CapEx decisions has inevitably increased within firms. Overall, 61% of firms polled say that there is a greater focus than before on cost-benefit analysis when making CapEx decisions, while six in ten firms are ensuring that their board plays a greater role in such decisions too.
One example comes from Hammerson, a real estate investment trust that manages a £5.3bn property portfolio, largely in retail assets. Although the firm continued to make acquisitions and other investments during the recession, especially from June 2009 as more attractive deals emerged onto the market, the decision-making process was considerably tougher. “We have always been under tight scrutiny, but this was in a climate where all decisions were looked at from top to bottom, and we’re continuing to work that way now,” says Peter Cole, the firm’s chief investment officer. However, specific CapEx aimed at the development of properties was essentially put on hold for two years, although this
69
29
26
23
16
14
10
7
6
From your existing reserves
Equity transaction
Bank loan
Overdraft / current working capital
Asset finance (HP, finance lease, operating lease)
Trade finance
Director’s loan
Mortgage on property / premises
Director’s guarantees
Chart 6: Which of the following funding techniques have you used in the last year? Select all that apply. (% respondents)
A main drive for our capital expenditure is to help us meet the demands of existing clients
We are too cautious as a business when considering our capital expenditure plans
A focus on controlling costs is more important than investing in the business at this time
I am concerned about the availability of funding for capital expenditure
Availability of funding is the major constraint of our capital expenditure ambition
Chart 7: Do you agree or disagree with the following statements?Please rate on a scale from 1 to 5, where 1 = strongly agree, 3 = neither agree nor disagree and 5 = strongly disagree. (% respondents)
31 35
18 22
11 25
12 29
15 22
3724
82230
62136
111930
142029
1 Strongly agree 2 3 Neither agree nor disagree 4 5 Strongly disagree

Upgrading Britain?The effect of capital expenditure trends on productivity, profitability and competitiveness
© The Economist Intelligence Unit Limited 201118
is now returning. “Our approach is one of very careful management of the overall risk. Investing in development needs far more careful assessment, to manage risk versus returns,” he says. “We’re living in a heightened risk world, and we need to be conscious of that.”
For some firms, current CapEx decision-making fits into a longer investment cycle, which can help to justify maintaining investments during a difficult period in an economic cycle. Just over one-half (54%) of the firms polled maintain a capital investment cycle, although many operate it on just a one- to two-year cycle. Overall, however, about one in five firms invest in a cycle that lasts four years or more, such as many of the firms in the oil and gas sector.
Some run a hybrid model. Fujitsu UK is one example, with the firm’s investment pattern guided by its Japanese owners. The company maintains a two-track investment approach, which right now is being focused largely on developing the firm’s offerings of “cloud” technologies and services. “There is a shorter 12-18-month near-term investment cycle, which is very customer- and industry-specific, and then there is a long-term overlay model that serves as the overriding road map,” says Marc Silvester, the company’s UK chief technology officer. Within this, spending decisions are weighed up very carefully, with a number of decision points. “Fujitsu is very careful and considered and takes quite a reasonable counsel across both the customer base and also its internal companies,” says Mr Silvester. “So investment proposals will flow both up the company into Japan, and also from Japan through the rest of the company.”
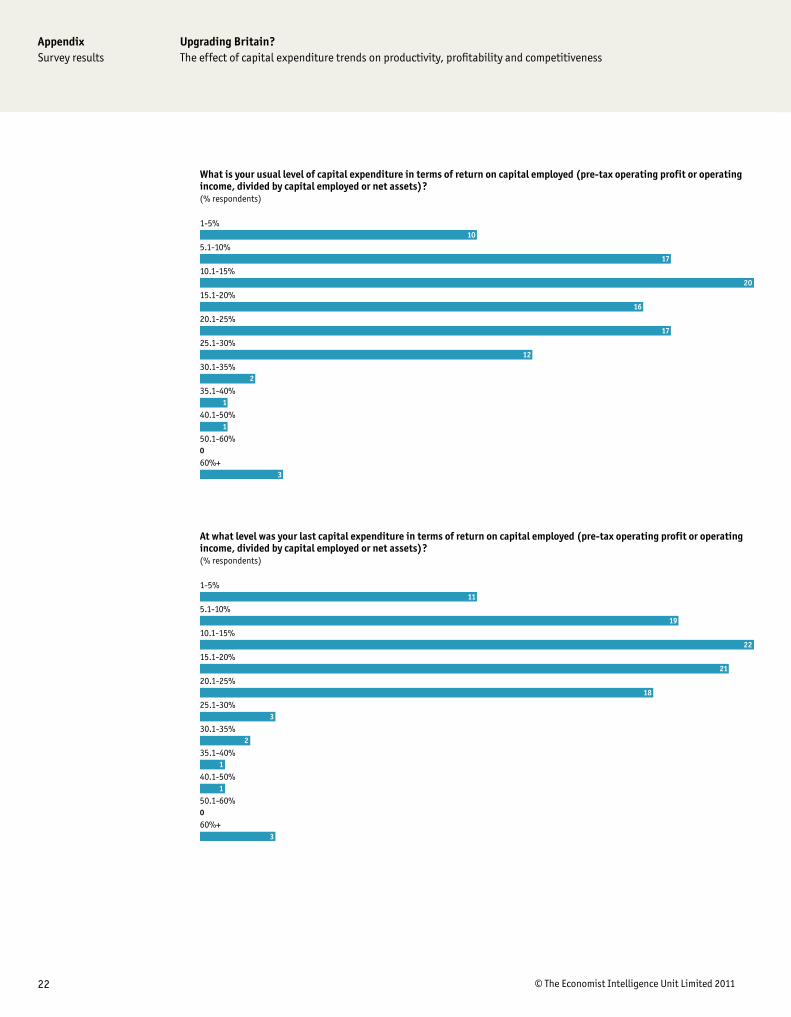
Assessing returnsOne factor in the decision-making process is the question of returns. Average rates of return vary across industries, but data suggest that they will pick up slightly in the year ahead. Across the overall sample, return on capital employed (ROCE)—one of various measures to assess how investments have performed—is expected to be between 15% and 20%.
Overall, investments during the last financial year generated returns on the lower side of that, whereas a pick-up is expected by executives for any investments in the year ahead (see table 4). If this bears out, it is likely to ease the decision-making process, as corporate boards see a return to relative normality in terms of their investments.
Table 4: Return on capital employed
Sector averages, last financial year versus coming financial year
Tech & telecoms Transport & logistics Manufacturing Financial services
Past financial year Around 14% Around 13% Around 15% Around 14%
Current financial year Around 17% Around 18% Around 18% Around 19%
Source: Economist Intelligence Unit.

Upgrading Britain?The effect of capital expenditure trends on productivity, profitability and competitiveness
© The Economist Intelligence Unit Limited 201119
As noted at the beginning of this report, the UK’s record of investment has historically lagged that of other European economies. Of course, determining an optimal level of investment is difficult,
with both over-investment and under-investment raising problems. At a corporate level, firms have clearly taken a cautious approach of cutting back investment during the recession, as demand dropped sharply and significant risks loomed in the economic outlook.
In the short term, this belt-tightening has raised productivity, as firms have squeezed more out of their people and their assets. This is typical for any downturn, notes Professor Lasfer of Cass Business School. “When the economy is doing well, you tend to slack a bit, as everyone gets a return. You won’t be 100% efficient. But when the economy is bad, there’s significant pressure, so you start thinking about how to improve the productivity of your workers to get as efficient as possible,” he says. In all, 56% of executives polled for this report say that productivity has increased in their business, with another 28% saying that productivity levels have been maintained at similar levels. Similarly, nearly four in ten firms (38%) have noticed an increase in corporate profits, with a further three in ten at least maintaining profit levels, all of which has contributed to the build up of cash on balance sheets.
The key question is how long this prudence and cautiousness can be stretched out before the strains are felt—or rivals start to gain competitive advantage. “This strategy has limits,” warns Professor Lasfer. “You might think ‘yes, we’re very efficient now’, but in the long run this will be detrimental to you.” Overall, it remains to see whether corporate Britain will successfully navigate this balancing act as firms reassess their investment plans for the year ahead. Those that do not could well find themselves short of capacity if demand returns, whereas those that over-invest in capacity might find themselves exposed if the economy turns down again. Tough decisions lie ahead.
Conclusion: The productivity challenge

20 © The Economist Intelligence Unit Limited 2011
AppendixSurvey results
Upgrading Britain?The effect of capital expenditure trends on productivity, profitability and competitiveness
Appendix: Survey resultsNote: Chart totals may not add to 100% due to rounding of figures.
36
17
15
13
7
7
4
1
London
South east
North
Midlands
South west
Scotland
Wales
Northern Ireland
In which region of the UK are you located? (% respondents)
25
38
23
14
We halted all planned investment until we fully understood the effect of the financial crisis on our company, unless it was of critical importance
We maintained all planned investments through the financial crisis and recession
We took advantage of opportunities presented by the recession (eg, better deals), and as such increased investment during the crisis
We continued with regular maintenance of existing equipment, or replaced old equipment, but did not commit to any new investments during therecession, even those that we had originally planned
Which of the following statements best describes your company’s position on investing in the business during the financial crisis and recession? (% respondents)
54
46
Yes
No
Does your business operate a planned ‘capital investment cycle’? (% respondents)
21 © The Economist Intelligence Unit Limited 2011
AppendixSurvey results
Upgrading Britain?The effect of capital expenditure trends on productivity, profitability and competitiveness
25
9
19
10
16
10
6
4
Every year
Every 1-2 years
Every 2-3 years
Every 3-4 years
Every 4-5 years
Every 5-6 years
Every 6-7 years
Every 7+ years
If yes how frequent is this cycle? (% respondents)
36
37
22
4
Increased capital expenditure this year compared to previous years
Maintained capital expenditure this year compared to previous years
Reduced capital expenditure this year compared to previous years
Completely cut capital expenditure this year
Has your business: (% respondents)
22
21
13
28
7
3
6
Improved, as we have invested across the business
Improved, as we have focused what spend we have on efficiency improvement
Improved, as we have been forced to innovate to compensate for reduced spend
Stayed the same
Decreased a little as our machinery and systems are no longer efficient
Decreased a great deal as we have not been able to replace equipment as planned
Don’t know – we don’t analyse in this way
What effect has your level of capital expenditure had on your business productivity? (% respondents)
38
30
19
4
10
Increased profits
Profits stayed the same
Decreased profits by a small amount
Decreased profits by a significant amount
Don’t know – we don’t analyse in this way
What effect has your capital expenditure had on profitability? (% respondents)
22 © The Economist Intelligence Unit Limited 2011
AppendixSurvey results
Upgrading Britain?The effect of capital expenditure trends on productivity, profitability and competitiveness
10
17
20
16
17
12
2
1
1
0
3
1-5%
5.1-10%
10.1-15%
15.1-20%
20.1-25%
25.1-30%
30.1-35%
35.1-40%
40.1-50%
50.1-60%
60%+
What is your usual level of capital expenditure in terms of return on capital employed (pre-tax operating profit or operating income, divided by capital employed or net assets)? (% respondents)
11
19
22
21
18
3
2
1
1
0
3
1-5%
5.1-10%
10.1-15%
15.1-20%
20.1-25%
25.1-30%
30.1-35%
35.1-40%
40.1-50%
50.1-60%
60%+
At what level was your last capital expenditure in terms of return on capital employed (pre-tax operating profit or operating income, divided by capital employed or net assets)? (% respondents)

23 © The Economist Intelligence Unit Limited 2011
AppendixSurvey results
Upgrading Britain?The effect of capital expenditure trends on productivity, profitability and competitiveness
8
15
18
18
20
10
3
1
1
0
2
5
1-5%
5.1-10%
10.1-15%
15.1-20%
20.1-25%
25.1-30%
30.1-35%
35.1-40%
40.1-50%
50.1-60%
60%+
Don’t know
At what level will your next capital expenditure be in terms of return on capital employed (pre-tax operating profit or operating income, divided by capital employed or net assets)? (% respondents)
66
49
45
36
35
33
33
29
28
23
IT (new)
IT (maintenance of existing equipment)
Plant machinery and equipment (new)
Property
Telecoms (new)
Plant machinery and equipment (maintenance of existing equipment)
Specialist equipment unique to your industry
Office equipment
Telecoms (maintenance of existing equipment)
Vehicles
What are the main areas of your company that receive reinvestment during a normal cycle? Select up to five.(% respondents)

24 © The Economist Intelligence Unit Limited 2011
AppendixSurvey results
Upgrading Britain?The effect of capital expenditure trends on productivity, profitability and competitiveness
I’m confident about the future economic climate for our business
New investment in our business would be worthwhile at the current time
Borrowing money to invest in our business is the right decision at this time
Improving efficiency/effectiveness is a main driver for our business investment
Expanding the business is a main driver for our capital expenditure
Do you agree or disagree with the following statements?Please rate on a scale from 1 to 5, where 1 = strongly agree, 3 = neither agree nor disagree and 5 = strongly disagree. (% respondents)
32
20
9
25
23
2
2
11183626
2
102035
92840
152236
5113030
1 Strongly agree 2 3 Neither agree nor disagree 4 5 Strongly disagree
57
43
42
34
34
28
27
24
21
21
IT (new)
IT (maintenance of existing equipment)
Plant machinery and equipment (new)
Telecoms (new)
Property
Plant machinery and equipment (maintenance of existing equipment)
Specialist equipment unique to your industry
Vehicles
Telecoms (maintenance of existing equipment)
Office equipment
What were the main areas of your company that received reinvestment in your last financial year (2009/2010)?Select up to five. (% respondents)
62
46
39
37
37
30
24
23
22
19
IT (new)
Plant machinery and equipment (new)
IT (maintenance of existing equipment)
Telecoms (new)
Property
Specialist equipment unique to your industry
Plant machinery and equipment (maintenance of existing equipment)
Vehicles
Office equipment
Telecoms (maintenance of existing equipment)
Which areas will receive reinvestment in your next financial year (2010/ 2011)? Select up to five. (% respondents)

25 © The Economist Intelligence Unit Limited 2011
AppendixSurvey results
Upgrading Britain?The effect of capital expenditure trends on productivity, profitability and competitiveness
A main drive for our capital expenditure is to help us meet the demands of existing clients
We are too cautious as a business when considering our capital expenditure plans
A focus on controlling costs is more important than investing in the business at this time
I am concerned about the availability of funding for capital expenditure
Availability of funding is the major constraint of our capital expenditure ambition
Do you agree or disagree with the following statements?Please rate on a scale from 1 to 5, where 1 = strongly agree, 3 = neither agree nor disagree and 5 = strongly disagree. (% respondents)
31 35
18 22
11 25
12 29
15 22
3724
82230
62136
111930
142029
1 Strongly agree 2 3 Neither agree nor disagree 4 5 Strongly disagree
78
33
32
21
20
13
10
8
6
From your existing reserves
Equity transaction
Bank loan
Asset finance (HP, finance lease, operating lease)
Overdraft / current working capital
Trade finance
Director’s loan
Mortgage on property / premises
Director’s guarantees
Which are your preferred funding sources for your capital expenditure requirements? Select up to three. (% respondents)
69
29
26
23
16
14
10
7
6
From your existing reserves
Equity transaction
Bank loan
Overdraft / current working capital
Asset finance (HP, finance lease, operating lease)
Trade finance
Director’s loan
Mortgage on property / premises
Director’s guarantees
Which of the following funding techniques have you used in the last year? Select all that apply. (% respondents)

26 © The Economist Intelligence Unit Limited 2011
AppendixSurvey results
Upgrading Britain?The effect of capital expenditure trends on productivity, profitability and competitiveness
We are falling behind our competitors due to our reduced level of reinvestment
We have been unable to expand our range of products and/or services due to our reduced level of reinvestment
We have been unable to expand into new markets due to our reduced level of reinvestment
Do you agree or disagree with the following statements?Please rate on a scale from 1 to 5, where 1 = strongly agree, 3 = neither agree nor disagree and 5 = strongly disagree. (% respondents)
22
13
8
15272017
13263018
15232826
1 Strongly agree 2 3 Neither agree nor disagree 4 5 Strongly disagree
There is now more of a focus on cost/benefit analysis when making decisions on capital expenditure
There is now more involvement from the board on capital expenditure decisions
My company is very effective in planning, prioritising and selecting capital investment opportunities
All potential capital expenditure projects are ranked on the basis of quantitative criteria in order to determine which to prioritise for funding
Qualitative considerations often trump quantitative criteria when determining which capital expenditure projects to prioritise for funding
Sustainability, or sustainability related issues, is taken into consideration when my company makes capex-related business decisions
Do you agree or disagree with the following statements?Please rate on a scale from 1 to 5, where 1 = strongly agree, 3 = neither agree nor disagree and 5 = strongly disagree. (% respondents)
25
30
12
14
13
15
282836
392829
7163134
4123237
4173531
6153132
1 Strongly agree 2 3 Neither agree nor disagree 4 5 Strongly disagree
68
30
28
17
15
10
8
7
Relationship of project to business strategy
Product line or location and its significance to the enterprise
Project is necessary to comply with government regulations
Management, technical and marketing capacities or constraints
Timing of fund flows from the project versus the timing of fund flows required
Project is necessary for employee health and welfare
Project is necessary for protection of company property
Desired balance in spending by product classification
What are the most important qualitative considerations when making capital expenditure decisions at your company?Select up to two. (% respondents)

27 © The Economist Intelligence Unit Limited 2011
AppendixSurvey results
Upgrading Britain?The effect of capital expenditure trends on productivity, profitability and competitiveness
Companies in my industry significantly reduced their spending on capital expenditure as a result of the financial crisis
Companies in my industry are still hesitant to start reinvesting due to continued constraints on credit
Companies in my industry are still hesitant to start reinvesting due to continued concerns about the economic environment
Companies in my industry are still hesitant to start reinvesting due to concerns about government cutbacks
There is no longer a regular capital expenditure cycle for companies in my industry
Do you agree or disagree with the following statements?Please rate on a scale from 1 to 5, where 1 = strongly agree, 3 = neither agree nor disagree and 5 = strongly disagree. (% respondents)
36
17 28
13 33
11 27
8 19
2152027
31734
41535
82628
92340
1 Strongly agree 2 3 Neither agree nor disagree 4 5 Strongly disagree
30
18
18
14
10
7
4
Not applicable, we are not holding excess cash
M&A
Paying down debt
Paying or increasing dividends
R&D
Putting more cash into pension funds
Retiring equity
What alternatives to capital expenditure are you considering for your corporate cash? (% respondents)
22
3
14
15
13
18
16
£50m or less
£50m to £100m
£100m to £250m
£250m to £500m
£500m to £1bn
£1bn to £5bn
£5bn or more
What are your annual revenues? (% respondents)

28 © The Economist Intelligence Unit Limited 2011
AppendixSurvey results
Upgrading Britain?The effect of capital expenditure trends on productivity, profitability and competitiveness
5
14
14
5
10
19
9
7
14
4
Board member
CEO/President/Managing director
CFO/Treasurer/Comptroller
CIO/Technology director
Other C-level executive
SVP/VP/Director
Head of business unit
Head of department
Manager
Other
Which of the following best describes your job title? (% respondents)
21
16
15
11
7
5
4
2
2
2
1
1
1
1
3
3
2
2
2
IT and technology
Manufacturing
Transportation - freight and passenger
Financial services
Professional services
Energy and natural resources
Entertainment, media and publishing
Construction, engineering & infrastructure
Government/Public sector
Education
Agriculture and agribusiness
Healthcare, pharmaceuticals and biotechnology
Retailing
Chemicals
Telecommunications
Consumer goods
Aerospace/Defence
Automotive
Logistics and distribution
What is your primary industry? (% respondents)

While every effort has been taken to verify the accuracy of this information, neither The Economist Intelligence Unit Ltd. nor the sponsor of this report can accept any responsibility or liability for reliance by any person on this white paper or any of the information, opinions or conclusions set out in this white paper.
Cover image - © Fabio Berti/Shutterstock

LONDON26 Red Lion SquareLondon WC1R 4HQUnited KingdomTel: (44.20) 7576 8000Fax: (44.20) 7576 8500E-mail: [email protected]
NEW YORK750 Third Avenue5th FloorNew York, NY 10017United StatesTel: (1.212) 554 0600Fax: (1.212) 586 1181/2E-mail: [email protected]
HONG KONG6001, Central Plaza18 Harbour RoadWanchai Hong KongTel: (852) 2585 3888Fax: (852) 2802 7638E-mail: [email protected]
GENEVABoulevard des Tranchées 161206 GenevaSwitzerlandTel: (41) 22 566 2470Fax: (41) 22 346 93 47E-mail: [email protected]