partnership for the assessment of standards-based sciencepartnership for the assessment of...
TRANSCRIPT

Partnership for the Assessment of Standards-based Science
P A S S
1© 2007 WestEd
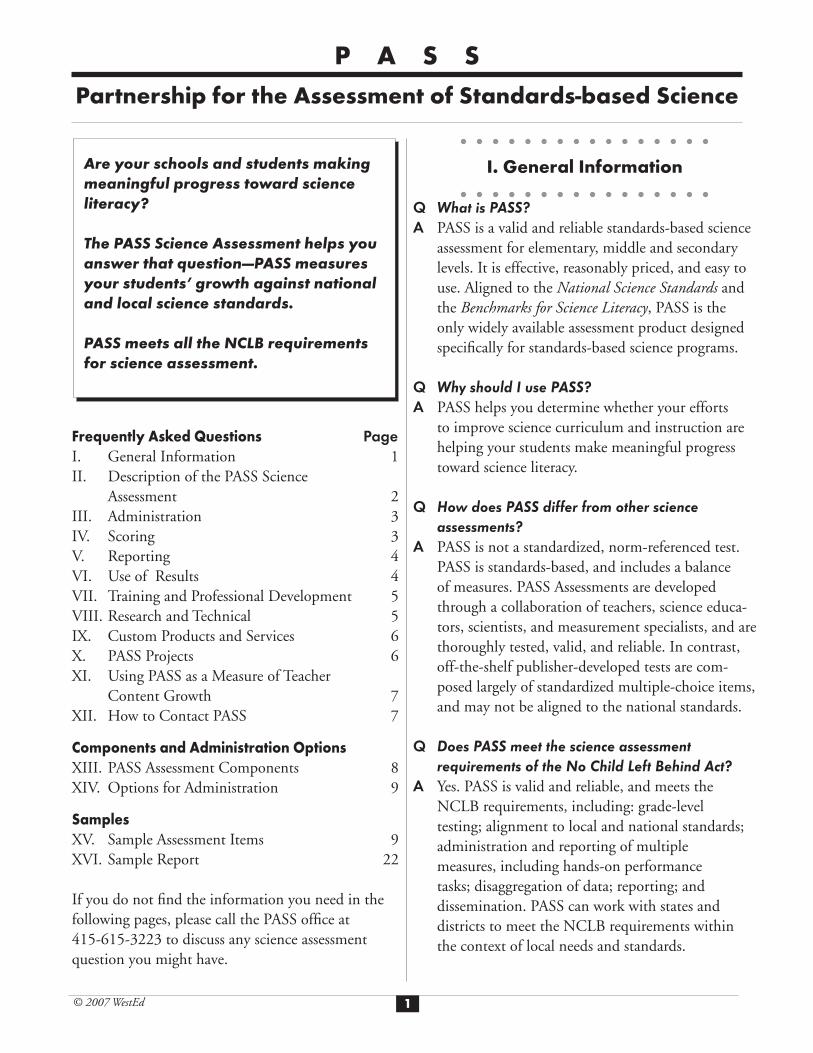
Are your schools and students making meaningful progress toward science literacy?
The PASS Science Assessment helps you answer that question—PASS measures your students’ growth against national and local science standards.
PASS meets all the NCLB requirements for science assessment.
Frequently Asked Questions PageI. General Information 1II. Description of the PASS Science
Assessment 2III. Administration 3IV. Scoring 3V. Reporting 4VI. Use of Results 4VII. Training and Professional Development 5VIII. Research and Technical 5IX. Custom Products and Services 6X. PASS Projects 6XI. Using PASS as a Measure of Teacher
Content Growth 7XII. How to Contact PASS 7
Components and Administration OptionsXIII. PASS Assessment Components 8XIV. Options for Administration 9
SamplesXV. Sample Assessment Items 9XVI. Sample Report 22
If you do not fi nd the information you need in the following pages, please call the PASS offi ce at 415-615-3223 to discuss any science assessment question you might have.
I. General Information
Q What is PASS?A PASS is a valid and reliable standards-based science
assessment for elementary, middle and secondary levels. It is effective, reasonably priced, and easy to use. Aligned to the National Science Standards and the Benchmarks for Science Literacy, PASS is the only widely available assessment product designed specifi cally for standards-based science programs.
Q Why should I use PASS?A PASS helps you determine whether your efforts
to improve science curriculum and instruction are helping your students make meaningful progress toward science literacy.
Q How does PASS differ from other science assessments?
A PASS is not a standardized, norm-referenced test. PASS is standards-based, and includes a balance of measures. PASS Assessments are developed through a collaboration of teachers, science educa-tors, scientists, and measurement specialists, and are thoroughly tested, valid, and reliable. In contrast, off-the-shelf publisher-developed tests are com-posed largely of standardized multiple-choice items, and may not be aligned to the national standards.
Q Does PASS meet the science assessment requirements of the No Child Left Behind Act?
A Yes. PASS is valid and reliable, and meets the NCLB requirements, including: grade-level testing; alignment to local and national standards; administration and reporting of multiple measures, including hands-on performance tasks; disaggregation of data; reporting; and dissemination. PASS can work with states and districts to meet the NCLB requirements within the context of local needs and standards.

Partnership for the Assessment of Standards-based Science
P A S S
2© 2007 WestEd
Q Who has used the PASS Assessments?A PASS has been used successfully in 22 states
and Puerto Rico.
Q Is it possible to talk with people who have used this test?
A Yes. Call PASS at 415-615-3223; we will put you in touch with previous PASS users.
II. Description of the PASS Science Assessment
Q Are the PASS Assessments aligned to the National Standards?
A All PASS assessment items, questions, and tasks are aligned to the content recommendations of both the National Science Education Standards and to the Benchmarks for Science Literacy. The PASS Development Team analyzed each item, question and task to determine the degree to which its content matches the intent of the Standards or Benchmarks.
Q Can we use the PASS Assessment even if we have developed our own state or local standards for science?
A Yes. PASS has developed a process to help sites to align their local standards to the PASS As-sessments.
Q How are the PASS Science Assessments
developed? A The work of PASS is accomplished by an As-
sessment Advisory Board in conjunction with an Assessment Development Team. The Devel-opment Team, made up primarily of grade-level teachers, also includes scientists, measurement specialists, science resource teachers and science supervisors. They develop, pilot, fi eld test, and revise all assessment components. The Assess-
ment Advisory Board, consisting of systemic initiative leaders, representatives from science reform efforts, scientists, measurement spe-cialists, testing contractors, and business and university representatives, oversees both the progress of the Development Team and the administration, scoring, and reporting of the assessments, ensuring the scientifi c and psy-chometric quality of all items and tasks.
Q At what grade levels are the PASS Science Assessments available?
A The PASS Assessments are currently available at the elementary, middle and high school lev-els, and are usually administered at grades fi ve, eight and ten. Please contact the PASS offi ce if you need to administer the PASS Assessments at an alternate grade level.
Q What types of measures are included in the PASS Science Assessments?
A The standards-based assessments developed by PASS provide a unique balance of measures that are not generally available through stan-dardized, off-the-shelf, test publisher instru-ments. The PASS Assessments contain hands-on performance tasks, constructed response investigations, open-ended questions and enhanced multiple-choice questions. See Page 8 for a chart outlining the PASS Assessment components.
Q Can we view PASS Assessments?A Examples of PASS Assessments can be found
beginning on Page 9.

Partnership for the Assessment of Standards-based Science
P A S S
3© 2007 WestEd
III. Administration of the PASS Science Assessments
Q How are the PASS Assessments administered?A PASS will train the teacher or other test adminis-
trator in the set-up and administration of the as-sessments. The PASS grade level Test Administra-tion Manuals contain detailed instructions and a script for administration. Sites can administer the assessments in a classroom, science laboratory, school multi-purpose room, library or cafeteria.
Q How long does it take to administer the PASS Assessments?
A At each grade level, the PASS Assessment con-sists of three assessment components and some pre-assessment activities. The assessments take about two hours and forty minutes to administer; schools can choose to administer them in one, two, or three days.
Q When are the PASS Assessments administered?A PASS is generally administered in the Spring of
each year. We can also adjust the testing schedule to meet your individual assessment needs. For further information, contact the PASS offi ce at 415-615-3223.
Q Do I have to administer the PASS Assessments to a minimum or maximum number of students?
A PASS encourages potential participants to con-sider how they plan to use their results when selecting the sample size for testing. For example, if a large urban district with a fi fth-grade popula-tion of 5,000 students chooses to test only one 30-student class, the sample size will not produce representative data.
Since PASS does not distribute single copies of the assessment, participants should enroll at least one classroom per school. There is no maximum number—states, districts and schools are invited to test all students within a grade level if they choose.
Please call the PASS offi ce at 415-615-3223 if you need assistance in determining the number of students to enroll.
Q Can we use the PASS Assessments over multiple years?
A Yes. PASS encourages regular administration of the PASS Assessments so that sites can measure their growth from year to year. Measurement specialists on the PASS Advisory Board scaled and equated the 1997 and 1998 results to produce scale scores for 1999. The scale score provides a “standard” or “benchmark” that allows sites to examine their growth and performance over multiple years. PASS standards-based assessments provide valuable information and data for schools working to continually improve science educa-tion.
IV. Scoring
Q How are student results from the performance components of the PASS Science Assessment scored?
A Participants return all materials to the PASS test-ing contractor. For the multiple-choice compo-nent, students mark their choices on computer-ized forms which are scanned for correct answers. For the performance tasks, open-ended questions, and constructed response investigations, students write responses directly in their test booklets. PASS uses a carefully constructed scoring proce-dure to score these responses.
Partnership for the Assessment of Standards-based Science
P A S S
4© 2007 WestEd
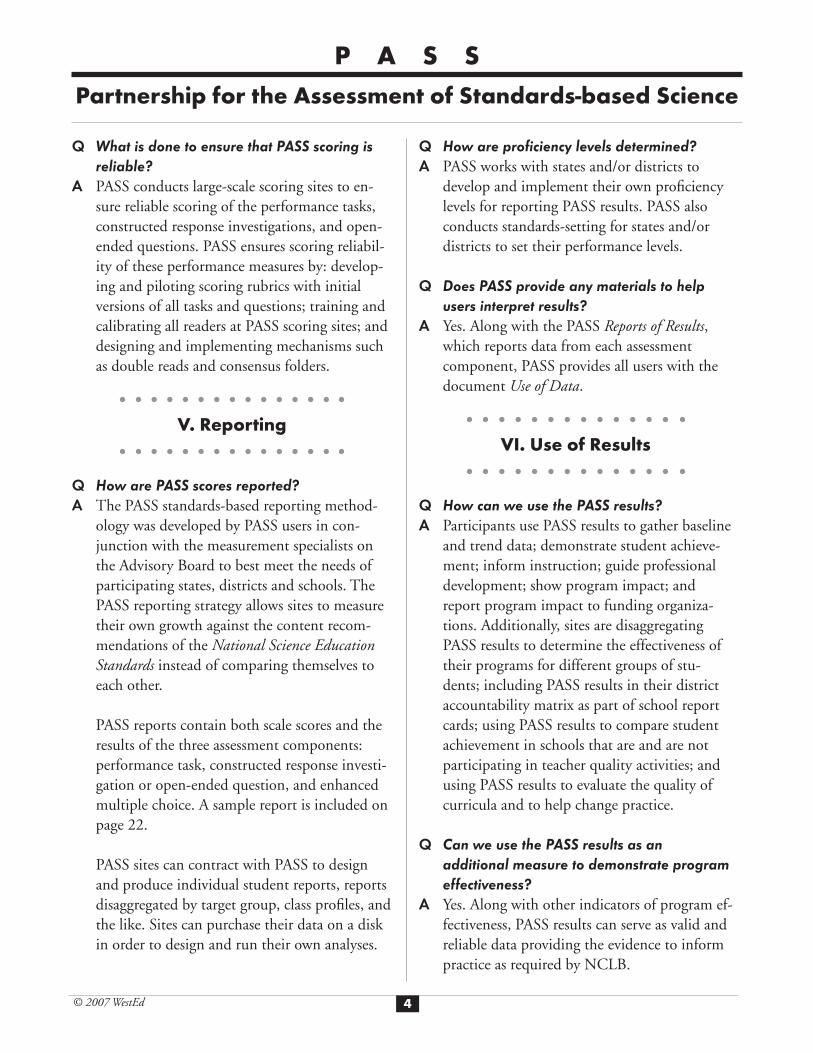
Q What is done to ensure that PASS scoring is reliable?
A PASS conducts large-scale scoring sites to en-sure reliable scoring of the performance tasks, constructed response investigations, and open-ended questions. PASS ensures scoring reliabil-ity of these performance measures by: develop-ing and piloting scoring rubrics with initial versions of all tasks and questions; training and calibrating all readers at PASS scoring sites; and designing and implementing mechanisms such as double reads and consensus folders.
V. Reporting
Q How are PASS scores reported?A The PASS standards-based reporting method-
ology was developed by PASS users in con-junction with the measurement specialists on the Advisory Board to best meet the needs of participating states, districts and schools. The PASS reporting strategy allows sites to measure their own growth against the content recom-mendations of the National Science Education Standards instead of comparing themselves to each other.
PASS reports contain both scale scores and the results of the three assessment components: performance task, constructed response investi-gation or open-ended question, and enhanced multiple choice. A sample report is included on page 22.
PASS sites can contract with PASS to design
and produce individual student reports, reports disaggregated by target group, class profi les, and the like. Sites can purchase their data on a disk in order to design and run their own analyses.
Q How are profi ciency levels determined?A PASS works with states and/or districts to
develop and implement their own profi ciency levels for reporting PASS results. PASS also conducts standards-setting for states and/or districts to set their performance levels.
Q Does PASS provide any materials to help users interpret results?
A Yes. Along with the PASS Reports of Results, which reports data from each assessment component, PASS provides all users with the document Use of Data.
VI. Use of Results
Q How can we use the PASS results? A Participants use PASS results to gather baseline
and trend data; demonstrate student achieve-ment; inform instruction; guide professional development; show program impact; and report program impact to funding organiza-tions. Additionally, sites are disaggregating PASS results to determine the effectiveness of their programs for different groups of stu-dents; including PASS results in their district accountability matrix as part of school report cards; using PASS results to compare student achievement in schools that are and are not participating in teacher quality activities; and using PASS results to evaluate the quality of curricula and to help change practice.
Q Can we use the PASS results as an additional measure to demonstrate program effectiveness?
A Yes. Along with other indicators of program ef-fectiveness, PASS results can serve as valid and reliable data providing the evidence to inform practice as required by NCLB.

Partnership for the Assessment of Standards-based Science
P A S S
5© 2007 WestEd
VII. Training and Professional Development
Q Does PASS provide training in the set-up and administration of the assessments?
A Yes. PASS offers training by conference call or video conferencing. Sites may also contract with PASS to conduct on-site training. In addition, detailed and scripted information is provided in the PASS Administration Manuals.
Q Does PASS provide training in the use of results?
A Yes. PASS can provide training in the use of test results. Please contact the PASS offi ce at 415-615-3223 for details.
Q What other kinds of training and professional development does PASS provide? (Also see Section IX.)
A PASS has expanded its professional development services to include the participation of a nation-ally recognized network, including WestEd staff, with expertise in standards-based curriculum, instruction, and assessment in science. The PASS network can assist participants in the following areas and more: (1) development and scoring of classroom assessments to match school/district curriculum and instruction; (2) use of assessment results and student work to inform instruction; (3) use of targeted classroom interventions; (4) alignment of state and/or district standards to the PASS Assessments; (5) alignment of state and/or district standards to the National Stan-dards; (6) workshops on various aspects and types of standards-based science assessment, cur-riculum, and instruction to help increase assess-
ment literacy skills of teachers and district per-sonnel; and (7) development of scoring rubrics and the scoring of performance assessments.
PASS also provides professional development focusing on the relationship between large-scale and local assessment.
VIII. Research and Technical
Q Are the PASS Science Assessments valid and reliable?
A The PASS Assessments are valid in that they measure the content recommended by the National Science Education Standards and the Benchmarks for Science Literacy. There is strong consensus on the match of the PASS Assessments to national standards and local standards.
The PASS Assessments are reliable. In analyzing test results, the PASS testing contractor produces item analyses, item bias analyses, statistical sum-maries and scale scores. Data from these analyses are used in the construction of all fi nal forms, questions and tasks.
For further information about methods used to ensure the validity and reliability of the PASS Assessments, contact the PASS offi ce at 415-615-3223.
Q Are the PASS Assessments research-based?A The standards-based assessments developed by
PASS build on previous research. Please contact the PASS offi ce at 415-615-3223 to obtain a list of relevant references.

Partnership for the Assessment of Standards-based Science
P A S S
6© 2007 WestEd
IX. Custom Products and Services
Q How can PASS customize its products and services?
A PASS contracts with states, districts, and projects to develop, test, administer, score, and report custom versions of PASS tailored to local needs. VT–PASS was the Vermont state science assess-ment for grades 5, 9, and 11, meeting all the NCLB science assessment requirements.
PASS has also developed custom versions for a number of science reform and teacher quality projects.
PASS provides comprehensive professional de-velopment services (see page 5) to help schools, districts, states and science reform projects with their standards-based science assessment needs. Staff will help states and districts with standards alignment and with correlations of their stan-dards to the PASS assessment. PASS can help teachers and district personnel learn how to use assessment data to inform instruction, improve performance, and monitor growth and progress. PASS staff can also help with the development of classroom-based science assessments aligned to local and national standards. PASS can also pro-vide technical assistance in the development of performance levels and standards setting within the context of state frameworks and standards.
X. PASS Projects
Q Does PASS conduct ongoing science assessment research?
A RISSA, Research in Standards-based Science Assessment, was an NSF-funded project work-ing with science education reform efforts to better measure the impact of their work and also to more effectively use assessment results to in-form and improve instruction. RISSA’s research will help to expand the existing knowledge base about student learning and assessment practices by investigating questions centered on: (1) the relationship(s) among assessment, instructional practices, and student achievement; and (2) teacher understanding and use of assessment re-sults to inform instruction and change classroom practice.
The study results will support our hypothesis that by training teachers in the interpretation and use of data, and by using targeted class-room interventions based on those data, student achievement scores improve.
The PASS/CSIAC Data Study explored achieve-ment gap issues in science learning. Using 1996–2001 PASS/CSIAC assessment data, the project examined the characteristics of achievement gaps along racial, ethnic, and gender lines. A panel of experts in both measurement and science edu-cation reviewed results, summarized fi ndings, and suggested further research in this important area. A comprehensive literature review and fi nal report are being completed.

Partnership for the Assessment of Standards-based Science
P A S S
7© 2007 WestEd
XI. Using PASS as a Measure of Teacher Content Growth
Q How can PASS be used to measure growth in teacher science content?
A By using a customized version of PASS, pro-grams (e.g., Math-Science Partnerships) are able to demonstrate program effectiveness with PASS results. These customized assessments measure growth in teacher science content knowledge over the life of the targeted teacher learning op-portunities. One purpose of the NCLB Title II, Part B, funding is to improve teacher content knowledge in science.
XII. How to Contact PASS
Q How do we contact PASS?A Contact the PASS offi ce at 415-615-3223, or at
Q How do we learn more about PASS?A Visit www.wested.org/cs/we/view/serv/84.

8© 2007 WestEd
P A S S
XIII. PASS Assessment Components
Component Description Purpose
Enhanced Multiple-choice Items(EMC)
(elementary, middle, and high school)
Each grade level contains six forms of EMC.Each form contains twenty-nine items. Amatrix approach is used to sample acrossstudents and content standards. Students takeone form and record answers on the StudentInformation Form (SIF).
These questions assess students’understanding of important scientific facts,concepts, principles, laws, and theories, andprobe analytical reasoning skills.
Hands-on Performance Tasks(HPT)
(elementary, middle, and high school)
Hands-on performance tasks provide studentsthe opportunity to construct the “big ideas” ofscience through inquiry and investigation.These tasks are presented to students with ascenario or story line that identifies a problemto solve in the investigation. Students recordanswers in a booklet. Responses are scoredwith a rubric.
Students are provided with hands-onequipment and materials and are asked to:perform short experiments; communicatescientific information; make scientificobservations; generate and record data; andanalyze their results based on this data.
Open-ended Questions (OEQ)
(elementary, middle, and high school)
Students are presented with a problem andconstruct their own answer by writing a shortparagraph, drawing a picture, and/ormanipulating data. Students record answers ina test booklet. Responses are scored with arubric.
These questions explore students’ ability tocommunicate scientific information, inquire,reason scientifically, and use science toexpress positions on societal issues.
Constructed ResponseInvestigations (CRI)
(elementary, middle, and high school)
Similar to performance tasks, but do notrequire hands-on materials. Students recordanswers in a test booklet. Responses arescored with a rubric.
Students are presented with a problem thatstudents in another school are trying to solve.They are provided with data sets andquestions. They must analyze the problem,conduct a secondary analysis, revise ahypothesis, construct questions, andrecommend solutions.
Student Information Form(SIF)
One-page machine-scorable document.Student background information is reported intheir “School Profile.”
To collect: student supplied demographicinformation and answers to multiple-choiceitems.

9© 2007 WestEd
P A S S
XIV. Options for Administration of the PASS Assessment
XV. Sample Assessment Items
This section provides samples from previous PASS Assessments at each grade level—elementary, middle, and high school.
The elementary sample includes an enhanced multiple-choice question, an open-ended question, a scoring rubric, and associated Standards and Benchmarks.
The middle school sample includes a performance task, a scoring rubric, and associated Standards and Bench-marks.
The high school sample includes an enhanced multiple-choice question, a constructed response investiga-tion, a scoring rubric, and associated Standards and Benchmarks.
Option 1One Day
Option 2Two Days
Option 3Three Days
Day 1 (2 hours, 40 minutes)
� Pre-assessment Activities30 minutes
� Enhanced Multiple-choice40 minutes
� Open-ended Questions orConstructed ResponseInvestigation20 minutes
� Setup of Performance Task20 minutes
� Instructions for PerformanceTask10 minutes
� Performance Task40 minutes
Day 1 (1 hour, 10 minutes)
� Preassessment Activities30 minutes
� Enhanced Multiple-choice40 minutes
Day 2 (1 hour, 30 minutes)
� Open-ended Questions orConstructed ResponseInvestigation20 minutes
� Setup of Performance Task20 minutes
� Instructions for PerformanceTask10 minutes
� Performance Task40 minutes
Day 1 (1 hour, 10 minutes)
� Preassessment Activities30 minutes
� Enhanced Multiple-choice40 minutes
Day 2 (20 minutes)
� Open-ended Questions orConstructed ResponseInvestigation20 minutes
Day 3 (1 hour, 10 minutes)
� Setup of Performance Task20 minutes
� Instructions for PerformanceTask10 minutes
� Performance Task40 minutes

10© 2007 WestEd
P A S S
PASS — Sample Assessment Items: Elementary Level
National Science Education Standard PS 3.3 – Electricity in circuits can produce light, heat, sound and magnetic effects. Electrical circuits
require a complete loop through which electrical current can pass.
Benchmarks for Science Literacy 4E (3-5) 1 – Things that give off light often also give off heat. Heat is produced by mechanical and elec-
trical machines, and any time one thing rubs against something else.
Sample Enhanced Multiple-choice Question
Sample Open-ended Question Sample Rubric
National Science Education Standards LS 3.1 – All animals depend on plants. Some animals eat plants for food. Other animals eat animals that
eat the plants.
Benchmarks for Science Literacy 5 C (3-5) 1 – Some living things consist of a single cell. Like familiar organisms, they need food, water,
and air; a way to dispose of waste; and an environment they can live in.

11© 2007 WestEd
P A S S
PASS — Sample Assessment Items: Middle School
National Science Education Standards LS 1.1 – Living systems demonstrate the complementary nature of structure and function. Important
levels of organization for structure and function include cells, organs, tissues, organ systems, whole organ-isms, and ecosystems.
LS 1.3 – Cells carry on the many functions needed to sustain life. They grow and divide, thereby produc-ing more cells. This requires that they take in nutrients, which they use to provide energy for the work that cells do and to make the materials that a cell or an organism needs.
Benchmarks for Science Literacy 5C (6–8) C – Within cells, many of the basic functions of organisms--such as extracting energy from food
and getting rid of waste--are carried out. The way in which cells function is similar in all living organisms.
Sample Enhanced Multiple-choice Question

12© 2007 WestEd
P A S S
Sample Performance Task (Students receive kits of hands-on materials to complete this task.)
PASS — Sample Assessment Items: Middle School
© 1997 WestEd - California Systemic Initiatives Assessment Collaborative
-11-
with your partner
Chemical Reactions
Part 1—PartnersInvestigation 2Chemical Reactions
Directions:
In this investigation you will work with your partner to set up and observe three different chemicalreactions.
Bag 1:
1. Put into this bag:1 level spoonful of Chemical X10 ml of Phenol Red
2. Seal this bag.
3. Shake this bag to completely mix the chemicals.
Record your data and observations on your “Chemical Reactions Data Sheet”(next page).
Bag 2:
1. Put into this bag:1 level spoonful of Chemical Y10 ml of Phenol Red
2. Seal this bag.
3. Shake this bag to completely mix the chemicals.
Record your data and observations on your “Chemical Reactions Data Sheet” (next page).
Bag 3:
1. Fill this bag with:1 level spoonful of Chemical X1 level spoonful of Chemical Y10 ml of Phenol Red
2. Seal this bag.
3. Shake this bag to completely mix the chemicals.
Record your data and observations on your “Chemical Reactions Data Sheet” (next page).Go to the Next Page
© 1997 WestEd - California Systemic Initiatives Assessment Collaborative
-12-
with your partner
Part 1—PartnersInvestigation 2Chemical Reactions
Chemical Reactions Data Sheet
Observations
Bag 1
Chemical X
&
Phenol Red
Bag 2
Chemical Y
&
Phenol Red
Bag 3
Chemical XChemical Y
&
Phenol Red
Go to the Next Page

13© 2007 WestEd
P A S S
Sample Performance Task (continued)
PASS — Sample Assessment Items: Middle School
© 1997 WestEd - California Systemic Initiatives Assessment Collaborative
-13-
on your own
Part 2—On Your OwnInvestigation 2Chemical Reactions—Questions
Directions:
Use your own notes and observations to answer the following questions. Your answer will begraded on how well you show your understanding of science and how well you can explain it toothers.
1. Using the data and observations that you recorded on the “Chemical Reactions Data Sheet,”organize your observations in Data Table 1 below.
Data Table 1
Bag 1Chemical X and
Phenol Red
Bag 2Chemical Y and
Phenol Red
Bag 3Chemical X
Chemical Y and Phenol Red
Temperaturechanges
Colorchanges
Other changesobserved
Go to the Next Page
© 1997 WestEd - California Systemic Initiatives Assessment Collaborative
-14-
on your ownPart 2—On Your Own
Investigation 2Chemical Reactions—Questions
2. If you weighed the sealed bag with its ingredients before and after the chemical reaction, wouldyou expect the weight to change?
Yes No
Using your understanding of matter, explain your answer.
3. Some students decided to use a heat pack to treat a sore shoulder. When they mixed thecontents of the heat pack, it gave off heat and stayed hot for awhile. Using your understandingof the chemical reactions in this investigation, explain how you would make your own heat packand why it would work.
Go to the Next Page

14© 2007 WestEd
P A S S
© 1997 WestEd - California Systemic Initiatives Assessment Collaborative
-15-
on your ownPart 2—On Your Own
Investigation 2Chemical Reactions—Questions
4. As part of their investigation, the students heated water to boiling. They poured equal amountsof the water into five containers, each made of a different material. After 15 minutes, they tookthe temperature of the water in each container and recorded it in Data Table 2 below.
Data Table 2
Materials Temperature (˚C) after 15 minutes
wood 90˚
aluminum 72˚
glass 80˚
copper 70˚
hard plastic 83˚
From Data Table 2, select two materials you could use to make a heat pack that would keep your hands warm for the longest period of time. Explain your answer.
Material 1 Material 2
Explain why you would use these two materials.
Go to the Next Page
Sample Performance Task (continued)
PASS — Sample Assessment Items: Middle School
© 1997 WestEd - California Systemic Initiatives Assessment Collaborative
-16-
on your own
Part 2—On Your OwnInvestigation 2Chemical Reactions—Questions
5. A. In Bag 3, something was produced that inflated the bag. What was produced?
B. How did it make the bag expand? Explain your answer.
Stop

15© 2007 WestEd
P A S S
Scoring Rubric For Task 2—Chemical Reactions—Grade 8
Page Item # Point Value Scoring Rubric Other Scoring Considerations
1 3 1 * 0 - 1 1 pt. for a “Temperature Change” observation: “bag got hot or warm.” * (See addendum for special scoring(Bag 1) condit ion.)
1 3 1 * 0 - 1 1 pt. for a “Color Change” observation: “transparent, or clear pink, * (See addendum for special scoring(Bag 1) or red.” Students may also state that the color “stayed the same” or condit ion.)
“remained the same,” or that “there was no change”—these are acceptable observations since the color change in this bag was subtle.
1 3 1* 0 - 1 1 pt. for “Other Changes Observed”: “solids dissolved” or * (See addendum for special scoring(Bag 1) “disappeared.” condition.)
1 3 1 * 0 - 1 1 pt. for a “Temperature Change” observation: “bag got cold” or “cool.” * (See addendum for special scoring(Bag 2) condition.)
13 1 * 0 - 1 1 pt. for a “Color Change” observation: “cloudy pink,” “milky pink,” * (See addendum for special scoring(Bag 2) “light pink,” or “pink”; instead of pink, students may also substitute condition.)
colors like: “red ,” “fusch ia ,” “purp le ,” “vio let ,” or “m a g e n t a . ”
1 3 1 * 0 - 1 1 pt. for “Other Changes Observed”: “less dissolution or minimal * (See addendum for special scoring(Bag 2) dissolution of solids” or “solids settled to or stayed at the bottom of condit ion.)
the bag”; students may also state that the contents of the bag were“cloudy” or “milky” or that “there was no change” or they may write “None ” .
1 3 1 * 0 - 1 1 pt. for a “Temperature Change” observation: “the bag got warm” * (See addendum for special scoring(Bag 3) or “the bag got hot & cold”; students may also state that the condit ion.)
bag had a “medium temperature,” “normal temperature,” “roomtemperature,” or that the temperature “stayed the same” .
1 3 1 * 0 - 1 1 pt. for a “Color Change” observation: “color changed from pink/red * (See addendum for special scoring(Bag 3) to yellow”; students may also describe color change as: “white,” condition.)
“c r e a m y ,” o r “co lor less . ”
1 3 1 * 0 - 1 1 pt. for “Other Changes Observed”: “a gas formed” and/or * (See addendum for special scoring(Bag 3) “a white precipitate formed”; “Bubbl ing, ” “boil ing,” “foamy, ” condit ion.)
“bag got bigger,” “bag expanded,” “bag exploded,” or “Swiss Cheese”are acceptable to imply that a gas formed. “Creamy mixture” isacceptable for a white precipitate. Students may detect an “odor.”
Scoring Rubric For Task 2—Chemical Reactions—Grade 8 (Page Two)
Page Item # Point Value Scoring Rubric Other Scoring Considerations
1 4 2a 0 - 1 1 pt. for the correct response of “No. ”
1 4 2b 0 - 1 1 pt. for an answer that explains the“Law of Conservation of Matter” and/or the concept of a “Closed System. ” Acceptable responses include: “the amount of matter before the reaction and the amount of matter after the reaction did not change, ” or “nothing was added or taken away fromthe bag, ” or “the bag was sealed and no chemicals could get in or outof the bag.”
1 4 3 a * 0 - 1 1 pt. for the correct identification of “Chemical X and Phenol Red. ” * (See Addendum for special scoring Students may use “red liquid” or “water ” as acceptable reactants condition.)for Phenol Red. “Calcium chloride ” is acceptable for “Chemical X.” {“Draino and water” are not acceptable}
1 4 3b 0 - 1 1 pt. for an answer that explains that “heat can be liberated or produced in some chemical reactions. ”Students may state that “When you mix Chemical X and PhenolRed together, it produced heat .”
1 5 4 a * 0 - 1 1 pt. for the correct identification of “wood. ” * (See addendum regarding incorrectly printed prompt.)
1 5 4 b * 0 - 1 1 pt. for the correct identification of “hard plastic. ” * (See addendum regarding incorrectly printed prompt.)
1 5 4c 0 - 1 1 pt. for an answer that explains that“wood” and “hard plastic” are the best insulators. Acceptable responses include: “Water cooled the least in “wood” or “hardplastic ” or “Less heat escaped from the containers made of“wood” and “hard plastic.”
1 6 5 A 0 - 1 1 pt. for the correct identification that a “gas was produced ”; “Air, ” “carbon dioxide, ” or “oxygen ” are acceptable to imply that a gas was produced.
1 6 5B 0 - 1 1 pt. for an answer that explains thenature of gases—”gas molecules are farther apart”; or “gases expand , exerting equal pressure in all directions ;” or “gases take up morespace than solids or liquids.”
Sample Scoring Rubric
PASS — Sample Assessment Items: Middle School

16© 2007 WestEd
P A S S
The following Standards and Benchmarks are associated with the sample Performance Task beginning on page 12.
National Science Education Standards SI 1.3 – Use appropriate tools and techniques to gather, analyze, and interpret data. The use of tools and
techniques, including mathematics, will be guided by the question asked and the investigations students design. The use of computers for the collection, summary, and display of evidence is part of this standard. Students should be able to access, gather, store, retrieve, and organize data, using hardware and software designed for these purposes.
SI 1.7 – Communicate scientifi c procedures and explanations. With practice, students should become competent at communicating experimental methods, following instructions, describing observations, summarizing results of other groups, and telling other students about investigations and explanations.
PS 1.2 – Substances react chemically in characteristic ways with other substances to form new substances (compounds) with different characteristic properties. In chemical reactions, the total mass is conserved. Substances often are placed in categories or groups if they react in similar ways (e.g., metals).
PS 3.2 – Heat moves in predictable ways, fl owing from warmer objects to cooler ones, until both reach the same temperature.
PS 3.5 – In most chemical and nuclear reactions, energy is transferred into or out of a system. Heat, light, mechanical motion, or electricity might all be involved in such transfers.
Benchmarks for Science Literacy 1B (6–8) 1 – Scientists differ greatly in what phenomena they study and how they go about their work.
Although there is no fi xed set of steps that all scientists follow, scientifi c investigations usually involve the collection of relevant evidence, the use of logical reasoning, and the application of imagination in devising hypotheses and explanations to make sense of the collected evidence.
4D (6–8) 3 – Atoms and molecules are perpetually in motion. Increased temperature means greater aver-age energy of motion, so most substances expand when heated. In solids, the atoms are closely locked in position and can only vibrate. In liquids, the atoms or molecules have higher energy, are more loosely con-nected, and can slide past one another; some molecules may get enough energy to escape into a gas. In gases, the atoms or molecules have still more energy and are free of one another except during occasional collisions.
4D (6–8) 4 – The temperature and acidity of a solution infl uence reaction rates. Many substances dissolve in water, which may greatly facilitate reactions between them.
12D (6–8) 1 – Organize information in simple tables and graphs and identify relationships they reveal.
4E (6–8) 2 – Most of what goes on in the universe—from exploding stars and biological growth to the operation of machines and the motion of people—involves some form of energy being transformed into another. Energy in the form of heat is almost always one of the products of an energy transformation.
PASS — Sample Assessment Items: Middle School

17© 2007 WestEd
P A S S
PASS — Sample Assessment Items: High School
National Science Education Standards SI 2.5 – Scientifi c explanations must adhere to criteria such as: a proposed explanation must be logically
consistent; it must abide by the rules of evidence; it must be open to questions and possible modifi cation; and it must be based on historical and current scientifi c knowledge.
PS 2.5 – Solids, liquids, and gases differ in the distances and angles between molecules or atoms and therefore the energy that binds them together. In solids the structure is nearly rigid; in liquids molecules or atoms move around each other but do not move apart; and in gases molecules or atoms move almost independently of each other and are mostly far apart.
Benchmarks for Science Literacy 1B (9–12) 4 – There are different traditions in science about what is investigated and how, but they all
have in common certain basic beliefs about the value of evidence, logic, and good arguments. And there is agreement that progress in all fi elds of science depends on intelligence, hard work, imagination, and even chance.
4E (9–12) 3 – Transformations of energy usually produce some energy in the form of heat, which spreads around by radiation or conduction into cooler places. Although just as much total energy remains, its be-ing spread out more evenly means less can be done with it.
Sample Enhanced Multiple-choice Question
18© 2007 WestEd
P A S S
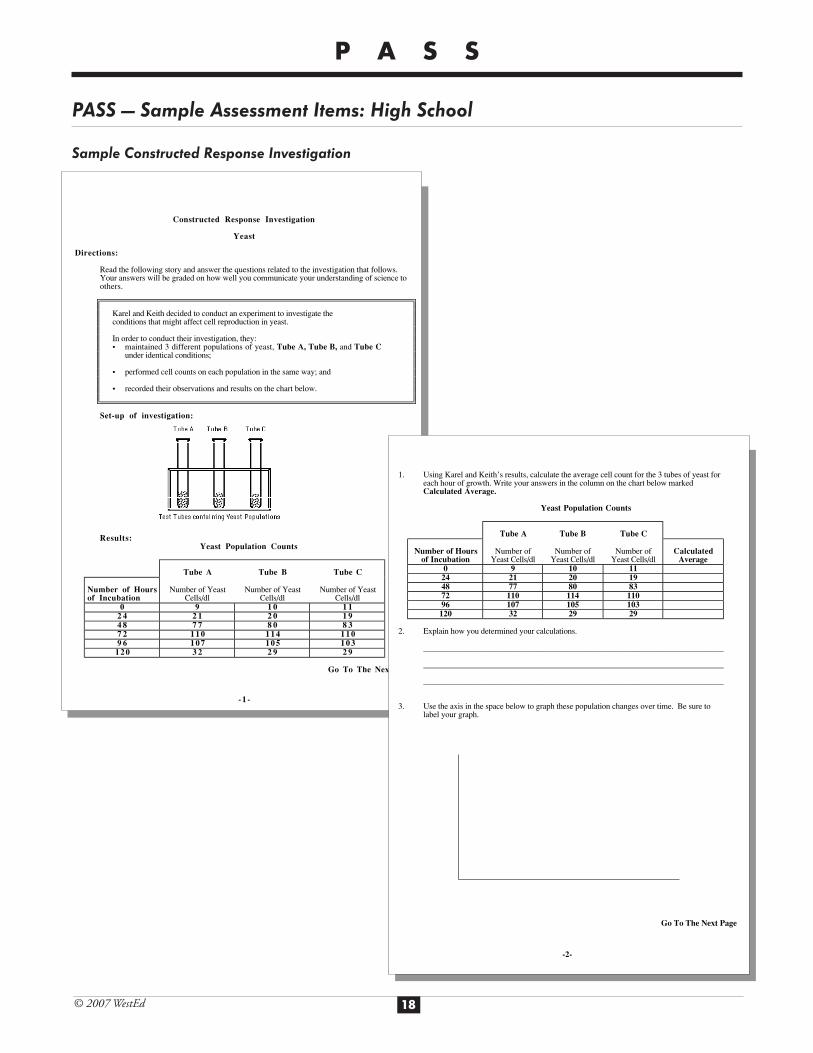
Sample Constructed Response Investigation
PASS — Sample Assessment Items: High School
© 1997 WestEd - California Systemic Initiatives Assessment Collaborative
- 1 -
Constructed Response Investigation
Yeast
Directions:
Read the following story and answer the questions related to the investigation that follows.Your answers will be graded on how well you communicate your understanding of science toothers.
Karel and Keith decided to conduct an experiment to investigate theconditions that might affect cell reproduction in yeast.
In order to conduct their investigation, they:• maintained 3 different populations of yeast, Tube A, Tube B, and Tube C
under identical conditions;
• performed cell counts on each population in the same way; and
• recorded their observations and results on the chart below.
Set-up of investigation:
Results:Yeast Population Counts
Tube A Tube B Tube C
Number of Hoursof Incubation
Number of YeastCells/dl
Number of YeastCells/dl
Number of YeastCells/dl
0 9 1 0 1 12 4 2 1 2 0 1 94 8 7 7 8 0 8 37 2 110 114 1109 6 107 105 103
120 3 2 2 9 2 9
Go To The Next Page
© 1997 WestEd - California Systemic Initiatives Assessment Collaborative
-2-
1. Using Karel and Keith’s results, calculate the average cell count for the 3 tubes of yeast for each hour of growth. Write your answers in the column on the chart below marked Calculated Average.
Yeast Population Counts
Tube A Tube B Tube C
Number of Hoursof Incubation
Number ofYeast Cells/dl
Number ofYeast Cells/dl
Number ofYeast Cells/dl
CalculatedAverage
0 9 10 1124 21 20 1948 77 80 8372 110 114 11096 107 105 103
120 32 29 29
2. Explain how you determined your calculations.
________________________________________________________________________
________________________________________________________________________
________________________________________________________________________
3. Use the axis in the space below to graph these population changes over time. Be sure tolabel your graph.
Go To The Next Page

19© 2007 WestEd
P A S S
Sample Constructed Response Investigation (continued)
PASS — Sample Assessment Items: High School
Sample Scoring Rubric
© 1997 WestEd - California Systemic Initiatives Assessment Collaborative
- 3 -
4. Describe the changes in the average population of yeast over time. What factors may have been affecting the growth?
___________________________________________________________________________
___________________________________________________________________________
___________________________________________________________________________
___________________________________________________________________________
___________________________________________________________________________
5. In the space below, design an experiment that would test the effect of one of the factors listed in your answer to question # 3. Tell which factor your are using. Explain your design. Use the steps of the scientific method to design your experiment.
Stop

20© 2007 WestEd
P A S S
The following Standards and Benchmarks are associated with the sample Constructed Response Investigation beginning on page 18.
National Science Education Standards LS 1.2 – Most cell functions involve chemical reactions. Food molecules taken into cells react to provide
the chemical constituents needed to synthesize other molecules. Both breakdown and synthesis are made possible by a large set of protein catalysts, called enzymes. The breakdown of some of the food molecules enables the cell to store energy in specifi c chemicals that are used to carry out the many functions of the cell.
LS 1.4 – Cell functions are regulated. Regulation occurs both through changes in the activity of the functions performed by proteins and through the selective expression of individual genes. This regulation allows cells to respond to their environment and to control and coordinate cell growth and division.
LS 4.4 – Living organisms have the capacity to produce populations of infi nite size, but environments and resources are fi nite. This fundamental tension has profound effects on the interactions between organ-isms.
SI 1.2 – Design and conduct scientifi c investigations. Designing and conducting a scientifi c investiga-tion requires introduction to the major concepts in the area being investigated, proper equipment, safety precautions, assistance with methodological problems, recommendations for use of technologies, clarifi ca-tion of ideas that guide the inquiry, and scientifi c knowledge obtained from sources other than the actual investigation. The investigation may also require student clarifi cation of the question, method, controls, and variables; student organization and display of data; student revision of methods and explanations; and a public presentation of the results with a critical response from peers. Regardless of the scientifi c investi-gation performed, students must use evidence, apply logic, and construct an argument for their proposed solutions.
SI 1.6 – Communicate and defend a scientifi c argument. Students in school science programs should develop the abilities associated with accurate and effective communication. These include writing and following procedures, expressing concepts, reviewing information, summarizing data, using language ap-propriately, developing diagrams and charts, explaining statistical analysis, speaking clearly and logically, constructing a reasoned argument, and responding appropriately to critical comments.
SI 2.4 – Mathematics is essential in scientifi c inquiry. Mathematical tools and models guide and improve the posing of questions, gathering data, constructing explanations and communicating results.
SI 2.5 – Scientifi c explanations must adhere to criteria such as: a proposed explanation must be logically consistent; it must abide by the rules of evidence; it must be open to questions and possible modifi cation; and it must be based on historical and current scientifi c knowledge.
PASS — Sample Assessment Items: High School

21© 2007 WestEd
P A S S
Benchmarks for Science Literacy 12D (6–8) 2 – Read simple tables and graphs produced by others and describe in words what they show.
4E (9–12) 3 – Transformations of energy usually produce some energy in the form of heat, which spreads around by radiation or conduction into cooler places. Although just as much total energy remains, its be-ing spread out more evenly means less can be done with it.
9B (9–12) 4 – Tables, graphs, and symbols are alternative ways of representing data and relationships that can be translated from one to another.
5C (9–12) 2 – Within the cell are specialized parts for the transport of materials, energy capture and release, protein building, waste disposal, information feedback, and even movement. In addition to these basic cellular functions common to all cells, most cells in multicellular organisms perform some special functions that others do not.
5C (9–12) 5 – Complex interactions among the different kinds of molecules in the cell cause distinct cycles of activities, such as growth and division. Cell behavior can also be affected by molecules from other parts of the organism or even other organisms.
5C (9–12) 7 – Most cells function best within a narrow range of temperature and acidity. At very low temperatures, reaction rates are too slow. High temperatures and/or extremes of acidity can irreversibly change the structure of most protein molecules. Even small changes in acidity can alter the molecules and how they interact. Both single cells and multicellular organisms have molecules that help to keep the cell’s acidity within a narrow range.
PASS — Sample Assessment Items: High School

22© 2007 WestEd
P A S S
Assessment Components
School >20 Students Tes ted:
School <21 Students Tes ted:
Number of Students Tes ted:
Average Percent Correct:
Results for Fifth Grade
Confidence Interval
± 1.26%
± 4.92%
59
50%
526
54%
7,568
57%
School DIST/SI PASS
Ear th Science Multiple-Choice
School >20 Students Tes ted:
School <21 Students Tes ted:
Number of Students Tes ted:
Average Percent Correct:± 1.71%
± 5.54%
59
51%
526
61%
7,568
65%
Lif e Science Multiple-Choice
School >20 Students Tes ted:
School <21 Students Tes ted:
Number of Students Tes ted:
Average Percent Correct:± 1.71%
± 5.76%
59
55%
526
57%
7,568
61%
Physical Science Multiple-Choice
School >20 Students Tes ted:School <21 Students Tes ted:
Number of Students Tes ted:Average Percent Correct:
± 1.44%
± 4.85%
59
48%
526
53%
7,568
57%
Science Inquiry Multiple-Choice
School >20 Students Tes ted:
School <21 Students Tes ted:
Number of Students Tes ted:
Average Percent Correct:
± 1.60%
± 6.89%
59
48%
526
56%
7,568
61%
Science and Tec hnology Multiple-Choice
Partnership for Assessment of Standards-based ScienceScience Assessment 2004PASSPASS
Distr ict: School:
D–S Code: Grade: 5th Number of Students: 59
KEYNot Applicable
Not AvailableBased on anchor populationcombined for 199 7 and 1998
2002 2003 2004School Scale Score: 390 N/A 481District Scale Score: 500PASS Scale Score: 500 509
N/A
School >20 Students Tes ted:
School <21 Students Tes ted:
Number of Students Tes ted:
Average Percent Correct:± 1.49%
± 5.15%
59
50%
526
56%
7,568
61%
Enhanced Multiple-Choice
School >20 Students Tes ted:
School <21 Students Tes ted:
Number of Students Tes ted:
Average Percent Correct:± 1.93%± 5.98%
2940%
24448%
3,55452%
Open-Ended Ques tion 1 — Snails & Magnets
School >20 Students Tes ted:
School <21 Students Tes ted:
Number of Students Tes ted:
Average Percent Correct:
± 1.24%
± 3.66%
27
27%
240
31%
3,536
34%
Open-Ended Ques tion 2 — Musical/Plants
School >20 Students Tes ted:
School <21 Students Tes ted:
Number of Students Tes ted:
Average Percent Correct:± 1.88%
± 3.37%
59
55%
514
57%
7,407
58%
Performance Task — Light and Shadows
XVI. PASS — Sample Report
This section provides a sample of PASS reports at the elementary level. Reports for middle and high school assessments are similar in format and content.