part i introduction part ii firms, trade, and location part iii capital, currency, and crises part...
TRANSCRIPT
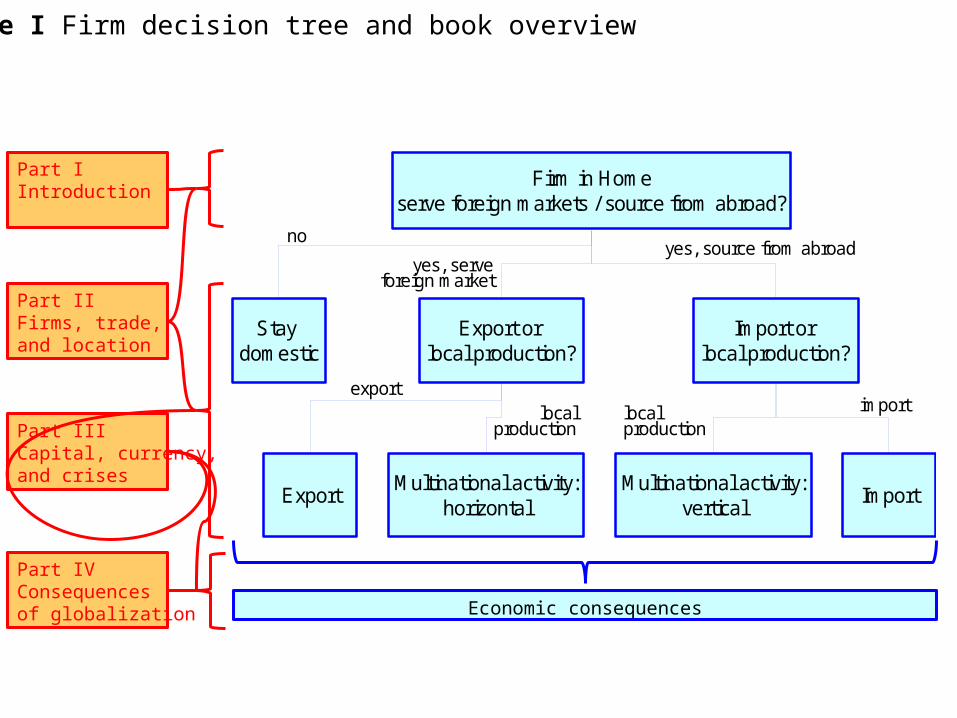
Firm in Homeserve foreign markets / source from abroad?
Stay domestic
Export
Export or local production?
Import or local production?
ImportMultinational activity:
horizontalMultinational activity:
vertical
no
yes, serve foreign market
yes, source from abroad
exportlocal
productionimportlocal
production
Part I Introduction
Part IIFirms, trade, and location
Part IIICapital, currency,and crises
Part IV Consequences of globalization Economic consequences
Figure I Firm decision tree and book overview
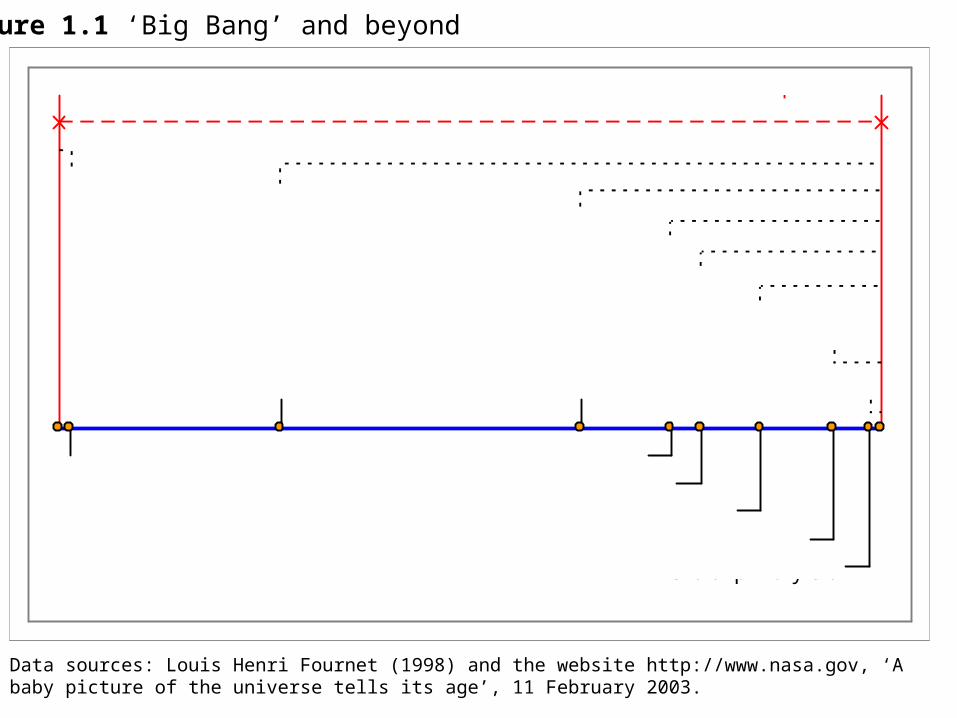
Data sources: Louis Henri Fournet (1998) and the website http://www.nasa.gov, ‘A baby picture of the universe tells its age’, 11 February 2003.
big bang
first stars
beginning of our galaxy beginning of our solar system
beginning of the geologic erasoldest know n fossil
beginning of photosynthesisend of precambrian era
end of primary era
present time13.7 billion years
10 billion years
200 million years
200 million years
800 million years
5 billion years3.5 billion years
3 billion years
2 billion years
Figure 1.1 ‘Big Bang’ and beyond
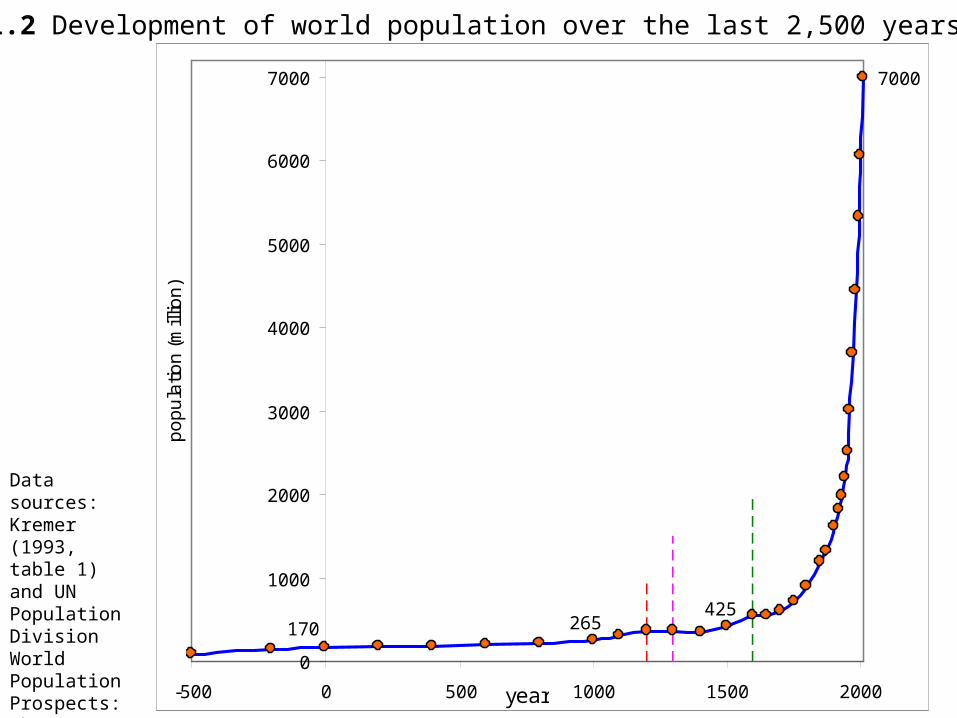
Figure 1.2 Development of world population over the last 2,500 years
170 265425
7000
0
1000
2000
3000
4000
5000
6000
7000
-500 0 500 1000 1500 2000year
po
pu
latio
n (
mill
ion
)
Mongol invasions
Black death
30 years war, Ming collapse
Data sources: Kremer (1993, table 1) and UN Population Division World Population Prospects: The 2010 Revision.
0
2
4
6
8
10
1900 1940 1980 2020 2060 2100year
wor
ld p
opul
atio
n (b
illio
n)
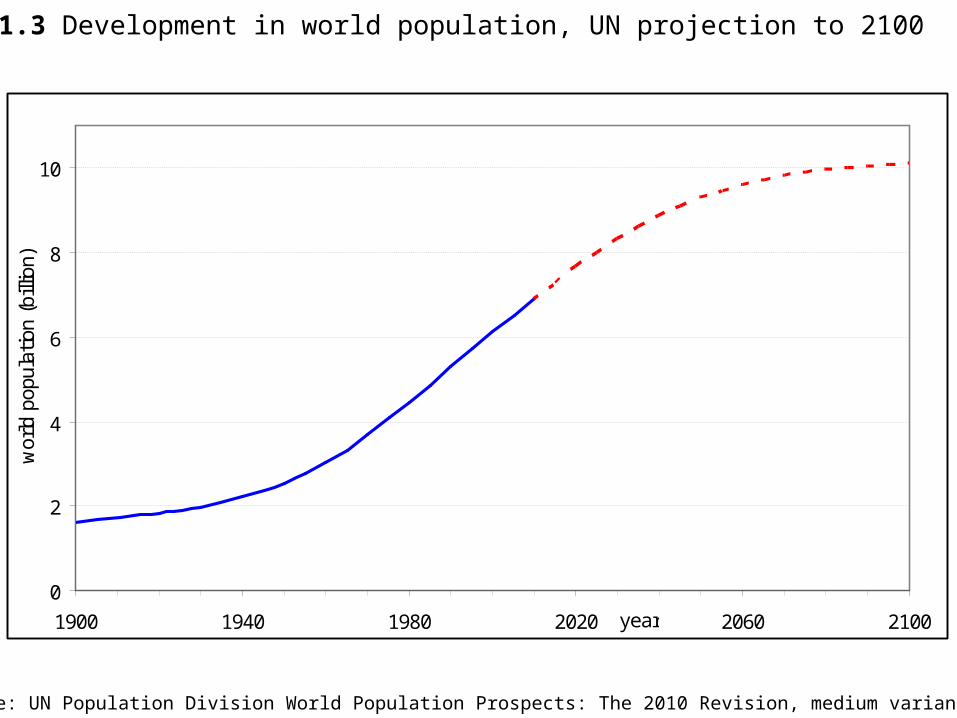
Figure 1.3 Development in world population, UN projection to 2100
Data source: UN Population Division World Population Prospects: The 2010 Revision, medium variant
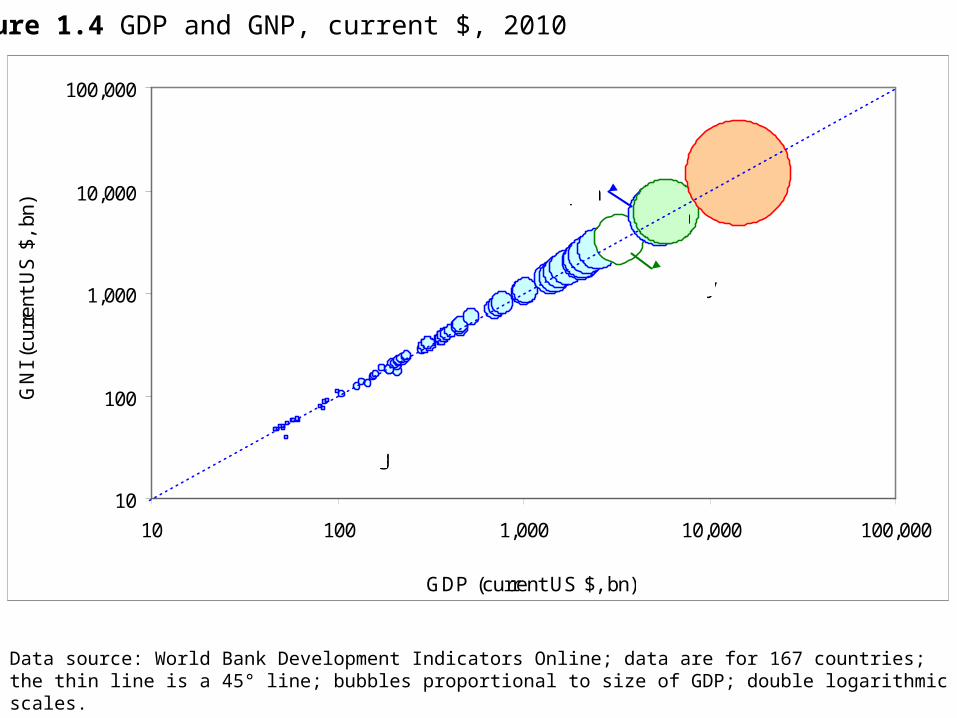
Figure 1.4 GDP and GNP, current $, 2010
10
100
1,000
10,000
100,000
10 100 1,000 10,000 100,000
GDP (current US $, bn)
GN
I (c
urre
nt U
S $
, bn
)
USA
China
Germany
Japan
Luxembourg
Data source: World Bank Development Indicators Online; data are for 167 countries; the thin line is a 45° line; bubbles proportional to size of GDP; double logarithmic scales.
100
1,000
10,000
100,000
100 1,000 10,000 100,000current US $
PP
P in
tern
atio
nal $
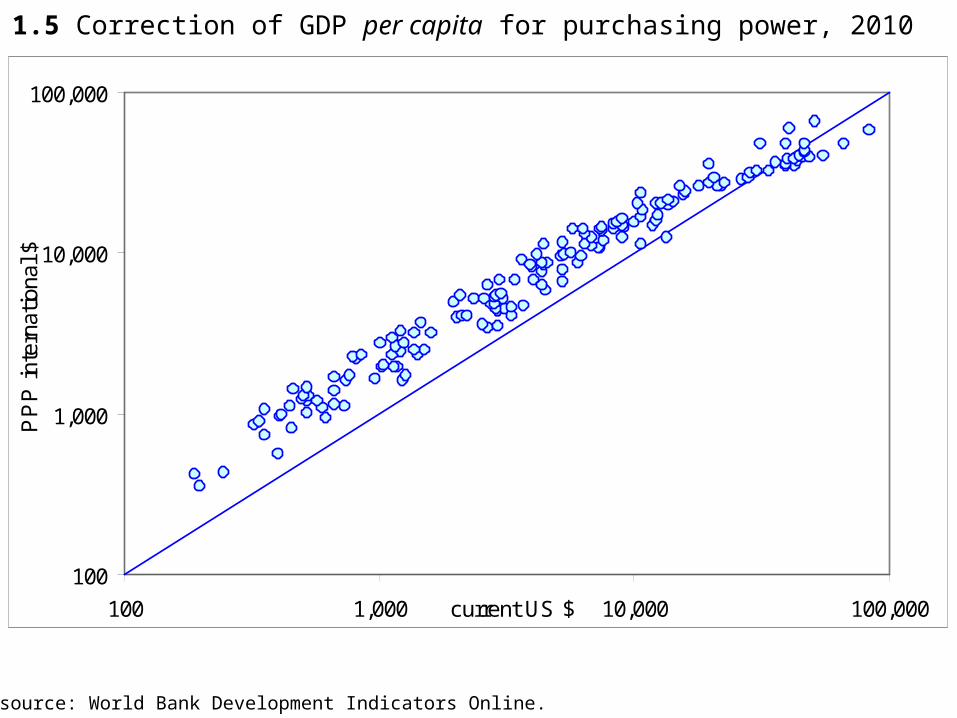
Figure 1.5 Correction of GDP per capita for purchasing power, 2010
Data source: World Bank Development Indicators Online.
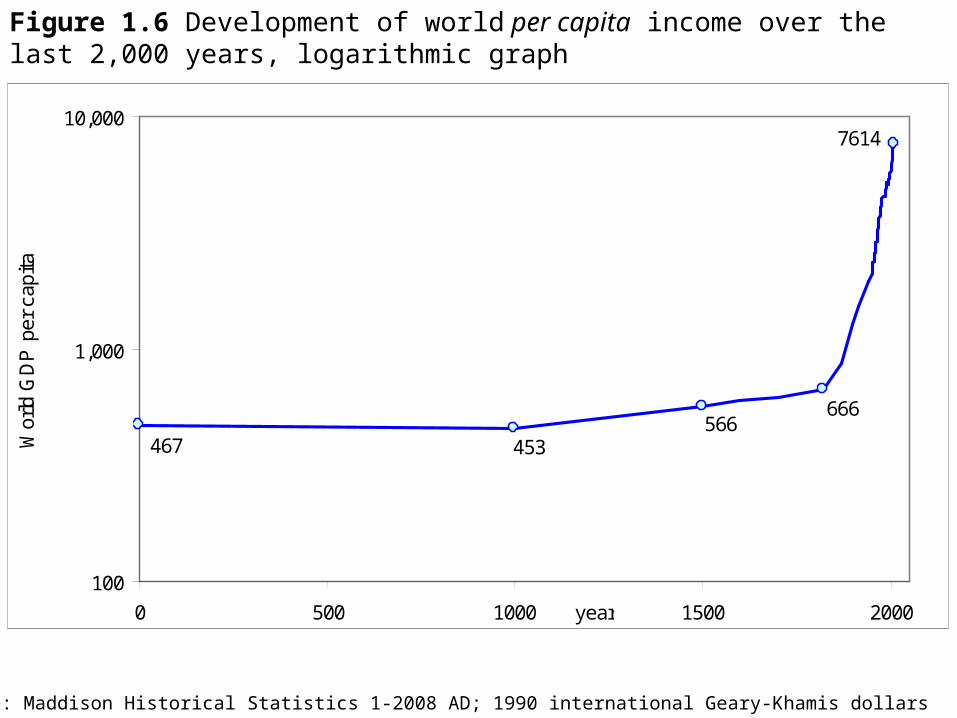
467 453566
666
7614
100
1,000
10,000
0 500 1000 1500 2000year
Wor
ld G
DP
per
cap
itaFigure 1.6 Development of world per capita income over the last 2,000 years, logarithmic graph
Data source: Maddison Historical Statistics 1-2008 AD; 1990 international Geary-Khamis dollars
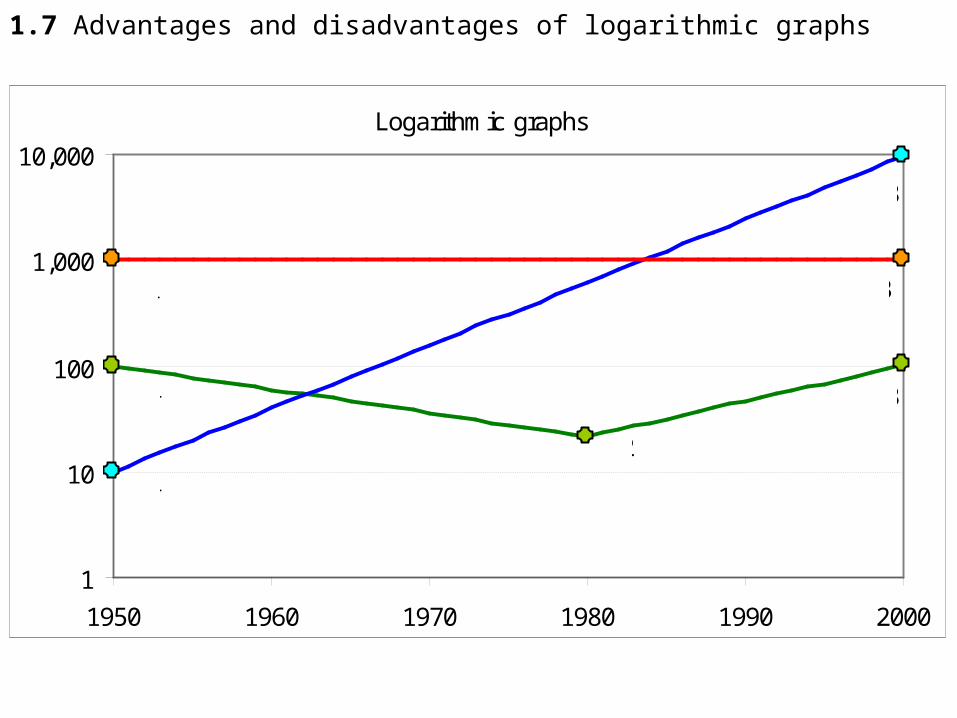
Logarithmic graphs
1
10
100
1,000
10,000
1950 1960 1970 1980 1990 2000
A1
A3
B1
B2
B3
C1 C3
Figure 1.7 Advantages and disadvantages of logarithmic graphs
400
200
-400
-200
1 1000 15001600 1700 1800 1900 2000
% above world average(world = 100)
% below world average (country = 100)
ItalyIranIraq
Italy
UKNetherlands
Switzerland
USAAustralia
Many Many
Western
Offshoots
Australia
New
Zealand
New
Zealand
Western
Offshoots
Other
Africa
China
India
Iraq
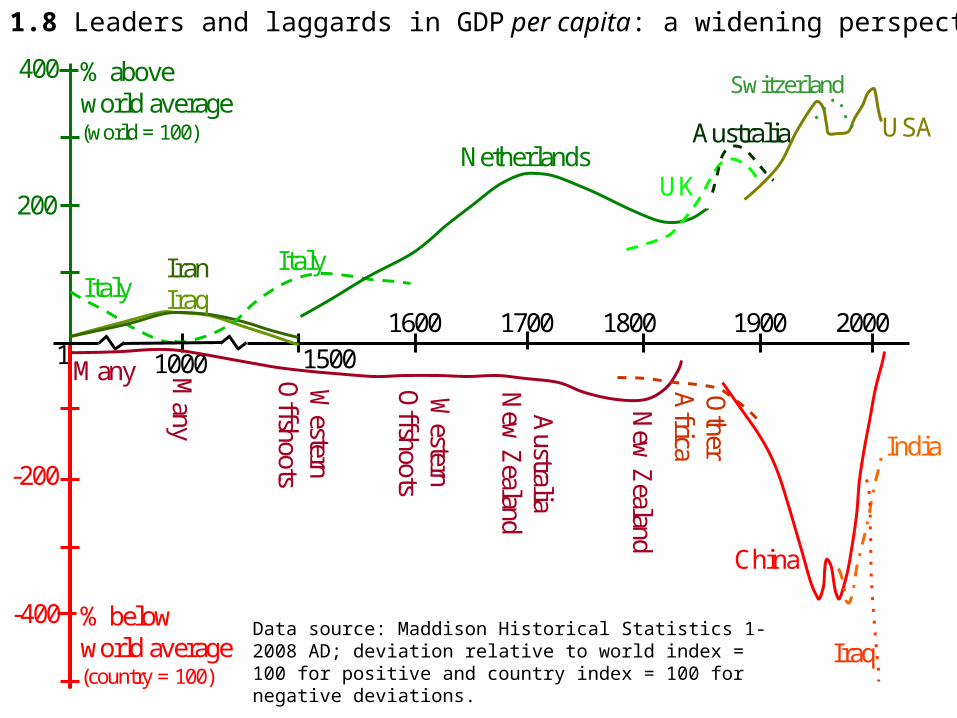
Figure 1.8 Leaders and laggards in GDP per capita: a widening perspective
Data source: Maddison Historical Statistics 1-2008 AD; deviation relative to world index = 100 for positive and country index = 100 for negative deviations.
Carrying capacity of merchant fleets, 1470-1780
0
200,000
400,000
600,000
800,000
1,000,000
1470 1570 1670 1780
Netherlands Germany Britain France Italy, Portugal, Spain
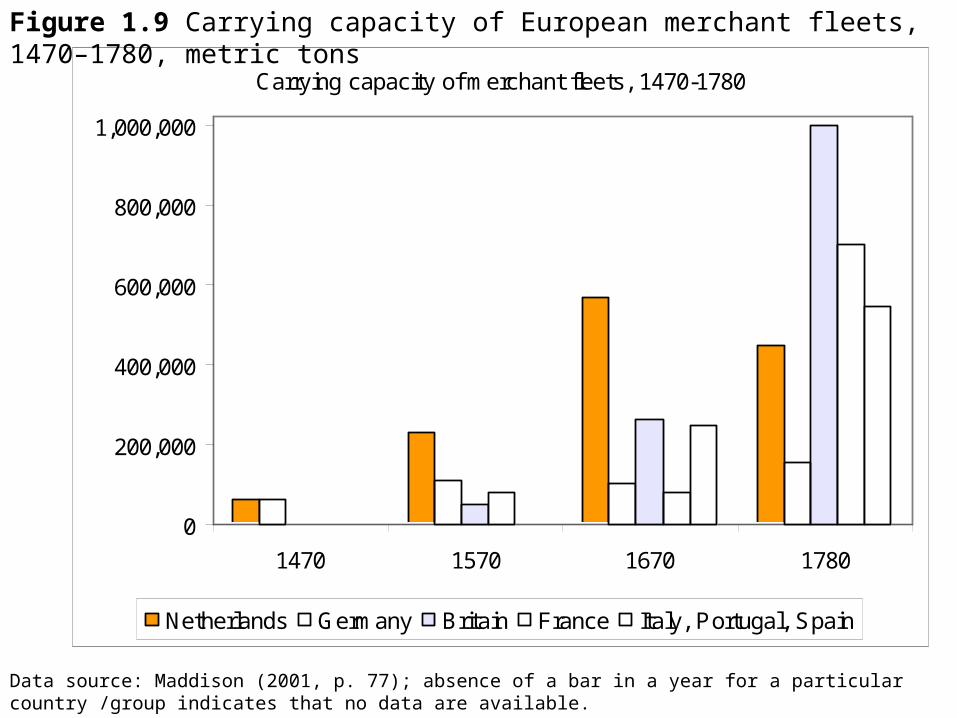
Figure 1.9 Carrying capacity of European merchant fleets, 1470–1780, metric tons
Data source: Maddison (2001, p. 77); absence of a bar in a year for a particular country /group indicates that no data are available.
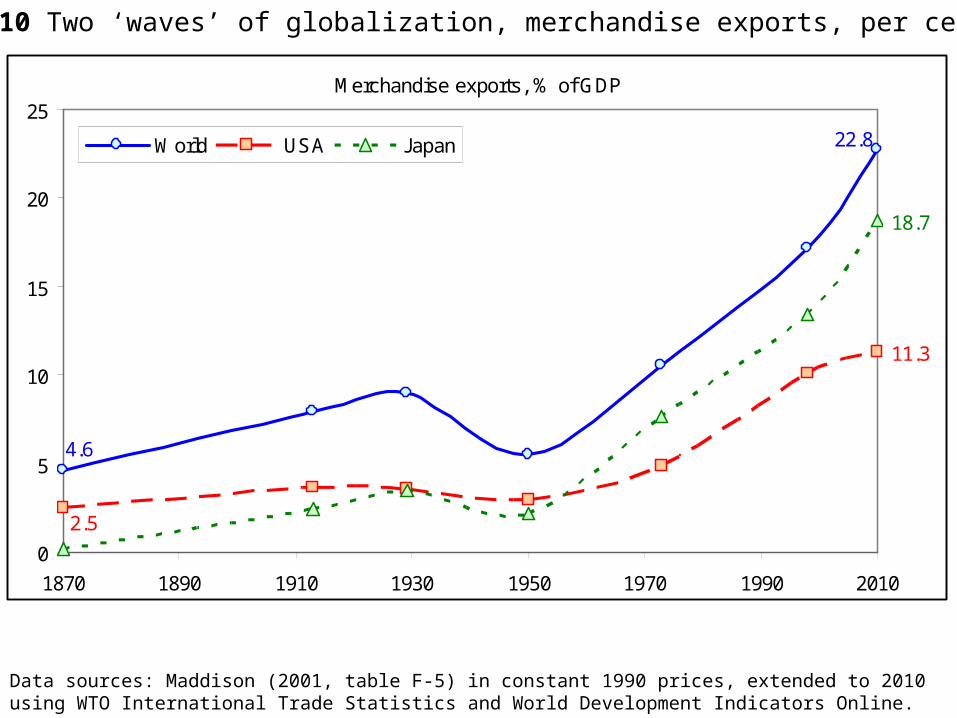
Figure 1.10 Two ‘waves’ of globalization, merchandise exports, per cent of GDP
Merchandise exports, % of GDP
4.6
22.8
2.5
11.3
18.7
0
5
10
15
20
25
1870 1890 1910 1930 1950 1970 1990 2010
World USA Japan
Data sources: Maddison (2001, table F-5) in constant 1990 prices, extended to 2010 using WTO International Trade Statistics and World Development Indicators Online.
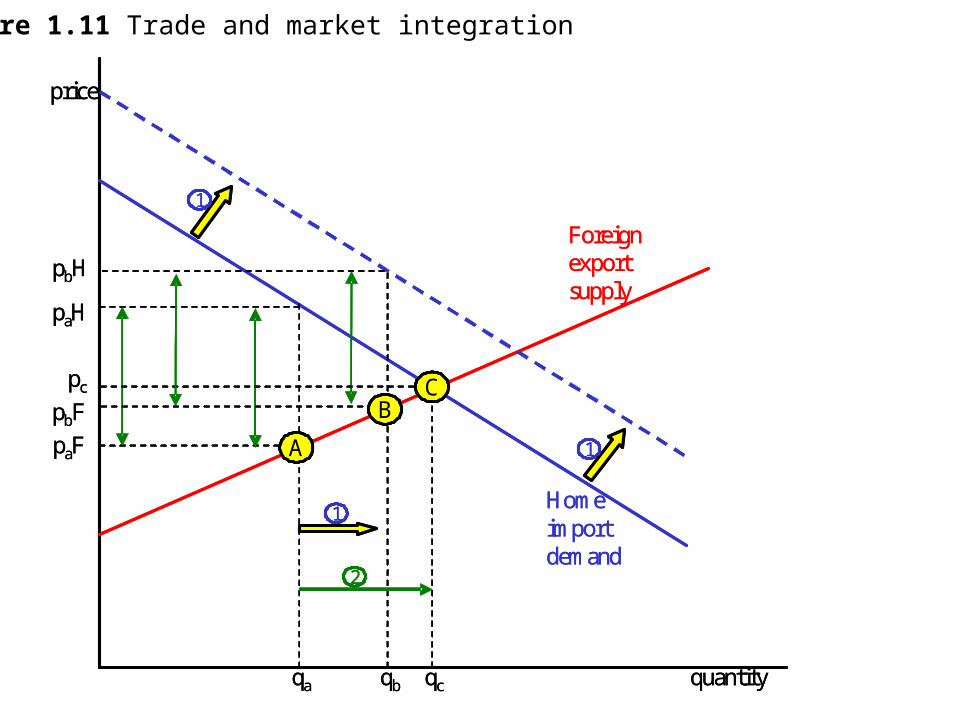
Figure 1.11 Trade and market integration
price
quantity
A
Home import demand
Foreign export supply
BC
1
1
1
2
paF
pbH
paH
pbF
pc
qa qb qc
price
quantity
A
Home import demand
Foreign export supply
BC
1
1
1
2
paF
pbH
paH
pbF
pc
qa qb qc
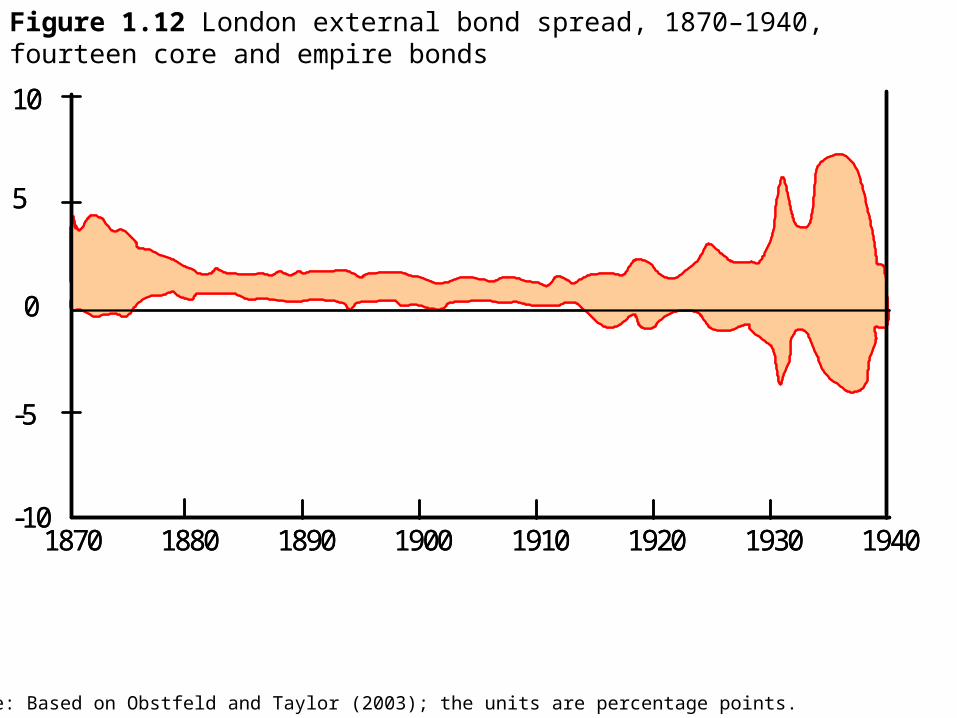
Figure 1.12 London external bond spread, 1870–1940, fourteen core and empire bonds
1870 1910 1920 1930 19401890 19001880-10
-5
0
5
10
1870 1910 1920 1930 19401890 19001880-10
-5
0
5
10
Source: Based on Obstfeld and Taylor (2003); the units are percentage points.
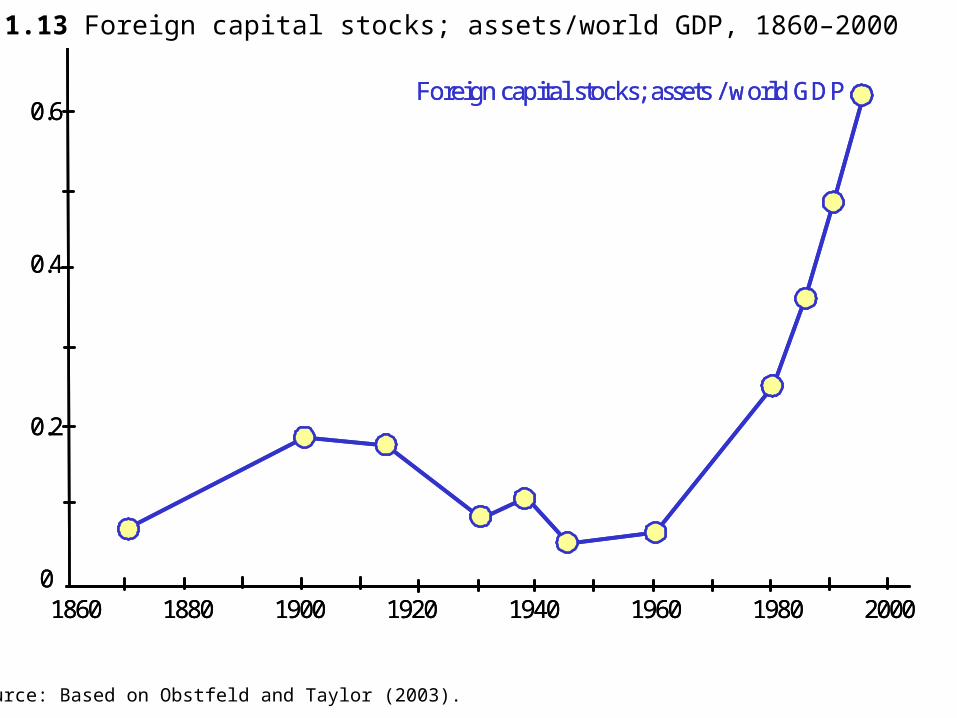
Figure 1.13 Foreign capital stocks; assets/world GDP, 1860–2000
0.6
0.4
0.2
01860 1880 1900 19601920 1940 1980 2000
Foreign capital stocks; assets / world GDP0.6
0.4
0.2
01860 1880 1900 19601920 1940 1980 2000
Foreign capital stocks; assets / world GDP
Source: Based on Obstfeld and Taylor (2003).
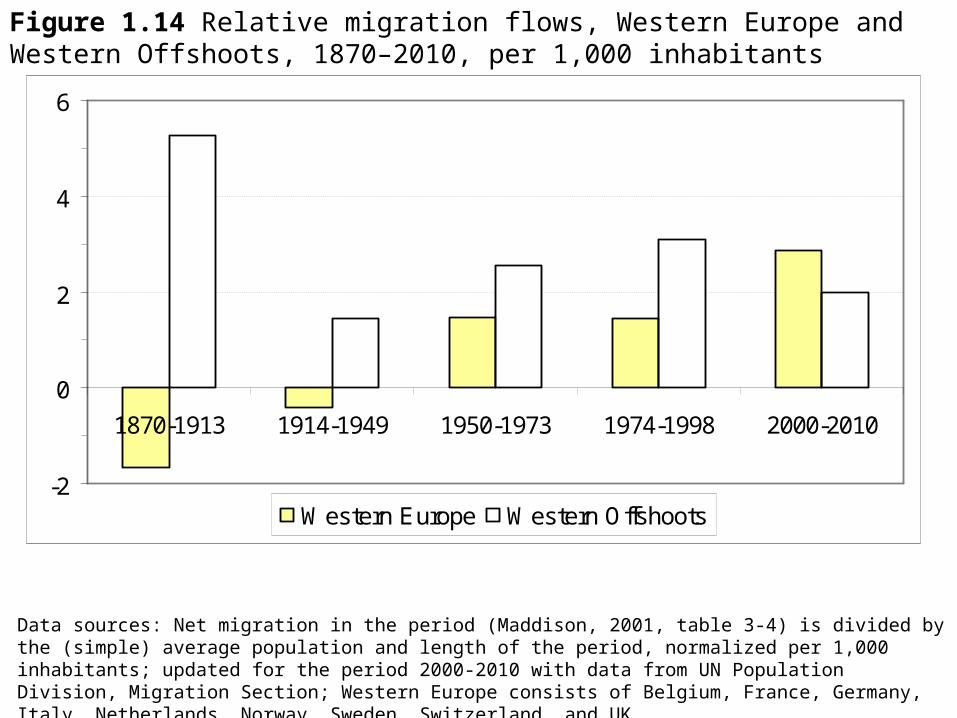
Figure 1.14 Relative migration flows, Western Europe and Western Offshoots, 1870–2010, per 1,000 inhabitants
-2
0
2
4
6
1870-1913 1914-1949 1950-1973 1974-1998 2000-2010
Western Europe Western Offshoots
Data sources: Net migration in the period (Maddison, 2001, table 3-4) is divided by the (simple) average population and length of the period, normalized per 1,000 inhabitants; updated for the period 2000-2010 with data from UN Population Division, Migration Section; Western Europe consists of Belgium, France, Germany, Italy, Netherlands, Norway, Sweden, Switzerland, and UK.
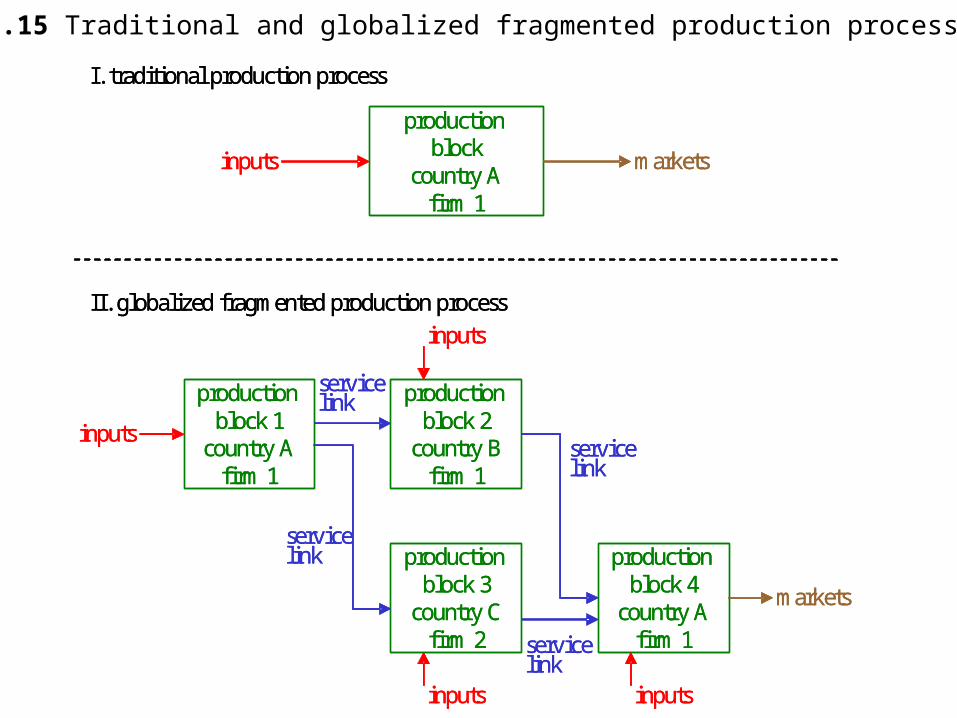
Figure 1.15 Traditional and globalized fragmented production processes
production block
country Afirm 1
inputs markets
production block 1
country Afirm 1
inputs
markets
production block 4
country Afirm 1
production block 3
country Cfirm 2
production block 2
country Bfirm 1
inputsinputs
inputs
I. traditional production process
II. globalized fragmented production process
service link
service link
service link
service link
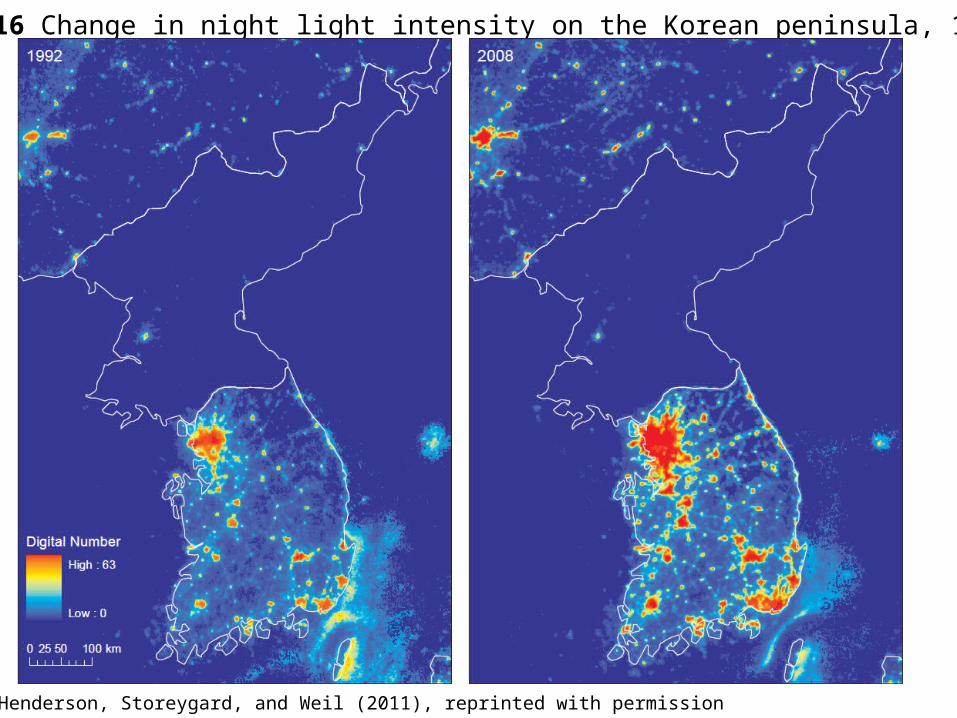
Figure 1.16 Change in night light intensity on the Korean peninsula, 1992-2008
Source: Henderson, Storeygard, and Weil (2011), reprinted with permission