parenting style and first year students’ adjustment …
TRANSCRIPT
PARENTING STYLE AND FIRST YEAR STUDENTS’ ADJUSTMENT AT UNIVERSITY:
MEDIATION VIA TRAIT EMOTIONAL INTELLIGENCE IN HIGHER EDUCATION
INSTITUTIONS- A DIMENSIONAL AND TYPOLOGICAL APPROACH
By
TAREKEGN DESALEGN FENTA
Submitted in accordance with the requirements
for the Degree of
DOCTOR OF PHILOSOPHY
in the subject
PSYCHOLOGY
at the
UNIVERSITY OF SOUTH AFRICA
PROMOTER: PROF. PETRO VAN DER MERWE
APRIL 2018
i
ABSTRACT
The primary purpose of this study was to examine the potential mediating effect of TEI on the
relationship between parenting style/dimension and first year students’ university adjustment in higher
education institutions of Ethiopia. The study sought to test a model where parental responsiveness,
parental demandingness and the TEI interactively and individually, relate to adjustment. A total of 464
first year university students from three public universities participated in this study. The results of
preliminary analyses pertaining to the predominantly practiced parenting style in the families of
Ethiopia revealed that if gender is ignored, the most common parenting style is the neglectful style
followed very closely by the authoritative style. However, parenting styles varied as a function of
students’ gender. A statistically significant TEI score difference was found among the four parenting
style categories. Results also revealed that a statistically significant difference on adjustment mean
score was found among the four parenting style categories. The t-test result revealed that there was a
statistically significant difference between male and female first year university students with regard to
TEI score but there was no a statistically significant difference between male and female first year
university students with respect to the adjustment score. The path analysis result also revealed that
parental dimensions (responsiveness and demandingness) and TEI had a statistically significant and
positive direct effect on adjustment. The multiple regression result showed that TEI, parental
responsiveness and parental demandingness interactively explained 31.9 percent of the variance on
adjustment. Finally, the mediation analysis results revealed that TEI plays a meditation role, but only
partially, in the parental demandingness and adjustment relationship, and in the parental
responsiveness and adjustment relationship, which potentially confirms that the adjustment scale can
explain the relationship between the demandingness and responsiveness dimension-variables of
parenting style and TEI. Based on the results of the present study, some practical, theoretical and
methodological implications of the study for designing interventions to maximize students’ adjustment
in higher education institutions are addressed. Moreover, recommendations, limitations and future
directions are addressed for researchers to take lesson in undertaking this or similar types of research
in the future.
Key Words: Adjustment, Demandingness, Parenting style, Responsiveness, TEI
ii
DECLARATION
I declare that Parenting Style and First Year Students’ Adjustment at University: Mediation
via Trait Emotional Intelligence in Higher Education Institutions– A Dimensional and
Typological Approach is my own work and that all the sources that I have used have been
indicated and acknowledged by means of complete references. In addition, I hereby declare that
this work has not been submitted to any other degree at this University or any other institution of
higher learning so far.
Signature
TAREKEGNDESALEGNFENTA APRIL 2018

iii
ACKNOWLEDGEMENTS
Words cannot in fact fully express my gratitude to my Promoter, Professor Petro Van Der Merwe.
I would first like to thank you for offering your precious time, providing me with amazing support
and encouragement and continuously guiding this work through all its steps in this long and tough
process. I consider having had the opportunity to work with you as a privilege. Your contribution
to this work and to my personal growth was invaluable. Thank you so much for your input,
suggestions, feedback, and guidance, but above all for encouraging my passion in completing this
research project.
I would like to express my appreciation to my wife, Mrs. Meseret Bizualew, for your endless
support, encouragement, and patience through it all; your support made the accomplishment of
this work possible. And it is dedicated to my lovely child, Mahider Tarekegn, for all those hard
times I could not care for you as intended in the effort to complete this research. I am indeed
grateful to my brother, Mr. Daniel Desalegn, who always wishes for and dreams for my success in
life.
Last, but not least, my appreciation and many thanks go to Addis Ababa University, Debre
Berhan University and Adama Science and Technology University, for permitting me to conduct
the research and rendering unconditional support during data collection as well as the students in
those universities, for your cooperation and interest in participating in the study.
iv
SUMMARY
PARENTING STYLE AND FIRST YEAR STUDENTS’ ADJUSTMENT AT
UNIVERSITY: MEDIATION VIA TRAIT EMOTIONAL INTELLIGENCE IN HIGHER
EDUCATION INSTITUTIONS– A DIMENSIONAL AND TYPOLOGICAL APPROACH
The present study sought to test a model where parental responsiveness, parental demandingness,
and TEI, interactively and individually, relate to adjustment. The literature revealed that attending
to university for the first time is a significant transition accompanied with challenges and
difficulties for students, thereby, the problems’ students’ faced at the initial stage have to be
addressed accordingly. For instance, an early EI programme for the first year students’ help them
to adjust their transition successfully. EI, that the ability to recognise, understand, use, and
manage emotions contributes to adaptation at various realms of life, including adjustment at
university. It is when students actually perceive their emotional abilities, skills, personality and
behavioural characteristics that they can cope with the environmental demands and pressures that
exist in the university context.
From the literature, the investigator came to note that TEI as a learned behaviour is influenced by
the social context in which an individual grows up, in particular. TEI is believed to be more
sensitive to parental behaviours. Parenting style has both positive and negative outcomes for
children’s overall development and is influenced by the culture. Therefore, there is a need to
critically question the parenting-style paradigm, thereby; the limitations that existed in the earlier
literatures were managed in this thesis.
The proposed model was tested and the research questions of the study were examined based on
the data obtained from 464 (Male=282 & Female=182) first year university students recruited via
a stratified random sampling technique selected from 3 public universities in Ethiopia. In this
study, questionnaires that have been used in other studies were employed for data collection.
Piloting was undertaken on the main data collection instruments: the TEIQue, the SACQ, and the
PDQ.
v
Whether the model fits the empirical data was tested using path analysis and mediation analysis.
In addition, critical evaluation was undertaken on the limitations of the study. Based on the
findings of this thesis, interventions for future practice should include more the incorporation of
parenting practices, university officials, teachers, and students’ guidance and counsellor in the
effort to beef up the adjustment level of first year university students.
Key Words: Adjustment, EI, EI program, Learned behaviour, Model, Parenting behaviour,
Parental demandingness, PDQ, Parental responsiveness, Parenting style, SACQ, TEI, TEIQue.
vi
TABLE OF CONTENTS
ABSTRACT…………………………………………………………………………………………..i
DECLARATION ................................................................................................................................. ii
ACKNOWLEDGEMENTS ................................................................................................................ iii
SUMMARY ......................................................................................................................................... v
TABLE OF CONTENTS .................................................................................................................... vi
LIST OF TABLES .............................................................................................................................. xi
LIST OF FIGURES .......................................................................................................................... xiv
LIST OF ADDENDUMS .................................................................................................................. xv
LIST OF ABBREVIATIONS ........................................................................................................... xvi
CHAPTER ONE: STATEMENT OF PROBLEM, AIM AND SCOPE OF THE STUDY
1.1 BACKGROUND AND MOTIVATION ............................................................................... 1
1.1.1 Academic, social, personal-emotional, and institutional attachment adjustments ................ 3
1.1.2 EI as a tool for adjustment ..................................................................................................... 4
1.1.3 Correlations between AIE and TEI ........................................................................................ 5
1.1.4 TEI as a learned behaviour .................................................................................................... 6
1.1.5 Parenting style ....................................................................................................................... 6
1.1.6 Parenting style as a tool for college adjustment .................................................................... 7
1.2 PROBLEM STATEMENT .................................................................................................... 8
1.3 AIM OF THE STUDY ........................................................................................................ 11
1.3.1 Conceptual framework ......................................................................................................... 12
1.3.2 Research questions ............................................................................................................... 14
1.3.3 Research objective ............................................................................................................... 15
1.3.3.1 General objective ................................................................................................................ 15
1.3.3.2 Specific objectives ............................................................................................................... 15
1.4 OPERATIONAL DEFINITION OF TERMS ..................................................................... 16
1.5 SIGNIFICANCE OF THE RESEARCH ............................................................................. 17
1.6 ASSUMPTIONS AND SCOPE OF THE RESEARCH ...................................................... 18
vii
1.6.1 Assumptions of the research ................................................................................................ 18
1.6.2 Scope of the research .......................................................................................................... 19
1.7 CHAPTER DIVISION ........................................................................................................ 19
CHAPTER TWO: REVIEW OF RELATED LITERATURE
2.1 ADJUSTMENT ................................................................................................................... 21
2.1.1 Concept of adjustment ......................................................................................................... 21
2.1.2 Adjustment model in the context of life at university ......................................................... 22
2.1.3 Empirical results on adjustment to university life ............................................................... 22
2.1.4 Perceived social support and students’ adjustment at university ......................................... 24
2.2 NOTIONS ABOUT EI ........................................................................................................ 25
2.2.1 History and background of EI.............................................................................................. 25
2.2.2 Definition of EI .................................................................................................................... 26
2.2.3 EI theories ............................................................................................................................ 27
2.2.4 TEI: Conceptualisation and empirical studies ..................................................................... 28
2.3 PARENTING STYLE ......................................................................................................... 29
2.3.1 Conceptualisation of parenting style ................................................................................... 29
2.3.2 The role of culture in shaping parenting style ..................................................................... 31
2.3.3 Reasons to question the parenting style paradigm ............................................................... 33
2.4 RELATIONSHIP BETWEEN MAJOR STUDY VARIABLES ........................................ 35
2.4.1 Parenting style and TEI ....................................................................................................... 35
2.4.2 Parenting style and students’ university adjustment ............................................................ 36
2.4.3 Adjustment to university and TEI ........................................................................................ 38
2.5 THE RELATIONSHIP BETWEEN GENDER AND MAJOR STUDY VARIABLES ..... 40
2.5.1 Gender and TEI .................................................................................................................... 40
2.5.2 Gender and students’ adjustment at university .................................................................... 41
2.6 CONCLUSION.................................................................................................................... 43
viii
CHAPTER THREE: RESEARCH METHODOLOGY
3.1 RESEARCH DESIGN ......................................................................................................... 45
3.2 POPULATION .................................................................................................................... 46
3.3 SAMPLE AND SAMPLING METHODS .......................................................................... 47
3.4 DATA COLLECTION INSTRUMENTS ........................................................................... 52
3.4.1 Demographic data ................................................................................................................ 55
3.4.2 The TEIQue ......................................................................................................................... 55
3.4.3 The PDQ .............................................................................................................................. 57
3.4. 4 The SACQ ........................................................................................................................... 61
3.5 ETHICAL CONSIDERATIONS......................................................................................... 62
3.6 DATA COLLECTION PROCEDURE ............................................................................... 63
3.6.1 Pilot testing .......................................................................................................................... 63
3.6.2 Main data collection ............................................................................................................ 68
3.7 METHODS OF DATA ANALYSIS AND STATISTICAL PROCEDURES .................... 69
3.8 CONCLUSION.................................................................................................................... 71
CHAPTER FOUR: RESULTS OF THE STUDY
4.1 DEMOGRAPHICS OF THE STUDY SAMPLE ................................................................ 73
4.2 RESULTS OF THE PRELIMINARY ANALYSIS ............................................................ 76
4.2.1 Verification of the internal consistency reliability of the adjustment-TEI-and Parental
dimension constructs ........................................................................................................... 76
4.2.2 Parenting styles in the Ethiopian cultural context ............................................................... 79
4.2.3 Differences in TEI and adjustment to university by parenting styles .................................. 81
4.2.4 Differences in TEI and adjustment by gender of the participants ....................................... 87
4.2.5 Correlation between variables to be included in path analysis model ................................. 92
4.3 VARIABLES TO BE INCLUDED IN A PATH ANALYSIS AND THE CORRELATION
BETWEEN THESE VARIABLES ..................................................................................... 93
4.3.1 Decision on variables to be entered into a path analysis ..................................................... 94
ix
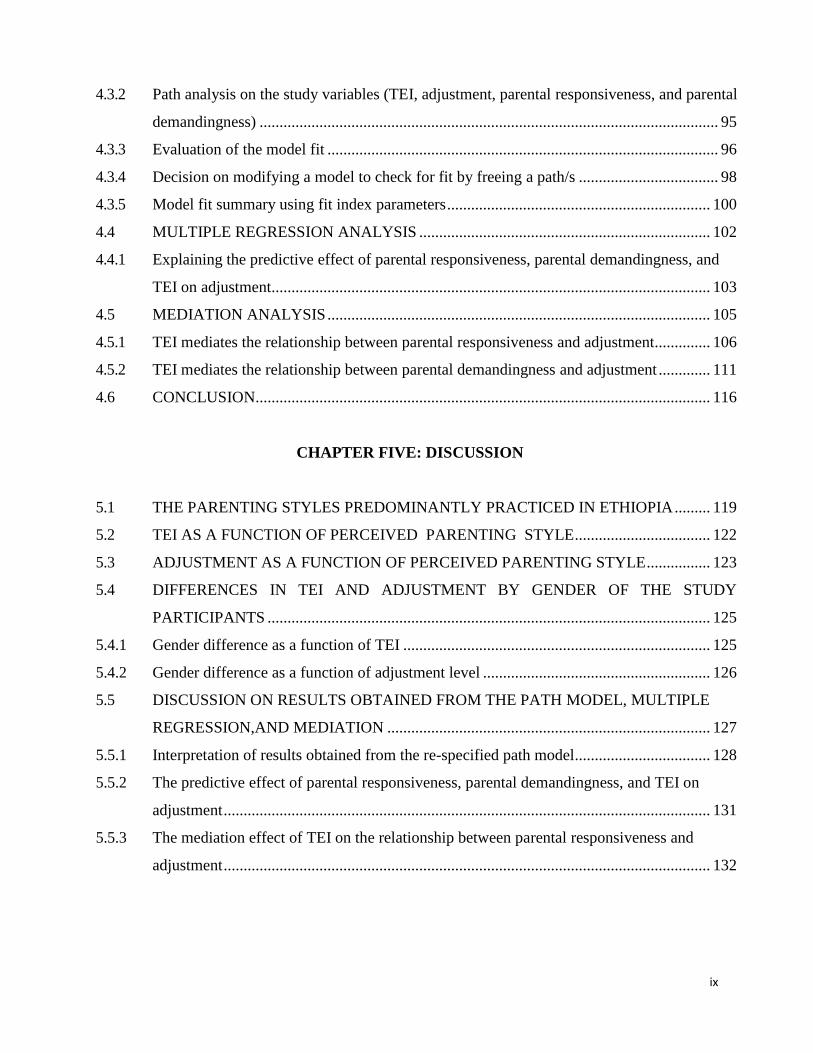
4.3.2 Path analysis on the study variables (TEI, adjustment, parental responsiveness, and parental
demandingness) ................................................................................................................... 95
4.3.3 Evaluation of the model fit .................................................................................................. 96
4.3.4 Decision on modifying a model to check for fit by freeing a path/s ................................... 98
4.3.5 Model fit summary using fit index parameters .................................................................. 100
4.4 MULTIPLE REGRESSION ANALYSIS ......................................................................... 102
4.4.1 Explaining the predictive effect of parental responsiveness, parental demandingness, and
TEI on adjustment .............................................................................................................. 103
4.5 MEDIATION ANALYSIS ................................................................................................ 105
4.5.1 TEI mediates the relationship between parental responsiveness and adjustment .............. 106
4.5.2 TEI mediates the relationship between parental demandingness and adjustment ............. 111
4.6 CONCLUSION.................................................................................................................. 116
CHAPTER FIVE: DISCUSSION
5.1 THE PARENTING STYLES PREDOMINANTLY PRACTICED IN ETHIOPIA ......... 119
5.2 TEI AS A FUNCTION OF PERCEIVED PARENTING STYLE .................................. 122
5.3 ADJUSTMENT AS A FUNCTION OF PERCEIVED PARENTING STYLE ................ 123
5.4 DIFFERENCES IN TEI AND ADJUSTMENT BY GENDER OF THE STUDY
PARTICIPANTS ............................................................................................................... 125
5.4.1 Gender difference as a function of TEI ............................................................................. 125
5.4.2 Gender difference as a function of adjustment level ......................................................... 126
5.5 DISCUSSION ON RESULTS OBTAINED FROM THE PATH MODEL, MULTIPLE
REGRESSION,AND MEDIATION ................................................................................. 127
5.5.1 Interpretation of results obtained from the re-specified path model .................................. 128
5.5.2 The predictive effect of parental responsiveness, parental demandingness, and TEI on
adjustment .......................................................................................................................... 131
5.5.3 The mediation effect of TEI on the relationship between parental responsiveness and
adjustment .......................................................................................................................... 132
x
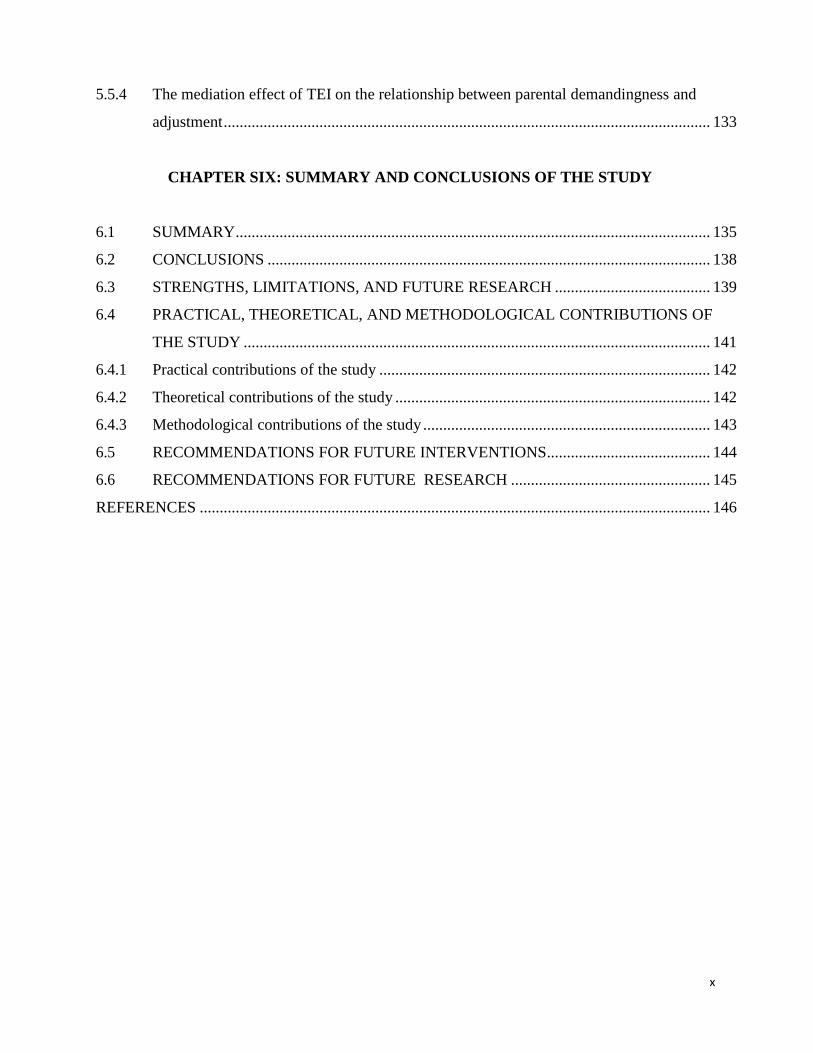
5.5.4 The mediation effect of TEI on the relationship between parental demandingness and
adjustment .......................................................................................................................... 133
CHAPTER SIX: SUMMARY AND CONCLUSIONS OF THE STUDY
6.1 SUMMARY ....................................................................................................................... 135
6.2 CONCLUSIONS ............................................................................................................... 138
6.3 STRENGTHS, LIMITATIONS, AND FUTURE RESEARCH ....................................... 139
6.4 PRACTICAL, THEORETICAL, AND METHODOLOGICAL CONTRIBUTIONS OF
THE STUDY ..................................................................................................................... 141
6.4.1 Practical contributions of the study ................................................................................... 142
6.4.2 Theoretical contributions of the study ............................................................................... 142
6.4.3 Methodological contributions of the study ........................................................................ 143
6.5 RECOMMENDATIONS FOR FUTURE INTERVENTIONS......................................... 144
6.6 RECOMMENDATIONS FOR FUTURE RESEARCH .................................................. 145
REFERENCES ................................................................................................................................ 146
xi
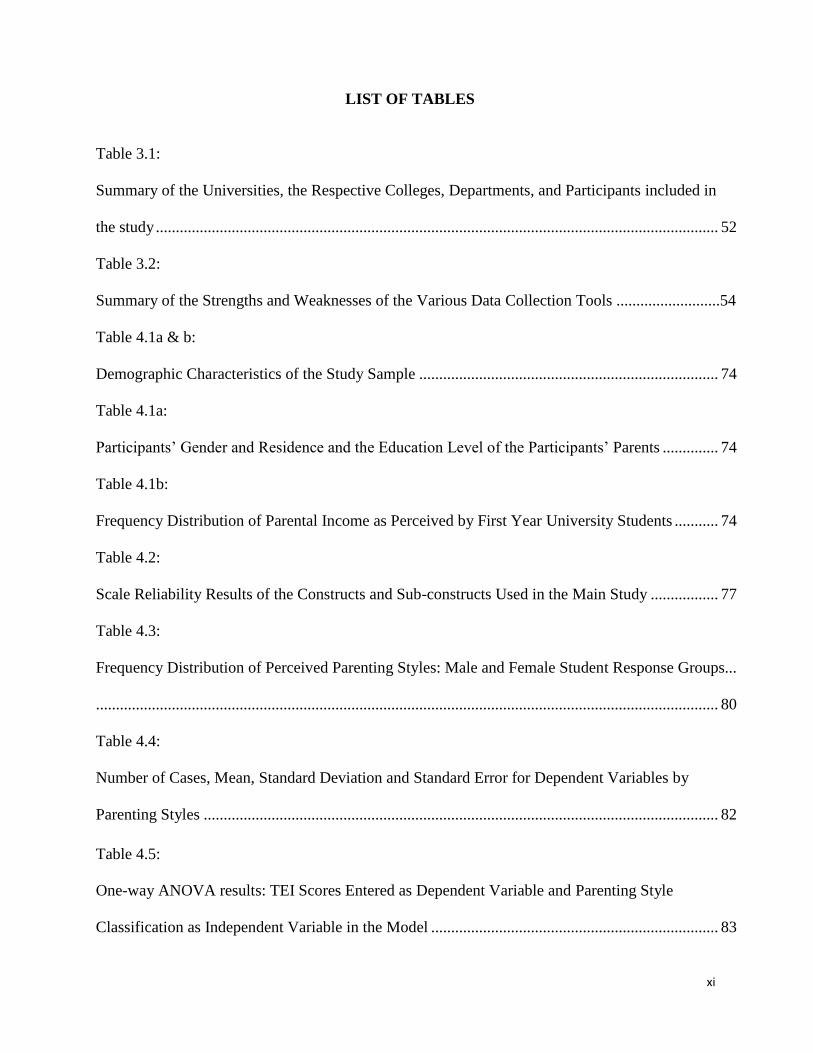
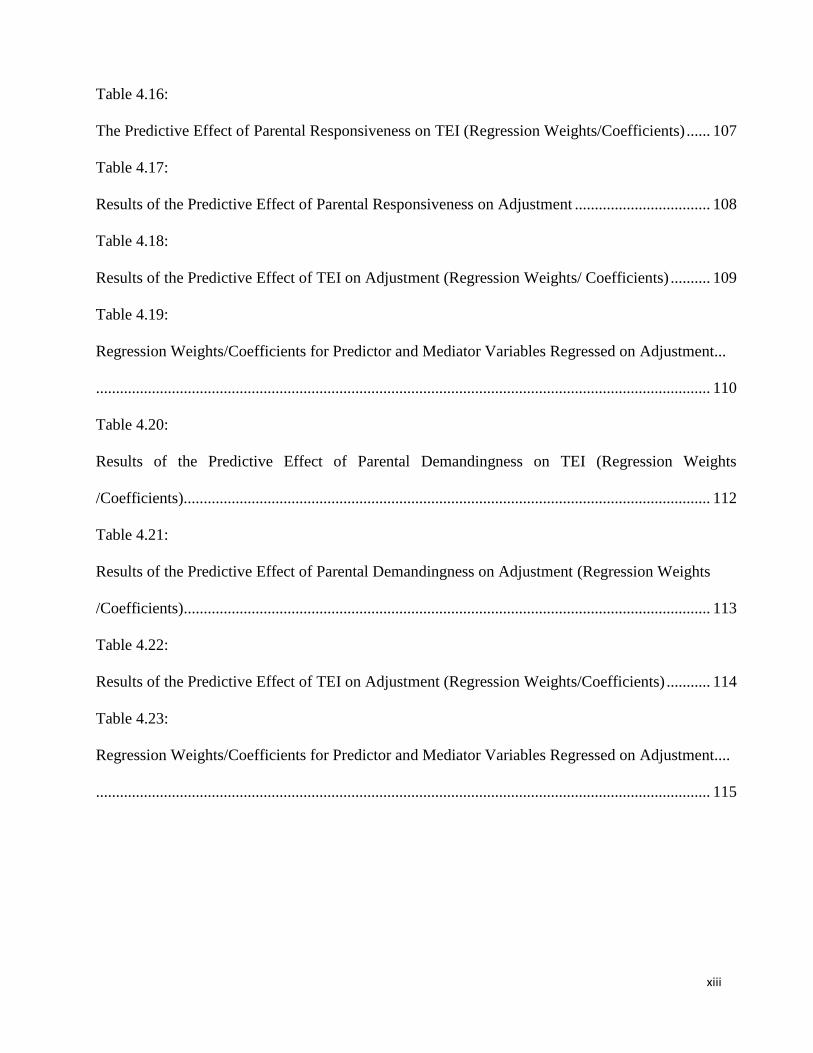
LIST OF TABLES
Table 3.1:
Summary of the Universities, the Respective Colleges, Departments, and Participants included in
the study ............................................................................................................................................. 52
Table 3.2:
Summary of the Strengths and Weaknesses of the Various Data Collection Tools ..........................54
Table 4.1a & b:
Demographic Characteristics of the Study Sample ........................................................................... 74
Table 4.1a:
Participants’ Gender and Residence and the Education Level of the Participants’ Parents .............. 74
Table 4.1b:
Frequency Distribution of Parental Income as Perceived by First Year University Students ........... 74
Table 4.2:
Scale Reliability Results of the Constructs and Sub-constructs Used in the Main Study ................. 77
Table 4.3:
Frequency Distribution of Perceived Parenting Styles: Male and Female Student Response Groups...
............................................................................................................................................................ 80
Table 4.4:
Number of Cases, Mean, Standard Deviation and Standard Error for Dependent Variables by
Parenting Styles ................................................................................................................................. 82
Table 4.5:
One-way ANOVA results: TEI Scores Entered as Dependent Variable and Parenting Style
Classification as Independent Variable in the Model ........................................................................ 83
xii
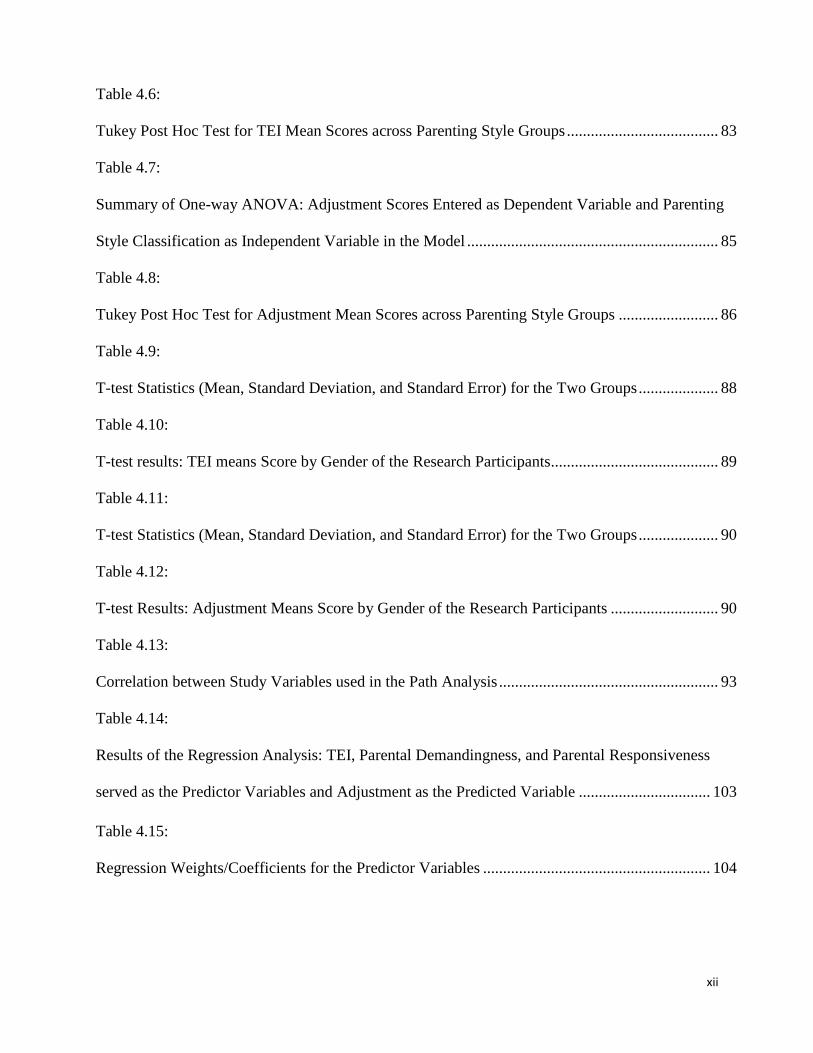
Table 4.6:
Tukey Post Hoc Test for TEI Mean Scores across Parenting Style Groups ...................................... 83
Table 4.7:
Summary of One-way ANOVA: Adjustment Scores Entered as Dependent Variable and Parenting
Style Classification as Independent Variable in the Model ............................................................... 85
Table 4.8:
Tukey Post Hoc Test for Adjustment Mean Scores across Parenting Style Groups ......................... 86
Table 4.9:
T-test Statistics (Mean, Standard Deviation, and Standard Error) for the Two Groups .................... 88
Table 4.10:
T-test results: TEI means Score by Gender of the Research Participants.......................................... 89
Table 4.11:
T-test Statistics (Mean, Standard Deviation, and Standard Error) for the Two Groups .................... 90
Table 4.12:
T-test Results: Adjustment Means Score by Gender of the Research Participants ........................... 90
Table 4.13:
Correlation between Study Variables used in the Path Analysis ....................................................... 93
Table 4.14:
Results of the Regression Analysis: TEI, Parental Demandingness, and Parental Responsiveness
served as the Predictor Variables and Adjustment as the Predicted Variable ................................. 103
Table 4.15:
Regression Weights/Coefficients for the Predictor Variables ......................................................... 104
xiii
Table 4.16:
The Predictive Effect of Parental Responsiveness on TEI (Regression Weights/Coefficients) ...... 107
Table 4.17:
Results of the Predictive Effect of Parental Responsiveness on Adjustment .................................. 108
Table 4.18:
Results of the Predictive Effect of TEI on Adjustment (Regression Weights/ Coefficients) .......... 109
Table 4.19:
Regression Weights/Coefficients for Predictor and Mediator Variables Regressed on Adjustment...
.......................................................................................................................................................... 110
Table 4.20:
Results of the Predictive Effect of Parental Demandingness on TEI (Regression Weights
/Coefficients).................................................................................................................................... 112
Table 4.21:
Results of the Predictive Effect of Parental Demandingness on Adjustment (Regression Weights
/Coefficients).................................................................................................................................... 113
Table 4.22:
Results of the Predictive Effect of TEI on Adjustment (Regression Weights/Coefficients) ........... 114
Table 4.23:
Regression Weights/Coefficients for Predictor and Mediator Variables Regressed on Adjustment....
.......................................................................................................................................................... 115
xiv
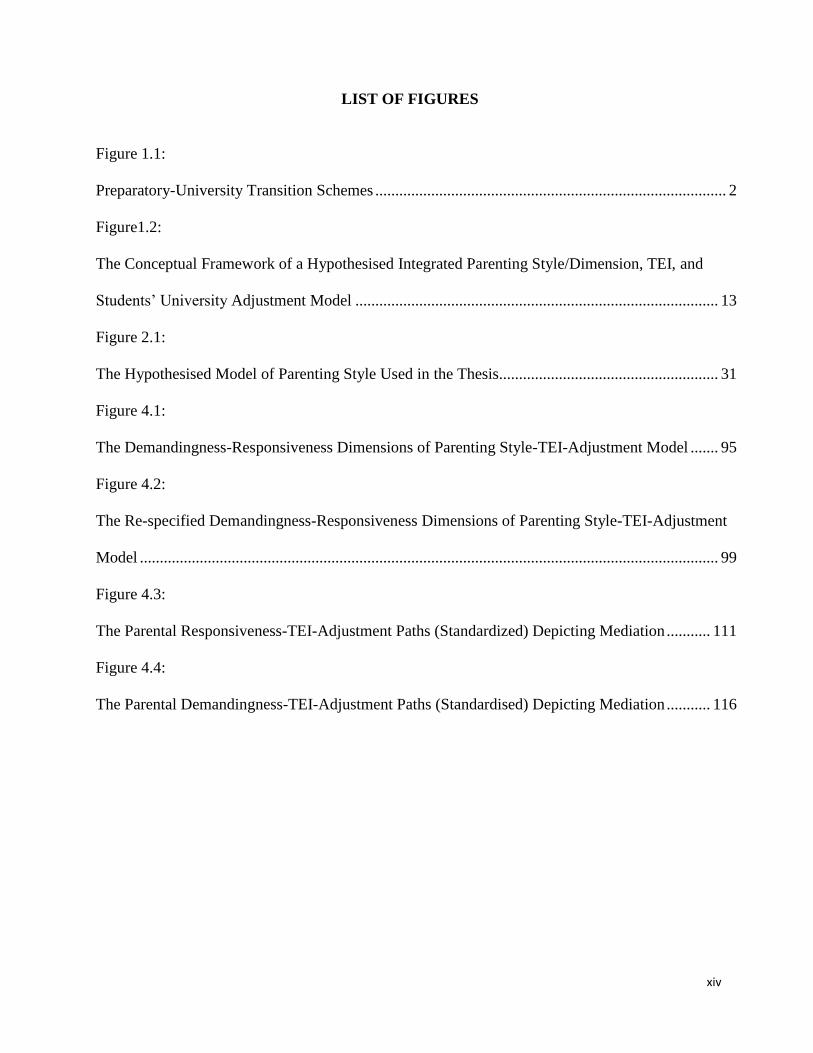
LIST OF FIGURES
Figure 1.1:
Preparatory-University Transition Schemes ........................................................................................ 2
Figure1.2:
The Conceptual Framework of a Hypothesised Integrated Parenting Style/Dimension, TEI, and
Students’ University Adjustment Model ........................................................................................... 13
Figure 2.1:
The Hypothesised Model of Parenting Style Used in the Thesis....................................................... 31
Figure 4.1:
The Demandingness-Responsiveness Dimensions of Parenting Style-TEI-Adjustment Model ....... 95
Figure 4.2:
The Re-specified Demandingness-Responsiveness Dimensions of Parenting Style-TEI-Adjustment
Model ................................................................................................................................................. 99
Figure 4.3:
The Parental Responsiveness-TEI-Adjustment Paths (Standardized) Depicting Mediation ........... 111
Figure 4.4:
The Parental Demandingness-TEI-Adjustment Paths (Standardised) Depicting Mediation ........... 116
xv
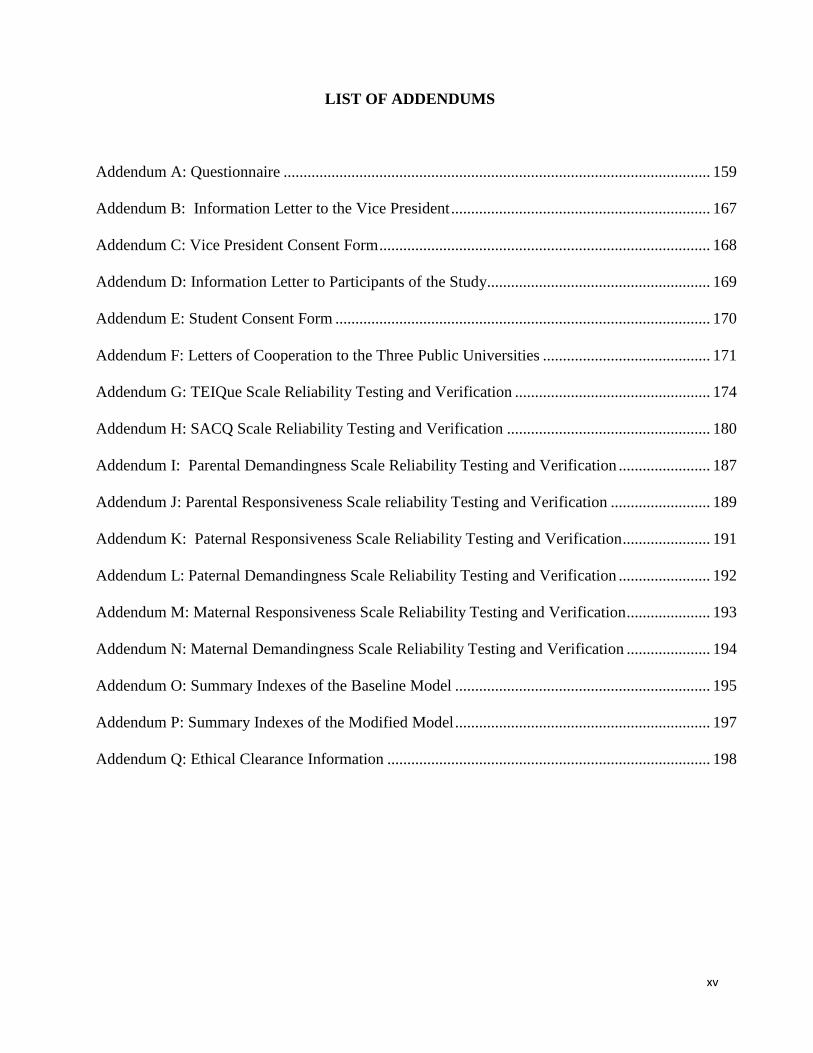
LIST OF ADDENDUMS
Addendum A: Questionnaire ........................................................................................................... 159
Addendum B: Information Letter to the Vice President ................................................................. 167
Addendum C: Vice President Consent Form ................................................................................... 168
Addendum D: Information Letter to Participants of the Study........................................................ 169
Addendum E: Student Consent Form .............................................................................................. 170
Addendum F: Letters of Cooperation to the Three Public Universities .......................................... 171
Addendum G: TEIQue Scale Reliability Testing and Verification ................................................. 174
Addendum H: SACQ Scale Reliability Testing and Verification ................................................... 180
Addendum I: Parental Demandingness Scale Reliability Testing and Verification ....................... 187
Addendum J: Parental Responsiveness Scale reliability Testing and Verification ......................... 189
Addendum K: Paternal Responsiveness Scale Reliability Testing and Verification ...................... 191
Addendum L: Paternal Demandingness Scale Reliability Testing and Verification ....................... 192
Addendum M: Maternal Responsiveness Scale Reliability Testing and Verification ..................... 193
Addendum N: Maternal Demandingness Scale Reliability Testing and Verification ..................... 194
Addendum O: Summary Indexes of the Baseline Model ................................................................ 195
Addendum P: Summary Indexes of the Modified Model ................................................................ 197
Addendum Q: Ethical Clearance Information ................................................................................. 198
xvi
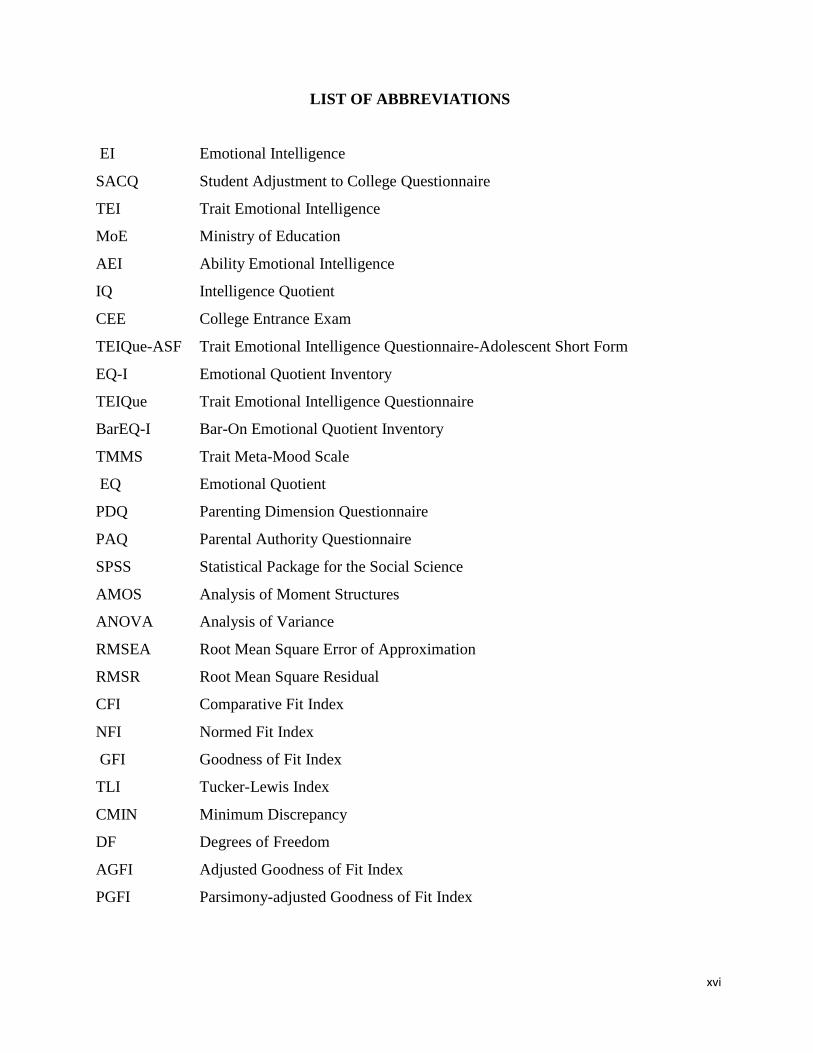
LIST OF ABBREVIATIONS
EI Emotional Intelligence
SACQ Student Adjustment to College Questionnaire
TEI Trait Emotional Intelligence
MoE Ministry of Education
AEI Ability Emotional Intelligence
IQ Intelligence Quotient
CEE College Entrance Exam
TEIQue-ASF Trait Emotional Intelligence Questionnaire-Adolescent Short Form
EQ-I Emotional Quotient Inventory
TEIQue Trait Emotional Intelligence Questionnaire
BarEQ-I Bar-On Emotional Quotient Inventory
TMMS Trait Meta-Mood Scale
EQ Emotional Quotient
PDQ Parenting Dimension Questionnaire
PAQ Parental Authority Questionnaire
SPSS Statistical Package for the Social Science
AMOS Analysis of Moment Structures
ANOVA Analysis of Variance
RMSEA Root Mean Square Error of Approximation
RMSR Root Mean Square Residual
CFI Comparative Fit Index
NFI Normed Fit Index
GFI Goodness of Fit Index
TLI Tucker-Lewis Index
CMIN Minimum Discrepancy
DF Degrees of Freedom
AGFI Adjusted Goodness of Fit Index
PGFI Parsimony-adjusted Goodness of Fit Index
xvii
NPAR Number of Parameters
P Probability Value
RFI Relative Fit Index
IFI Incremental Fit Index
χ2 Chi-square
e1 Error term 1
e2 Error term 2
PCLOSE P for Test of Close Fit
LO 90 Lower 90% Confidence Limit
HI 90 Upper 90% Confidence Limit
M Mean
SD Standard Deviation
Sig. Significant
SE Standard Error
MS Mean Square
F F-statistic
SoSs Sum of Squares
N Number of Cases
SED Standard Error Difference
MD Mean Difference
RS R-Square
ARS Adjusted R-Square
RSC R-Square Change
β Beta
1
CHAPTER ONE
STATEMENT OF PROBLEM, AIM AND SCOPE OF THE STUDY
This chapter focuses on the background and motivation, problem statement and aim of the
study. It also stipulates the conceptual framework, research questions, research objectives,
operational definition of terms, significance, assumptions and scope of the research, and
chapter divisions.
1.1 BACKGROUND AND MOTIVATION
Life at university for first year students can be both stimulating and demanding (Habibah,
Noordin, & Mahyuddin, 2010). This is because, on the one hand, it increases personal
independence (Habibah et al., 2010) while on the other, it may be a source of stress
(Friedlander, Reid, Shupak, & Cribbie, 2007). The transition may lead to decreased academic
performance and increased psychological distress (Friedlander et al., 2007) underscoring that
students deal differently with the transition to university life, and making it important to
address this issue.
Students’ entry into a university engrosses numerous challenges (Doyle & Walker, 2002).
However, intrapersonal, adaptability, and stress management abilities are vital elements to
make transition from high school to university successful (Parker, Summerfeldt, Hogan, &
Majeski, 2004). On the other hand, inept in those skills escort them to confront, for example,
social problems (Raj, 2012), a multitude of new personal and interpersonal challenges that
include the desire to make new relationships, alter existing relationships and have to become
skilled at study habits for a quite fresh academic setting (Parker et al., 2004). Moreover,
university students’ used to experience financial and academic pressure (Cooke, Bewick,
Barkham, Bradley, & Audin, 2006). In the event that students do not cope with the wider
challenges demanded of them during their transition from secondary to tertiary education, their
learning outcomes will be negatively impacted (Burgess, Crocombe, Kelly, & Seet, 2009).
In Ethiopia, students who successfully graduate from preparatory school enroll in universities
to undertake their tertiary level education. Within the past few years in Ethiopia, in addition to
regional and private colleges, the number of public universities has grown to 43 (Ministry of
2
Education (MoE, 2014). Following this, the yearly public universities’ acceptance rate of new
students has dramatically increased from somewhat less than ten thousand (two decades ago)
to nearly four hundred thousand, of whom 28 % were female students (MoE, 2013). However,
the attrition rate of first year university students in the country, Ethiopia is high. In this regard,
a study on this rate in Bahir Dar University, reported that the overall attrition rate of male
students was 34.2 % while that of female students was 56.8 % (Yalew, 2003).
Many first year university students encounter adjustment difficulties and challenges during the
transition to higher levels of education and have the greatest difficulty adjusting to the various
demands of the university (Tinto, 1996). In a similar vein, Ethiopian university and college
level students undergo various challenges; for instance, Yusuf (1998), found that while
students in higher education institutions encounter all types of problems, the economic,
psychosocial, educational, and health issues are the dominant ones. In particular, first year
students suffer from either multiple or at least one form of the commonly reported problems
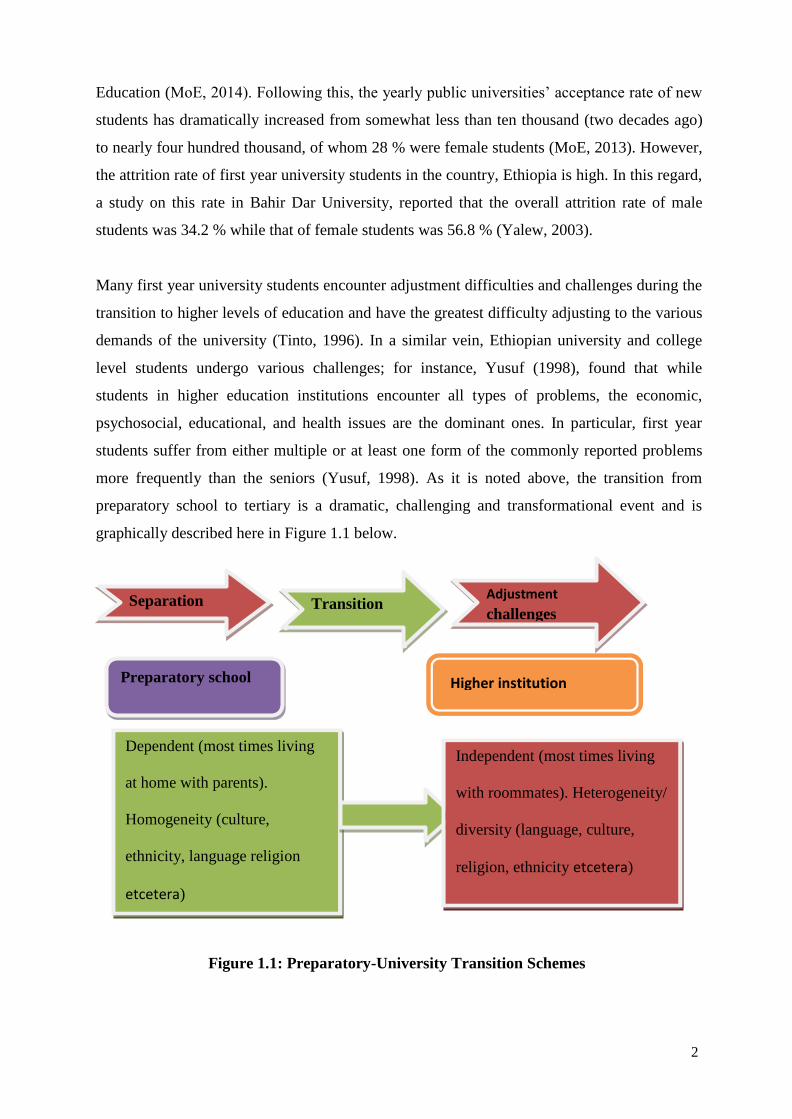
more frequently than the seniors (Yusuf, 1998). As it is noted above, the transition from
preparatory school to tertiary is a dramatic, challenging and transformational event and is
graphically described here in Figure 1.1 below.
Figure 1.1: Preparatory-University Transition Schemes
Separation Transition
Adjustment
challenges
Higher institution
Independent (most times living
with roommates). Heterogeneity/
diversity (language, culture,
religion, ethnicity etcetera)
Dependent (most times living
at home with parents).
Homogeneity (culture,
ethnicity, language religion
etcetera)
Preparatory school
3
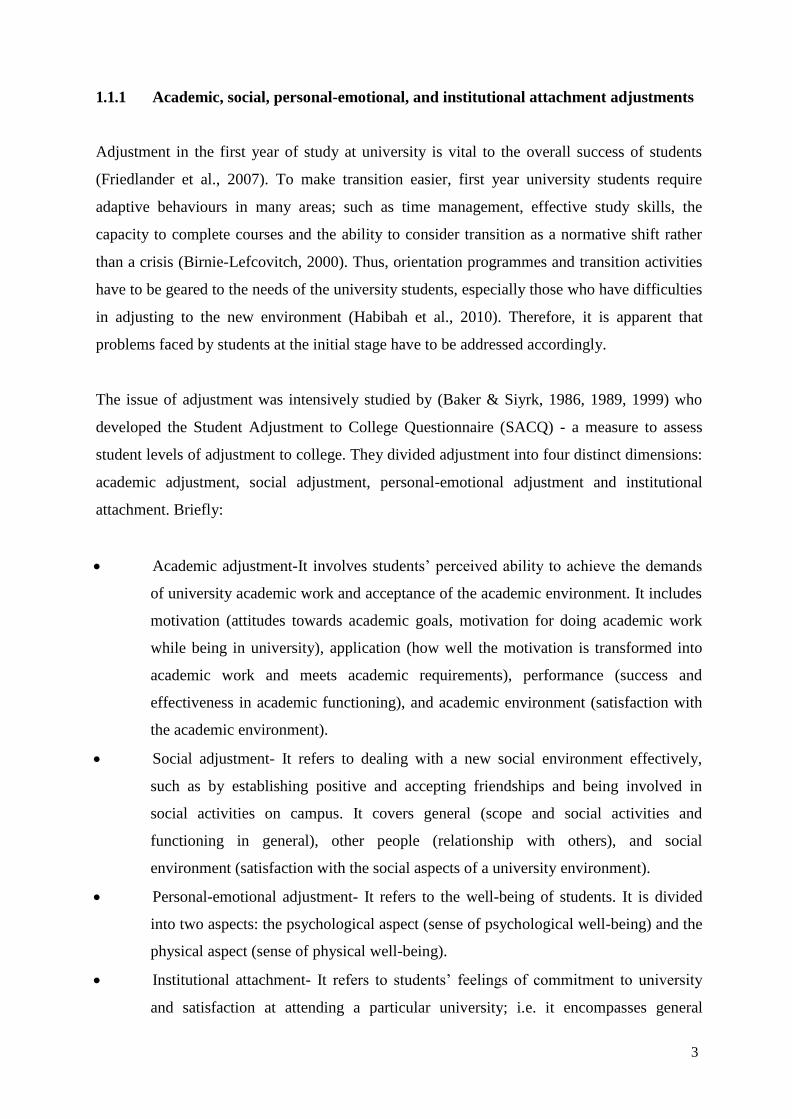
1.1.1 Academic, social, personal-emotional, and institutional attachment adjustments
Adjustment in the first year of study at university is vital to the overall success of students
(Friedlander et al., 2007). To make transition easier, first year university students require
adaptive behaviours in many areas; such as time management, effective study skills, the
capacity to complete courses and the ability to consider transition as a normative shift rather
than a crisis (Birnie-Lefcovitch, 2000). Thus, orientation programmes and transition activities
have to be geared to the needs of the university students, especially those who have difficulties
in adjusting to the new environment (Habibah et al., 2010). Therefore, it is apparent that
problems faced by students at the initial stage have to be addressed accordingly.
The issue of adjustment was intensively studied by (Baker & Siyrk, 1986, 1989, 1999) who
developed the Student Adjustment to College Questionnaire (SACQ) - a measure to assess
student levels of adjustment to college. They divided adjustment into four distinct dimensions:
academic adjustment, social adjustment, personal-emotional adjustment and institutional
attachment. Briefly:
Academic adjustment-It involves students’ perceived ability to achieve the demands
of university academic work and acceptance of the academic environment. It includes
motivation (attitudes towards academic goals, motivation for doing academic work
while being in university), application (how well the motivation is transformed into
academic work and meets academic requirements), performance (success and
effectiveness in academic functioning), and academic environment (satisfaction with
the academic environment).
Social adjustment- It refers to dealing with a new social environment effectively,
such as by establishing positive and accepting friendships and being involved in
social activities on campus. It covers general (scope and social activities and
functioning in general), other people (relationship with others), and social
environment (satisfaction with the social aspects of a university environment).
Personal-emotional adjustment- It refers to the well-being of students. It is divided
into two aspects: the psychological aspect (sense of psychological well-being) and the
physical aspect (sense of physical well-being).
Institutional attachment- It refers to students’ feelings of commitment to university
and satisfaction at attending a particular university; i.e. it encompasses general
4
feelings and satisfaction of being in university and specific feelings and satisfaction at
being at the particular university where they are enrolled.
In this study, university adjustment is defined as a process by which first year university
students fulfil the academic, social, personal-emotional and institutional attachment demands
at a higher institution in an acceptable manner, while adjustment difficulty refers to first year
university students’ failure to cope successfully with the demands faced at higher institutions.
Overall, the current study follows the definition provided by Baker and Siryk (1989, 1999). In
other words, the important components of adjustment to university considered in this research
include first year university students’ academic adjustment, social adjustment, personal-
emotional adjustment, and institutional attachment/commitment.
1.1.2 Emotional Intelligence (EI) as a tool for adjustment
In section 1.1.1, adjustment and its indicators were described in detail, in order to provide a
preliminary view regarding the notion of adjustment. This portion of the introduction offers an
introduction to Trait Emotional Intelligence (TEI) alongside with its dimensions and its
relationship with adjustment. To begin, as noted, first year students’ adjustment to university
life is essential for their overall success at university. In this regard, EI plays an important role
that fosters students’ maintaining their adjustment successfully during their transition to
university (Engelberg & Sjoberg, 2004; Low & Nelson, 2005). Other research results have
also revealed the importance of EI. For instance, Mayer, Roberts, and Barsade (2008) studied
the role of EI in predicting success in personal adjustment and social behaviour.
In addition, EI is also considered a driving force behind the factors that affect personal success
and everyday interaction with others (Engelberg & Sjoberg, 2004; Punia & Sangwan, 2011).
Emotionally intelligent individuals are described as well adjusted, warm, genuine, persistent
and optimistic (Mayer & Salovey, 1990). Taking into account of the importance of EI, Austin,
Evans, Goldwater, and Potter (2005) also underscored an early EI programme for the first year
students in order to help them to adjust their transition successfully. Overall, EI helps people
in handling challenges in a wide range of domains, including education, clinical interventions
and the workplace (Punia & Sangwan, 2011).
5
Since EI is pivotal in the ways humans interact with each other and perform in home, school,
and work settings, the need to understand it is vital. Therefore, for an improved future, it is
necessary to equip first year students with EI because they will be the next generation’s
leaders, doctors, artists, business people, and politicians who can make wiser judgments and
solve problems for the benefit of all people.
In the literature on EI research, two dominant dimensions have been investigated:
The Ability Emotional Intelligence (AEI)- refers to cognitive abilities which are
measured through performance measurements, and
The TEI–refers to behavioural dispositions and self-perceptions concerning one’s
ability to recognise process and utilise emotion-laden information and is measured
with a self-report questionnaire (Bar-On, 1997, 2000; Goleman, 1995, 1998; Mayer,
Caruso, & Salovey, 2000; Petrides & Furnham, 2000, 2001, 2003).
1.1.3 Correlations between AEI and TEI
TEI and AEI are considered as the two different dimensions of EI, and their level of empirical
and methodological variation is described in this section. In this regard, empirical research has
revealed low correlations between AEI and TEI (Gohm, Corser, & Dalsky, 2005), thus
substantiating the conceptual and methodological differences between the two constructs
(O’Connor & Little, 2003; Petrides, 2010). There is also a fundamental difference in the
measurement of EI constructs (AEI vs. TEI) (Petrides & Furnham, 2001).
Concerning TEI, definitions are quite diverse, and sometimes this factor appears to include
anything other than Intelligence Quotient (IQ) that might contribute to success. Research
results have depicted that high TEI individuals are believed to regulate their emotional
reactions over time, manage their stress, and are thought to be assertive (Petrides & Furnham,
2001), while displaying fewer negative stress responses, i.e. they make fewer negative
appraisals and feel more able to cope with situations (Mikolajczak & Luminet, 2008).
For purposes of this research, the focus is on TEI rather than on AEI because, as has been
revealed in various literary studies, TEI has been measured via self-reports (Bar-On & Parker,
2000; Mayer & Salovey, 1995). Therefore, one may state that self-report tests of EI measure
6
self-perceptions of emotional abilities and emotional dispositions, which are more connected
to personality traits than to cognitive abilities. While abilities can be trained, personality
dispositions may need more nurturing; therefore, TEI is believed to be more sensitive to
parental behaviours than actual emotional abilities. In this research, TEI is treated as
encompassing the four dimensions: well-being, self-control, emotionality, and sociability
(Petrides, 2001).
1.1.4 TEI as a learned behaviour
From the literature, the investigator came to note that TEI as a learned behaviour is influenced
by the social context in which the individual grows up. In other words, there seems to be
evidence of a connection between parenting and children’s TEI. For example, Alegre and
Benson (2010) found that parental availability and control were related to late adolescents’
TEI. Besides, parents perform a key role in EI training (Fonte, 2009), because they play an
important part in raising children.
TEI as learned behaviour is influenced by parental relationships; as noted in the literature,
parental relationships have been found to affect many different aspects of development of
children, including the range and depth of emotions which parents display to their children
(Baumrind, 1991; Dornbusch et al., 1987 cited in Sharma & Sahni, 2013). Hence, the
importance of parental rearing style and early social interactions for later development is
widely recognised (Liem, Cavell, & Lustig, 2010).
Parenting style not only contributes positively to development; it also has negative effects on
children’s development. In relation to this Mayer and Salovey (1997) indicated that parental
withdrawals may well influence children and adolescents’ ability to attend to, understand, and
regulate their own emotions and the emotions of others. In turn, the lack of EI could place
individuals at a disadvantage because they are given insufficient resources to deal with social
and personal challenges, resulting in internalising or externalising problems (Goleman, 1995).
1.1.5 Parenting style
In the previous section, the relationship between AEI and TEI, and the influence of parenting
style on TEI were demonstrated. This section provides an introduction on parenting style and
7
how the four parenting styles were classified using parental responsiveness and
demandingness dimensions.
The concept of parenting style has appeared in the international arena since the 1920’s, though
it is Baumrind’s research in the 1960’s which provides the basis for the notion of parenting
style used in much of today’s research. Primarily, Baumrind (1967) introduced the concept of
parenting styles based on two important dimensions of parenting: parental responsiveness
(warmth/support) and parental demandingness (behavioural control). Therefore, Baumrind’s
three parenting styles were classified as: authoritarian parenting (highly demanding and
directive; not responsive), permissive (highly responsive, not demanding), and authoritative
(both demanding and responsive). However, Maccoby and Martin (1983) reviewed
Baumrind’s work, updated her parenting styles and included a fourth: uninvolved or neglectful
(neither responsive nor demanding).
Previous research on parenting styles, for instance, by Darling (1999), documented some
important findings regarding parental responsiveness and parental demandingness. According
to Darling (1999), parental responsiveness predicts social competence and psychosocial
functioning, while parental demandingness is associated with instrumental competence and
behavioural control.
In this research, the four parenting styles along with their two dimensions (parental
responsiveness/involvement and parental demandingness/strictness/control/) that have been
appearing in many research documents for the last three decades are considered.
1.1.6 Parenting style as a tool for college adjustment
Parenting style does result in both positive and negative outcomes for children’s development.
Therefore, the task of adjustment to any situation cannot be an exception. In this regard,
Whittaker and Cornthwaite (2000) boldly asserted that parental rearing styles could be either
facilitative, promoting higher levels of psychosocial adjustment or aversive, promoting lower
levels of psychosocial adjustment in later life. Positive parental rearing styles are associated
with adjustment to college (Schnuck & Handal, 2011), and socially competent behaviour
(Baumrind, 1991; Lamborn, Mounts, Steinberg, & Dornbusch, 1991). Therefore, one of the
recommendations for preventing social problems is the further investigation of parenting style
and related factors (Dwairy & Menshar, 2006).

8
More specifically, college students with a high level of dependence on parents could result in a
feeling of mutual reciprocity between the parent and a child (Wintre & Yaffe, 2000). In sum,
adolescents with uninvolved parents are generally less socially competent and present
adjustment problems in all domains (Baumrind, 1991), whereas adolescents who have been
brought up by means of an authoritative parenting style display better psychosocial and
behavioural adjustment than the rest of the parenting styles (Beyers & Goossens,1999).
After having provided an introduction to the major variables to be included in this thesis and
insights about them, the next section reports on the theoretical and empirical aspects and the
gaps existing in the literature by drawing attention to them in the section addressing statement
of the problem, below.
1.2 PROBLEM STATEMENT
As noted, attending to university for the first time is a stressful experience for many college or
university students (Dyson & Renk, 2006), and the adjustment to university life is a significant
transition accompanied with challenges and difficulties for students (ACT, 2002). Some
college students feel overwhelmed and, as mentioned before, experience various adjustment
problems (Bernier, Larose, & Whipple, 2005) that lead them to drop out of university
(Estrada, Dupoux, & Wolman, 2005). Consolvo (2002) also stipulated about the dropout of
college students, more specifically, nearly 30-40% of them do so without achieving a college
degree, and many of them not capable to came again to college to complete their degrees.
In even worse findings, Tinto (2000) indicated that approximately 60% of first year students
who enter college do not graduate; the majority of these could leave college within their first
two years. Here, as intimated, the importance of the issue of adjustment should not be
overlooked; that is, more research is needed to examine the context of university adjustment,
especially during students’ first year there (Grant-Vallone, Reid, Umali, & Pohlert, 2004).
Boulter (2002) also reported that about 75 % of students who had dropped out of college do so
within their first two years because of adjustment problems during their first year. Therefore,
serious attention needs to be given to students who face problems in the first year at university
(Azar & Reshadatjoo, 2014).

9
A study by Habibah et al. (2010) disclosed that university students, irrespective of their year
of study, generally report moderate levels of adjustment. But, when a comparison between the
senior and junior ones was considered, there was a significant difference between their levels
of adjustment, with senior students being better adjusted than the juniors. The study
established that students encounter difficulties regarding their academic studies as well as
personal, emotional, social matters and coping with the learning tasks. Sharma (2012) also
indicated that first year students are less emotionally mature and thus faced more difficulty in
adjusting emotionally to the demands of the new environment than did the senior students.
The expansion of higher education in Ethiopia, with the resulting large numbers of student
admissions, has also led me (the investigator) to be motivated to support the diverse student
population admitted to university. Therefore, it is justifiable to investigate first year university
students’ adjustment experiences in Ethiopian higher institutions. Researchers (Baker & Syrik,
1999) also recommended evaluating student adjustment to university as it is always a sensitive
issue. This implies that there is a need to conduct further research in this area.
While there are many studies examining adjustment to university, there are two major gaps, to
my knowledge, that I have noted. First, the majority of investigations were undertaken in the
West, particularly with US students, and little is known about first year students’ adjustment to
university in Ethiopia. Given the cultural differences regarding student entry into universities
in the West, we should not assume that transition to university is the same for students in the
West as it is for those in Ethiopia. Secondly, previously published literature also indicated that
little research has been carried out with respect to the acculturation problems of the local
students who came from diverse cultures such as those in Ethiopia.
As is well-known, Ethiopia is a multi-ethnic and multi-religious country with a population of
about 90 million (Central Statistical Agency, 2012). It is home to more than 80 ethnic groups
who speak different languages and follow different religions, and there are definite variations
in customs and traditional beliefs and practices. Thus, complexity increases as university
roommates come from different ethnic/cultural backgrounds and hold different values. Despite
this, there is a paucity of research on adjustment processes of first year students and related
interventions in the universities of Ethiopia. Consequently, studying the adjustment of students
who came from diverse cultures to life in the university, in particular, Ethiopia is necessary.
Hence, to the best of my knowledge, this study is the first to approach such a task.
10
Most importantly, adjustment difficulties among students need serious attention as they can
lead to students’ failure to complete their studies (Abdullah, Elias, Mahyuddin, & Uli, 2009).
Sanoff (2006) also indicated that first year students are ill prepared for college life, hence,
need a good orientation programme to prepare them for the challenges they will encounter in
all areas of life at the campus.
The students’ successful transition into a university is evidenced as being associated with
variables or a combination of variables consisting of academic and non-academic/non-
cognitive factors. Among the non-cognitive factors responsible for contributing to college
adjustment is the TEI, and its role in students’ academic performance, which has already been
well-studied (Petrides, Frederickson, & Furnham, 2004; Slobodskaya, Safronova, & Windle,
2005), while its significance in solving students’ emotional and social difficulties at university
still remains unanswered. Nonetheless, researchers have linked TEI to a host of criteria
relating to individuals’ social, emotional and behavioural well-being (Greven, Chamorro-
Premuzic, Arteche, & Furnham, 2008; Mikolajczak, Luminet, & Menil, 2006; Petrides,
Furnham, & Mavroveli, 2007).
Therefore, it is proposed that TEI can predict adjustment and therefore, using TEI as a base to
solve certain students’ adjustment problems is acceptable. Meanwhile, researchers claim that
students need early EI programmes in order to adapt in their environment because these
incorporate a number of abilities, including the ability to be aware of one’s own and others’
emotions, to be able to manage those emotions, and to understand the complex relationships
that can occur between emotions and emotional transition (Austin et al., 2005; Mayer &
Salovey, 1997). Consequently, there is a need to identify adjustment difficulties experienced
by first year students who encounter problems in coping with the demands and challenges that
could produce stress and tension in their campus life, meaning that appropriate intervention
programmes should be planned for them. In addition, students who have low adjustment levels
and who are experiencing difficulties with their studies should be given the appropriate
counselling (Habibah et al., 2010). Therefore, it is vital to address the relationship between
TEI and the adjustment experiences of first year university students.
TEI is also believed to be more sensitive to parental behaviours. The mediating role of EI
between past parental behaviours and late adolescents’ adjustment has been indirectly
suggested in some publications (Goleman 1995; Mayer & Salovey, 1997). Nevertheless, the
11
mediating effect of TEI on the relationship between parenting style/dimension and adjustment
of first year students to university life has not been well studied. Because detailed empirical
evidence is lacking in this regard, there is a need to carry out research in this area.
The present study, using a Parenting Dimension Questionnaire (PDQ), therefore, focuses on
whether past perceived parenting style/behaviour have a significant influence on first year
students’ adjustment to university life, mediated via TEI. This was based on the data collected
from the first year students’ Trait Emotional Intelligence Questionnaire (TEIQue) and the
SACQ respectively. To the best of this researcher’s knowledge, there is no study that has
investigated the integrated effects of past perceived parenting style/dimension and TEI on first
year students’ adjustment to university life in higher education institutions, in Ethiopia.
More importantly, minimal empirical examination has been done on the mediation process, in
which parenting style/dimension relates to students’ university adjustment through TEI. As a
result, the intention of the present study was to examine the mediation processes and provide
more empirical information regarding the mediation pathways from TEI to parenting styles,
and subsequently to adjustment.
Deductions from those essentials above, and the paucity of research addressing the
relationship between parenting style/dimension and TEI and their roles in explaining first year
students’ adjustment at university, comprised the main motivation in conducting this research.
By focusing on the area under consideration, the study is believed to contribute by suggesting
possible remedial strategies and implications to further understand the problem. This study
also attempted to explore whether students’ university adjustment and TEI varies according to
gender, because this information is considered essential in order to help, assist and support
first year students to better adjust to university.
1.3 AIM OF THE STUDY
The central aims /goals of the present study were twofold:
To test the mediated effect of TEI on the relationship between parenting style/
dimension and first year students’ university adjustment, and
To develop an explanatory theory that associates parenting style/dimension with TEI
and adjustment at university of first year students in institutions of higher education in
Ethiopia.
12
1.3.1 Conceptual framework
As mentioned above, the student’s successful transition into a university is evidenced as being
associated with variables and TEI is one of these factors. The construct TEI is implicated in
many important life domains. For instance, there is evidence of a link between parenting style
and an adolescent’s TEI (Alegre & Benson, 2010; Liau, Liau, Theo, & Liau, 2003; Martinez-
Pons, 1999). To be specific, Liau et al.’s (2003) study of 203 Malaysian secondary school
students found that parental monitoring and supervision related to children’s TEI. According
to Martinez-Pons (1999), adolescents’ perceptions of their parents’ reinforcement, praise and
education of emotion-related behaviours were likewise related to the adolescents’ self-reported
TEI.
Longitudinal research has investigated the predictive role that maternal and paternal
characteristics and parenting styles play in individuals’ adjustment during development
(Maggio & Zappulla, 2014). Similarly, a research indicated a relationship between
adolescents’ adjustment problems and their parents’ parental behaviours (Jackson, Pratt,
Hunsberger & Pancer, 2005). Research results also revealed the importance of EI to students’
adjustment, for instance, a study by Yip and Martin (2006) pointed to the existence of a
relationship between EI and overall student adjustment, as well as predicting college
adjustment (Elias, Mahyuddin, & Noordin, 2007; Parker, Hogan, Eastbrook, Oke, & Wood,
2006).
Concerning the parenting style, the investigator chose both a typological and dimensional
approach. With regard to the typological perspective, on the basis of existing literature (Garcia
& Gracia, 2009), it is hypothesised that university students from authoritative and/or indulgent
families would report lower levels of adjustment problems and higher levels of life satisfaction
than students with authoritarian and neglectful parents did. With regard to the dimensional
perspective, as an alternative to the predominant categorical conceptualisation of parenting
styles, researchers have suggested the use of dimensions instead. For instance, Stewart and
Bond (2002) theorised that parenting dimensions are universal and are thus better indicators of
parenting behaviours, especially in ethnic cultural groups where the culture-specific meaning
of the behaviour may differ. They further assert that parenting styles are optimally useful in
research and practice because they accurately describe naturally occurring clusters of
parenting behaviours.
13
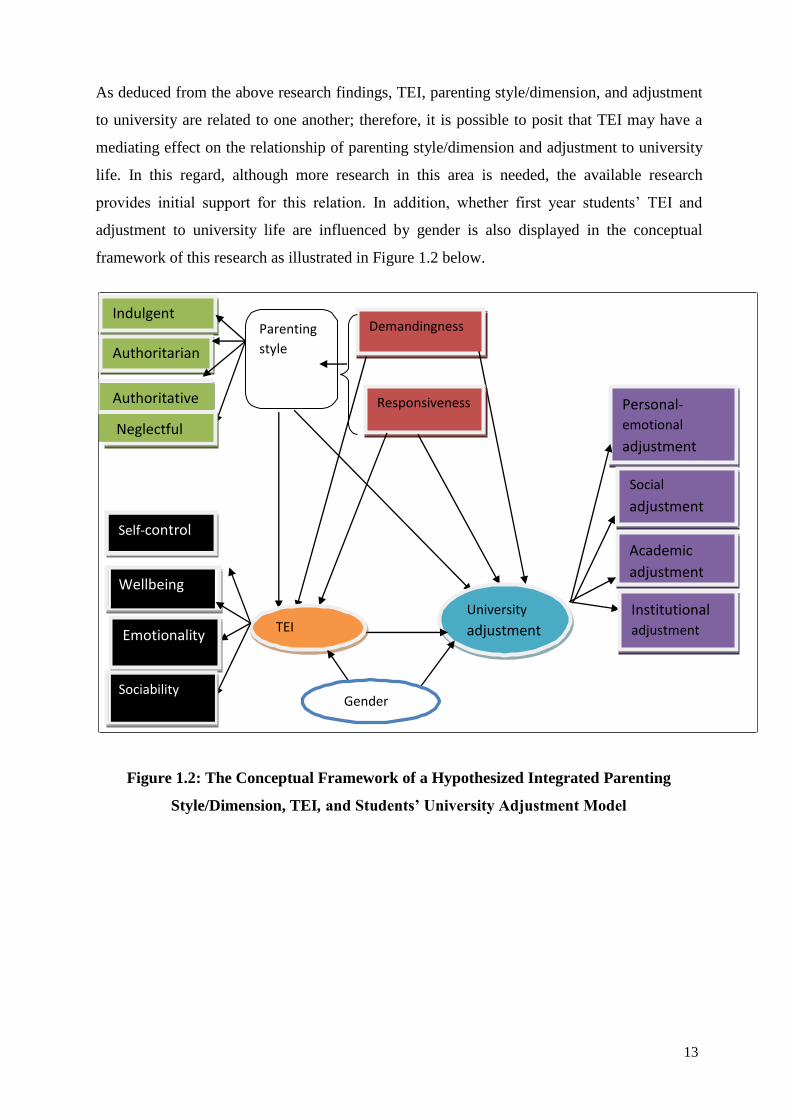
As deduced from the above research findings, TEI, parenting style/dimension, and adjustment
to university are related to one another; therefore, it is possible to posit that TEI may have a
mediating effect on the relationship of parenting style/dimension and adjustment to university
life. In this regard, although more research in this area is needed, the available research
provides initial support for this relation. In addition, whether first year students’ TEI and
adjustment to university life are influenced by gender is also displayed in the conceptual
framework of this research as illustrated in Figure 1.2 below.
Figure 1.2: The Conceptual Framework of a Hypothesized Integrated Parenting
Style/Dimension, TEI, and Students’ University Adjustment Model
Parenting
style
Personal- emotional
adjustment
Social
adjustment
Academic
adjustment
TEI University
adjustment
Institutional
adjustment
Gender
Neglectful
Authoritative
Authoritarian
Indulgent
Sociability
Emotionality
Wellbeing
Self-control
Responsiveness
Demandingness
14
1.3.2 Research questions
Based on the aforementioned literature, in the current study it was expected that parenting
style/dimension would have significant and positive direct effects on TEI and positive direct
and indirect effects on adjustment to university. In particular, the current study scrutinised the
following research questions:
Main research question
How are TEI and parenting style/dimension affecting adjustment at university of first
year students in institutions of higher education?
Sub-research questions
How does TEI mediate the relationship between demandingness and responsiveness
dimension-variables of parenting style and adjustment at university of first year
students?
Does the combined effect of the independent variables (demandingness and
responsiveness dimension-variables of parenting style and TEI) predict adjustment at
university of first year university students?
Is there a statistically significant gender difference with respect to TEI and
adjustment level of first year university students?
Does the university life adjustment scale explain the relationship between TEI and
demandingness and responsiveness dimension-variables of parenting style controlling
for the level of degree of adjustment with university life?
Which type of parenting style is predominantly practiced in the families of Ethiopia?
Are there significant differences in adjustment and TEI as a function of first year
university students’ perceived parenting style (authoritative, authoritarian, neglectful,
and indulgent types?
15
1.3.3 Research Objective
This section consists of two parts: a general one which states the objective in a general form
while the second one encompasses the specific objectives’ list.
1.3.3.1 General objective
The main objective of this research study is to develop an explanatory theory that associates
parenting style/dimension with TEI and adjustment at university of first year students in
institutions of higher education in Ethiopia.
1.3.3.2 Specific objectives
Considering the research questions posed, the objectives were as follows:
To identify how TEI and the demandingness and responsiveness dimension-variables
of parenting style affect adjustment at university of first year students in institutions
of higher education in Ethiopia.
To investigate how TEI mediates in the relationship between demandingness and
responsiveness dimension-variables of parenting style and adjustment of first year
students to university in Ethiopia.
To determine the combined effect of the independent variables (demandingness and
responsiveness dimension-variables of parenting style and TEI) in predicting
adjustment of first year students to university in Ethiopia.
To check if there is a statistically significant difference between genders with respect
to TEI and adjustment at university.
To determine whether the university life adjustment scale explains the relationship
between TEI and demandingness and responsiveness dimension-variables of
parenting style.
To identify the types of parenting style predominantly practiced in the families of
Ethiopia.
16
To investigate whether there are significant differences in adjustment and TEI as a
function of first year university students’ perceived parenting style (authoritative,
authoritarian, neglectful, and indulgent types).
1.4 OPERATIONAL DEFINITION OF TERMS
Operational definition of terms is considered to be the compass and backbone of the research
which basically plays two roles (1) delimiting the research, and (2) relating the research to the
measurements. Hence, in this section very important constructs are operationally defined,
considering the research objective, measurements, and scope of the study.
Adjustment: In this research it refers to a process by which first year students meet the
academic, social, personal-emotional, and institutional attachment demands in an acceptable
manner as measured using the SACQ developed by Baker and Siryk (1984, 1989).
First year university students: In this research it refers to those undergraduate students, who
enrolled in the regular programmes during the 2016/2017 academic year in the three Ethiopian
public universities.
Higher education institution: In this research it denotes those governmental educational
institutions (universities) in Ethiopia where preparatory level students scored at least the
minimum requirement on the higher education College Entrance Exam (CEE) to be admitted
to it for a degree programme.
Parenting style: In this study it refers to the undergraduate first year university students’
recalled evaluation of their parents’ parenting style, using the parental responsiveness/
involvement and parental demandingness/control/strictness dimensions to consider parents as
practicing one of them (i.e., authoritative, authoritarian, indulgent/permissive, and
neglectful/uninvolved parenting styles), as measured using the PDQ.
Parenting dimensions: In this thesis it encompasses the parental responsiveness and parental
demandingness using both their sample medians values (high & low combination
simultaneously) to assign the parents into four categories based on their parenting style,
namely, authoritative, authoritarian, indulgent/permissive, and neglectful/uninvolved.
17
Parental responsiveness: In this research it denotes the level of warmth, responsiveness,
acceptance, involvement, and closeness offered by maternal and paternal figures, as perceived
/reported by first year university students and measured using the parental responsiveness sub-
scale.
Parental demandingness: It refers to the level of demands, supervision, requirements,
monitoring, standards, control, restrictiveness, and firmness implemented by maternal and
paternal figures, as perceived by first year university students about their parents and
measured using the parental demandingness sub-scale.
Dimensional approach: It signifies the parental responsiveness-demandingness aspect of
parenting style in which these two dimensions are separately and interactively used to serve to
analyse research questions whose nature is that of continuous variables.
Typological approach: It refers to the categories of parenting styles (authoritative,
authoritarian, indulgent, and uninvolved) which are basically formed using the responsiveness
and demandingness dimensions and served to analyse research questions which were
categorical in nature.
TEI: It denotes first year students’ self-perceptions of their emotional abilities, skills, and
personality characteristics that influence their ability to cope successfully with environmental
demands and pressures as they are measured through TEIQue, categorised into the four
broader factors: well-being, self-control, emotionality, and sociability.
1.5 SIGNIFICANCE OF THE STUDY
This research was designed to address the following contributions:
It is believed that the findings of the current study would be of importance in building
new empirical findings that would be replicated and referred to by others in the
future.
This study would provide new knowledge regarding the relationship among parenting
style/dimension, TEI, and first year students’ adjustment to university. Since there is a
paucity of empirical studies of this kind locally and internationally, it is believed that
18
the findings and implications of this study would be of great importance for higher
education institutions, educational practitioners, parents, and university students.
The outcome of this study is expected to strengthen the need to establish an EI and
adjustment based counselling intervention programme to mitigate the transition
trauma of university students’ encounters as they enter higher institutions.
The current study would provide decision makers and higher institution managers
with information about first year students’ adjustment to university life, in order to
use it to enhance the university climate so as to achieve optimal rates of adjustment.
Finally, it was anticipated that the findings of this study could be fruitful for parents
and family members to explain the roles played by parents in mentoring, loving, and
nurturing their youths with greater EI to make them well adjusted, productive, and
competent. Thus, interventions, counseling, and prevention areas will receive greater
support.
1.6 ASSUMPTIONS AND SCOPE OF THE RESEARCH
In this section, the major assumptions and the scope/delimitation of this research are
described.
1.6.1 Assumptions of the research
There are three key assumptions underlying the current research:
First, it was assumed that students in higher education institutions would have clear
and accurate perceptions of their parents’ past parenting style, their TEI, and their
adjustment level at university. In other words, information which would be provided
by the respondents, via questionnaire, on the respective constructs could be genuine.
Second, it was also assumed that the measures of parenting style/dimension, TEI, and
university adjustment developed in other cultural contexts and which would be
adapted to the Ethiopian cultural context would be cross-culturally valid. In other
words, the models of parenting style, TEI, and adjustment at university would be
applicable in the Ethiopian cultural context as well.
19
Third, it was also assumed that higher institution students find it challenging to adjust
socially and academically to the university environment.
1.6.2 Scope of the research
This research is focused on testing the mediation effect of TEI on the relationship between
parenting style/dimension and first year undergraduate students’ adjustment to university in
higher institutions of Ethiopia.
1.7 CHAPTER DIVISION
Over and above this chapter, the study comprises the following chapters:
Chapter 2, Review and related literature, encompasses the following aspects: Adjustment,
adjustment model/s, theories and empirical results, history, concept, models, and theories of
EI, the concept, theoretical, and empirical review of TEI, parenting style, models, and
empirical findings about parenting style, the relationship between and or among major study
variables including parenting style and TEI, parenting style and adjustment, adjustment and
TEI, the relationship between gender and TEI, and the relationship between gender and
adjustment.
Chapter 3, Research methodology, outlines the specific research design (quantitative research
will be motivated), sample and sampling techniques, the instruments used for collecting the
data, data collection procedure, the validity and reliability of the instruments, ethical
considerations, and methods of data analysis.
Chapter 4, Results of the study, discusses the analysis, summary of the collected data and
evaluation of the results in relation to each research objective.
Chapter 5, Discussion, presents a discussion of the present research findings in line with the
previous research results in the order in which the research objectives were analysed in
Chapter4.
20
Chapter 6, Summary and conclusions of the study, reports the summary, conclusion, the
strengths, limitations, and future directions, the practical, theoretical, and methodological
contributions, recommendations for future interventions/implications, and recommendations
for future research.
21
CHAPTER TWO
REVIEW OF RELATED LITERATURE
This chapter provides the reader with a summary of the literature on adjustment, EI, TEI,
parenting style and other variables related to the main study. In particular, the review is
presented in the following manner. First, a conceptual overview is undertaken on adjustment,
adjustment model/s, theories, and empirical results on adjustment. Second, the history and
concept, models and theories of EI are discussed. Third, the concepts, theoretical and
empirical reviews of TEI are addressed. Fourth, a comprehensive review of parenting style,
models, and empirical findings is presented. Fifth, the relationships between parenting style
and EI, parenting style and TEI, parenting style and adjustment, and adjustment and TEI are
considered. Sixth, a review on the background variable (gender) in relation to TEI and
adjustment to university is provided in line with the objectives stated in this study. And
finally, a conclusion on the review as a whole is offered.
2.1 ADJUSTMENT
This section encompasses very important aspects of adjustment, including the concept of
adjustment, the adjustment model in this research context, empirical results on adjustment
reviewed in previous research findings and the perceived social support contribution to
students’ adjustment at university.
2.1.1 Concept of adjustment
Adjustment is so complex a concept that, depending on the context, it has been defined in
different ways by various researchers and writers. Among the few that are mentioned here,
Sufian (2004) defined adjustment as the individual’s ability to fulfil his/her psychological
needs and his/her self-acceptance as well as enjoying life without any types of conflicts and
participation in social activities; while Ramsay, Jones, and Barker (2007) describe adjustment
as a dynamic process that could ultimately lead to the achievement of an appropriate fit
between the person and the environment. According to Salami (2011) it can also be defined as
a condition or state in which the students feel that their needs have been fulfilled and that their
behaviour conforms to the needs of the environment. In this study, adjustment is considered a
22
process by which first year students meet their academic, social, personal-emotional, and
institutional attachment demands in an acceptable manner, which is in line with the
description provided by Baker and Siryk (1984,1999).
2.1.2 Adjustment models in the context of life at university
The definitions given by scholars regarding adjustment were reported in section 2.1.1. Here in
this section, the model of adjustment in the context of life at university is discussed. In this
regard, there have been different adjustment models developed by researchers and
practitioners over almost the last sixty years, as per the contexts researchers wish to
investigate. But, for my research purposes, I came to note the following important dimensions
of adjustment to university already mentioned: the academic adjustment, social adjustment,
personal-emotional adjustment, and institutional attachment developed by (Baker & Siryk,
1989). Conceptually, each dimension of adjustment to university was described in Chapter 1
(section 1.1.1). The empirical results in relation to adjustment are discussed next.
2.1.3 Empirical results on adjustment to university life
Most first year students in their transition at university have experienced autonomy for the first
time. Despite this transition being a positive and exciting period, it has been found to be quite
challenging for some students (Wintre &Yaffe, 2000) as this event is accompanied by their
facing adjustment difficulties and challenges (Tinto,1996).
Various authors have described the types of demands and challenges faced by first year
university students. For example, Salami (2008) noted students face a variety of new demands
and challenges, such as developing study habits for the new academic environment, coping
with new evaluation systems and developing new patterns of mature interpersonal
relationships with professors and classmates. Raj (2012) underscored the challenges emanate
from encountering new cultures, separation from family, disengaging from high school
friends, financial pressures, making decisions about how to dress and eating foods to which they are
not accustomed. In addition to these, personal autonomy, social relationships, compatibility
amongst roommates, accessing support services, eating habits and adjustment to the academic
programme are some of the other transitional challenges (Wangeri, Kimani, & Mutweleli,
2012).
23
Therefore, it is evident that adjustment to university is multidimensional and demanding;
aspects differ in kind and degree and need diverse adjustment strategies (Baker & Siryk, 1984,
1989). Research results have indicated that on average, more than half of first year students
who join higher education experience difficulties during the transitional period (Briggs, Clark
& Hall, 2012). Raj (2012) and Sharma (2012) mentioned that they experience many academic
difficulties as well as emotional difficulties such as isolation, loneliness, stress, and depression
because of the complexity of the transition they have to make (Dyson & Renk, 2006; Friedlander
et al., 2007; Wintre & Yaffe, 2000).
The literature makes it clear that there are different adjustment patterns in the transition to
university. Previously published cohort studies have found that the first year is a difficult time
for university students (Cooke et al., 2006). However, Cooke et al. (2006) described patterns
of adjustment as a ‘U’ shape of adjustment, with students starting the first year displaying
elevated well-being, but deteriorating towards the middle of the year, yet recovering by the
end of that first year at university. In contrast, Gall, Evans, and Bellerose (2000) found a
pattern characterised by poor adjustment at the start of year one, with gradual improvement
over the course of that year that progresses in an upward line.
Sharma (2012) also discovered significant differences in the adjustment processes of first and
final year students concerning the social, emotional and educational areas (first year students
faced psychosocial adjustment problems after entering college, as compared to the final year
students who had adjusted to the social milieu of college and had thus become more
emotionally stable). In the study, results also indicated that due to different kinds of
unexpected pressures, first year students became emotionally regressed and experienced social
maladjustment.
How a student adjusts during his/her first year of college life lays a foundation for other events
during his/her college life (Baker & Siryk, 1984). For example, a study by Abdullah et al.
(2009) indicated that adjustment significantly predicted students’ academic performance,
especially academic adjustment, and personal-emotional adjustment. In particular, their study
showed that students who are well adjusted to university perform better academically. They
further reported that academic and personal-emotional adjustment together explained 32% of
the variance in students’ academic performance.
24
Considering the level of students’ adjustment across the adjustment dimensions, a study by
Azar and Reshadatjoo (2014) on Iranian university students indicated that 88% of the
respondents’ overall adjustment was at the moderate level, while only 7% obtained a high
level of overall adjustment and 5% were found to be in the low category for their overall
adjustment. Similarly, a study by Al-khatib, Awamleh, and Samawi (2012) on Al-balqa
university students indicated that students had an average level of adjustment, while
considering the specific domains, students had a better adjustment to the commitment to goals
followed by the social domain, but the academic and the personal domains were placed in the
last rank.
Therefore, as indicated there is a need to identify adjustment problems experienced by
students and appropriate intervention programmes should be planned for them. In this regard,
students who have a low adjustment level and who are encountering difficulties with their
studies should be given the appropriate counselling (Habibah et al., 2010). This is especially
true for new students who face problems in coping with the demands and challenges of
campus life.
2.1.4 Perceived social support and students’ adjustment at university
Developing new and effective relationships represents an important element of social
adjustment. In relation to this, Enochs and Roland (2006) found that students who are able to
connect with others in their new environment and gain social support adjust better than those
who are not able to build a new support system. Similarly, Salami (2011) also established
significant linear correlations between adjustment to college and social support (r= .36, *p
< .05).
Raj (2012) also reported that students who maintain compatible relationships with their
families are more likely to do well at university. Likewise, Winter’s and Yaffe’s (2000) study
found that good relations with parents help both male and female students to adjust. There is a
positive significant relationship between higher levels of social support from family
(specifically parents) and global, emotional and academic adjustment when first starting
university (Friedlander et al., 2007).
25
A study by Paramo, Martinez, Tinajero, and Rodríguez (2014) also confirmed that perceived
social support is a good predictor of adjustment to university (results ranged from 8.8% for
institutional attachment to 16.3% for social adjustment).
Surprisingly, students who experienced stress but reported high social support evidenced
relatively high adjustment compared to their low social support counterparts (Salami, 2011).
This is because the presence of social support gives them confidence which, in turn, helps
them in handling the academic, social, and personal-emotional challenges that they may have
faced as new students in their college. This implies that first year students need to obtain
actual social support from significant others or should be assisted to think that significant
others are by their side to make them feel confident when they are not alone. In the following
section the notions of, and theoretical and empirical explanations concerning, EI, and TEI are
discussed.
2.2 NOTIONS ABOUT EI
In the previous sections discussions were held on adjustment (theoretical and empirical), and
the importance of perceived social support for first year university students’ adjustment to
university. In this section, a discussion is first carried out on EI, followed by a consideration of
TEI. The rationale of raising the issue of EI is that it is the root from which TEI is derived.
Thus, informing readers about EI is pivotal. As a consequence, a discussion on EI begins from
its historical development.
2.2.1 History and background of EI
The distal root of EI was related to Thorndike’s (1920) concept of social intelligence.
Thorndike (1920) developed and used the concept social intelligence to refer to the ability to
understand and manage people and to act wisely in human relations. In fact it was later that the
construct was introduced in the form in which one of its current manifestations appears
(Mayer & Salovey, 1990). EI was brought into prominence in both the academic and popular
press in the past few decades by Daniel Goleman’s (1995) best-selling book: he defined EI as
a person’s ability to know his/her own emotions, to control him/herself, to motivate
him/herself, to understand other people’s feelings and to positively handle interpersonal
relationships.
26
2.2.2 Definition of EI
In this section, definitions are provided for EI. Currently, although there are several definitions
and measures of EI, basically, there are certain elements that many of the attempts share. For
instance:
The competencies of perception, understanding, utilising and managing emotions
effectively in the self and others comprise the core of EI (Mayer, Salovey, & Caruso,
2004, 2008).
Bar-On (2006) defined EI in terms of emotional and social skills that influence our
understanding and expression of ourselves, our understanding of others and
interaction with them, and the ability to deal with every day demands.
Additionally, Bar-On (1997, p.14) defined EI as “an array of non-cognitive
capabilities, competencies, and skills that influence one’s ability to succeed in coping
with environmental demands and pressures.”
EI- it is associated with adaptability, stress management, self-awareness, resiliency
and interpersonal relationships (Bar-On, 2004).
It is the capability of monitoring one’s emotions and others’ emotions and
manipulating the information for managing one's thoughts and actions, regulating
emotion in self and others, and utilising suitable emotions for solving, actively and
effectively, daily difficulties and obstacles (Mayer et al., 2004).
EI- it refers to the mental processes involved in recognising, using, understanding,
and managing one’s own and others’ emotional states to solve problems and regulate
behaviour (Mayer & Salovey, 1990, 1997).
As one noted in the above definitions provided by EI theorists there seem to be shared
elements, but the most salient feature of EI is that it can be viewed as the reason why
individuals differ to the extent that they do and with respect to the way in which they process
and use emotional information from within themselves and from others during interaction
(Petrides & Furnham, 2003).
The theory of EI presented by Mayer and Salovey (1990, 1997) posits that the ability to
recognise, understand, use, and manage emotions contributes to adaptation in various realms
of life. Here, in this thesis, EI as conceptualised by Mayer and Salovey (1990, 1997) was taken
27
as a benchmark for investigating TEI. Based on the said definition, EI theories are discussed
below.
2.2.3 EI theories
While there are disagreements about the exact nature of EI, several theories exist. When
researchers initially developed measurement tools for EI, they assumed that they were
measuring a single, uniform construct. Currently, there are two major theoretical perspectives
on the nature of EI: ability-based and trait-based. As a result, the assessment tools are
constructed in one of two ways–either as a self-report measure or as an ability measure. The
ability-based approach conceptualises EI as a set of emotion-related cognitive skills located
comfortably with other aspects of cognitive intelligence involving cognitive processing of
emotional information (Mayer et al., 2008). Like other mental abilities, AEI is measured
through maximum-performance tests, where respondents are asked to solve problems
involving reasoning about emotions and using emotional information to facilitate reasoning.
On the other hand, the trait-based approach conceptualises EI as a set of emotion-related
dispositions, attitudes and self-perceptions located at the lower levels of the hierarchical
personality taxonomy (Petrides & Furnham, 2001; Petrides, Pita, & Kokkinaki, 2007). The
most influential trait-based theories of EI include Bar-On’s (2000) model of emotional-social
intelligence, operationalised with the Emotional Quotient Inventory (EQ-I) (Bar-On, 1997),
and the TEI theory by (Petrides et al., 2007), operationalised with the TEIQue (Petrides,
2009). Similar traits are measured by the TEIQue under the broad factors of emotionality, self-
control, sociability and well-being.
Under the umbrella of EI, for this research purpose the trait model is accounted for, especially
traits that are measured using the TEIQue’s four factors. For instance, research on the Bar EQ-
I, one of the most widely used self-report EI measures (Bar-On, 1997) is consistently linked
with established personality and cognitive ability constructs. In fact, trait measures using the
TEIQue are also linked with established personality factors but not, or only to a minimal
degree, with cognitive ability constructs which are a little more meaningful in the context of
this thesis than the Bar EQ-I.
To conclude this section, I consider that the information provided to the readers of this thesis
will allow them to comprehend the difference between AEI and TEI theories and how TEI is
28
measured using the given four factors. In the following section, the definitions of and
empirical studies on TEI are discussed.
2.2.4 TEI: Conceptualisation and empirical studies
Basically, the concept of TEI was described so as to make the difference between it and the
performance-measured emotional skills AEI explicit (Petrides & Furnham, 2001). TEI can be
defined as follows:
It is the ability to perceive accurately, appraise, and express emotion;
the ability to access and /or generate feelings when they facilitate
thought; the ability to understand emotion and emotional knowledge;
and the ability to regulate emotions to promote emotional and
intellectual growth. (Mayer & Salovey, 1997, p.35)
The construct TEI can also be defined as:
A constellation of emotional self-perceptions located at the lower levels of
personality hierarchies, and it is measured via self-reports (Petrides et al., 2007).
Moreover, it is also defined as:
Emotion-related behavioural dispositions and abilities related to personality (Petrides
& Furnham, 2001).
TEI can also be broadly defined as:
Emotional self-efficacy involves individuals’ subjective evaluations of their abilities
to understand and manage emotion (Mikolajczak, Menil, & Luminet, 2007; Petrides
& Furnham, 2001).
TEI is also defined as:
It concerns peoples’ self-perceptions of their emotional abilities and skills,
personality characteristics and behavioural dispositions that influence their ability to
cope successfully with environmental demands and pressures (Petrides, 2010).
29
Given the information from all above definitions, therefore, the last definition could be
regarded as the most viable one in the context of this study because, from experience and as
has been stated above and in much of the literature, university students encounter new
demands and pressures as they enter the new university environment. Therefore, it is when
students actually perceive their emotional abilities, skills, personality characteristics, and
behavioural characteristics that they can cope with the environmental demands and pressures
that really exist in the university context, the subject of this thesis.
TEI essentially concerns individual differences in one’s self-perceptions of one's emotional
abilities. Both theoretically and empirically, a number of factors have been related to TEI. For
instance, researchers have suggested that people (adults) with higher TEI are considered to
have a better capability to perceive, recognise, and manage emotion, which in turn facilitates
their emotional development (Mayer & Salovey, 1997); they tend to display less negative
stress responses than people with low TEI (they make less negative appraisals), feel more
competent to cope with situations (Mikolajczak & Luminet, 2008), and report fewer somatic
complaints as well (Mavroveli, Petrides, Rieffe, & Bakker, 2007). There is also evidence that
TEI is associated with better mental/physical resistance to stress (Salovey, Stroud, Woolery, &
Epel, 2002, using the Trait Meta-Mood Scale (TMMS), and mental well-being (Andrei &
Petrides, 2013).
2.3 PARENTING STYLE
In the previous sections, TEI (definitions, theoretical and empirical studies on it)
characteristics are highlighted. In this section a similar procedure is followed: that is, a
definition of parenting style is presented first, followed by a discussion of theoretical and
empirical studies on this style.
2.3.1 Conceptualisation of parenting style
Parenting style is viewed by different researchers and scholars in a very similar way. Thus, in
this research the common definition of it is taken into account, so that it is defined as follows:
‘’A constellation of attitudes toward the child that are communicated to the
child and that taken together, create an emotional climate in which the
parent’s behaviors are expressed’’ (Darling & Steinberg, 1993, p. 488).
30
Basically, Baumrind’s (1971) work and Maccoby and Martin’s (1983) work later asserted four
unique parenting styles representing the predominant parenting style typologies (authoritative,
authoritarian, permissive/indulgent, and neglectful/uninvolved) characterised along two
parenting dimensions: responsiveness (warmth) and demandingness (strictness). Each of these
parenting styles reflects different patterns of parental values, practices, and behaviours, along
with a distinct balance between responsiveness (warmth) and demandingness (strictness).
Responsiveness is operationalised using measures of parental warmth and acceptance whereas
demandingness is conceptualised as the standards and demands set by parents.
Having gained an understanding about the two dimensions of parenting, it is important to
discuss the four parenting styles using the said dimensions.
Authoritative parents – these are parents who are high on demandingness and high on
responsiveness, and attempt to direct their children’s activities using warmth and
positivity during communication. In other words, the authoritative style maintains a
balance between high levels of demandingness and affection. Such parents reinforce
socially responsible and mature behaviour through praise and manifestations of
affection, offering support, encouraging communication and valuing their children’s
points of view (Karavasilis, Doyle, & Markiewicz, 2003).
Authoritarian parents- these are parents who are high on demandingness and
directive, but low on responsiveness, and attempt to shape, control, and evaluate their
children’s behaviours and attitudes. In short, the authoritarian parenting style is a
pattern of power-assertive behaviours of the parents. They are highly demanding but
unresponsive (low affection), emphasising obedience, respect for authority and the
maintenance of order through discipline based on power and severe (usually physical)
punishment, expecting that rules will be complied with without offering their children
a chance to negotiate (Baumrind, 1997).
Permissive/indulgent parents- these parents are characterised by being low on
demandingness, high on responsiveness and are highly accepting, making few
demands, and allowing their children fundamental self-regulation. The
permissive/indulgent style offers a pattern of warmth and acceptance, but lacks
adequate monitoring of a child’s behaviours. In other words, parents are more likely
to exhibit responsiveness than demandingness (Baumrind, 1997).
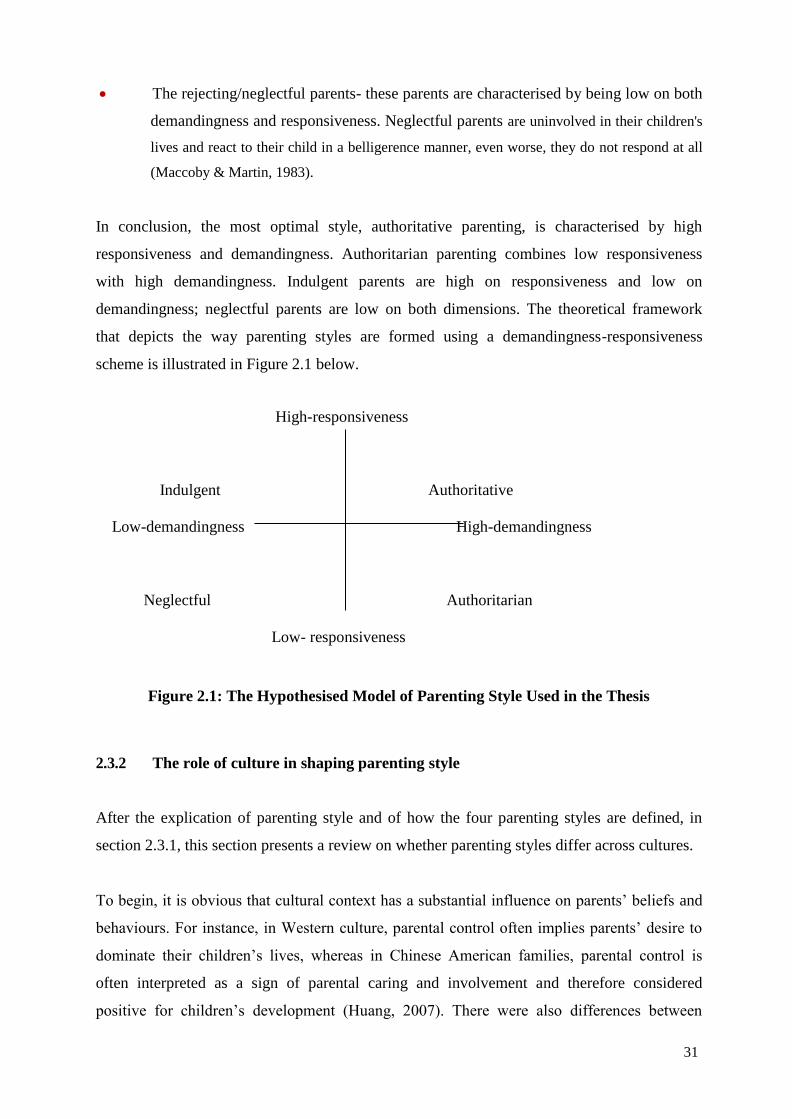
31
The rejecting/neglectful parents- these parents are characterised by being low on both
demandingness and responsiveness. Neglectful parents are uninvolved in their children's
lives and react to their child in a belligerence manner, even worse, they do not respond at all
(Maccoby & Martin, 1983).
In conclusion, the most optimal style, authoritative parenting, is characterised by high
responsiveness and demandingness. Authoritarian parenting combines low responsiveness
with high demandingness. Indulgent parents are high on responsiveness and low on
demandingness; neglectful parents are low on both dimensions. The theoretical framework
that depicts the way parenting styles are formed using a demandingness-responsiveness
scheme is illustrated in Figure 2.1 below.
High-responsiveness
Indulgent Authoritative
Low-demandingness High-demandingness
Neglectful Authoritarian
Low- responsiveness
Figure 2.1: The Hypothesised Model of Parenting Style Used in the Thesis
2.3.2 The role of culture in shaping parenting style
After the explication of parenting style and of how the four parenting styles are defined, in
section 2.3.1, this section presents a review on whether parenting styles differ across cultures.
To begin, it is obvious that cultural context has a substantial influence on parents’ beliefs and
behaviours. For instance, in Western culture, parental control often implies parents’ desire to
dominate their children’s lives, whereas in Chinese American families, parental control is
often interpreted as a sign of parental caring and involvement and therefore considered
positive for children’s development (Huang, 2007). There were also differences between
32
African American and European American parenting styles (Baumrind, 1972; Steinberg,
Dornbusch, & Brown, 1992), while Asian-American parenting was found to be highly
authoritarian (Steinberg et al.,1992).
Super and Harkness (1986) also observed that parents socialize their children in line with the
cultural values and norms prescribed by their respective cultures. Thus, parents from different
cultural contexts may endorse different socialization goals for their children (Tamis-LeMonda
et al., 2008). Rudy and Grusec (2006) also indicated that parenting behaviour exhibited by
members of different cultural groups is associated with different parental beliefs and cultural
values because cultural values are transmitted to the next generations through the values
families adopt in child rearing.
Parenting styles could also differ from one culture to another depending on whether these are
individualistic or collectivistic ones. In this regard, an authoritative parenting style is more
consistent in the Western culture, whereas an authoritarian parenting style is consistent in the
Asian culture- which allows for the parents to become authority figures and gives them an
important role as parents (Keshavarz & Baharudin, 2009). Similarly, a study by Jambunathan
and Counselman (2002) reported that authoritative parenting is more common in Western
cultures than in the Eastern cultures, where authoritarian parenting is most common.
Contrary to the above hypotheses, another study by Garcia and Gracia (2009) was undertaken
with Spanish (an individualistic culture) adolescents aged 12 to 17 years old to identify
whether an authoritative parenting style is the best parenting style for children development.
In the study, adolescents were classified in terms of their experience of four parenting styles
(authoritarian, authoritative, permissive, and neglectful), but the results of this research
showed that most Spanish parents have adopted a permissive parenting style.
While considering the parenting styles practiced in the Ethiopian cultural context i.e. a
collectivist culture), Habtamu (1995) concluded that an authoritarian parenting style was
predominantly employed among the families of Ethiopia. However, certain studies found that
the authoritative parenting style was predominantly practiced in the families of the country
(Seleshi, 1998; Seleshi & Sentayehu, 1998; Yekoyealem, 2005). Nevertheless, some other
studies revealed that the most commonly practiced parenting style in Ethiopian families
differed according to the child’s gender. For example, studies by (Kassahun, 2005; Seleshi,
33
1998; Seleshi & Sentayehu, 1998), undertaken with a sample of junior secondary school
students indicted that parents were authoritative towards their daughters, but authoritarian as
regards their sons.
Another study by Kassahun (2005) on a sample of high school students reported that an
authoritative parenting style was most frequently employed for daughters, whereas a
neglectful parenting style was the most commonly adopted parenting style for sons. He
observed the predominance of a neglectful parenting style for high school males: that when
males enter high school the parents were of the opinion that their sons could manage
themselves, and as a result they reduced their control as well as their close relationships,
whereas for females a caring relationship and follow up is predominantly practiced.
Overall, the differences between treatment of sons and daughters is not unique to Ethiopia but
in accord with other research findings as well. For instance, considering gender differences,
girls perceived both mothers and fathers as less accepting and involved and stricter with boys
than with girls. In other words, females are more often and better supervised by parents than
their male peers are (Maggio & Zappulla, 2014).
Consequently, the studies conducted so far in Ethiopia do not provide clear evidence to
conclude which parenting style is most commonly adopted by the families of that country.
This calls for further study, to fully grasp which type of parenting style is dominantly
practiced in the families of Ethiopia, with or without considering gender. Therefore, the
current study attempted to assess the type of parenting style predominately adopted in the
families of Ethiopia.
2.3.3 Reasons to question the parenting style paradigm
As may be understood from section 2.3.2 of the review, parenting style is influenced by the
culture (individualistic vs collectivist, western and Asian) and by gender. Therefore, there is a
need to critically question the parenting style carried out in other research and there are thus
compelling reasons to revisit and question the parenting-style paradigm. In the previous
parenting style studies, there were gaps which I found that needed to be addressed. In this
regard, the majority of the previous research on the effects of parenting was focused on
maternal parenting styles, due to the assumption that mothers were primarily responsible for
the child-rearing process. Be that as it may, the role of the father in caring for children has
34
increasingly been recognised as being important in family life (Cabrera, Tamis-LeMonda,
Bradley, Hofferth, & Lamb, 2000). Therefore, the fathers’ role in parenting was also
considered in the present research; i.e., the role that each parent’s parenting style plays was
taken into account in this thesis.
There are differences between maternal and paternal parenting styles which, in turn, have
different effects on children. In this regard, previous research by Winsler, Madigan, and
Aquillino (2005) on the association between maternal and paternal parenting styles reported
low levels of similarity between parents’ parenting styles. This dissimilarity between parenting
styles can be taken as a factor in the development of emotional and behavioural problems in
children. For example, Dwairy (2010) also investing the effect of dissimilarity in parental
authoritarianism on the psychological well-being of adolescents and found that parental
dissimilarity was associated with higher scores on a global measure of psychological
problems.
Another reason to revisit the parenting-style paradigm concerns methodology. The present
study focuses on retrospections by respondents on how parents have treated them since each
respondent’s childhood period. Use of retrospective reports of parental values and practices is
of interest to researchers for understanding parenting styles (Sabattini & Leaper, 2004).
Therefore, the present study advances the current body of work by assessing whether
established parenting styles from childhood—authoritative, authoritarian, indulgent, and
neglectful - as remembered by university students, predict university adjustment and TEI.
As indicated, there seems to be a gap on the issues of parenting styles in the existing literature.
Therefore, it is important to check the effect of both parents’ parenting styles on first year
university students’ TEI and their adjustment to their university life rather than to focus on just
one parent’s influence. For this reason, it was anticipated that the present research would
overcome and fill-in the abovementioned gaps and provide insight on the effects on their
university-life adjustment as well as on their TEI through collecting data from university
students based on their memories of both parenting styles’.
Generally, the present study focuses on (a) assessing the association between remembered
parenting styles and university-life adjustment and TEI; (b) the research utilised the four
established parenting styles from the child development literature; and (c) focused on two

35
dimensions of parenting (i.e., responsiveness and demandingness) and both parents’ parenting
styles (maternal and paternal parenting styles).
2.4 THE RELATIONSHIP BETWEEN MAJOR STUDY VARIABLES
The previous sections described how the parental dimensions form the four parenting styles
and the type of parenting styles practiced in the West, in Asian culture and in Ethiopia.
Moreover, with regard to the parenting style paradigms, the limitations that existed in the
earlier literatures and the strategies considered to overcome the existing limitations in this
thesis were discussed. This section, however, reports on the relationship between parenting
style and TEI, parenting style and adjustment to university life, and adjustment and TEI, in
this order.
2.4.1 Parenting style and TEI
In this section the review is presented first, using the relationship between parenting style and
EI as an introduction, and moves on to consider the relationship between parenting styles and
TEI. To begin with, in recent years programmes which increase emotional and social skills
that acknowledge the importance of togetherness and cooperation have been prepared and
implemented at workplaces and schools in many developed countries (Alegre, 2011). When
one notes the results of these programmes and the increase in social interaction/cooperation in
the new generation the importance of EI is revealed.
One of the benefits of EI is that it can be acquired, because individuals can learn, develop, and
improve their EI (Brown & Moshavi, 2005; Harms & Crede, 2010). Therefore, the role parents
play in the improvement of children’s EI should not be overlooked.
As regards the specific influence of perceived parenting style on TEI, a study was carried out
by Herzog, Hill-Chapman, Hardy, Wrighten, and El-Khabbaz (2015) to investigate the
relationships between parenting styles and emotion regulation, trait emotion, and general well-
being of 153 adolescents. The results revealed that perceived parenting styles contribute to
both emotional regulation and trait emotionality.
A study was undertaken by Schnuck and Handal (2011) to see if the relationships that were
found between perceived parenting style and student adjustment were mediated by personality
36
traits. Analysis revealed that these traits were not found to do so. In their study it became
apparent that the mechanism by which parenting is related to adjustment and adaptation to
college is largely not due to personality traits. Since TEI is something found in the lower level
of personality dimensions, this finding may hold true for the mediating effect of TEI on the
relationship between perceived parenting style and adjustment. However, Liau et al. (2003)
demonstrated that TEI moderates the relationship between parental behaviours and children’s
adjustment.
To conclude, EI and its aspect of TEI are directly or indirectly related to parenting styles. The
following section presents the relationship between parenting styles and adjustment to
university, which suggested that it would be possible to establish an overall link among the
major variables included in this thesis.
2.4.2 Parenting style and students’ university adjustment
One of the prime objectives of this research was to discover whether adjustment is influenced
by parenting styles. Consequently, in this section, reporting the relationship between parenting
style and adjustment is pivotal: this, in turn, helps to compare and contrast the existing
findings with the present research results in the discussion section later in this thesis. In this
regard, previous studies were devoted to exploring the different parenting styles and the
related outcomes for children. For instance, the Wintre and Yaffe (2000) model proposed a
developmental sequence determining students’ adjustment at university.
It was theorised that students’ pre-entry characteristics and experiences (with a focus on
relations with parents) influence participation in the formal and informal aspects of the
academic and social systems of the university, thereby shaping their academic and social
integration. Accordingly, the students’ pre-entry attributes include gender and parents’
parenting styles; as mentioned, these attributes impact on academic and social integration into
the university, as well as personal- emotional adjustment, to such issues as university goals
and school commitment.
In particular, parenting styles are associated with children’s levels of well-being (Lamborn et
al., 1991). Furthermore, positive/supportive parenting, characterised by high levels of warmth,
democratic discipline and involvement/supervision, has been reported to be associated with
lower levels of depressive symptoms and adjustment problems in Chinese American youth
37
(Kim & Ge, 2000) and associated with positive adjustment to college (Mounts, 2004; Mounts,
Valentiner, Anderson, & Boswell, 2006).
Considering the specific parenting typologies/styles, developmental research demonstrates that
authoritative parenting predicts many positive outcomes for children and adolescents when
compared with authoritarian, indulgent, and uninvolved parenting (Coplan, Hastings, Lagace-
seguin, & Moulton, 2002; Steinberg, 2001). Among the parenting styles, authoritative
parenting is related to adolescents’ social competence (Garcia & Gracia, 2009; Kazemi,
Ardabili, & Solokian, 2010); they encounter fewer behavioural problems (Lamborn et al.,
1991), attain better academic and socio-emotional competence (Steinberg, 2001; Winter&
Yaffe, 2000), and have greater success in their academic adjustment in a college setting
(Hickman, Bartholomae, & Mc-Kenry, 2000).
Schnuck and Handal (2011) in their study attempted to determine if perceived parenting style
was related to adjustment as reported by college freshmen in their first semester of school.
These authors established that such a style was associated with different adjustment variables:
for example, permissive parenting was correlated with negative adjustment whereas
authoritative parenting was correlated with positive adjustment. Despite the statistically
significant relationships between parenting style and adjustment, the magnitude of the
relationships was generally found to be low.
On the other hand, a study by Garcia and Gracia (2009) reported that both the indulgent and
authoritative parenting styles, rather than authoritarian and neglectful parenting, were
associated with higher self-esteem and social competence. In addition, a study by Kazemi et
al. (2010) on Iranian girls similarly found that permissive parenting, rather than authoritarian
and neglectful parenting styles, was associated with high social competence scores. Yet the
positive relationship between permissive parenting and adolescents’ social competence
contradicts some studies (Groot, 2009). A study by Wintre and Yaffe (2000) also indicated
that the authoritative parenting style was shown to positively contribute to students’ ability to
successfully adjust to university life, whereas the authoritarian parenting style negatively
contributed to this transition.
Beyers and Goossens (2003) indicated that regardless of students’ grade, gender or perceived
parenting style, high levels of independence from parents predicted higher levels of adjustment
to university. This finding implies that a certain degree of independence in the relationship
38
with parents and positive feelings associated with this separation predict better adjustment at
university for males and females; for freshmen and juniors. In the research high levels of
independence from parents (.37, *p < .001) and positive separation feelings (.60, *p < .001)
also predicted significantly higher levels of adjustment to university (Beyers & Goossens,
2003).
Although there are abundant studies that have examined the associations between parenting
styles and developmental outcomes at a younger age, just a few studies have investigated the
parenting influences on adjustment outcomes at late adolescence. In this regard, for example,
retrospective reports by those in the late stage of their adolescence about the positive parenting
they had experienced as children were significantly related to the quality of their current
relationship with others and adjustment outcomes (Dalton, Frick-Horbury, & Kitzmann, 2006;
McKinney & Renk, 2008). There is also a clear and well established relationship between
parents’ parental behaviours during their children’s childhood and early adolescence and their
children’s maladjustment during late adolescence (Parmar & Rohner, 2005).
More importantly, a study on parenting styles in relation to adjustment associated with the
authoritative, authoritarian, permissive, and neglectful parenting styles, using Analysis of
variance (ANOVA), indicating differences in youth adjustment (Kerr, Stattin, & Ozdemir,
2012), and post hoc tests confirmed that youths with authoritative parents were significantly
better adjusted on all measures than those with neglectful parents.
From the typological approach, regarding the variations in adolescent adjustment as a function
of maternal and paternal parenting styles, the results indicated that parenting styles are related
to adolescents’ adjustment. For both parents, a neglectful parenting style seems to play a role
which increases risk in adolescents’ adjustment (Maggio & Zappulla, 2014). The results also
showed that parental strictness/supervision performs the most protective role for boys’
adjustment: both fathers and mothers promote this by monitoring and controlling their children
rather than by providing affection and emotional support. The results also suggest the
importance of focusing particular attention on the dimension of parental strictness/supervision
and on its relationship with adolescents’ adjustment (Maggio & Zappulla, 2014).
2.4.3 Adjustment to university and TEI
In section 2.4.2, the role of parenting style/dimension in students’ adjustment to university was
39
presented. This section focuses on the investigation into whether TEI predicts adjustment
which in turn, paves the way to examine the mediating effect of TEI on the relationship
between parental dimension and adjustment. A detailed discussion follows in the chapter
dealing with the result and the discussion chapters that follow in the thesis. This section
presents the overall importance of the relationship between EI and adjustment first, followed
by the relationship between TEI and adjustment.
To begin with, there is a significant positive relationship between students’ level of EI and
academic adjustment among first year university students (Abdallah et al., 2009; Yip &
Martin, 2006), and EI contributes positively to social competence (Brackett, Rivers, Shiffman,
Lerner, & Salovey, 2006; Yip & Martin, 2006). Furthermore, studies carried out with
adolescents further suggest that the capacity to decode, understand, and regulate emotions,
manage interactions with other people, and manage relationships were associated with social
and academic adjustments (Goleman, 1998; Low & Nelson, 2005; Mayer & Salovey,1997).
Furthermore, a review of literature pertaining to EI suggests that individuals with a higher than
average EQ are in general more successful in meeting environmental demands and pressures
(Bar-On & Parker, 2000), are more likely to be successful academically and also in demanding
interpersonal situations (Grehan, Flanagan, & Malgady, 2011). A possible explanation for this
finding could be that the students possessed the ability to access, understand, express and
regulate emotions, which resulted in promoting their emotional and intellectual growth. This
resulted in helping them to cope adaptively with their academic, social and personal-emotional
challenges in their new environment.
Considering on the specific TEI, a study by Poulou (2010) on the relationship between TEI
and students’ emotional and behavioural strengths and difficulties demonstrated that the
emotion-related self-perceptions and dispositions included in the TEI inventory predicted
adolescents’ emotional and behavioural strengths and difficulties. In the study, compared to
their low TEI counterparts, students with high TEI scores were less likely to present
emotional, conduct, hyperactive and peer problems and were more likely to report pro-social
behaviour.
Building on previous empirical work on the influence of self-efficacy and skills knowledge
(Bandura, 1986), both TEI, specifically emotional self-efficacy, and AEI have independent
effects on academic outcomes because there are differences between beliefs about the ability
40
to perform a behaviour and actually performing that behaviour. TEI is important for university
adjustment, primarily because emotional self-efficacy is an important aspect of that construct
(Petrides et al., 2007), which should influence how students persevere in the face of academic
difficulties and how resilient they are to academic stressors.
TEI could also predict the academic achievement of university students (Austin et al., 2005;
Parker et al., 2004), first-year undergraduate retention (Parker et al., 2006; Qualter, Whiteley,
Morley, & Dudiak, 2009) and their successful social adjustment at university (Engelberg &
Sjoberg, 2004), which in turn, might aid adjustment (Christie, Munro, & Fisher, 2004). Most
importantly, TEI is correlated with social competency (Mavroveli et al., 2007); and measures
of social adjustment in older adolescents and adults (Chapman & Hayslip, 2005; Engelberg &
Sjoberg, 2004).
2.5 THE RELATIONSHIP BETWEEN GENDER AND MAJOR STUDY
VARIABLES
In section 2.4.3 the relationships between EI and adjustment, TEI and adjustment and their
associated implications were reported. In this section, the relationship between TEI and gender
is considered first, followed by that between adjustment and gender. The rationale for focusing
on the background variable of gender per se in this section of the review, in relation to TEI
and adjustment is that one of the objectives of this study was to examine whether TEI and the
adjustment score difference exists in terms of gender. Therefore, presenting reviews of
literature in this section regarding the issue under consideration is appropriate; later in the
discussion an attempt is made to compare the present study with the previous findings.
2.5.1 Gender and TEI
So far researchers have undertaken studies on demographic variables (such as age, sex, family
income, education level of parents, and place of residence) of individuals in relation to EI. For
instance, a study by Yelkikalan et al. (2012) revealed that EI scores differ according to sex,
which is that men display higher averages in wellbeing, self-control and sociability factors and
that this difference is statistically significant (*p <.01) in wellbeing and sociability factors.
Women have higher averages than men in terms of emotionality factors: there is a significant
(*p< .05) difference. Similarly, research by (Austin et al., 2005; Harrod & Scheer, 2005)
revealed that EI scores were significantly different between females and males, with females
41
reporting higher EI levels, thereby, Austin et al. and Harrold’s and Scheers’s researches differ
from those of Yelkikalan et al. (2012) in that theirs revealed that female students possess an
overall higher level of EI in comparison to male ones.
Similarly, a study on TEI revealed gender differences, in which girls scored higher than boys
(Downey et al., 2008; Mavroveli et al., 2008). A study by Mikolajczak, Luminet, Leroy, and
Roy (2007) also reported that with the exception of the factor well-being, their findings
revealed significant gender differences i.e. women scored significantly higher on emotionality,
whereas men scored significantly higher on self-control and sociability. However, in the
global TEI score, men had higher scores than women (Mikolajczak et al., 2007). Such a result
was consistent with the one obtained using the English version of the TEIQue (Petrides &
Furnham, 2000).
On the other hand, a study by Antoniou, Kaprara, and Drosos (2016) on the relationship
between TEI and the vocational interests of Greek 10th and 11th grade students indicated that
no demographic variables (gender, place of residence, family salary) were found to have an
effect on the scores of their TEI; the only demographic variable that had significant effects on
TEI levels was the fathers’ educational level. Similarly, irrespective of the measurement tool
used, a result in a study by Poulou (2010) indicated that there were no significant differences
between gender and TEI. To conclude, though the relationship between TEI and gender seems
mixed, it is cautiously concluded that TEI seems influenced by gender.
2.5.2 Gender and students’ adjustment to university
In section 2.5.1 the relationship between gender and EI/TEI was noted, where most sources
depicted that the relationship between TEI and gender is somehow mixed, implying that
further consideration of the issue is necessary. In this section, the relationship between gender
and adjustment is considered.
With regard to gender, there was no significant difference in the adjustment problems of male
and female college students (Sharma & Kermane, 2015). Similarly, Salami (2011) indicated
that gender did not predict adjustment to college (r = .09, p > .05). More importantly, Al-
khatib et al. (2012) determined that adjustment to college life is not based on gender, study
level, college or interaction between them; rather, it was related to other factors such as future
42
anxiety about jobs after finishing the university or emotional instability or other problems
related to academic achievement.
A study by Clinciu (2013) also found that the difference between male and female students
was not statistically significant for the total score on the SACQ, in the research. Nevertheless,
when the adjustment of the specific dimensions was considered, the males were much better at
adaptation for social and personal-emotional dimensions, whereas female students compensate
for this gap with better scores at academic adjustment. A similar result revealed that women
show poorer emotional and social adaptation, although they are better adjusted academically
(Abdullah et al., 2009). However, a statistically significant gender difference was not
discovered with respect to social and academic adjustment among undergraduate students at
university (Kyalo, 2011).
Moreover, a study by Wang and Zhang (2015) indicated that there was no significant
difference between male and female college students with regard to adaptability, but the
males’ score was significantly higher than that of female students in terms of their
physiological adaptability, learning adaptability and social adaptability factors; however, on
the interpersonal adaptability factor, the score of the female students was higher than that of
the male ones.
Even when taking the moderating effect of gender on the relationship between EI and social
adjustment and EI and academic adjustment into account (Ishak, Jdaitawi, Ibrahim, &
Mustafa, 2011) found that gender was not an important moderating factor in the relationship
between these research variables.
On the other hand, the factor of gender difference supports the argument that male students
adapted to the new university environment better than their female counterparts (Abdullah et
al., 2009; Enochs & Roland, 2006; Winter & Yaffe, 2000) because separation anxiety seemed
to affect females more than male students (Raj, 2012); thus, males tend to isolate themselves
and escape, whereas females are more likely to seek emotional assistance (Enochs & Roland,
2006).
43
2.6 CONCLUSION
In this part, basic issues from each part of the review are emphasised so that readers are able to
gain insights into the implications of the review of related literature. To begin with, various
definitions of adjustment were discussed. Many first year students are challenged by a variety
of new demands. Due to transitional challenges, therefore, adjustment to university life
appears difficult.
The theory of EI proposed by Mayer and Salovey (1990, 1997) was emphasised in this thesis;
it posits that the ability to recognise, understand, use and manage emotions contributes to
adaptation in various realms of life. There are two major theoretical perspectives on the nature
of EI: AEI and TEI. Among them, the TEI model would account for, in particular, traits that
are measured using the TEIQue four factors of emotionality, self-control, sociability, and well-
being. The definition of TEI considered in this research context focuses on Petrides’ concept
(2010) - people’s self-perceptions of their emotional abilities and skills, personality
characteristics and behavioural dispositions that influence their ability to cope successfully
with environmental demands and pressures. Since university students encounter new demands
and pressures as they join in the new university environment, adopting this definition in this
research context is admissible.
The other variable which was accorded due attention in this research is the parenting
style/dimension. Thus, attention was given to the definition of parenting style, and to how to
form the four parenting style categories using both the median values of the two parenting
dimensions: responsiveness (warmth) and demandingness (strictness) employed for this
research. Moreover, attention was also paid to whether culture shapes parenting styles; hence,
empirical studies were reported, specifically taking the experiences of the collectivist and
individualistic countries into account. Due to the limitations noticed from previous literature
on the parenting style model, it was thoroughly evaluated and possible remedies were
suggested and implemented in this thesis.
For some authors, EI is considered as a learned characteristic, while for others it is an innate
one. In relation to the first notion, studies have shown that EI is often expanded and developed
by training (Bar-On, 2000) and it is an ability that can be learned. Therefore, one of the
benefits of EI is that it can be acquired, because individuals can learn, develop and improve
their EI. Thus, the roles which parents played in the improvement of children’s EI in general,
44
and TEI in particular, were considered in this thesis. Therefore, there it seems logical to
recognise the relationship between parenting style and TEI.
One of the prime objectives of this research is to investigate whether adjustment is influenced
by parenting style. To examine this issue critically, a review was conducted on the two
variables under consideration that pave a way to compare and contrast the present findings
with the previous ones. Furthermore, in line with one of the objectives of this thesis, the
relationship between TEI and adjustment was thoroughly reviewed.
In addition, the relationship between gender and TEI and adjustment was discussed because
the issue of gender in relation to the mentioned variables was one of the motivations of this
study. A study on TEI revealed gender differences in some research results whereas no
differences between gender and TEI were identified in other research, while sometimes the
differences were small and insignificant; therefore, the results of the existing literature are
mixed. This implies that there is a need to undertake further study on this issue. Concerning
gender and students’ adjustment at university, most previous research results underscored that
gender did not predict adjustment. Finally, the next chapter gives emphasis on the research
methodology.
45
CHAPTER THREE
RESEARCH METHODOLOGY
This chapter focuses on research design, population, sample and sampling methods, data
collection instruments, pilot testing, ethical issues, the data collection procedure, and methods
of data analysis.
3.1 RESEARCH DESIGN
In this study, the relationships between perceived parenting style/dimension, TEI, and
university adjustment amongst first year students were examined. The study employed
descriptive survey research in which parenting dimensions (parental demandingness and
responsiveness) stood as the independent(exogenous) variables, while TEI as the dependent
(in the one way ANOVA and Independent sample T-test analysis), the independent (in the
case of regression analysis), endogenous variable (in the path and mediation analysis), and
presumed mediated variable (in the mediation analysis), and adjustment was considered as the
dependent(in the case of regression, one way ANOVA, and independent sample T-test
analysis), and endogenous variable (in the case of the path and mediation analysis). A
descriptive survey research design was chosen because it is a very appropriate one to examine
the relationship between the independent and dependent variables.
In addition, this study employed a quantitative (positivist) approach method. A quantitative
research approach was chosen especially over the qualitative (interpretivist) one due to the
following reasons. The data in quantitative research is basically used to compare and contrast
other research and can be used to create new theories and/or test existing hypotheses, which
are the very objective of this research and which cannot be explored using qualitative
methodology. Nonetheless, quantitative data has a limitation, amongst others, in that it does
not recognise the individuality of participants under normal conditions.
Qualitative research, on the other hand, rejects the notion of there being a simple relationship
between our perception of the world and the world itself, instead arguing that each individual
assigns different meanings to different events or experiences. Due to the individual, subjective
nature of qualitative data, it is often inappropriate or not even possible to make predictions for
46
the wider population. Most importantly, because of the open ended approach used in
qualitative research, it may be difficult to test hypotheses of a study like the present one. This
research by its nature employed constructs with sub variables in them which cannot be fully
explored using a qualitative method; as a consequence, the quantitative approach was chosen
over the qualitative method.
3.2 POPULATION
Once a decision was made about the method of research to be employed in this thesis
(quantitative), defining the population to be used in this thesis for the readers was logical. This
study was conducted in public universities in Ethiopia. This country has 43 such higher
institutions (MoE, 2014). Of them, only 33 public universities have been functioning while the
construction of the remaining 10 universities was not completed so that there were no students
registered in them during the period of data collection for this research. Of the remaining 33
universities, three universities (Adama Science and Technology University, Addis Ababa
University, and Debre Berhan University) were selected randomly using a lottery method.
Basically, there are several approaches that are aimed to minimize bias in the process of
random sampling selection, however, for this research purpose a lottery method was chosen
among them. In the selection process of research sites, each of the 33 public universities was
assigned using random numbers, between 1 and 33. Thus, each university were numbered
systematically and in a subsequent manner by writing each number on a separate piece of
paper. These pieces of papers were folded and mixed up into a box and then numbers were
drawn out of the box in a random manner. Lastly, three sample universities were selected
randomly from the box by choosing folded pieces of papers in a random manner. Since there
were no duplicates in numbers, each university was only sampled once i.e. such selection was
sampling without replacement.
First year university regular undergraduates were the research population for this study
because the investigator specifically wanted to examine the particularly stressful time of
university life as these students transit from preparatory school and life at home to life at a
university. Moreover, regular first year undergraduates, since they originated from diverse
areas of the country, could face more challenges of adjusting to a university than the weekend
students who mostly came from the local districts.

47
3.3 SAMPLE AND SAMPLING METHODS
The sampling frame for this study was first year regular undergraduates who had enrolled in
the academic year 2016/2017 at 3 public universities of Ethiopia. The samples, from which
statistical inferences were drawn, were randomly selected from the accessible populations;
thus, generalising the findings from selected samples to the population was feasible. Random
sampling assumes that the units to be sampled were included in a list, therefore, list were
numbered in sequential order from one to the total number of units in the population.
Concerning selection of colleges and departments, a simple random sampling technique
(lottery method) was employed. A simple random sample is a probability sampling method
that provides an equal probability of each member of the population being selected. In other
words, simple random sampling ensures an unbiased representation of a population under
considerations. In a simple random sample, a couple of methods can be used, among them; a
lottery method is one and was used in this research. Although a lottery method seems
mechanical, in this research context it was applied and used without difficulty. Since the
population was manageable, this method was applicable in this sense. In this lottery method,
each member of the population (in this research, colleges, departments, and participant’s
names who were chosen from the selected departments after stratification was made) was
numbered systematically in a consequent manner and writing each number on a separate piece
of paper of same size, shape, and colour followed. Then after, those pieces of papers were
folded and mixed up in a box and lastly, samples were drawn out of the box in a blindfold
random manner, until the required samples were taken for granted. Since the random numbers
were mutually exclusive, each sample was only sampled at once or draw a sample, without
replacement, means that once an individual was sampled, that sample was not placed back in
the population for re-sampling.
In this regard, in the Adama Science and Technology University, there were two divisions in
the first-year programmes during the data collection period. These were the Pre-engineering
freshman programme and the Applied Natural Science division. From these two divisions, the
Pre-engineering division was selected randomly using a lottery method.
In the case of Addis Ababa University there were 14 colleges and institutions during the data
collection period, but the Institute of Engineering was excluded since it had been selected in
48
the Adama Science and Technology University; thus, only 13 colleges and institutions were
included in the selection process. Of these, two colleges, the Social Science and Natural
Science colleges, were chosen using a simple random sampling technique. Again from the two
colleges, 3 departments were chosen randomly using a lottery method. In the Social Science
College, there were 9 departments during the data collection period: of them, Geography and
Environmental studies, History and Heritage Management, and Sociology were chosen
randomly using simple random sampling techniques (a lottery method). There were 9
departments under the Natural Science College; of them, three departments, namely Geology,
Sport Science, and Computer Science, were chosen randomly using a lottery method.
Concerning Debre Berhan University, there were 9 Colleges during the data collection period.
Of them, three colleges (Pre-engineering, Social Science and Natural Science) were excluded
due to being included in the selection process in the two universities (Adama Science &
Technology and Addis Ababa University mentioned above). Therefore, out of the 9 colleges
six were left to be included in the sample. Thus, two colleges: College of Business and
Economics and College of Health Sciences were chosen randomly using a lottery method. In
the college of Business and Economics, there were five departments: of them, the Accounting
and Finance, Management and Logistic and Supplies Management departments were chosen
randomly using a lottery method. Once more, in the College of Health Sciences, out of the six
departments, three: Midwifery, Nursing Science, and Health Officer were chosen randomly
using a lottery method.
In selecting participants from each of the departments chosen, caution was taken to ensure the
proportionality of the number of students to be included. For instance, in some departments
there were numerous students enrolled and they contained many sections; therefore, greater
numbers of participants were chosen than from a department having lower numbers of
students in a section. Moreover, in choosing the colleges from the selected universities,
randomisation of the colleges was not carried out haphazardly; rather, caution was taken to
avoid double selection of colleges across the three universities. For instance, if an Engineering
college had an opportunity to be chosen once at one university, it was excluded from the
selection process applied in other universities.
It is obvious that the quality of the sample affects the quality of the research generalisations.
Accordingly, obtaining an unbiased sample is the main criterion when evaluating the adequacy
49
of a sample. An unbiased sample is one in which each individual of the population has an
equal chance of being selected. In other words, all members of the population have essentially
the same probability of being included. A good sample is also comprehensive in nature as
well. This feature of a sample is closely linked with true representativeness. Therefore, the
probability sampling technique was applied in this research because it was an objective
method of sampling and permitted the application of statistical devices as planned. In
probability sampling, the error due to sampling can be estimated. This also maintains the
accuracy of the analysis of results as compared to the non-probability sampling technique.
Among the probability sampling techniques, a stratified random sampling method was
employed in selecting the participants of this study. This technique was chosen because it was
believed to adequately represent the subgroups as well as to ensure a proportional number of
the population in the sample. Thus, the stratified sampling technique helps to avoid over or
under representations of a segment of the population in the subgroups. Overall, the process of
selection was carried out in the following manner. First, participants were stratified based on
the required demographic variable of sex, since gender was identified as one essential
component for the study. Thereafter, the required number of participants was selected from
each distinct stratum via a simple random sampling technique using a lottery method. The
number of participants to be selected was determined by a proportional method. This
proportional stratified random sampling should ensure whether or not the subgroups (in this
case male and female first year university students) were represented in the correct
proportions. In this regard the same percentage of participants, not the same number of
participants, was drawn from each stratum.
Once the probability sampling type was determined, the next step was to establish the number
of participants included in the sample. In survey studies, a sample should be representative of
the population. Therefore, the size of the sample is an important aspect for representativeness.
Basically, in determining the sample size, a number of factors need to be considered, such as
population size, margin of error (confidence interval), confidence level, and number of
variables used in the research and the statistical analysis technique to be used as well as time,
money, and effort.
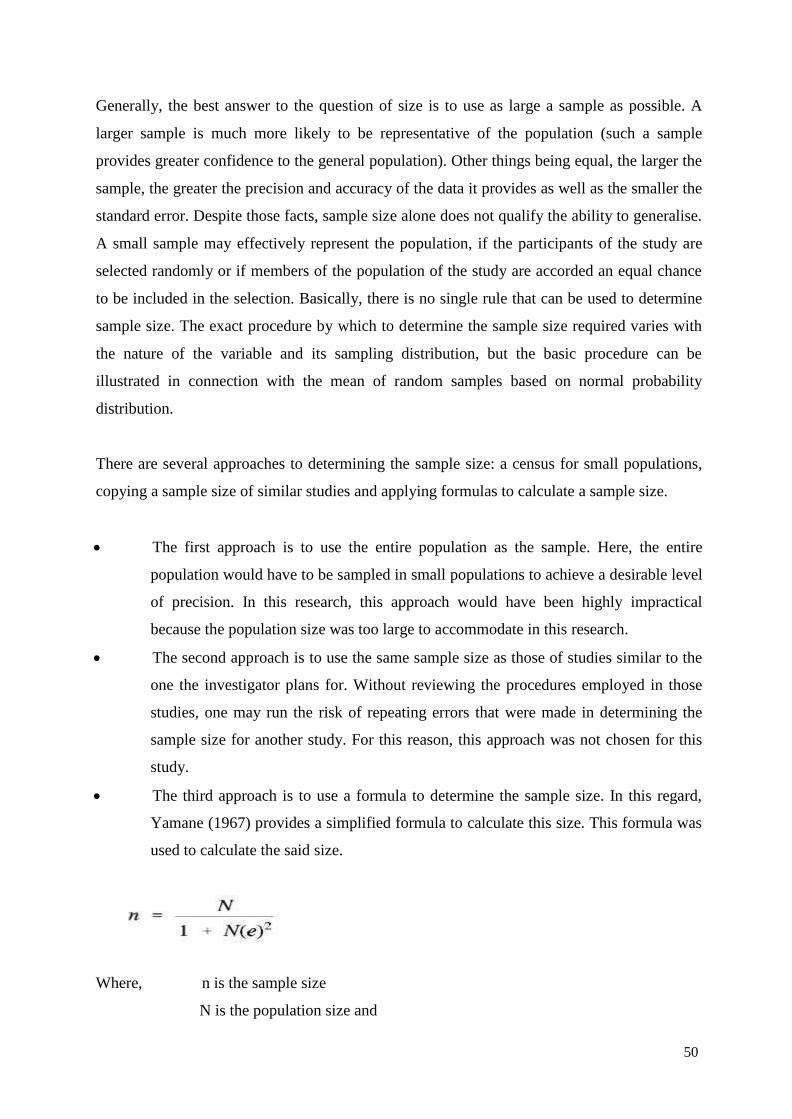
50
Generally, the best answer to the question of size is to use as large a sample as possible. A
larger sample is much more likely to be representative of the population (such a sample
provides greater confidence to the general population). Other things being equal, the larger the
sample, the greater the precision and accuracy of the data it provides as well as the smaller the
standard error. Despite those facts, sample size alone does not qualify the ability to generalise.
A small sample may effectively represent the population, if the participants of the study are
selected randomly or if members of the population of the study are accorded an equal chance
to be included in the selection. Basically, there is no single rule that can be used to determine
sample size. The exact procedure by which to determine the sample size required varies with
the nature of the variable and its sampling distribution, but the basic procedure can be
illustrated in connection with the mean of random samples based on normal probability
distribution.
There are several approaches to determining the sample size: a census for small populations,
copying a sample size of similar studies and applying formulas to calculate a sample size.
The first approach is to use the entire population as the sample. Here, the entire
population would have to be sampled in small populations to achieve a desirable level
of precision. In this research, this approach would have been highly impractical
because the population size was too large to accommodate in this research.
The second approach is to use the same sample size as those of studies similar to the
one the investigator plans for. Without reviewing the procedures employed in those
studies, one may run the risk of repeating errors that were made in determining the
sample size for another study. For this reason, this approach was not chosen for this
study.
The third approach is to use a formula to determine the sample size. In this regard,
Yamane (1967) provides a simplified formula to calculate this size. This formula was
used to calculate the said size.
Where, n is the sample size
N is the population size and
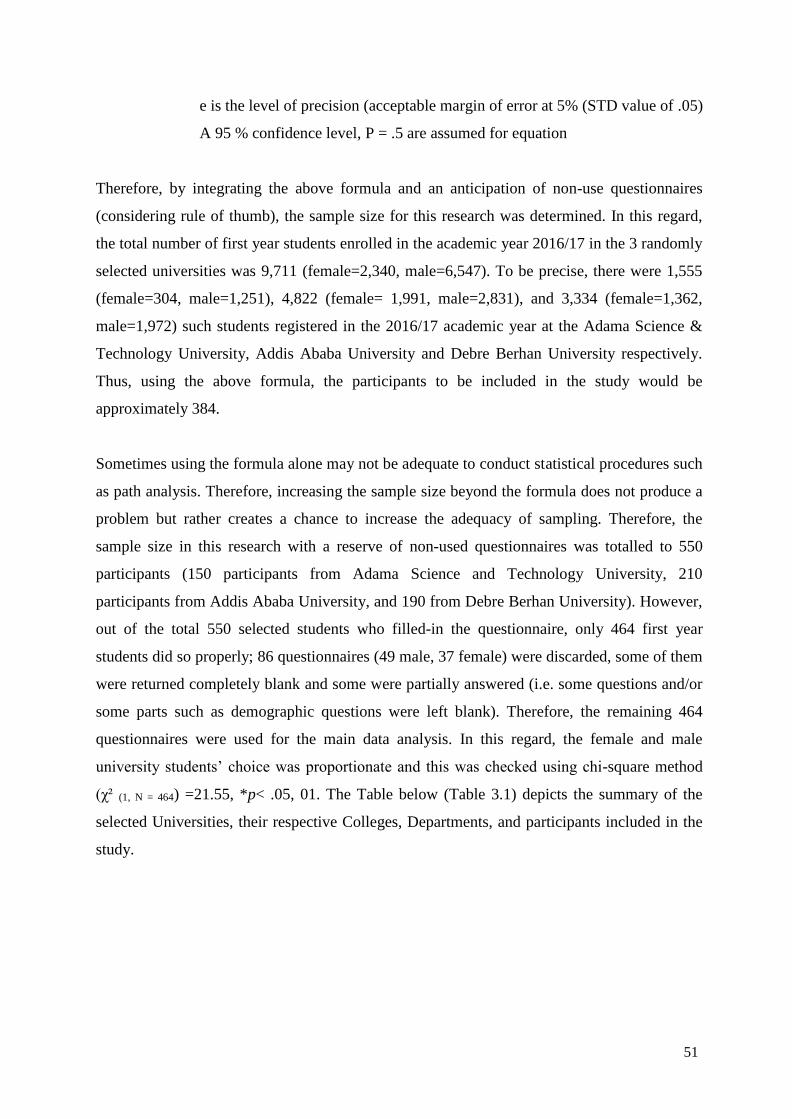
51
e is the level of precision (acceptable margin of error at 5% (STD value of .05)
A 95 % confidence level, P = .5 are assumed for equation
Therefore, by integrating the above formula and an anticipation of non-use questionnaires
(considering rule of thumb), the sample size for this research was determined. In this regard,
the total number of first year students enrolled in the academic year 2016/17 in the 3 randomly
selected universities was 9,711 (female=2,340, male=6,547). To be precise, there were 1,555
(female=304, male=1,251), 4,822 (female= 1,991, male=2,831), and 3,334 (female=1,362,
male=1,972) such students registered in the 2016/17 academic year at the Adama Science &
Technology University, Addis Ababa University and Debre Berhan University respectively.
Thus, using the above formula, the participants to be included in the study would be
approximately 384.
Sometimes using the formula alone may not be adequate to conduct statistical procedures such
as path analysis. Therefore, increasing the sample size beyond the formula does not produce a
problem but rather creates a chance to increase the adequacy of sampling. Therefore, the
sample size in this research with a reserve of non-used questionnaires was totalled to 550
participants (150 participants from Adama Science and Technology University, 210
participants from Addis Ababa University, and 190 from Debre Berhan University). However,
out of the total 550 selected students who filled-in the questionnaire, only 464 first year
students did so properly; 86 questionnaires (49 male, 37 female) were discarded, some of them
were returned completely blank and some were partially answered (i.e. some questions and/or
some parts such as demographic questions were left blank). Therefore, the remaining 464
questionnaires were used for the main data analysis. In this regard, the female and male
university students’ choice was proportionate and this was checked using chi-square method
(χ² (1, N = 464) =21.55, *p< .05, 01. The Table below (Table 3.1) depicts the summary of the
selected Universities, their respective Colleges, Departments, and participants included in the
study.
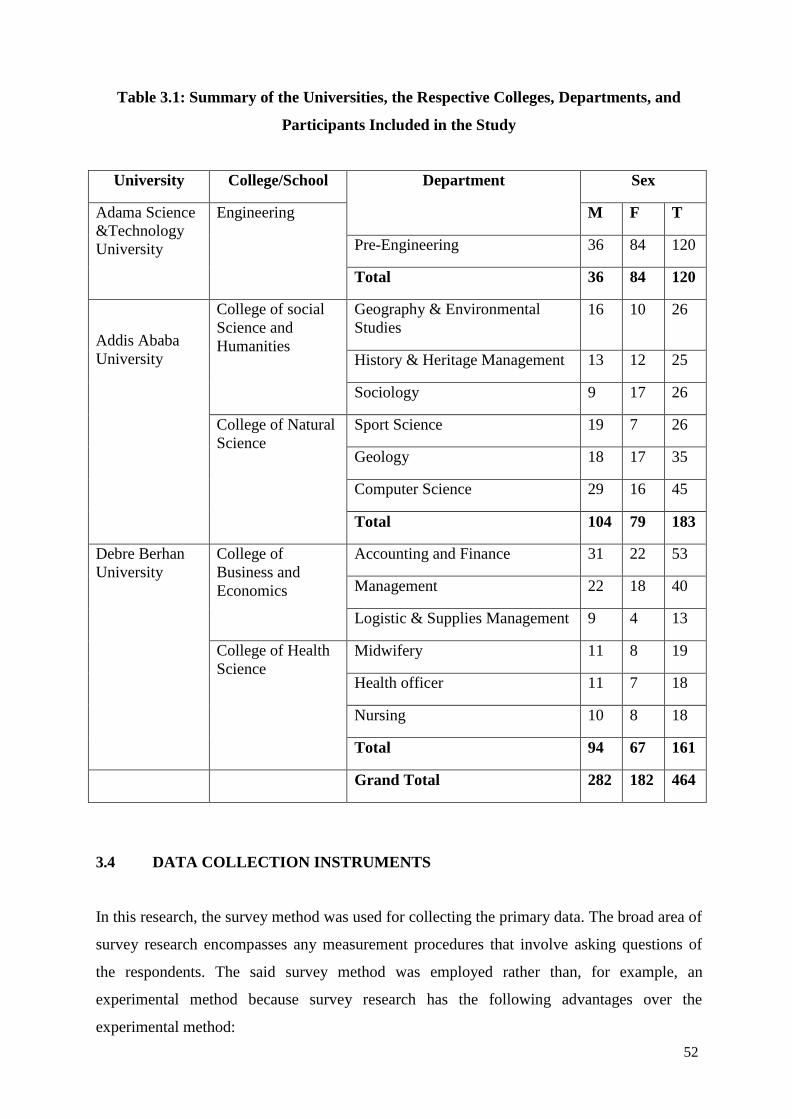
52
Table 3.1: Summary of the Universities, the Respective Colleges, Departments, and
Participants Included in the Study
University College/School Department Sex
Adama Science
&Technology
University
Engineering M F T
Pre-Engineering 36 84 120
Total 36 84 120
Addis Ababa
University
College of social
Science and
Humanities
Geography & Environmental
Studies
16 10 26
History & Heritage Management 13 12 25
Sociology 9 17 26
College of Natural
Science
Sport Science 19 7 26
Geology 18 17 35
Computer Science 29 16 45
Total 104 79 183
Debre Berhan
University
College of
Business and
Economics
Accounting and Finance 31 22 53
Management 22 18 40
Logistic & Supplies Management 9 4 13
College of Health
Science
Midwifery 11 8 19
Health officer 11 7 18
Nursing 10 8 18
Total 94 67 161
Grand Total 282 182 464
3.4 DATA COLLECTION INSTRUMENTS
In this research, the survey method was used for collecting the primary data. The broad area of
survey research encompasses any measurement procedures that involve asking questions of
the respondents. The said survey method was employed rather than, for example, an
experimental method because survey research has the following advantages over the
experimental method:
53
It is a better way of retrieving information about a respondent’s past history than
experiments
It is a method where generalised information could be collected from almost any
human population, unlike experimental research
It has access to a wider range of participants than experimental research has, and
It uses the methods and settings of the study of the real-life situation.
However, the survey method displays serious limitations as compared to the experimental one
in that the data may be sometimes superficial and the data may not have internal validity.
Despite this, one of the research tools in survey research, the questionnaire, which typically
qualifies the characteristics of survey research, is specifically organised with the precise
intention of obtaining information from participants. In this regard, Kothari (2004) stated that
questionnaires offer a considerable advantage in administration, present an equal opportunity
to a large numbers of people simultaneously and provide the investigation with an easy means
to accumulate data. However, I considered that warnings needed to be attached to the use of
quantitative surveys, and care has been taken before distributing the questionnaire. The
following issues have been noted in the preparation of the latter:
The careful approach began with the covering letter of the questionnaire that was drafted in a
friendly tone, indicated its importance to the respondents, and contained directions which were
clear and complete. The other issue was that of appearance: it was designed to be attractive in
appearance, neatly arranged, and free from typesetting errors. Furthermore, each question
dealt with a single idea defined in unambiguous terms and was reasonably short, though
comprehensive enough to secure all relevant information.
Concerning the questionnaire item formats, both the open ended and close ended form items
were used. Basically, closed ended items were dominantly employed to gather information
because the investigator believed that these were more likely to yield the data needed in this
research project. Since the present research was purely quantitative, and was to be analysed
using SPSS, the close form item facilities the tabulation and analysis of data more easily than
responses obtained through open ended form items. Even if close ended items have the above
mentioned qualities, I have also identified the weaknesses of this kind of item format. The
respondents do not have the opportunity to explain why they have given certain responses and
this format also limits the scope and depth of responses, so that its use in measuring attitudes,
feelings and certain aspects of behaviour may sometimes be limited.
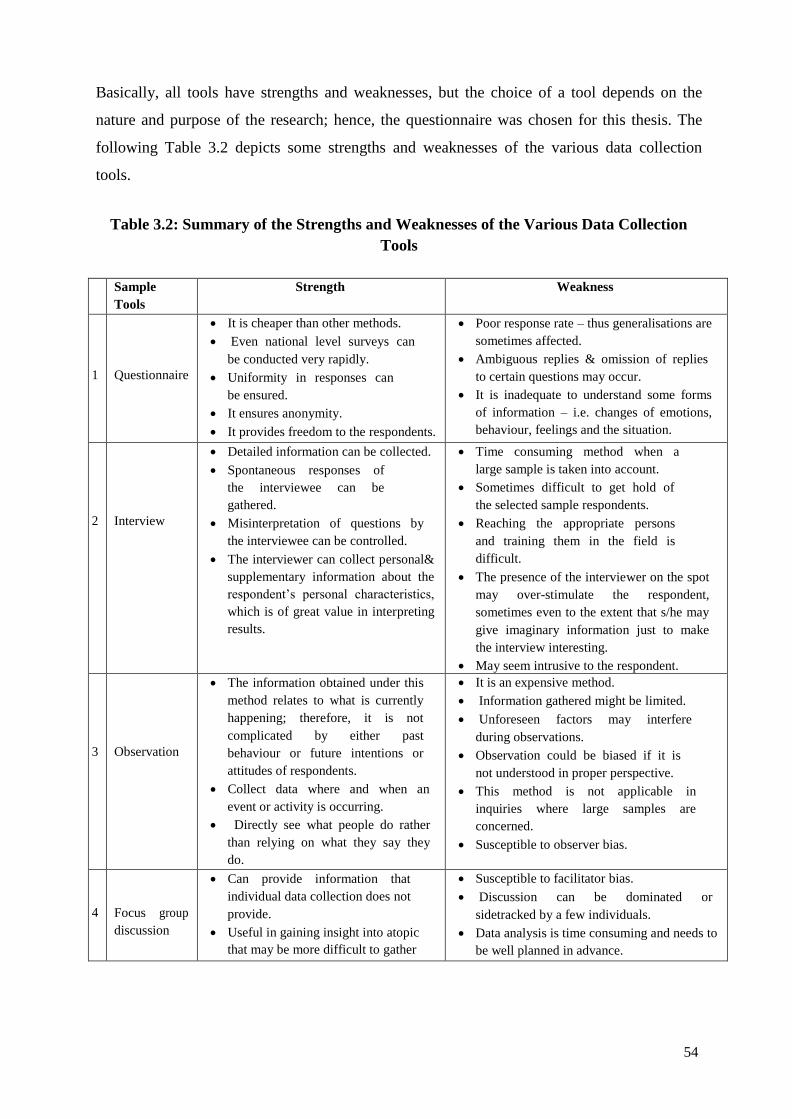
54
Basically, all tools have strengths and weaknesses, but the choice of a tool depends on the
nature and purpose of the research; hence, the questionnaire was chosen for this thesis. The
following Table 3.2 depicts some strengths and weaknesses of the various data collection
tools.
Table 3.2: Summary of the Strengths and Weaknesses of the Various Data Collection
Tools
Sample
Tools
Strength Weakness
1
Questionnaire
It is cheaper than other methods.
Even national level surveys can
be conducted very rapidly.
Uniformity in responses can
be ensured.
It ensures anonymity.
It provides freedom to the respondents.
Poor response rate – thus generalisations are
sometimes affected.
Ambiguous replies & omission of replies
to certain questions may occur.
It is inadequate to understand some forms
of information – i.e. changes of emotions,
behaviour, feelings and the situation.
2
Interview
Detailed information can be collected.
Spontaneous responses of
the interviewee can be
gathered.
Misinterpretation of questions by
the interviewee can be controlled.
The interviewer can collect personal&
supplementary information about the
respondent’s personal characteristics,
which is of great value in interpreting
results.
Time consuming method when a
large sample is taken into account.
Sometimes difficult to get hold of
the selected sample respondents.
Reaching the appropriate persons
and training them in the field is
difficult.
The presence of the interviewer on the spot
may over-stimulate the respondent,
sometimes even to the extent that s/he may
give imaginary information just to make
the interview interesting.
May seem intrusive to the respondent.
3
Observation
The information obtained under this
method relates to what is currently
happening; therefore, it is not
complicated by either past
behaviour or future intentions or
attitudes of respondents.
Collect data where and when an
event or activity is occurring.
Directly see what people do rather
than relying on what they say they
do.
It is an expensive method.
Information gathered might be limited.
Unforeseen factors may interfere
during observations.
Observation could be biased if it is
not understood in proper perspective.
This method is not applicable in
inquiries where large samples are
concerned.
Susceptible to observer bias.
4
Focus group
discussion
Can provide information that
individual data collection does not
provide.
Useful in gaining insight into atopic
that may be more difficult to gather
Susceptible to facilitator bias.
Discussion can be dominated or
sidetracked by a few individuals.
Data analysis is time consuming and needs to
be well planned in advance.
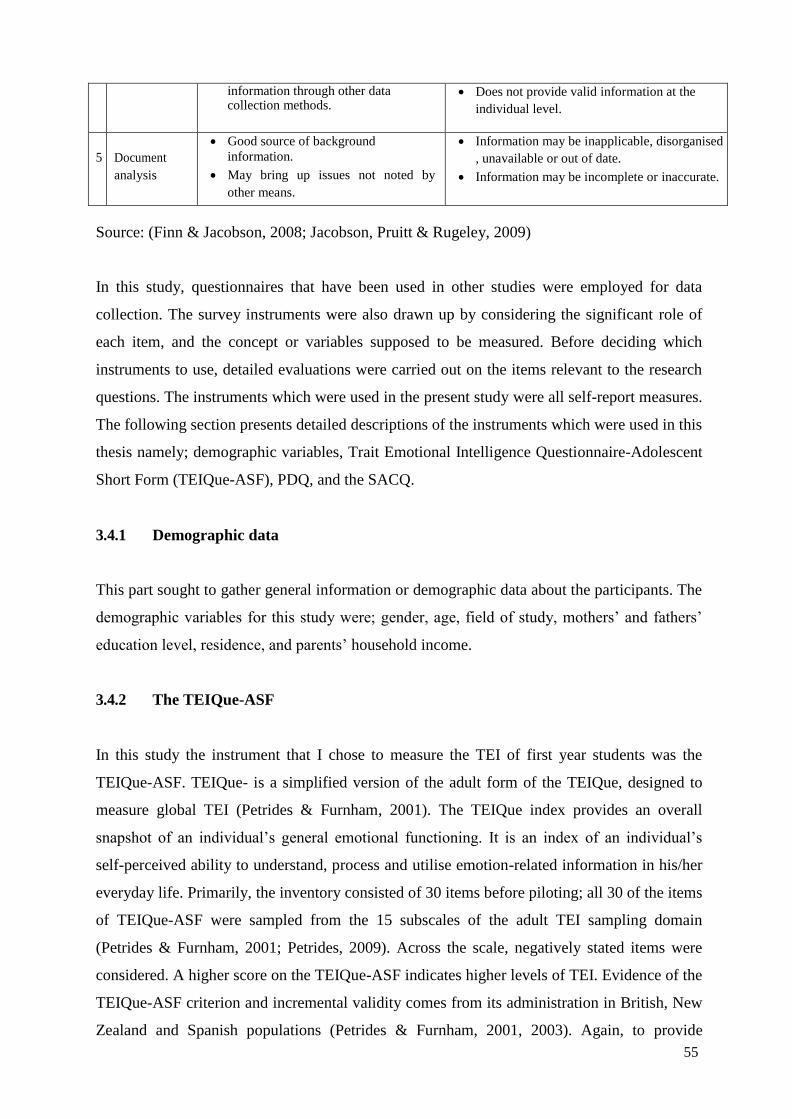
55
information through other data collection methods.
Does not provide valid information at the
individual level.
5
Document
analysis
Good source of background
information.
May bring up issues not noted by
other means.
Information may be inapplicable, disorganised
, unavailable or out of date.
Information may be incomplete or inaccurate.
Source: (Finn & Jacobson, 2008; Jacobson, Pruitt & Rugeley, 2009)
In this study, questionnaires that have been used in other studies were employed for data
collection. The survey instruments were also drawn up by considering the significant role of
each item, and the concept or variables supposed to be measured. Before deciding which
instruments to use, detailed evaluations were carried out on the items relevant to the research
questions. The instruments which were used in the present study were all self-report measures.
The following section presents detailed descriptions of the instruments which were used in this
thesis namely; demographic variables, Trait Emotional Intelligence Questionnaire-Adolescent
Short Form (TEIQue-ASF), PDQ, and the SACQ.
3.4.1 Demographic data
This part sought to gather general information or demographic data about the participants. The
demographic variables for this study were; gender, age, field of study, mothers’ and fathers’
education level, residence, and parents’ household income.
3.4.2 The TEIQue-ASF
In this study the instrument that I chose to measure the TEI of first year students was the
TEIQue-ASF. TEIQue- is a simplified version of the adult form of the TEIQue, designed to
measure global TEI (Petrides & Furnham, 2001). The TEIQue index provides an overall
snapshot of an individual’s general emotional functioning. It is an index of an individual’s
self-perceived ability to understand, process and utilise emotion-related information in his/her
everyday life. Primarily, the inventory consisted of 30 items before piloting; all 30 of the items
of TEIQue-ASF were sampled from the 15 subscales of the adult TEI sampling domain
(Petrides & Furnham, 2001; Petrides, 2009). Across the scale, negatively stated items were
considered. A higher score on the TEIQue-ASF indicates higher levels of TEI. Evidence of the
TEIQue-ASF criterion and incremental validity comes from its administration in British, New
Zealand and Spanish populations (Petrides & Furnham, 2001, 2003). Again, to provide
56
interpretational and developmental focus, the fifteen subscales have been clustered into four
broader factors such as: well-being, self-control, emotionality, and sociability (Petrides, 2001).
Next, the four clustered factors of TEI in the context of this thesis are discussed.
The well-being factor- refers to an evaluation about oneself as to how positive, happy,
fulfilled one is. High scores on this factor reflect a generalised sense of wellbeing,
extending from past achievements to future expectations. Overall, individuals with
high scores feel positive, happy, and fulfilled and vice versa. Sample items from well-
being factors are “I often feel good about myself; I generally find life enjoyable”.
The self-control factor- refers to one’s degree of control over his/her urges and
desires. Individuals with a high self-control score have a healthy degree of control
over their urges, desires, and they are good at regulating external pressures and stress.
In contrast, individuals with a low score tend to display impulsive behaviours and are
unable to properly manage stress. Sample items from the self-control factors are “I
usually find it difficult to regulate my emotions; I am able to deal with stress”.
The emotionality factor- refers to the ability to recognise emotional states in others,
express emotions and use these abilities to develop and sustain close relationships
with others. In this regard, individuals with a high emotionality score possess a wide
array of emotion-related skills: recognising internal emotions, perceiving them and
expressing them. In turn, these skills are often used to form and nurture close
relationships with family and friends. On the hand, individuals with a low
emotionality score have difficulty recognising their own emotions and conveying their
feelings to others. In turn, these individuals generally experience less gratifying
personal relationships with others. Sample items from emotionality factors include, “it
is easy for me to talk about my feelings to other people; I often pay a lot of attention
to my feelings”.
The sociability factor, where the focus falls on the individual’s social relationships
and social influence, rather than on personal relationships with family and close
friends. This factor differs from the emotionality factor above in that it emphasises
social relationships and social influence. Individuals with a high sociability score are
good listeners and effective communicators, whereas individuals with a low score are
not as effective at social interaction, believe they are unable to affect others’ emotions
and are less likely to be good negotiators and networkers. They appear unsure of
themselves in social interactions and are not able to influence others’ emotions
(Petrides, 2001). Sample items from the sociability factor include, “I am good at
57
interacting with my classmates; I can make other people feel better when I want to”.
The internal consistency of the TEIQue-ASF based on the pilot testing of the study was .85
(Petrides, 2001). Petrides and Furnham (2003) argue that TEI self-perceptions were accurate
to some extent because they found the individuals who perceived themselves as emotionally
adjusted, with good social skills and self-control, were rated by their peers as more
cooperative and less disruptive.
Favourable psychometric properties have been reported for the TEIQue-ASF (Petrides &
Furnham, 2003). Scores are also stable over time. The TEIQue includes validity checks for
social desirability, honesty and random responding (Petrides & Furnham, 2003). Importantly,
the latest version of the TEIQue–ASF is available, free of charge, for research purposes from
www.psychometriclab.com.
In general, the TEI Questionnaire possesses a number of key features, amongst others:
A psychometrically validated measure of TEI
It is supported by a world-class research programme based at University College
London, and it is
UK normed
3.4.3 The PDQ
The PDQ was used for measuring parenting styles perceived by first year university students.
Items were designed to measure the responsiveness/ involvement and control/demandingness
of parents as perceived by the said students. So far, there have not been a fixed number of
items repeatedly and consistently used by different research studies in the PDQ. Rather, as
observed across diverse journals and dissertations there have been variations in the number of
items included. For example, the Parental Authority Questionnaire (PAQ) (Buri, 1991),
employed to measure the perceived parenting style consisted of 30 items, 10 for each of the
three different styles of parenting (authoritative, authoritarian, and permissive) in a five point
Likert format, ranging from strongly agree (5) to strongly disagree (1). The reliability of the
PAQ was found to be .77 to .92 in a test re-test check over a two-week period of time (Buri,
1991).

58
On the other hand, Ayele (2012) in the study employed 25 items; of them, 13 items measured
the acceptance/involvement sub-scale whereas 12 measured the strictness/supervision sub-
scale. For the acceptance/involvement sub-scale, the reliabilities were Cronbach’s alpha = .88,
.87, and .88 for the overall sample and the sub-samples of female and male students,
respectively. For the strictness/supervision sub-scale, the reliabilities were Cronbach’s alpha =
.86, .83, and .85 for the overall sample and the sub-samples of 80 female and male students,
respectively. In the Ayele’s research the reliabilities were greater than the recommended
Cronbach’s alpha ≥ .70.
Moreover, Tigist (2013) in her study employed a total of 19 items to measure parenting style.
In this study, the reliabilities were also determined by means of Cronbach’s alpha. The results
were as follows: parental acceptance for male parents/guardians was .807; parental acceptance
for female parents/guardians was .779; parental control for male parents/guardians was .782;
while parental control for female parents/guardians was .76.
In addition, Gafoor and Kurukkan (2014) designed a questionnaire primarily to use 40 items
to measure the parenting style, 20 items for the parental responsiveness sub-scale whereas the
rest, 20 of them, measured parental control; in a later version there were 19 items used for
each subscale with a total of 38 items being used for main data collection. The reliability of
the scale was established by the test-retest method after an interval of one week. The test-retest
coefficient of the reliability of responsiveness variable in the scale was .81 while for control it
was .83. The items were constructed in light of the socio-cultural and educational
circumstances of adolescent students in Kerala, India. The tool was suitable for scaling the
four parenting styles among south Asian adolescent students. The tool displayed good criterion
related validity and test-retest reliability.
Moreover, Gracia, Garcia, and Lila (2008) developed a parenting style index to assign the
parents into four categories based on their parenting style, namely, authoritative, authoritarian,
neglectful and indulgent. This measures parental warmth and control as perceived by the
adolescents, with alpha coefficients .9 and .81 respectively. The tool was developed for
Spanish speaking people.
59
Parenting style instruments up until the present have been developed in other cultures; some
consider only three parenting styles whereas some are meant for parents, rather than children.
Consequently, the investigator sensed the need for contextualising a scale of parenting in the
Ethiopian parenting practices and cultural contexts. Obviously, parenting behaviour is
influenced by the culture in which one is brought up. The culture decides the limits of
behaviour that have to be controlled and praised. Therefore, contextual validity is highly
relevant for constructs like parenting styles as the instruments incorporate statements, which
reflect cultural preferences of the respondents. Hence, the validity of measures of parenting
styles where instruments are solely developed in foreign cultures are applied is questionable.
In general, there have been significant inconsistencies concerning the use of instruments
measuring parenting style; most of the existing instruments have been widely criticised in
terms of lacking contextual/ecological validity. In spite of these critiques, therefore, I used and
managed to contextualise the Gafoor and Kurukkan (2014) tool to measure the parenting style
which was constructed in the light of socio-cultural and educational circumstances of
adolescent students in Kerala, India. The items were modified to assess retrospective accounts
of parental rearing style prior to attending university. I chose this scale over those developed
in the West because the tool developed in the East (in this case, India) is more adaptive to the
Ethiopian context since both of these countries are collectivist in nature.
In fact, all the items were prepared as matching for the involvement of both parents. When
items were contextualised, consideration was given to all areas, where the parents were
interacting with their children with respect to physical, social, emotional, educational, personal
and behavioural dimensions. Equal numbers of items were used to measure parental
responsiveness (16 items) and parental demandingness/control (16 items), with responses on a
5-point Likert scale (1 = strongly disagree, 2 = disagree, 3 = uncertain (in between), 4 = agree,
5 = strongly agree).
The self-report questionnaires of this study contained 32 items on parenting practices that, as
mentioned, were taken from Gafoor’s and Kurukkan’s (2014) parenting style measures and
contextualised to an Ethiopian milieu. The university students completed these measures,
answering in separate columns for a mother and a father. Through the gross scores reached,
the responsiveness and demandingness scales were used to measure the paternal and maternal
demandingness and responsiveness as perceived by the university students.
60
The responsiveness/involvement sub-scale in this research consisted of 16 items on parental
closeness to their university students. It measures the extent to which first year university
students perceive their parents as loving, responsive, and involved; sample items are “listens
to my ideas and opinions; points out ways I could do better.” On the other hand, the parental
control/demandingness sub-scale consisted of 16 items assessing parental monitoring of their
university students: sample items are “exerts firm control on me; sets high standards for me to
meet”.
With regard to scoring, the scores for the responsiveness/involvement sub-scale and for the
demandingness/control sub-scale ranged from 16-80. Participants rated their mother and father
separately, but a combined score averaging both ratings was created to reflect the general
parenting style within the family. For each student, the scores for the items of each sub-scale
was summed to create a total score for each sub-scale, so that there was one score for the
responsiveness /involvement sub-scale and another for the parental control/demandingness
sub-scale. Thus, there were six separate scores for each participant, namely mother’s
responsiveness, father’s responsiveness, mother’s demandingness, father’s demandingness,
parental responsiveness, and parental demandingness.
The four styles: authoritative, authoritarian, permissive and uninvolved, proposed by
Baumrind (1971) are scaled based on a quadrant of high and low levels of parental
responsiveness and control suggested by Maccoby and Martin (1983). Specifically, the sample
median of the two indices of parenting dimensions (i.e., acceptance/involvement and
control/demandingness) and an examination of these two parenting dimensions simultaneously
was used in this thesis to categorise the four parenting styles, as an approach similar to that
used in previous studies in Western countries (e.g., Steinberg et al., 1992b cited in Ayele,
2012) as well as in Ethiopia (Ayele, 2012; Abesha, 1997 cited in Ayele, 2012).
Therefore, parents who were rated by their first year university students with a score above or
equal to the sample median on the responsiveness and demandingness indices, were
considered as authoritative parents and assigned a parenting style score of “1”. Parents who
were rated by their first year university students with a score below the sample median on the
responsiveness index but above or equal to this median on the demandingness index, were
considered as authoritarian parents and assigned a parenting style score of “2”. Parents who
were rated by their first year university students with a score above or equal to the sample

61
Median on the responsiveness index but below that on the demandingness index, were
considered as indulgent parents and assigned a parenting style score of “3”. And finally,
parents who were rated by their first year university students with a score below the sample
median on both responsiveness and demandingness indices were considered as neglectful
(uninvolved) parents and assigned a parenting style score of “4”.
3.4.4 The SACQ
To reiterate, the SACQ developed by Baker and Siryk (1989) was used to measure the quality
of first year students’ adjustment to university. The SACQ is made up of four sub-scales that
measure four different types of university adjustment dimensions (Baker& Siryk, 1999). The
description of the four sub-scales is provided below.
The academic adjustment sub-scale- it assesses students’ ability to cope with the
various educational demands and college experiences they will encounter (e.g.,
students’ motivation, academic performance, and satisfaction towards the academic
environment offered in college). Here, respondents were asked to evaluate their
attitudes towards academic goals and the academic work they are required to do.
Sample items from the academic adjustment were “I am interested to do any of my
course work at university; I am enjoying my academic work”.
The social adjustment sub-scale- it measures the students’ ability to cope with the
interpersonal-societal demands inherent in college/university experiences (e.g.,
students’ involvement in social activities and relationships with other persons on
campus, and satisfaction with the social aspects of the college environment). Sample
items include “I am highly involved in social activities in the university; I feel I fit in
well as part of the university environment”.
Personal-emotional adjustment sub-scale- it focuses on a student’s psychological and
physical state during his or her adjustment to university and the degree to which he or
she is experiencing general psychological distress and problems (e.g., tense,
uncomfortable, and homesick). Respondents were asked to indicate the nature of their
emotion since the beginning of their stay in university. For instance, respondents were
asked sample items such as “I have trouble coping with the stresses in university”
which referred to the psychological aspect and “I have been having lots of
headaches”, which referred to the physical aspect. From these questions, we can
deduce how the respondents perceive their personal emotions since they are in a new
62
environment.
Finally, the institutional attachment subscale- it assesses a student’s degree of
commitment to educational-institutional goals and the degree of attachment to the
particular university he or she is attending. Sample items include, “I am happy now
about my decision to attend in this university; I am happy now with my decision to go
to university”.
The SACQ in this research, after content validation and pilot testing were undertaken, was
composed of a 40-item self-report questionnaire assessing four aspects of first year students’
adjustment to university. These four sub-scales are: academic adjustment (16 items), social
adjustment (8 items), personal-emotional adjustment (9 items) and institutional attachment (7
items). Participants were asked to indicate their level of agreement on a 5-point Likert scale
ranging from (1 = Strongly disagree, 2 = Disagree, 3 = Uncertain (in between), 4 = Agree, 5 =
Strongly agree). Negatively stated items were considered. Higher scores indicate success in
adjustment to university. The sum of the above four scales yielded a full-scale score, which
was an index of the overall adjustment to university.
All data collection instruments were administered in the English language because the medium
of communication at Ethiopian universities is English so that there was no need to translate the
questionnaire into a local language, and I therefore decided against doing so.
3.5 ETHICAL CONSIDERATIONS
After the proposed research was submitted to UNISA for approval, it was evaluated for
adherence to Ethical standards as required by the psychology department. Thereby, the
application was approved by the ethical committee of the department of psychology on
2014/11/04, assuming that this researcher would consider all the necessary cautions in the
research process.
Taking the suggestions given by the ethical committee into account, for instance, prior to
commencing with distributing the questionnaire, written consent was obtained from the higher
officials of the university, and in particular, from the academic vice presidents of the three
randomly selected universities. The investigator submitted a research protocol that set out in
detail the procedure to be followed during the survey. The protocol highlighted the proposed
research design, methodology and explanatory procedures for ensuring confidentiality,
63
voluntary participation, anonymity and details of the study’s purpose. Written consent was
also obtained from participants prior to the study. After obtaining their consent, participants
were briefed on the issue and the need for mutual understanding and respect, with the
researcher discussing ethical concerns of the study, informed consent, anonymity,
confidentiality, and voluntary participation. Because respondents were above the age of 18,
there was no need to obtain written consent from their parents.
3.6 DATA COLLECTION PROCEDURE
In this research, the collected data served the following purposes: substantiation of the various
arguments in the research findings, and the obtaining of definite direction and clear answers to
the research inquiry. The data were collected in the following two stages: during pilot testing
and during the main study.
3.6.1 Pilot testing
Piloting was undertaken on the data collection instruments. In this regard, three of the
instruments: TEIQue, the SACQ, and the PDQ were tested through piloting. Therefore, it was
essential to check the appropriateness and reliabilities of the instruments. Hence, by means of
piloting, the relevance of the instruments, identifying any ambiguity in them, and ascertaining
the workability of the instruments (improving the items, formats and instructions) was
assessed. Overall, the pilot test which was undertaken had ensured the reliability and validity
of each instrument used in this study.
In this study, both content and construct validity were considered for the purposes of
answering what the instruments really measure. To address content validity in this study, I
thoroughly reviewed several relevant scales used in previous studies. In addition, I obtained
opinions of experts, for instance of an assistant professor from the English Language
Department to check whether there were language issues in the instruments or not. Two (2)
assistant professors from the Education College and three (3) assistant professors from the
Psychology Department were asked to comment on any item that they found ambiguous or
difficult to understand. In addition, attention was paid to the nature of the items in each
instrument, taking the socio-cultural context of participants into account.
64
The comments collected from those experts mentioned above focused on two areas. First, on
the language and instruction related aspects. Second, experts were concerned about the
number of items included in the questionnaire at large and about the SACQ (67 items) in
particular. They all agreed that the items were too numerous to be properly read and responded
to by the participants. They also noticed that there were similar types of items on the
questionnaire. They suggested that the items must be reduced in quantity; otherwise,
participants would lose patience in filling in the questionnaire properly. Based on the feedback
obtained from the professors, the number of items in the SACQ was reduced from 67 to 44
before piloting. For instance, 2 experts from the Psychology Department underscored the
presence of redundant items expressed in different ways but measuring the same thing, such as
on the academic adjustment sub-scale they noticed, e.g., “I am satisfied with university
courses, I do not feel smart enough for the course work, I am enjoying my academic work, I
find academic work at university difficult” and others. From the social adjustment scale, they
observed items such as, “I am satisfied with which I am participating in social activities at
university, I am quite satisfied with my social life at university” and others. From the
personal-emotional adjustment scale they pointed to, e.g., “I have been feeling tense or
nervous lately, I have been getting angry too easily lately”) and others. From the institutional
attachment scale they identified, e.g., “Lately, I have been giving a lot of thought to dropping
out of university, I am thinking about taking time off from university and finishing later”).
Therefore, items which were identified as similar in nature but expressed in different ways as
mentioned above, were dropped before piloting. Consequently, there were 44 items left to
measure the student adjustment to university life instead of administering the 67 items which
consisted of some similar and a few identical items as mentioned above.
Similarly, Ali (2003) cited in Al-khatib et al. (2012), and Al-khatib et al. (2012) themselves
administered 36 items to measure the college adjustment scale distributed on four domains:
academic adjustment, social adjustment, emotional adjustment and institutional commitment
rather than the 67 item scale mostly used by many researchers. Regarding reliability
coefficients on the 67 items, Baker and Siryk (1989) reported the alpha coefficients for the full
versions of the sub-scales to range from .81 to .90 for academic adjustment, from .83 to .91 for
social adjustment, from .77 to .86 for personal-emotional adjustment and from .85 to .91 for
institutional attachment.
Furthermore, previously the SACQ employed a 9 point Likert scale, ranging from 1= does not
apply to me at all, to 9 = applies very close to me. Thus, from experience the professors who
65
were consulted were commenting on the importance of scale range adjustment to make all the
tools used in this thesis similar. Therefore, the 9 point Likert scale was adjusted in to a five
point Likert scale, ranging from 1= strongly disagree to 5= strongly agree to make the range
similar with the other two tools (TEIQue and PDQ). The reason for the reduction of the scale
from the 9 point Likert to the 5 point Likert scale type was to decrease the outlier problem and
to avoid confusion amongst the participants. For instance, this was where parts of the
questionnaire such as TEIQue and the PDQ were presented on a 5 point Likert scale. Hence it
was justifiable to make the Likerts’ scales homogenous for ease of response. It was
recommended as advisable to reshuffle the Likert scale so as to take account of the
participants’ patience, motivation and experience. In all of the cases, the intention was to
solicit the best information from the participants by reducing the irrelevant questions for the
participants while avoiding fatiguing them.
In this study, the instrument chosen to measure the TEI of the first year university students
was the TEIQue. In the TEIQue, experts offered suggestions on language use and the presence
of too many negatively stated items as compared to the PDQ where there were none and the
SACQ, with just certain items stated negatively. Regarding language use, some items that
were regarded as too vague by the English language experts, were corrected. The scale
originally had 30 items, and all 30 of these were administered for piloting, with the exception
of some structural adjustment and language editing.
Concerning the PDQ, the experts notified their concern regarding the situation if a participant
is only brought up by one parent, while the scale requires the participants to respond for both
parents simultaneously (the mother/female guardian and the father/male guardian) on the
responsiveness and demandingness scales. Thus, in answering the suggestion offered, the
investigator ensured in the questionnaire instructions that the participants should respond to
each item for those who have both parents; those who were brought up by a single parent had
the option to respond accordingly. With regard to the number of items included in the PDQ,
there were no significant comments by the experts. Thus, all 32 items of the scales were
administered for piloting and all the items were prepared for the involvement of both parents.
An equal number of items were prepared to measure parental responsiveness and parental
control/demandingness. Half of the items on the scale were responsiveness items whereas the
other half were demandingness items using a 5-point Likert scale (1= Strongly disagree, 2 =
Disagree, 3 = Uncertain (in between), 4 = Agree, 5 = Strongly agree). Once all comments
offered by the experts on the questionnaires and subscales had been considered, the final,
66
improved instruments were administered in the following manner.
Firstly, initial permission was requested from Debre Berhan University’s Academic Vice
President (where I am working) for conducting the pilot study. With permission granted, the
researcher communicated with the department’s coordinators for permission to recruit students
for the purpose of running a pilot test of the research instruments. A pilot study was conducted
by the researcher in December 2016 using 56 (male=28, female=28) randomly selected
undergraduate first year students from the Social Science and Humanities and the Engineering
Colleges located in Debre Berhan University, Ethiopia.
Once participants were gathered in their respective classes, it was clearly stated in the
questionnaire, and it was explained to the participants, that confidentiality of information
supplied by them would prevail at all times. In addition, the participants were informed that
they could give their informed consent freely and voluntarily, and that they had the full right
to refuse to participate or to withdraw from participation in the study at any stage.
Furthermore, explanations about the study were provided to the participants as were the
instructions. Participants were also informed that they could ask for further clarification for
any vague item/s during their filling-in of the questionnaire.
After the responses of the participants were collected, each questionnaire was checked as to
whether or not a proper response had been made. Thus, the responses of 6 (4 male, 2 female)
participants were discarded, because they had failed to fill-in the questionnaire properly.
Therefore, just the responses of 50 (24 male, 26 female) respondents were analysed for
piloting. The response was computed using Statistical Package for the Social Science (SPSS)
version 20.0. To determine the reliability of the instruments, Cronbach’s alpha and the
exploratory analyses of variance were computed, which are the most widely reported
reliability statistics and useful estimates which researchers utilise to observe whether several
items measuring a single construct are correlated. Besides, inter-item total correlation was
computed using Cronbach’s alpha to establish the internal consistency of items in each of the
instrument. Therefore, item/s that might adversely affect inter-item correlation or the total
reliability value in each scale was eliminated.
Hence, the Cronbach’s alpha value of the TEIQue was .661 (total), which was lower than
expected. However, when the inter-item total correlation was computed for the TEIQue items,
67
item 7 (selfc7) had a weak negative correlation to most of the internal items in the groups as
well as across the total items. Thus, the Cronbach’s alpha coefficient was checked if an item
was deleted. Hence, when item 7 “I change my mind often” was deleted and checked, the
Cronbach’s alpha for the TEIQue was increased from .661 to .685 (total). This was not
enough; again Cronbach’s alpha for the TEIQue was checked when item 13 (emo13)
“Sometimes, others close to me often complain that I treat them badly” was dropped and its
Cronbach’s alpha value was increased from .685 to .70. Finally, the Cronbach’s alpha value
for the TEIQue was checked if item 17 (emo17) “I am able to ‘get into someone’s shoes’ and
feel their emotions” was dropped, when the deletion of the item caused the reliability value to
alter from .700 to .711. Therefore, from the original 30 items 27 items were left for final
administration because of the deletion of items from the questionnaire. For the details, see the
attached addendum ‘G’.
Similar procedures were applied to the SACQ: its alpha value was checked and it had a
Cronbach’s alpha of .775(total). Moreover, the Cronbach’s alpha value was checked if an
item/s was deleted. Hence, when item 22 (soc22) was deleted, the Cronbach’s alpha value
increased to .786. And again when item 27 (per27) and item 25 (soc25) were deleted, the total
reliability value showed an increment from.786 to .799. Finally, when item 31 (per31) was
deleted; the Cronbach’s alpha value displayed an increment from .799 to .805. Due to the
deletion of four items, from the 44 items, 40 were left for the final administration. For the
details see the attached addendum ‘H’.
Again similar procedures were applied for the PDQ: the Cronbach’s alpha value was checked
for parental demandingness sub-scale, parental responsiveness sub-scale, paternal
responsiveness, paternal demandingness, maternal responsiveness, and maternal
demandingness dimensions.
Concerning the Cronbach’s alpha value of parental demandingness and parental
responsiveness and, the former had a Cronbach alpha value of .944 whereas the latter had a
value of .920. In both of these two subscales (parental demandingness and parental
responsiveness) the Cronbach’s alpha value in their respective subscales was checked when an
item/swasdeletedbutnoincrementwasobservedinthealphavalueofeachsubscale.Thus, .944 and
.920 were taken respectively as the Cronbach’s alpha values of parental demandingness and
parental responsiveness. For the details see the attached addendum ‘I and J respectively’.
68
The Cronbach’s alpha α (value for paternal responsiveness) subscale was .889 (total).
Although a similar step was followed, to check whether there was an increment in the
Cronbach’s alpha value if item/s was/were deleted, no increment was observed; hence, there
was no need to go into item deletion so that .889 was taken for granted. The detail is located at
the attached addendum‘K’.
Concerning paternal demandingness, the Cronbach’s alpha value was checked; it was .873
(total). It was checked to see if this increased when an item/s was deleted but again, no
increment on the Cronbach’s alpha value was observed. Therefore, no item was deleted from
the subscale; hence .873 was taken as the final such value. See the details from the attached
addendum ’L’.
Regarding maternal responsiveness the Cronbach’s alpha value was .921(total) but no
significant increment was observed in its value except when one item was deleted: that its
value increased from .921 to .922. Therefore, with this insignificant increment there was no
need to go into dropping the item; rather, .921 was taken as the final such value for maternal
responsiveness. See the details from the attached addendum ’M’.
With respect to maternal demandingness the Cronbach’s alpha value was .850 (total). This
value was checked whether it showed an increment or not when an item/s was dropped but no
increment was observed; therefore, there was no need to delete the item so that .850 was taken
as the final Cronbach’s alpha value. See the details from the attached addendum ’N’.
In addition, the items of all the completed instruments were evaluated for wording and
phrasing; thus, certain amendments were made on many items to make the items more
understandable and suitable for use in the main study. In sum, all of the measures used in the
pilot study with correction showed an adequate reliability with Cronbach’s alpha values,
which ranged between .711 to .944. These were considered to be good and acceptable.
3.6.2 Main data collection
Data collection for the main study was conducted at the beginning of December 2016,
immediately after the first year students’ enrolment for the first semester of the academic year
2016/17. In order for research to be conducted on these students, initial permission was
obtained from the university managers and first year students themselves who were selected
69
for the study. The university managers were then requested to communicate the purpose of
this research to the deans and department heads of their respective universities, who arranged
for the researcher and the data collectors to gather participants in a hall. Subsequently,
departmental coordinators and staffs of the respective universities were asked to inform and
encourage students to participate in the research and in setting up times for the researcher to
access students in the halls.
After all the preliminary activities were organised and all the participants were in the hall, the
researcher introduced himself to the participants as a doctoral research student who intended
to conduct a research study that involved first year students in this university to meet the
requirements for the doctoral degree at the University of South Africa (UNISA). After this, a
detailed briefing was given to the participants about matters such as the purpose and aim of the
study, including the focus of the questionnaire, and benefits of the research to society and
possibly to the individuals. Once the participants’ approval was obtained, they (the
participating students) were informed that participation was voluntary, they could exercise the
right to withdraw without any consequences or any loss of benefits and that their responses
would be kept strictly confidential.
Following this, participants from the respective universities were requested to agree to become
part of this research study and to sign a letter of consent. Subsequently, the informed consent
form was distributed. After collecting the signed informed consent forms, the participants
were asked to complete the questionnaire. Participants were also requested to spend time and
respond to all items in the survey and not to provide any identifying personal information such
as their name. Finally, with the help of six data collectors in each university, the
questionnaires were administered. At the end of the data collection process, the research
assistants were paid. However, research participants did not receive payment or extra credit
except that the investigator addressed a special word of acknowledgement and gratitude to
them, for their permission and cooperation in making the study successful.
3.7 METHODS OF DATA ANALYSIS AND STATISTICAL PROCEDURES
This section describes the data processing procedures employed in the data analysis. It began
with an examination of data, for there were missing responses. Questionnaires not properly
answered were rejected. Then coding was done on the remaining questionnaires. Thereafter,
data entry was performed on an Excel Spreadsheet and later imported into SPSS.

70
Subsequently, the data entered was cleaned to eliminate all possible errors due to incorrect
coding. Further, other checks were undertaken to ensure the accuracy of the data entry process
and measurement scale screening. Analysis was conducted using SPSS version 20 and
Analysis of Moment Structures (AMOS) 18. Thereafter, data collected from respondents for
the main study was tested for outliers, normality, skewness and kurtosis to check whether the
data was at a normal level. The test of significance for all statistical procedure was .05.
In order to answer the research questions of the study, several analyses were undertaken,
including percentages, one-way ANOVA, independent sample T-test, bivariate correlation,
path analysis, multiple regression and mediation. For instance, preliminary data analysis
included obtaining frequency distributions and descriptive statistics: these were used to
analyse demographic variables and to identify the types of parenting styles predominately
practiced in the families of Ethiopia. The one-way ANOVA was used to answer research
questions such as whether TEI and adjustment were significantly different from each other
with respect to the first year university students’ reported perceptions of parenting.
In addition, an independent sample T-test was used for answering research questions such as
whether there was a statistically significant difference between female and male first year
university students on TEI and adjustment scores.
In addition, Pearson correlations were calculated to assess the direction and strength of the
relationships among major study variables included in the study. This correlation was
undertaken because it is a pre-requisite for performing multiple regressions, path analysis, and
mediation. Moreover, path analysis was undertaken to test model fits to the empirical data and
to examine the strength of the paths across parental responsiveness, demandingness, TEI and
adjustment. Next to path analysis and after the correlation was checked, a multiple regression
analysis was carried out to analyse the following research questions (how are the TEI and
demandingness and responsiveness dimension-variables of parenting style affecting
adjustment to university of first year students in higher education institutions? Here, parenting
dimensions and TEI were the independent variables (predictors) whereas adjustment acted as
the dependent variable (predicted variable) to establish their combined effect on adjustment.
An analysis of the multicollinearity was also carried out to check whether there was a
similarity effect (strong correlation) that existed among the variables considered.
71
Finally, mediation analysis was performed to answer research questions such as whether TEI
mediated the relationship between parental demandingness and adjustment on the one hand,
and parental responsiveness and adjustment on the other. To do this, (Baron & Kenny, 1986)
four steps recommendations were considered and the details as discussed later in section 4.5.
3.8 CONCLUSION
The aim of this chapter was to discuss and choose the appropriate methodology and statistical
techniques used in this study. The relationships between perceived parenting style/dimension,
TEI, and students’ university adjustment were examined. The study employed a descriptive
survey research as it is a very appropriate design to examine the relationship between the
independent and dependent variables, such as parenting style/dimension acted as the
independent variable, TEI as a mediator and a dependent variable, and adjustment as the
dependent variable.
The research design was identified as quantitative rather than a qualitative approach. With
regard to the study population, this study was conducted at public universities in Ethiopia. The
sampling frame for this study was first year regular undergraduates who were enrolled in the
academic year 2016/2017 at three public universities of Ethiopia. The samples, from which
statistical inferences were drawn, were randomly selected from the accessible populations;
accordingly, generalising the findings from selected samples to the population was feasible.
In selecting the samples, all members of the population essentially have the same probability
of being selected or included. Among the probability sampling techniques, a stratified random
sampling method was employed in selecting the participants of this study. After the
probability sampling type was determined, the decision was made to determine the number of
participants included in the sample. In this research, by integrating the formula with
considering a reserve of non-used questionnaires, 550 participants were chosen. Hence, out of
the total 550 students selected to fill-in the questionnaire only 464 questionnaires were
properly completed, whereas 86 questionnaires (M=49, F=37) were discarded: some of them
were returned completely blank while some were partially answered.
In this study, questionnaires used in other studies were adapted and employed for data
collection. Concerning the questionnaire item formats, both the open and closed end form

72
items were used. Before deciding which instruments to use, detailed evaluations were carried
out on the items relevant to the research questions. The instruments used in the present study
were all self-report measures. The instruments used in this research investigated the
demographic variables encompassing: age, gender, mothers’ and fathers’ education levels,
parents’ household income, and field of study and residence. The TEIQue, clustered into four
broader factors such as: well-being, self-control, emotionality, and sociability, was used to
measure the TEI of first year university students. The PDQ was used for measuring the
perceived parenting styles reported by these students. And finally, the SACQ consisting of
academic adjustment, social adjustment, personal-emotional adjustment, and the institutional
attachment subscale developed by Baker and Siryk (1989) was used to measure how well first
year students adjusted to university life.
Thereafter, a decision was made to pilot the questionnaires. Through piloting, all of the
measures with correction showed an adequate reliability with Cronbach’s alpha values, which
ranged between .711 to .944 that were considered to be good and acceptable. In addition, the
items of all the completed instruments were evaluated for wording and phrasing and as a
result, certain amendments were made on many items to cause the items to be more
understandable and suitable for use in the main study. The researcher did his utmost to keep
the questions quite simple and easy to read and comprehend. Subsequently, prior to the start of
distributing the questionnaire, consent was obtained from the relevant bodies after which the
questionnaire was administered to the users personally.
For analysing the main data, SPSS 20.0 and AMOS 18.00 were used. Using the SPSS software
package the data were screened, outliers and normality (i.e. using kurtosis and skewness)
statistics were also tested. In order to answer the research questions of the study, several
analyses were undertaken such as percentages, one-way ANOVA, independent sample t-test,
bivariate correlation, path analysis, multiple regression, and mediation. Finally, the results are
considered in the following chapter.
73
CHAPTER FOUR
RESULTS OF THE STUDY
This chapter presents the results of the study. It begins by noting and describing the
demographic characteristics of the study sample. This is followed by the results of the
preliminary analysis of variance and means-comparisons test results pertaining to parenting
styles in the Ethiopian cultural context. Following this, the results of the correlations among
the study variables are provided. Finally, the path model of student adjustment to university as
explained by the mediating effect of TEI and the effect of demandingness and responsiveness
dimension variables of parenting style are presented. The path analysis results are backed by
multiple linear regression analyses which consider the effects of demandingness and
responsiveness dimension-variables of parenting style and the mediator variable of TEI on the
criterion variable of adjustment to university.
4.1 DEMOGRAPHICS OF THE STUDY SAMPLE
This section notes the socio-demographic characteristics of the participants with respect to
gender, residence, educational level of participants’ parents and their parents’ income level.
These characteristics are reported in the form of frequency Tables that report the distribution
of observations over each category/or level of each socio-demographic variable (e.g. ‘male’
and ‘female’ categories of the ‘gender’ socio-demographic variable). The proportion of
observations per category is also reported as a percentage. These results are displayed in Table
4.1a & b.
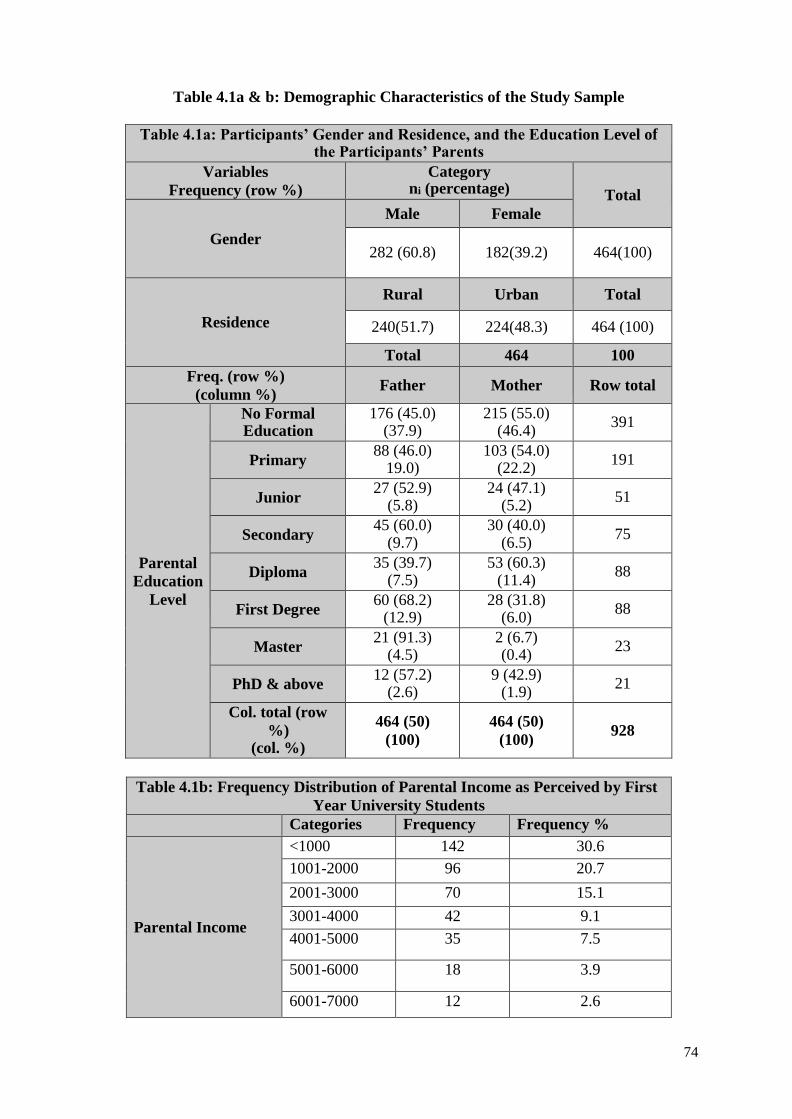
74
Table 4.1a & b: Demographic Characteristics of the Study Sample
Table 4.1a: Participants’ Gender and Residence, and the Education Level of the Participants’ Parents
Variables
Frequency (row %)
Category ni (percentage)
Total
Gender
Male Female
282 (60.8) 182(39.2) 464(100)
Residence
Rural Urban Total
240(51.7) 224(48.3) 464 (100)
Total 464 100
Freq. (row %)
(column %) Father Mother Row total
Parental
Education
Level
No Formal Education
176 (45.0) (37.9)
215 (55.0) (46.4)
391
Primary 88 (46.0)
19.0) 103 (54.0)
(22.2) 191
Junior 27 (52.9)
(5.8) 24 (47.1)
(5.2) 51
Secondary 45 (60.0)
(9.7) 30 (40.0)
(6.5) 75
Diploma 35 (39.7)
(7.5) 53 (60.3)
(11.4) 88
First Degree 60 (68.2)
(12.9) 28 (31.8)
(6.0) 88
Master 21 (91.3)
(4.5) 2 (6.7) (0.4)
23
PhD & above 12 (57.2)
(2.6) 9 (42.9)
(1.9) 21
Col. total (row
%) (col. %)
464 (50)
(100)
464 (50)
(100)
928
Table 4.1b: Frequency Distribution of Parental Income as Perceived by First
Year University Students Categories Frequency Frequency %
Parental Income
<1000 142 30.6
1001-2000 96 20.7
2001-3000 70 15.1
3001-4000 42 9.1
4001-5000 35 7.5
5001-6000 18 3.9
6001-7000 12 2.6
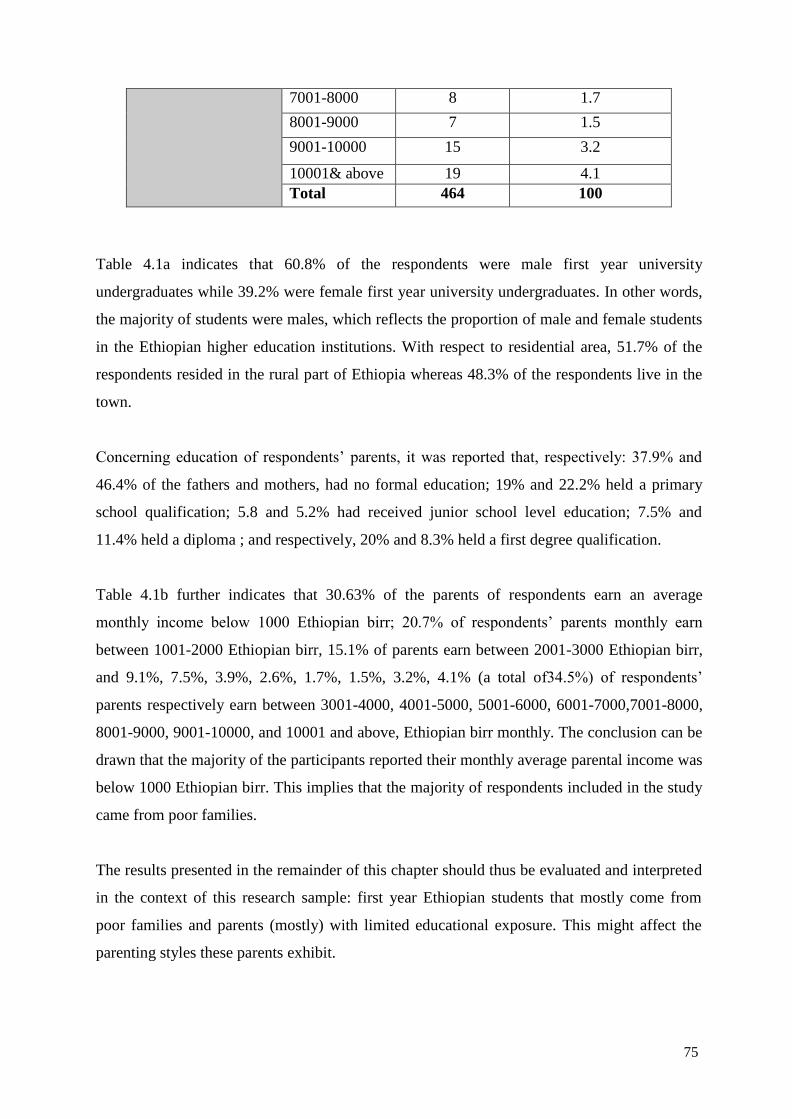
75
7001-8000 8 1.7
8001-9000 7 1.5
9001-10000 15 3.2
10001& above 19 4.1
Total 464 100
Table 4.1a indicates that 60.8% of the respondents were male first year university
undergraduates while 39.2% were female first year university undergraduates. In other words,
the majority of students were males, which reflects the proportion of male and female students
in the Ethiopian higher education institutions. With respect to residential area, 51.7% of the
respondents resided in the rural part of Ethiopia whereas 48.3% of the respondents live in the
town.
Concerning education of respondents’ parents, it was reported that, respectively: 37.9% and
46.4% of the fathers and mothers, had no formal education; 19% and 22.2% held a primary
school qualification; 5.8 and 5.2% had received junior school level education; 7.5% and
11.4% held a diploma ; and respectively, 20% and 8.3% held a first degree qualification.
Table 4.1b further indicates that 30.63% of the parents of respondents earn an average
monthly income below 1000 Ethiopian birr; 20.7% of respondents’ parents monthly earn
between 1001-2000 Ethiopian birr, 15.1% of parents earn between 2001-3000 Ethiopian birr,
and 9.1%, 7.5%, 3.9%, 2.6%, 1.7%, 1.5%, 3.2%, 4.1% (a total of34.5%) of respondents’
parents respectively earn between 3001-4000, 4001-5000, 5001-6000, 6001-7000,7001-8000,
8001-9000, 9001-10000, and 10001 and above, Ethiopian birr monthly. The conclusion can be
drawn that the majority of the participants reported their monthly average parental income was
below 1000 Ethiopian birr. This implies that the majority of respondents included in the study
came from poor families.
The results presented in the remainder of this chapter should thus be evaluated and interpreted
in the context of this research sample: first year Ethiopian students that mostly come from
poor families and parents (mostly) with limited educational exposure. This might affect the
parenting styles these parents exhibit.
76
4.2 RESULTS OF THE PRELIMINARY ANALYSIS
This section considers the results of exploratory analysis on participants’ responses. The
results pertain to verification of student adjustment-parenting dimensions-and TEI constructs;
the calculation of the relevant construct scores; the parenting styles adopted by Ethiopian
families; and indications of influential effects on student adjustment and TEI. The first
subsection reports the internal consistency reliability of the students’ adjustment, TEI and
parental dimension construct. The second subsection discusses the frequency distribution of
parenting styles while the subsequent subsections present analysis of variance results. These
one-way ANOVA results investigated:
How parenting style affects TEI?
How parenting style affects students’ adjustment at university?
Next to the ANOVA analysis, independent sample T-test analysis was undertaken to examine:
How gender affects TEI?
How gender affects adjustment to university life?
4.2.1 Verification of the internal consistency reliability of the adjustment-TEI-
parental dimension constructs
Scale reliability test results on the pilot study data, discussed in Chapter 3, indicated that the
constructs and sub-constructs of student adjustment, TEI and parental responsiveness and
demandingness dimensions complied with the criteria of internal consistency reliability. The
rationale for the scale reliability tests and the exploratory analyses of variance was to verify
the internal consistency reliability of the constructs measured in the research, as well as
obtaining an initial indication of factors influencing adjustment and TEI. Therefore, Table 4.2
reports on the scale reliability tests conducted on each subset of questionnaire responses that
describe a construct or sub-construct of TEI, student adjustment and parental style dimensions.

77
Table 4.2: Scale Reliability Results of the Constructs and Sub-constructs Used in the
Main Study
Provisional results of scale reliability tests to verify the internal consistency reliability of
the various dimensions and overall constructs of TEI, student adjustment and parental
dimensions
(Each row reports the results of a separate analysis)
Construct/
dimension
Items included
Items
reversed
Items
removed
Cronbach
alpha
(standardised)
Mean
construct
score
(standard
deviation)
TEI construct and sub-constructs
TEI Self-control 4,12, 13,
16, 19, 27,
Sociability 6, 9, 10, 18,
22, 23, 25, 26
Emotionality 1, 2, 7,
14, 20
Wellbeing 3, 5, 8, 11,
15, 17, 21, 24
Item
4,9,11, 20,
22,& 25
- .67 (approx..
.7)
3.3784
(.3382)
Self-control Self-control 4,12, 13,
16, 19, 27,
item 4 - .19
Sociability Sociability 6, 9, 10, 18,
22, 23, 25, 26
item 9, 22,
25
- .38
Emotionality Emotionality 1, 2, 7,
14, 20
item 20 - .19
Well-being Well3, 5, 8, 11, 15, 17,
21, 24
item 11 - .56
Student adjustment construct and sub-constructs
Adjustment Academic 1-16, Per-
emotional 25-33,
Social 17-
23,institutional
attachment 34-40
item 22,25-
33,35,37,39
- .81
3.4735
(.3884)
Personal-
emotional
Personal-emotional 25-
33
item25-33 - .60
Social Soc17-soc 23 item22 - .63
Academic Aca1-aca16 - - .80
Institutional –
attachment
ins-att34-att40 item 35
,37, 39
- .75

78
Parental dimensions constructs and sub-constructs
Paternal-
responsiveness
father1-father16,
mother1-mother16 - - .91
3.8406
(.5744)
Paternal-
demandingness
fatherd17-fatherd32,
motherd17-motherd32 - - .86
3.4796
(.5389)
Mother-
responsiveness
mother1-mother16 - - .87
Mother-
demandingness
motherd17-motherd32 - - .81
Father-
responsiveness
father1-father16 - - .86
Father-
demandingness
fatherd17-fatherd32 - - .81
Since the Cronbach alpha values of the sub-constructs of TEI are rather small (well below .7),
internal consistency reliability could not be verified for the sub-constructs per se, but it could
be verified for the general construct of TEIQue with a Cronbach alpha value of .67– which is
approximately .7. The results furthermore indicated that internal consistency reliability could
be verified for all sub-constructs of adjustment as well as for the general concept of student
adjustment. The same deduction as applies to student adjustment could be made for PDQ:
internal consistency reliability could be established for all constructs/ sub-constructs.
The above results therefore suggested that it would be a statistically more reliable option to
focus attention on the overall TEIQue construct and conduct further analysis on a TEI score
derived from all TEI question responses listed in Table 4.2 above. With regard to SACQ
measurement, it was decided that, although measures for the individual sub-constructs of
academic adjustment and institutional attachment dimension could be deemed reliable, only an
overall student adjustment measure/ score would be derived from the responses of items listed
for the overall adjustment construct. Furthermore, the decision was taken to use only overall
parental responsiveness and parental demandingness dimension-scores in advanced analysis,
as discussed later in section 4.3. It was argued that this approach would ensure that analysis
results and discussion were manageable in this thesis.
79
With internal consistency reliability of the mentioned constructs verified, research could
proceed by calculating reliable measurement (scores) for these constructs. All construct scores
(TEI, student adjustment, parental responsiveness and demandingness) were calculated for
each participant as the mean rating score a specific respondent awarded the question-items that
describe a particular construct. In further discussions, these sets of variables are referred to as
TEI scores (indices), student university adjustment scores (indices) and parental
responsiveness and demandingness dimension scores. Table 4.3 reports the frequency
distribution of perceived parenting styles in a categorical manner while Table 4.4 presents the
overall mean of the concept of TEI and adjustment scores and standard deviation.
4.2.2 Parenting style in the Ethiopian cultural context
As indicated in the methodology discussion in Chapter 3, section 3.4.3, two parenting
dimension-measures were calculated from specific questionnaire responses for each
respondent: the mean of PDQ consisted of questions 1-16 which formed a parental
responsiveness dimension measure, while the mean of PDQ consisted of questions from 17-
32, which formed a parental demandingness-dimension measure.
The median value for both the demandingness measure and the responsiveness measure were
calculated: the parenting style of a participant’s parents combined, was classified as either ‘1’
(authoritative) if both demandingness and responsiveness measures of a participant exceeded
the two relevant median-values; or this style was classified as ‘2’ (authoritarian) if a
participant’s responsiveness score/or index fell below the responsiveness-median and the
demandingness score/or index fell above (or equalled) the demandingness median; or, the said
style was classified as ‘3’ (indulgent) if a participant’s responsiveness score/or index fell
above (or was equal to) the responsiveness-median and the demandingness score/or index fell
below the demandingness median; or this style was classified as ‘4’ (uninvolved/neglectful) if
a participant’s responsiveness-and demandingness scores both fell below the medians for each
dimension. In this manner an ordinal categorical variable (parenting style) was derived from
two continuous parental dimension variables.
This section presents the frequency Table of the parenting styles for all respondents as well as
parenting style-frequencies according to the male and female research respondents that
participated in this research. The purpose of this classification exercise was to identify the
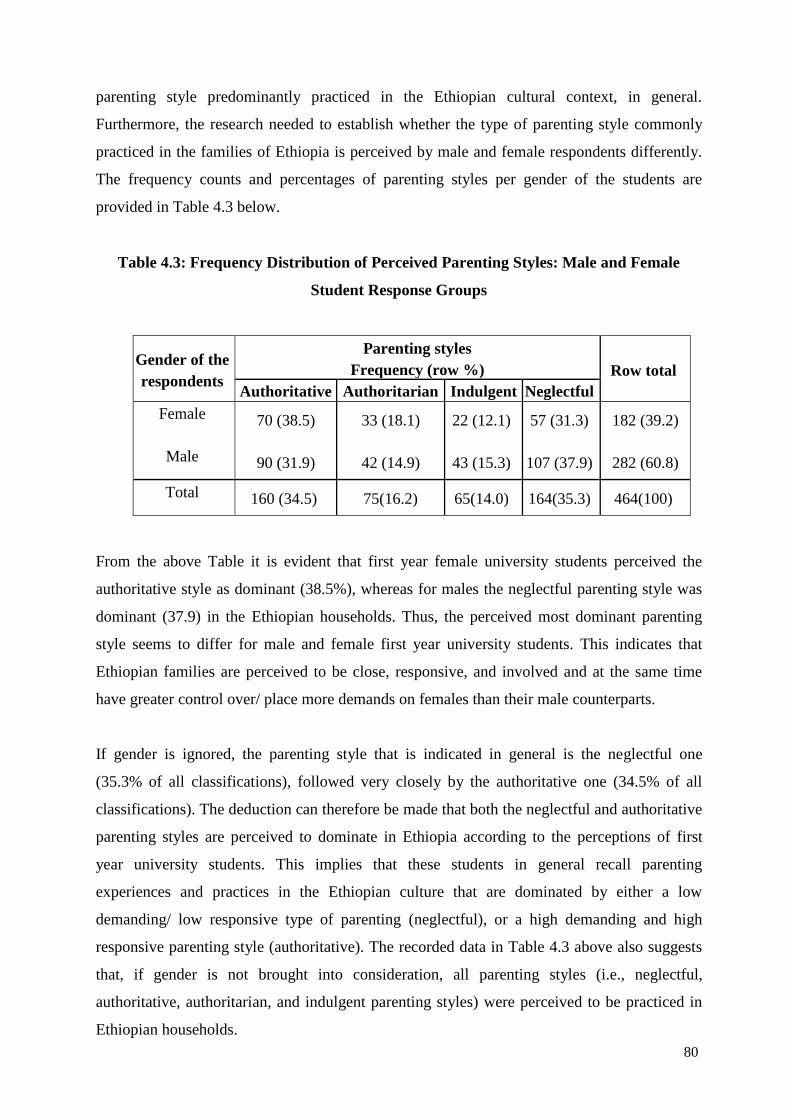
80
parenting style predominantly practiced in the Ethiopian cultural context, in general.
Furthermore, the research needed to establish whether the type of parenting style commonly
practiced in the families of Ethiopia is perceived by male and female respondents differently.
The frequency counts and percentages of parenting styles per gender of the students are
provided in Table 4.3 below.
Table 4.3: Frequency Distribution of Perceived Parenting Styles: Male and Female
Student Response Groups
Gender of the
respondents
Parenting styles
Frequency (row %)
Row total
Authoritative Authoritarian Indulgent Neglectful
Female
Male
70 (38.5)
90 (31.9)
33 (18.1)
42 (14.9)
22 (12.1)
43 (15.3)
57 (31.3)
107 (37.9)
182 (39.2)
282 (60.8)
Total 160 (34.5) 75(16.2) 65(14.0) 164(35.3) 464(100)
From the above Table it is evident that first year female university students perceived the
authoritative style as dominant (38.5%), whereas for males the neglectful parenting style was
dominant (37.9) in the Ethiopian households. Thus, the perceived most dominant parenting
style seems to differ for male and female first year university students. This indicates that
Ethiopian families are perceived to be close, responsive, and involved and at the same time
have greater control over/ place more demands on females than their male counterparts.
If gender is ignored, the parenting style that is indicated in general is the neglectful one
(35.3% of all classifications), followed very closely by the authoritative one (34.5% of all
classifications). The deduction can therefore be made that both the neglectful and authoritative
parenting styles are perceived to dominate in Ethiopia according to the perceptions of first
year university students. This implies that these students in general recall parenting
experiences and practices in the Ethiopian culture that are dominated by either a low
demanding/ low responsive type of parenting (neglectful), or a high demanding and high
responsive parenting style (authoritative). The recorded data in Table 4.3 above also suggests
that, if gender is not brought into consideration, all parenting styles (i.e., neglectful,
authoritative, authoritarian, and indulgent parenting styles) were perceived to be practiced in
Ethiopian households.
81
4.2.3 Differences in TEI and adjustment to university by parenting styles
With the probable effect of gender on perceptions of parenting styles/dimension indicated in
section 4.2.2, discussion in this section moves on to an evaluation of:
Whether perceived parenting styles (‘parenting styles’ categorical classification
variable, section 4.2.2 above) are statistically significantly influencing TEI (‘TEI’
scores)
Whether students’ university adjustment is statistically significantly influenced by
perceived parenting styles (i.e., neglectful, authoritative, authoritarian, and indulgent
parenting styles).
The rationale for these analyses is an initial assessment of the mediatory role of TEI in
students’ university adjustment and the provisional assessment of the direct effect of perceived
parenting style on students’ college adjustment. The statistical significance of the mentioned
effects is investigated by means of one-way ANOVA. In these analyses, TEI scores and
student adjustment scores are respectively entered as the dependent (continuous) variables in
the two analyses and the categorical perceived parenting style variable as the independent
variable in both analyses of variance.
Table 4.4 below presents the descriptive statistics of the variables (M, SD, and SE), and
Tables 4.5–4.8 will report the ANOVA results and multiple-comparison-of-means test results
of TEI and students’ adjustment score means for the four groups of parenting styles.
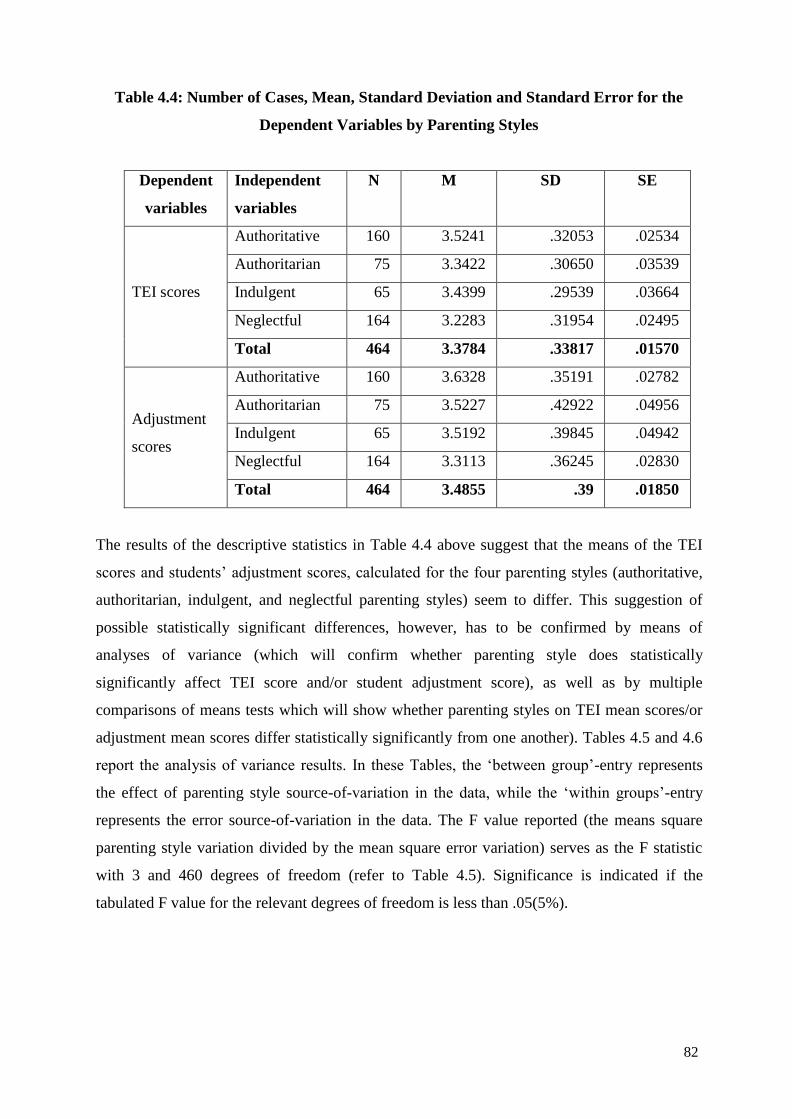
82
Table 4.4: Number of Cases, Mean, Standard Deviation and Standard Error for the
Dependent Variables by Parenting Styles
Dependent
variables
Independent
variables
N M SD SE
TEI scores
Authoritative 160 3.5241 .32053 .02534
Authoritarian 75 3.3422 .30650 .03539
Indulgent 65 3.4399 .29539 .03664
Neglectful 164 3.2283 .31954 .02495
Total 464 3.3784 .33817 .01570
Adjustment
scores
Authoritative 160 3.6328 .35191 .02782
Authoritarian 75 3.5227 .42922 .04956
Indulgent 65 3.5192 .39845 .04942
Neglectful 164 3.3113 .36245 .02830
Total 464 3.4855 .39 .01850
The results of the descriptive statistics in Table 4.4 above suggest that the means of the TEI
scores and students’ adjustment scores, calculated for the four parenting styles (authoritative,
authoritarian, indulgent, and neglectful parenting styles) seem to differ. This suggestion of
possible statistically significant differences, however, has to be confirmed by means of
analyses of variance (which will confirm whether parenting style does statistically
significantly affect TEI score and/or student adjustment score), as well as by multiple
comparisons of means tests which will show whether parenting styles on TEI mean scores/or
adjustment mean scores differ statistically significantly from one another). Tables 4.5 and 4.6
report the analysis of variance results. In these Tables, the ‘between group’-entry represents
the effect of parenting style source-of-variation in the data, while the ‘within groups’-entry
represents the error source-of-variation in the data. The F value reported (the means square
parenting style variation divided by the mean square error variation) serves as the F statistic
with 3 and 460 degrees of freedom (refer to Table 4.5). Significance is indicated if the
tabulated F value for the relevant degrees of freedom is less than .05(5%).
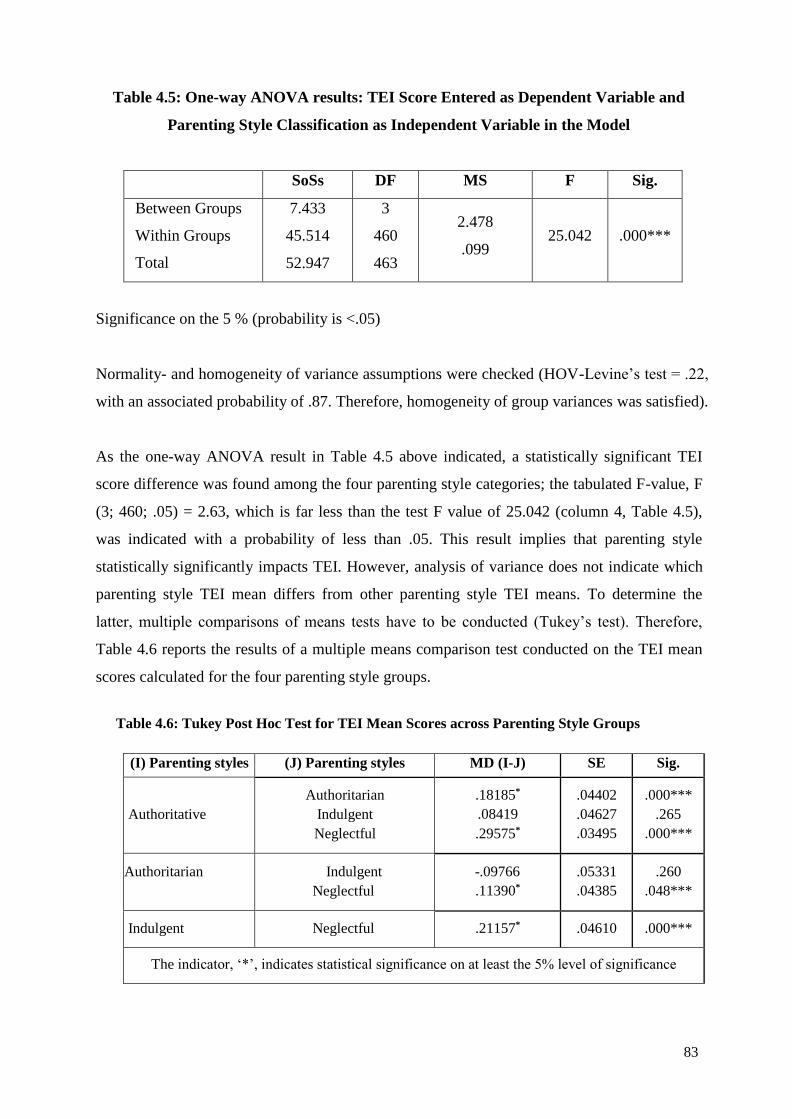
83
Table 4.5: One-way ANOVA results: TEI Score Entered as Dependent Variable and
Parenting Style Classification as Independent Variable in the Model
SoSs DF MS F Sig.
Between Groups
Within Groups
Total
7.433
45.514
52.947
3
460
463
2.478
.099
25.042
.000***
Significance on the 5 % (probability is <.05)
Normality- and homogeneity of variance assumptions were checked (HOV-Levine’s test = .22,
with an associated probability of .87. Therefore, homogeneity of group variances was satisfied).
As the one-way ANOVA result in Table 4.5 above indicated, a statistically significant TEI
score difference was found among the four parenting style categories; the tabulated F-value, F
(3; 460; .05) = 2.63, which is far less than the test F value of 25.042 (column 4, Table 4.5),
was indicated with a probability of less than .05. This result implies that parenting style
statistically significantly impacts TEI. However, analysis of variance does not indicate which
parenting style TEI mean differs from other parenting style TEI means. To determine the
latter, multiple comparisons of means tests have to be conducted (Tukey’s test). Therefore,
Table 4.6 reports the results of a multiple means comparison test conducted on the TEI mean
scores calculated for the four parenting style groups.
Table 4.6: Tukey Post Hoc Test for TEI Mean Scores across Parenting Style Groups
(I) Parenting styles (J) Parenting styles MD (I-J) SE Sig.
Authoritative
Authoritarian
Indulgent
Neglectful
.18185*
.08419
.29575*
.04402
.04627
.03495
.000***
.265
.000***
Authoritarian Indulgent
Neglectful
-.09766
.11390*
.05331
.04385
.260
.048***
Indulgent Neglectful .21157* .04610 .000***
The indicator, ‘*’, indicates statistical significance on at least the 5% level of significance
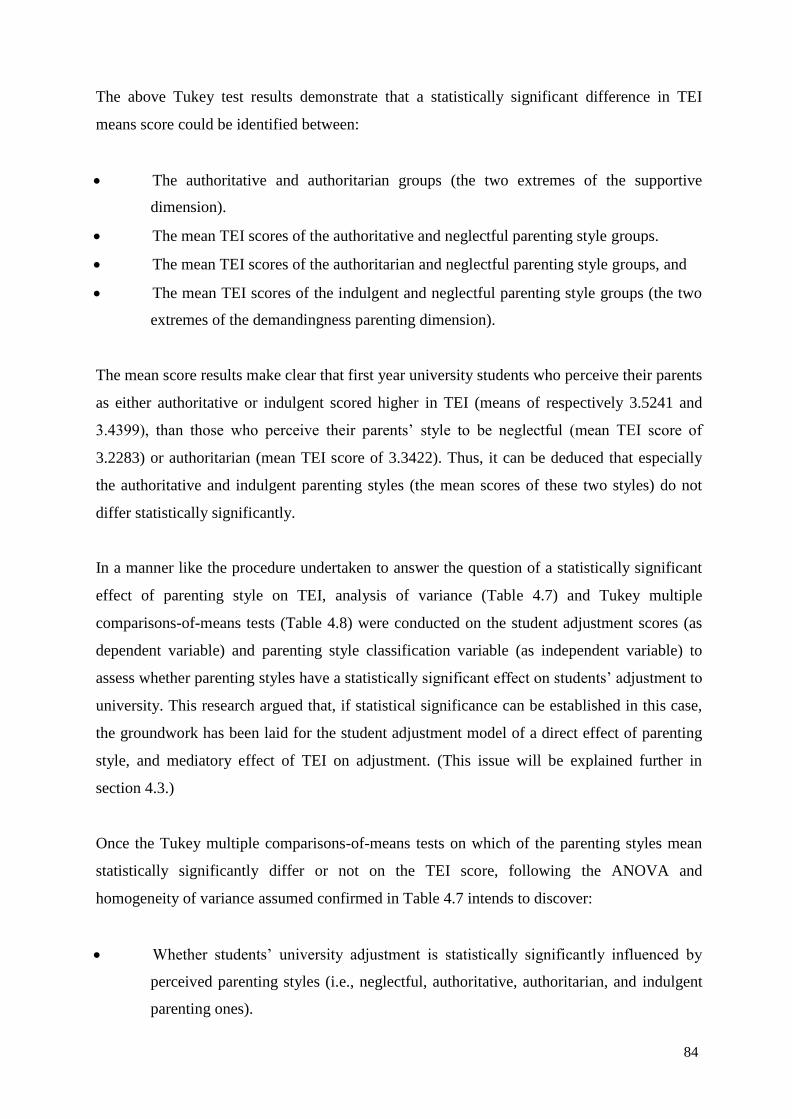
84
The above Tukey test results demonstrate that a statistically significant difference in TEI
means score could be identified between:
The authoritative and authoritarian groups (the two extremes of the supportive
dimension).
The mean TEI scores of the authoritative and neglectful parenting style groups.
The mean TEI scores of the authoritarian and neglectful parenting style groups, and
The mean TEI scores of the indulgent and neglectful parenting style groups (the two
extremes of the demandingness parenting dimension).
The mean score results make clear that first year university students who perceive their parents
as either authoritative or indulgent scored higher in TEI (means of respectively 3.5241 and
3.4399), than those who perceive their parents’ style to be neglectful (mean TEI score of
3.2283) or authoritarian (mean TEI score of 3.3422). Thus, it can be deduced that especially
the authoritative and indulgent parenting styles (the mean scores of these two styles) do not
differ statistically significantly.
In a manner like the procedure undertaken to answer the question of a statistically significant
effect of parenting style on TEI, analysis of variance (Table 4.7) and Tukey multiple
comparisons-of-means tests (Table 4.8) were conducted on the student adjustment scores (as
dependent variable) and parenting style classification variable (as independent variable) to
assess whether parenting styles have a statistically significant effect on students’ adjustment to
university. This research argued that, if statistical significance can be established in this case,
the groundwork has been laid for the student adjustment model of a direct effect of parenting
style, and mediatory effect of TEI on adjustment. (This issue will be explained further in
section 4.3.)
Once the Tukey multiple comparisons-of-means tests on which of the parenting styles mean
statistically significantly differ or not on the TEI score, following the ANOVA and
homogeneity of variance assumed confirmed in Table 4.7 intends to discover:
Whether students’ university adjustment is statistically significantly influenced by
perceived parenting styles (i.e., neglectful, authoritative, authoritarian, and indulgent
parenting ones).
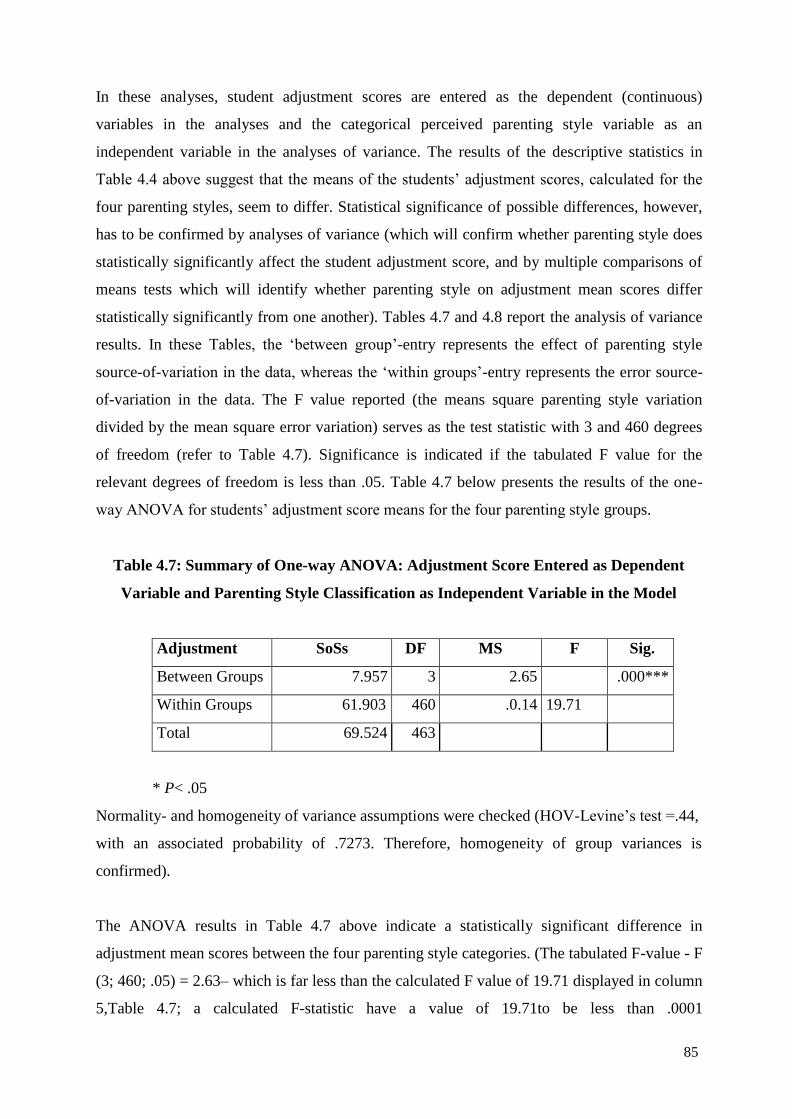
85
In these analyses, student adjustment scores are entered as the dependent (continuous)
variables in the analyses and the categorical perceived parenting style variable as an
independent variable in the analyses of variance. The results of the descriptive statistics in
Table 4.4 above suggest that the means of the students’ adjustment scores, calculated for the
four parenting styles, seem to differ. Statistical significance of possible differences, however,
has to be confirmed by analyses of variance (which will confirm whether parenting style does
statistically significantly affect the student adjustment score, and by multiple comparisons of
means tests which will identify whether parenting style on adjustment mean scores differ
statistically significantly from one another). Tables 4.7 and 4.8 report the analysis of variance
results. In these Tables, the ‘between group’-entry represents the effect of parenting style
source-of-variation in the data, whereas the ‘within groups’-entry represents the error source-
of-variation in the data. The F value reported (the means square parenting style variation
divided by the mean square error variation) serves as the test statistic with 3 and 460 degrees
of freedom (refer to Table 4.7). Significance is indicated if the tabulated F value for the
relevant degrees of freedom is less than .05. Table 4.7 below presents the results of the one-
way ANOVA for students’ adjustment score means for the four parenting style groups.
Table 4.7: Summary of One-way ANOVA: Adjustment Score Entered as Dependent
Variable and Parenting Style Classification as Independent Variable in the Model
Adjustment SoSs DF MS F Sig.
Between Groups 7.957 3 2.65 .000***
Within Groups 61.903 460 .0.14 19.71
Total 69.524 463
* P< .05
Normality- and homogeneity of variance assumptions were checked (HOV-Levine’s test =.44,
with an associated probability of .7273. Therefore, homogeneity of group variances is
confirmed).
The ANOVA results in Table 4.7 above indicate a statistically significant difference in
adjustment mean scores between the four parenting style categories. (The tabulated F-value - F
(3; 460; .05) = 2.63– which is far less than the calculated F value of 19.71 displayed in column
5,Table 4.7; a calculated F-statistic have a value of 19.71to be less than .0001

86
(indicated in the last column of Table 4.7) – which is of course less than .05 and highly
significant.)
The mean score (in Table 4.4 above, M= 3.6328, M=3.5227, M=3.5192, and M=3.3113)
results for authoritative, authoritarian, indulgent, and neglectful parenting styles respectively
indicate that first year university students who perceive their parents as authoritative (M=
3.6328) have a higher score than those who perceived their parents as authoritarian
(M=3.5227), indulgent (M=3.5192) and neglectful (M=3.3113). This implies that first year
university students who perceive their parents as authoritative have a significantly high
students’ adjustment to university score. In other words, such students who rated their parents
as authoritative better meet the academic, social, personal-emotional, and institutional
attachment demands of a higher education institution compared to those students in this group
who perceive their parents as authoritarian, with indulgent and neglectful parenting styles;
therefore the former was more important for adjustment to university than other parenting
style classifications.
This result implies that parenting styles impact first year students’ adjustment to university life
statistically significantly. However, an analysis of variance does not indicate which parenting
style adjustment mean score differs from other parenting style adjustment score means. To
determine this, multiple comparisons of means tests have to be conducted (Tukey’s test).
Table 4.8 records the results of a multiple means comparison test conducted on the students’
adjustment mean scores calculated for the four parenting style groups.
Table 4.8: Tukey Post Hoc Test for Adjustment Mean Scores across Parenting Style
Groups
(I) Parenting styles (J) Parenting styles MD (I- J) SE Sig.
Authoritative Authoritarian
Indulgent
Neglectful
.11015
.11358
.32153*
.05256
.05525
.04174
.156
.169
.000***
Authoritarian
Indulgent
Neglectful
.00344
.21139*
.06365
.05236
1.000
.000***
Indulgent Neglectful .20795* .05505 .001***
87
The above Tukey test results indicate that statistically significant differences in adjustment
means scores were identified between:
The authoritative and neglectful groups (the two extremes of the supportive
dimension).
The mean adjustment scores of the authoritarian and neglectful parenting style
groups, and
The mean adjustment scores of the indulgent and neglectful parenting style groups
(the two extremes of the demandingness parenting dimension).
The mean score results confirm that first year university students who perceive their parents as
authoritative scored higher in adjustment (M= 3.6328), than those who perceive their parents’
style to be authoritarian, indulgent and neglectful (mean adjustment score of respectively
3.5227, 3.5192, and 3.3113).
Nevertheless, no statistically significant mean difference in adjustment score was found
between those first year university students who perceive their parents as practicing:
Authoritative and authoritarian (.11015),p>.05
Authoritative and indulgent (.11358), p> .05)and
Authoritarian and indulgent parenting styles (.00344), p>.05.
Once the influence of parenting style on TEI and adjustment using one way analysis of
variance was ensured, the following section (4.2.4) justifies this; (Table 4.9-4.12) reports the
influence of gender on TEI and adjustment as investigated using the independent sample t-test.
4.2.4 Differences in TEI and adjustment by gender of the participants
In section 4.2.3, emphasis was accorded to whether the dependent variables (TEI and
adjustment to university) differed statistically significantly in relation to the independent
variable parenting style classifications. In this part, attention is paid to determining whether
there is a statistically significant difference on the TEI and students’ adjustment means score
in terms of the research participants’ gender. To answer these questions an independent
sample T-test was employed and results reported in the subsequent Tables (4.9-4.12). In these
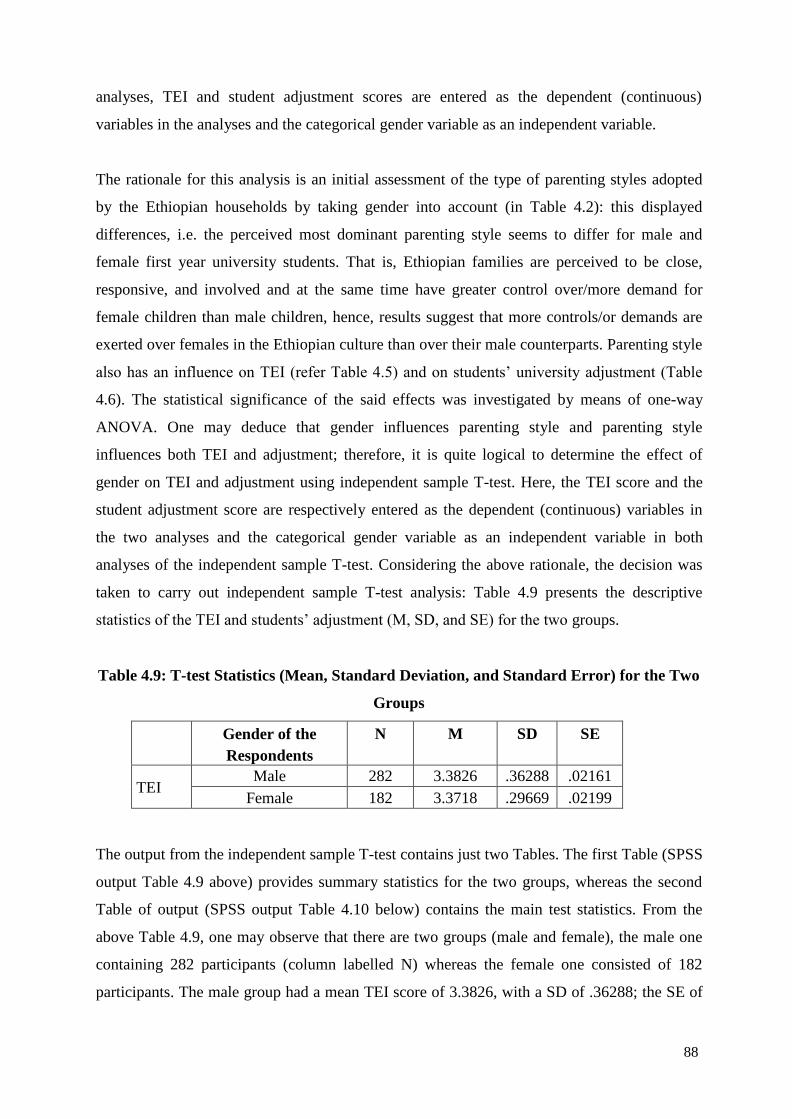
88
analyses, TEI and student adjustment scores are entered as the dependent (continuous)
variables in the analyses and the categorical gender variable as an independent variable.
The rationale for this analysis is an initial assessment of the type of parenting styles adopted
by the Ethiopian households by taking gender into account (in Table 4.2): this displayed
differences, i.e. the perceived most dominant parenting style seems to differ for male and
female first year university students. That is, Ethiopian families are perceived to be close,
responsive, and involved and at the same time have greater control over/more demand for
female children than male children, hence, results suggest that more controls/or demands are
exerted over females in the Ethiopian culture than over their male counterparts. Parenting style
also has an influence on TEI (refer Table 4.5) and on students’ university adjustment (Table
4.6). The statistical significance of the said effects was investigated by means of one-way
ANOVA. One may deduce that gender influences parenting style and parenting style
influences both TEI and adjustment; therefore, it is quite logical to determine the effect of
gender on TEI and adjustment using independent sample T-test. Here, the TEI score and the
student adjustment score are respectively entered as the dependent (continuous) variables in
the two analyses and the categorical gender variable as an independent variable in both
analyses of the independent sample T-test. Considering the above rationale, the decision was
taken to carry out independent sample T-test analysis: Table 4.9 presents the descriptive
statistics of the TEI and students’ adjustment (M, SD, and SE) for the two groups.
Table 4.9: T-test Statistics (Mean, Standard Deviation, and Standard Error) for the Two
Groups
Gender of the
Respondents
N M SD SE
TEI Male 282 3.3826 .36288 .02161
Female 182 3.3718 .29669 .02199
The output from the independent sample T-test contains just two Tables. The first Table (SPSS
output Table 4.9 above) provides summary statistics for the two groups, whereas the second
Table of output (SPSS output Table 4.10 below) contains the main test statistics. From the
above Table 4.9, one may observe that there are two groups (male and female), the male one
containing 282 participants (column labelled N) whereas the female one consisted of 182
participants. The male group had a mean TEI score of 3.3826, with a SD of .36288; the SE of
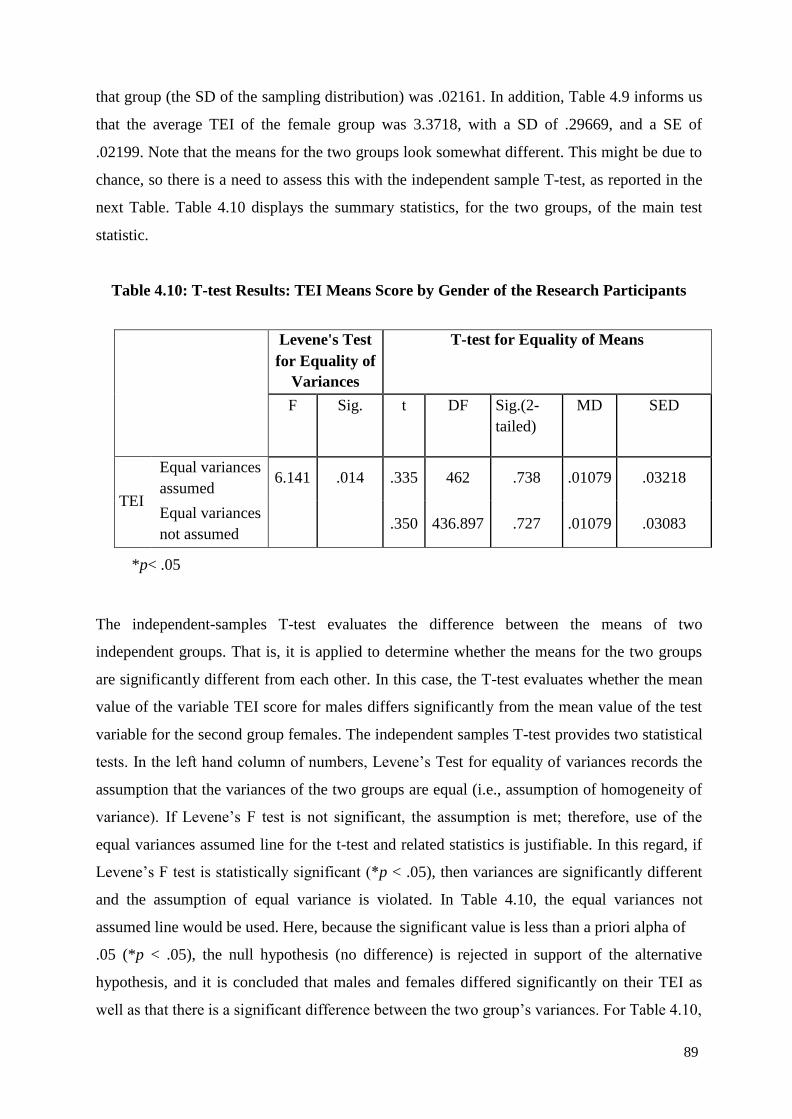
89
that group (the SD of the sampling distribution) was .02161. In addition, Table 4.9 informs us
that the average TEI of the female group was 3.3718, with a SD of .29669, and a SE of
.02199. Note that the means for the two groups look somewhat different. This might be due to
chance, so there is a need to assess this with the independent sample T-test, as reported in the
next Table. Table 4.10 displays the summary statistics, for the two groups, of the main test
statistic.
Table 4.10: T-test Results: TEI Means Score by Gender of the Research Participants
Levene's Test
for Equality of
Variances
T-test for Equality of Means
F Sig. t DF Sig.(2-
tailed)
MD SED
TEI
Equal variances
assumed
Equal variances
not assumed
6.141 .014 .335 462 .738 .01079 .03218
.350 436.897 .727 .01079 .03083
*p< .05
The independent-samples T-test evaluates the difference between the means of two
independent groups. That is, it is applied to determine whether the means for the two groups
are significantly different from each other. In this case, the T-test evaluates whether the mean
value of the variable TEI score for males differs significantly from the mean value of the test
variable for the second group females. The independent samples T-test provides two statistical
tests. In the left hand column of numbers, Levene’s Test for equality of variances records the
assumption that the variances of the two groups are equal (i.e., assumption of homogeneity of
variance). If Levene’s F test is not significant, the assumption is met; therefore, use of the
equal variances assumed line for the t-test and related statistics is justifiable. In this regard, if
Levene’s F test is statistically significant (*p < .05), then variances are significantly different
and the assumption of equal variance is violated. In Table 4.10, the equal variances not
assumed line would be used. Here, because the significant value is less than a priori alpha of
.05 (*p < .05), the null hypothesis (no difference) is rejected in support of the alternative
hypothesis, and it is concluded that males and females differed significantly on their TEI as
well as that there is a significant difference between the two group’s variances. For Table 4.10,

90
on average, males recorded greater TEI scores (M = 3.3826, SD = .36288) than females (M =
3.3718, SD = .29669). This difference was significant t (436.897) = .350, *p< .05. By
examining the group means for this sample of participants, one could observe that males had
higher scores on the TEI score than did females. The next Table (Table 4.11) presents the
summary statistics (M, SD, and SE (SPSS output)) for the two groups (male and female) score
on adjustment.
Table 4.11: T-test Statistics (Mean, Standard Deviation, and Standard Error) for the
Two Groups
Gender of the
Respondents
N M SD SE
Adjustment male 282 3.4674 .40854 .02433
female 182 3.5135 .38184 .02830
From the above Table (4.11), we may note that there are two groups (male and female): as
before, the male group had 282 participants (column labelled N) whereas the female group
contained 182 participants. The male group recorded a mean adjustment score of 3.4674, with
a SD of .40854 and a SE of .02433. In addition, the table tells us that the average adjustment
score of the female group was 3.5135, with a SD of 38184, and a SE of .02830. That is, the
means for the two groups look somewhat different. This might again be due to chance; hence
there is a need to evaluate this with the independent sample T-test in the next Table. Table
4.12 displays the summarised main test statistics for the two groups.
Table 4.12: T-test Results: Adjustment Means Score by Gender of the Research
Participants
Levene's Test
for equality of
variances
T-test for Equality of Means
F Sig. t DF Sig. (2-
tailed)
MD SED
Equal variances
assumed Adjustment
Equal variances
not assumed
.142 .706 -1.217
-1.235
462
404.89
.224
.218
-.04609
-.04609
.03787
.03732
*P< .05
91
The independent-samples T-test evaluates the difference between the means of two
independent groups. In the left hand two columns of numbers, Levene’s Test reports the
equality of variances for the assumption that the variances of the two groups are equal (i.e.,
assumption of homogeneity of variance). Here, Levene’s F test is not significant, the
assumption is not violated (that is, the assumption is met), and one may use the equal
variances assumed line for the T-test and related statistics without adjusting the t, DF, and sig.
as appropriate. Here, because the significant value is greater than the a priori alpha of .05 (p>
.05), this supports the alternative hypothesis, and one may conclude that males and females do
not differ significantly on their adjustment score and also that there is not a significant
difference between the two group’s variances. That is, the assumption of homogeneity of
variance is met. If this is the case, we must use the data results associated with the equal
variances assumed, and interpret the data accordingly. That is, we would use the top line of
information for the T-test. For the above Table 4.12, the males’ adjustment score was (M =
3.4674, SD = .40854) while the females had (M = 3.5135, SD = .38184). This difference was
not significant t (462) = -1.217, p> .05. As Table 4.12 also confirmed, there is no statistically
significant adjustment score difference between female and male first year university students.
To sum up: explaining all variables used in analyses at this point is crucial so as to increase the
reader’s understanding. To begin with, after the demographic variables were discussed to
gather status information about the research participants, the Cronbach’s alpha values of the
constructs and sub-constructs and internal consistency reliability were verified. With internal
consistency, the reliability of all construct scores (TEI, students’ university adjustment,
parental responsiveness and demandingness) was calculated and it was argued that this
approach would ensure that the analysis results and discussion were manageable in this thesis.
The rationale for the scale reliability tests and the exploratory analyses of variance was to
verify the internal consistency reliability of the constructs measured in the research as well as
to obtain an initial indication of factors influencing adjustment and TEI.
Subsequently, the parenting styles for all respondents as well as parenting style-frequencies
according to male and female research respondents were observed. The purpose of this
classification exercise was to identify the parenting style predominantly practiced in the
Ethiopian cultural context, in general, and gender-wise issues in particular. Thus, if gender is
ignored or considered, all parenting styles (i.e., neglectful, authoritative, authoritarian and
indulgent parenting styles) were perceived to be practiced in the Ethiopian households.
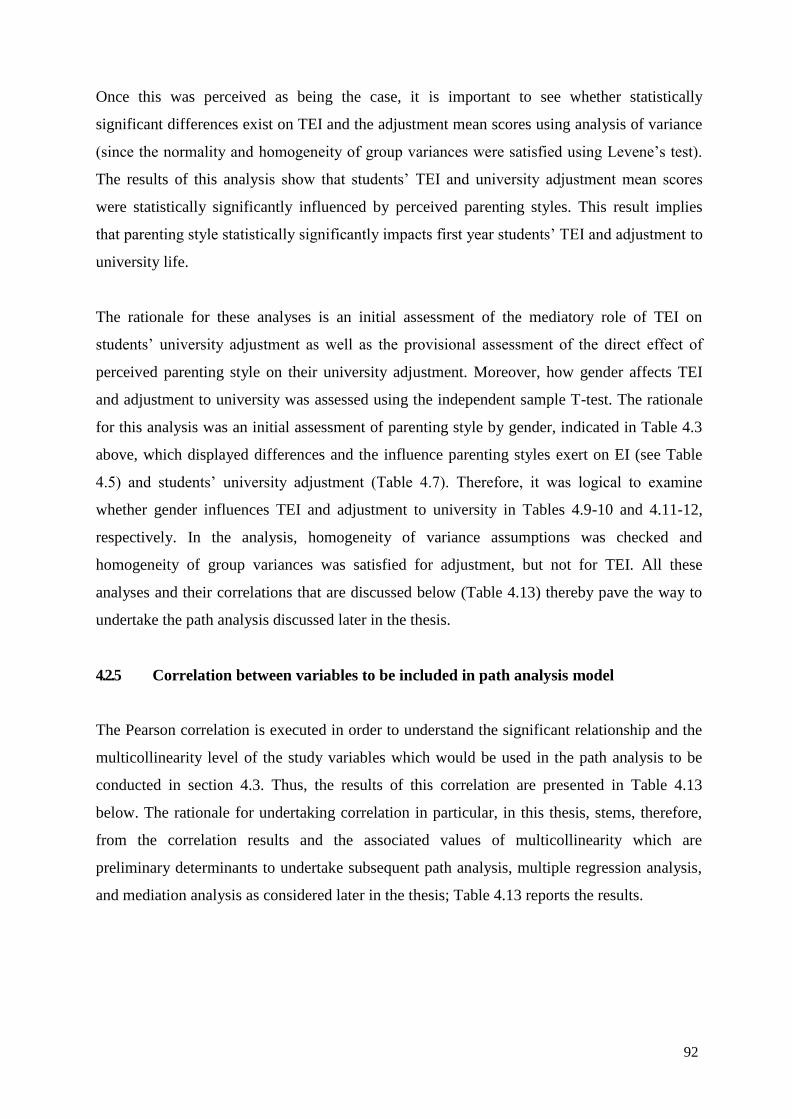
92
Once this was perceived as being the case, it is important to see whether statistically
significant differences exist on TEI and the adjustment mean scores using analysis of variance
(since the normality and homogeneity of group variances were satisfied using Levene’s test).
The results of this analysis show that students’ TEI and university adjustment mean scores
were statistically significantly influenced by perceived parenting styles. This result implies
that parenting style statistically significantly impacts first year students’ TEI and adjustment to
university life.
The rationale for these analyses is an initial assessment of the mediatory role of TEI on
students’ university adjustment as well as the provisional assessment of the direct effect of
perceived parenting style on their university adjustment. Moreover, how gender affects TEI
and adjustment to university was assessed using the independent sample T-test. The rationale
for this analysis was an initial assessment of parenting style by gender, indicated in Table 4.3
above, which displayed differences and the influence parenting styles exert on EI (see Table
4.5) and students’ university adjustment (Table 4.7). Therefore, it was logical to examine
whether gender influences TEI and adjustment to university in Tables 4.9-10 and 4.11-12,
respectively. In the analysis, homogeneity of variance assumptions was checked and
homogeneity of group variances was satisfied for adjustment, but not for TEI. All these
analyses and their correlations that are discussed below (Table 4.13) thereby pave the way to
undertake the path analysis discussed later in the thesis.
4.2.5 Correlation between variables to be included in path analysis model
The Pearson correlation is executed in order to understand the significant relationship and the
multicollinearity level of the study variables which would be used in the path analysis to be
conducted in section 4.3. Thus, the results of this correlation are presented in Table 4.13
below. The rationale for undertaking correlation in particular, in this thesis, stems, therefore,
from the correlation results and the associated values of multicollinearity which are
preliminary determinants to undertake subsequent path analysis, multiple regression analysis,
and mediation analysis as considered later in the thesis; Table 4.13 reports the results.
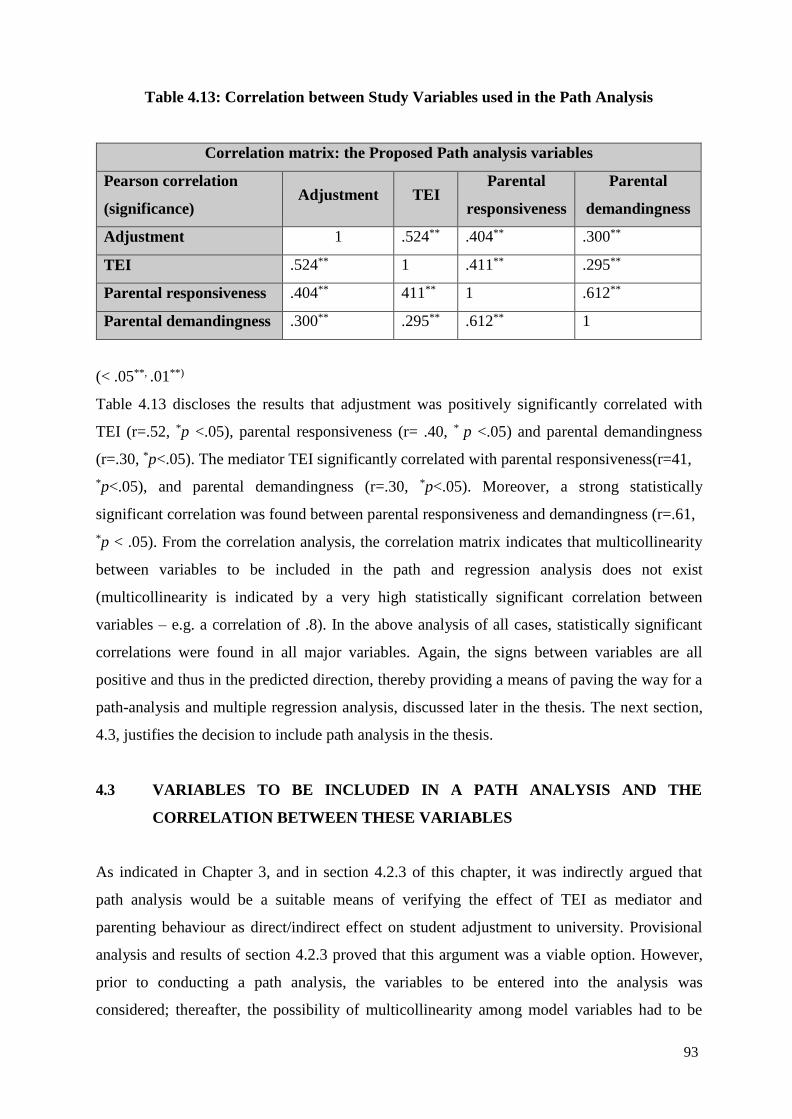
93
Table 4.13: Correlation between Study Variables used in the Path Analysis
Correlation matrix: the Proposed Path analysis variables
Pearson correlation
(significance) Adjustment TEI
Parental
responsiveness
Parental
demandingness
Adjustment 1 .524** .404**
.300**
TEI .524** 1 .411**
.295**
Parental responsiveness .404** 411**
1 .612**
Parental demandingness .300** .295**
.612** 1
(< .05**, .01**)
Table 4.13 discloses the results that adjustment was positively significantly correlated with
TEI (r=.52, *p <.05), parental responsiveness (r= .40, * p <.05) and parental demandingness
(r=.30, *p<.05). The mediator TEI significantly correlated with parental responsiveness(r=41,
*p<.05), and parental demandingness (r=.30, *p<.05). Moreover, a strong statistically
significant correlation was found between parental responsiveness and demandingness (r=.61,
*p < .05). From the correlation analysis, the correlation matrix indicates that multicollinearity
between variables to be included in the path and regression analysis does not exist
(multicollinearity is indicated by a very high statistically significant correlation between
variables – e.g. a correlation of .8). In the above analysis of all cases, statistically significant
correlations were found in all major variables. Again, the signs between variables are all
positive and thus in the predicted direction, thereby providing a means of paving the way for a
path-analysis and multiple regression analysis, discussed later in the thesis. The next section,
4.3, justifies the decision to include path analysis in the thesis.
4.3 VARIABLES TO BE INCLUDED IN A PATH ANALYSIS AND THE
CORRELATION BETWEEN THESE VARIABLES
As indicated in Chapter 3, and in section 4.2.3 of this chapter, it was indirectly argued that
path analysis would be a suitable means of verifying the effect of TEI as mediator and
parenting behaviour as direct/indirect effect on student adjustment to university. Provisional
analysis and results of section 4.2.3 proved that this argument was a viable option. However,
prior to conducting a path analysis, the variables to be entered into the analysis was
considered; thereafter, the possibility of multicollinearity among model variables had to be
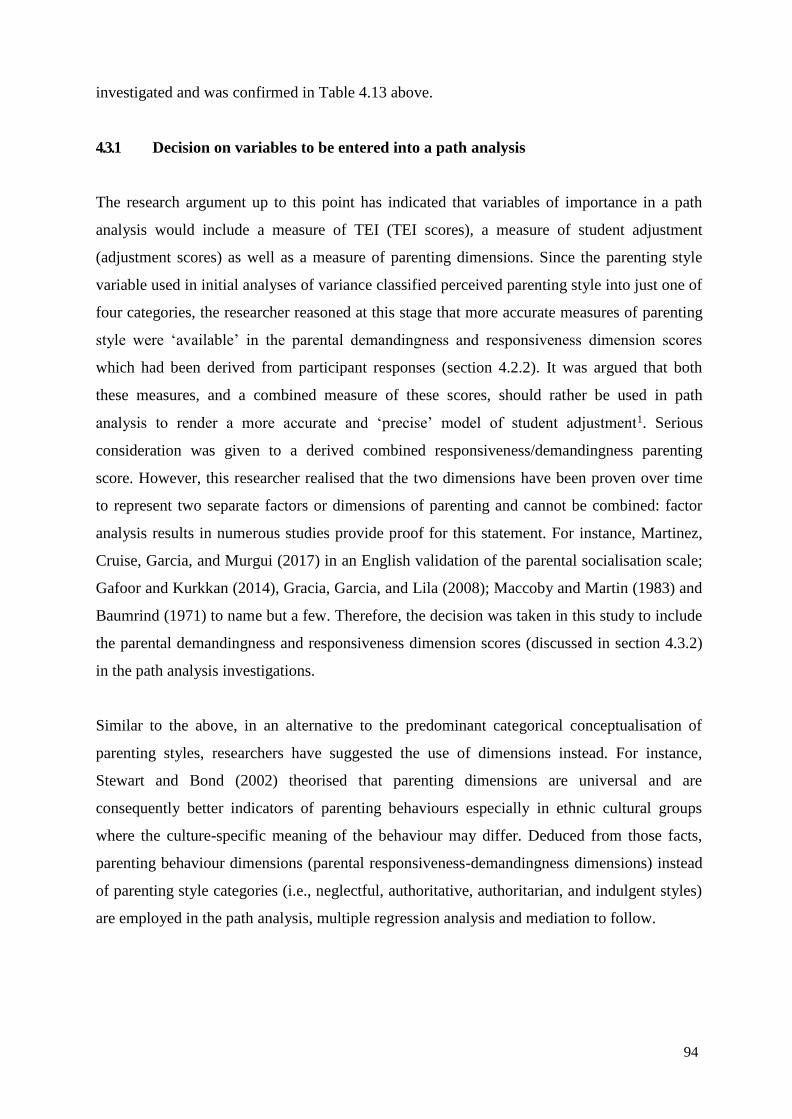
94
investigated and was confirmed in Table 4.13 above.
4.3.1 Decision on variables to be entered into a path analysis
The research argument up to this point has indicated that variables of importance in a path
analysis would include a measure of TEI (TEI scores), a measure of student adjustment
(adjustment scores) as well as a measure of parenting dimensions. Since the parenting style
variable used in initial analyses of variance classified perceived parenting style into just one of
four categories, the researcher reasoned at this stage that more accurate measures of parenting
style were ‘available’ in the parental demandingness and responsiveness dimension scores
which had been derived from participant responses (section 4.2.2). It was argued that both
these measures, and a combined measure of these scores, should rather be used in path
analysis to render a more accurate and ‘precise’ model of student adjustment1. Serious
consideration was given to a derived combined responsiveness/demandingness parenting
score. However, this researcher realised that the two dimensions have been proven over time
to represent two separate factors or dimensions of parenting and cannot be combined: factor
analysis results in numerous studies provide proof for this statement. For instance, Martinez,
Cruise, Garcia, and Murgui (2017) in an English validation of the parental socialisation scale;
Gafoor and Kurkkan (2014), Gracia, Garcia, and Lila (2008); Maccoby and Martin (1983) and
Baumrind (1971) to name but a few. Therefore, the decision was taken in this study to include
the parental demandingness and responsiveness dimension scores (discussed in section 4.3.2)
in the path analysis investigations.
Similar to the above, in an alternative to the predominant categorical conceptualisation of
parenting styles, researchers have suggested the use of dimensions instead. For instance,
Stewart and Bond (2002) theorised that parenting dimensions are universal and are
consequently better indicators of parenting behaviours especially in ethnic cultural groups
where the culture-specific meaning of the behaviour may differ. Deduced from those facts,
parenting behaviour dimensions (parental responsiveness-demandingness dimensions) instead
of parenting style categories (i.e., neglectful, authoritative, authoritarian, and indulgent styles)
are employed in the path analysis, multiple regression analysis and mediation to follow.
95
The variables of interest included in the parenting dimensions-TEI-student adjustment path
analysis model (results presented in section 4.3.2) include:
Student adjustment scores
TEI scores
Parental responsiveness scores
Parental demandingness scores
4.3.2 Path analysis on the study variables (TEI, adjustment, parental responsiveness,
and parental demandingness)
To construct a path diagram, the following pieces of information are required. The first is the
correlation matrix among the variables. Thereafter, one begins the path analysis by writing
down the exogenous variables and connecting each pair with a double-headed arrow. The
second piece is writing the endogenous variable. From each exogenous variable, one draws a
straight, single headed arrow shooting into the endogenous variable. After doing that, one
makes a notation for a residual variable and draws an arrow from it into the endogenous
variable. Finally, path coefficients are used to decompose correlations in the model into direct
and indirect effects, reflected in the arrows in the model. Moreover, the total effects are
calculated–the aggregate effect of direct and indirect effects shooting into the endogenous
variables. All these paths, with their respective endogenous, exogenous, and error terms, were
derived from AMOS. The resulting model is illustrated in Figure 4.1 below.
Figure 4.1: The Demandingness-Responsiveness Dimensions of Parenting Style-TEI-
Adjustment Model

96
The above Path model 4.1 contains the following variables (Group number 1)
Observed, endogenous variables
Adjustment and TEI
Observed, exogenous variables
Parental responsiveness and Parental demandingness
Unobserved, exogenous variables
e1 and e2
Variable counts (Group number 1)
Number of variables in the model: 6
Number of observed variables: 4
Number of unobserved variables: 2
Number of exogenous variables: 4
Number of endogenous variables: 2
Computation of degrees of freedom (Default model)
Number of distinct sample moments: 10
Number of distinct parameters to be estimated: 10
DF (10-10): 0
Result (Default model)
Minimum was achieved
Chi-square=.000, Degrees of Freedom (DF) = 0, and probability level, cannot be computed
4.3.3 Evaluation of the Model Fit
Here, in the above model, I included all direct and indirect relationships between the
exogenous variables, the mediator, and endogenous variable. This process left me with a
model which was a just-identified one: that is, one with no DF, a model with DF = 0 (number
of data variances and covariances equals the number of parameters). The existence of a DF
makes it possible to test the model fit, but the model in Figure 4.1 above shows no DF and,
without this, the model can never be rejected. Therefore, rendering the model for scientific use
is not possible.
In addition, overall model fit is determined among others using Chi-square, Root Mean
Square Error of Approximation (RMSEA), Root Mean Square Residual (RMSR),
Comparative Fit Index (CFI), Normed Fit Index (NFI), and the Goodness of Fit Index (GFI).
97
In this respect, good fit was defined as CFI values ≥ .95, RMSEA values ≤ .06, RMSR values
≤ .08, the NFI value of .9 or higher, and the GFI, a value of >.9 (Hu & Bentler, 1999). See the
index outputs in the addendum attached ‘O’.
Generally, the overall model fit index was checked using the following parameters:
The chi-square test–indicates the amount of difference between expected and
observed covariance matrices, where a value close to zero indicates little difference
between the expected and observed covariance matrices. For the above model 4.1,
since the probability value of the chi-square test is smaller than the .05 level, thereby,
it is to reject the null hypothesis that the model fits the data perfectly. Due to this
reason the model cannot satisfy chi-square fit index parameter.
Another method of evaluating the fit of the model is to look at the GFI– which tells
us what proportion of the variance in the sample variance covariance matrix is
accounted for by the model; since the above model’s GFI value was (1.00) which is
above the recommended value of > .9 (Hu & Bentler, 1999), there is no problem in
this index measure.
RMSR– which is an index of the amount by which the estimated model variances
and covariances differ from the observed variances and covariances; this was a value
of .000 which is significantly below the recommended value of ≤ .08), again, there is
no problem in this fit index measure (Hu & Bentler,1999).
NFI– is simply the difference between the two models’ chi-squares divided by the
chi-square for the independence model; it has a value of 1.00 which is in the range of
the recommended value of .9 or higher and therefore indicates a perfect fit in this
parameter.
CFI–analyses the model fit by examining the discrepancy between the data and the
hypothesised model, while adjusting for the issues of sample size inherent in the chi-
squared test of model fit and the norm fit index. In this case it has a value of 1.00 so
that it is a perfect fit.
Tucker-Lewis Index (TLI) – result of .993 is considerably above the .95 threshold,
denoting satisfactory model fit.
The other method of evaluating the fit of the model is to look at the RMSEA– it is
related to residual in the model, and the value of it in the above model was .414,
which exceeded the recommended guideline for a good-fitting model value of ≤ .06
(Hu & Bentler, 1999), indicates a poor fit.

98
As may be noticed from those indices, the model partially satisfies some requirements but not
all, therefore, it is not a fitted model to the empirical data. Consequently, it was mandatory to
take a decision to re-specify the model so as to modify it until it satisfies the very basic
requirements/parameters.
4.3.4 Decision on modifying a model to check for fit by freeing a path/s
In the just-identified model which was displayed as Figure 4.1, the chi-square has a value of
zero. Therefore, a necessary step is deleting or freeing one or more of the paths until one
obtains an over-identified model having a chi-square value different from zero and a positive
degree of freedom. For any model, elimination of any nonzero path will reduce the fit of the
model with data, thereby, increasing the value of the chi-square. If an unacceptable model fit
like the above one is found, the model could be revised when the modifications are
meaningful. In the upcoming model, modification involves beginning by freeing a parameter
that was fixed. Thus, the above analysis indicated relational links that I could exclude in the
second analysis (the direct effect of parental demandingness on TEI). The re-specification to a
second model on the baseline model was done, based on knowledge of the nature of the
variables.
Once I did this, I re-ran it to see if the model is fit at this level; therefore, I modify the original
model until it is better fitting. The model used for the second analysis was an over-identified
one, drawn in Figure 4.2 below. An over-identified model (DF>0): number of covariances >
number of model parameters which are necessary for identification and model fit to the indices
available, has a positive DF (as opposed to the previous model which was described as just
identified). Having a positive DF allows us to examine the fit of the model using the chi-
square test of model fit, along with fit indices: for example, CFI, GFI, and TLI, are some
incremental fit indices, which should be greater than .90 for a goodness of fit model, while
RMSEA and RMSR should be less than .06/.08 respectively for a goodness of fit model.
Moreover, a non-significant chi-square value in path analysis indicated the goodness of fit
model. The chi-square value is no longer zero and can be used to evaluate model fit. Having a
positive DF, hence providing informative values of the fit indices, allowed me to better
evaluate how well the model fits. The specific coefficient estimates from this model are
generally interpreted accordingly, following the illustrated model displayed in Figure 4.2
below.
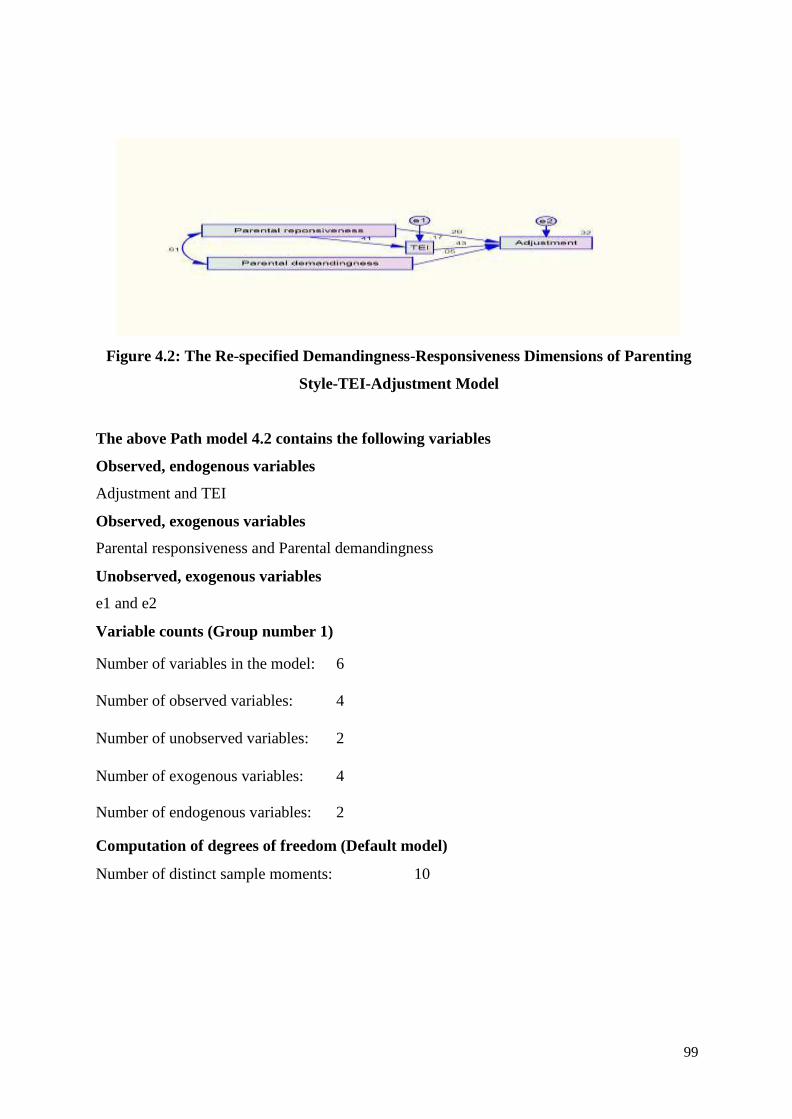
99
Figure 4.2: The Re-specified Demandingness-Responsiveness Dimensions of Parenting
Style-TEI-Adjustment Model
The above Path model 4.2 contains the following variables
Observed, endogenous variables
Adjustment and TEI
Observed, exogenous variables
Parental responsiveness and Parental demandingness
Unobserved, exogenous variables
e1 and e2
Variable counts (Group number 1)
Number of variables in the model: 6
Number of observed variables: 4
Number of unobserved variables: 2
Number of exogenous variables: 4
Number of endogenous variables: 2
Computation of degrees of freedom (Default model)
Number of distinct sample moments: 10

100
Number of distinct parameters to be estimated: 9
DF (10-9): 1
Result (Default model)
Chi-square=1.725, DF = 1, and probability level =.189
4.3.5 Model fit summary using fit index parameters
In reporting path analyses it is a good idea to report multiple-fit indexes, the fit-index
parameters discussed here are good choices to report as they examine fit in different but
related ways. Generally, results following the modified model can be summarised in the
following manner:
Chi-square– the non-significant chi-square indicates that the fit between the over-
identified model and the data is significantly better than the fit between the just-
identified model and the data. While one might argue that non-significance (p>.05) of
this chi-square indicates that the reduced model fits the data well.
Another method of evaluating the fit of the model is to look at the Minimum
Discrepancy (CMIN) – it is a chi- square statistic comparing the tested model and the
independence model to the saturated model. CMIN is an index of how much the fit of
data to the model has been reduced by dropping one or more paths. One rule of thumb
is to decide to drop too many paths if this index exceeds 2 or 3; but in this model
(Figure 4.2) the CMIN index is less than 2, so there is no need to drop many paths.
For the details see addendum ‘P’.
The RMSR– is an index of the amount by which the estimated model variances and
covariances differ from the observed variances and covariances. Smaller is better. The
recommended value of RMSR is ≤ .08 (Hu & Bentler, 1999). Therefore, a value of
.003 indicates an adequate fit. Addendum ‘P‘verifies the result.
The other fit index is the GFI – this tells us what proportion of the variance in the
sample variance covariance matrix is accounted for by the model. This should exceed
.9 for a good model. For the over-identified model it was .998; therefore it approached a
perfect fit and the result is displayed well in the addendum attached ‘P’.
The other fit index parameter is the NFI –which is simply the difference between the
two models’ chi-squares divided by the chi-square for the independence model. For
this data, that is .996. Values of .9 or higher indicate good fit. Hence in this case there seems
a perfect fit. Addendum ‘P’ gives a proof of it.
101
Another method of evaluating the fit of the model is to look at the CFI – this is equal
to the discrepancy function, adjusted for sample size. Acceptable model fit is
indicated by a CFI value of .90 or greater (Hu & Bentler, 1999). In the over-identified
model above its CFI value is .998; therefore, it is closer to 1 which is the best fit. Its
output is displayed in the addendum ’P’.
The other fit index parameter is RMSEA – an acceptable model fit is indicated by an
RMSEA value of .06 or less (Hu & Bentler, 1999). In the above model (Figure 4.2),
the RMSEA value is .040 so that it indicates a good fit to the empirical data (this is
very small and is indicative of a good fitting model; the result is located at addendum
‘P’.
As may be noticed from those indices displayed above, model 4.2 fully satisfies all the index
requirements; hence, the model is a fit one. As a consequence, re-specification of this model
was unnecessary. Given the information from all above fit indexes, we can conclude that our
hypothesized path model is reasonable.
Generally, the fit indices and model comparison revealed that the re-specified model which
was designated on the baseline model showed a good overall fit to the empirical data, with
χ2(1)= 1.725, p > .189, NFI = .996, CFI = .998, RMSEA = .04, whereas the base line model
displayed rather misfits, with χ2 (0) = .000, * p< .000, NFI = 1.00, CFI = 1.00, RMSEA= .414.
This implies that the two models have different fitness levels, indicating that undertaking
modification on the base line model to obtain the model to fit the empirical data was a logical
step, which in turn, could be useful to replicate the findings in future research.
While interpreting the re-specified path model 4.2, parental demandingness had only a
statistically significant direct effect on adjustment (β= .055, *p<.05). Nevertheless, parental
responsiveness had a direct, positive statistically significant effect on TEI (standardised, β
=.411, *p <.05), had a statistically significant direct (β= .196, *p<.05) and indirect (β=.176, *
p<.05) effects on adjustment. In addition, TEI had a statistically significant, positive and direct
effect on adjustment (β = .428, *p< .05). This, in turn, implies that first year university
students who perceive their maternal and paternal figures as loving, responsive, involved,
displaying warmth, acceptance, and closeness as measured using the responsiveness scale,
were found to have significantly higher self-perceptions on their emotional abilities, skills, and
personality characteristics. These, in turn, influence their ability to cope more successfully
with environmental demands and pressures inherent at university than their counter parts.

102
Generally, from the above Path model 4.2 one can infer that adjustment is a function of
parental responsiveness, parental demandingness, and TEI. When comparisons of the strength
of the paths from the predictors (parental responsiveness, parental demandingness, and TEI) to
the endogenous (adjustment) were taken into account, the path from TEI to adjustment was
stronger, followed by the path from parental responsiveness and demandingness to adjustment.
However, parental responsiveness is a strong predictor and has a relatively stronger effect on
the TEI development than was the case for adjustment (see also the path diagram of Figure
4.2). This result indicates that there was a significant direct effect between TEI and
adjustment, and between parental responsiveness and adjustment, which potentially confirms
that the adjustment scale is able to explain the relationship between parenting dimension/style
and TEI.
Having testing the model fit index and ensuring that the path model 4.2 is quite adequately fit
to the data, the next section presents the multiple regression analysis examining the predictive
effect of the independent variables on the dependent variable, which in turn, paves the way to
undertaking mediation analysis.
4.4 MULTIPLE REGRESSION ANALYSIS
In the previous section, the path analysis was carried out to check if the data was fit with the
parent-TEI-adjustment path model using the absolute fit index measures. In the path analysis
model designation, model 4.1 contained parental responsiveness and demandingness as
exogenous variables, while the path draws in to the endogenous–mediator variable (TEI) and
to the predicted endogenous variables (adjustment). Moreover, there were circles with an
arrow pointing to the dependent variables (TEI and adjustment), known as the
disturbances/error terms. Thereafter, path model 4.1 was checked using absolute fit
parameters; in doing so, the model left me with a zero degree of freedom, a zero chi-square
value, and a probability which could not be computed. In addition, the RMSEA value was not
in the recommended range of ≤ .06 (Hu & Bentler, 1999). Therefore, the path model 4.1 was
not fitted well to the empirical data so that there was a need to re-specify it, based on
knowledge of the variables. Hence, the paths from parental demandingness to TEI were
omitted and the model was checked using the absolute fit index parameters. As a consequence,
path model 4.2 was fitted against the absolute fit index parameters explained above (section
4.3.5). In this section, multiple regression is conducted in order to answer the research
questions, which, in turn, paved the path to undertake mediation analysis. But, before
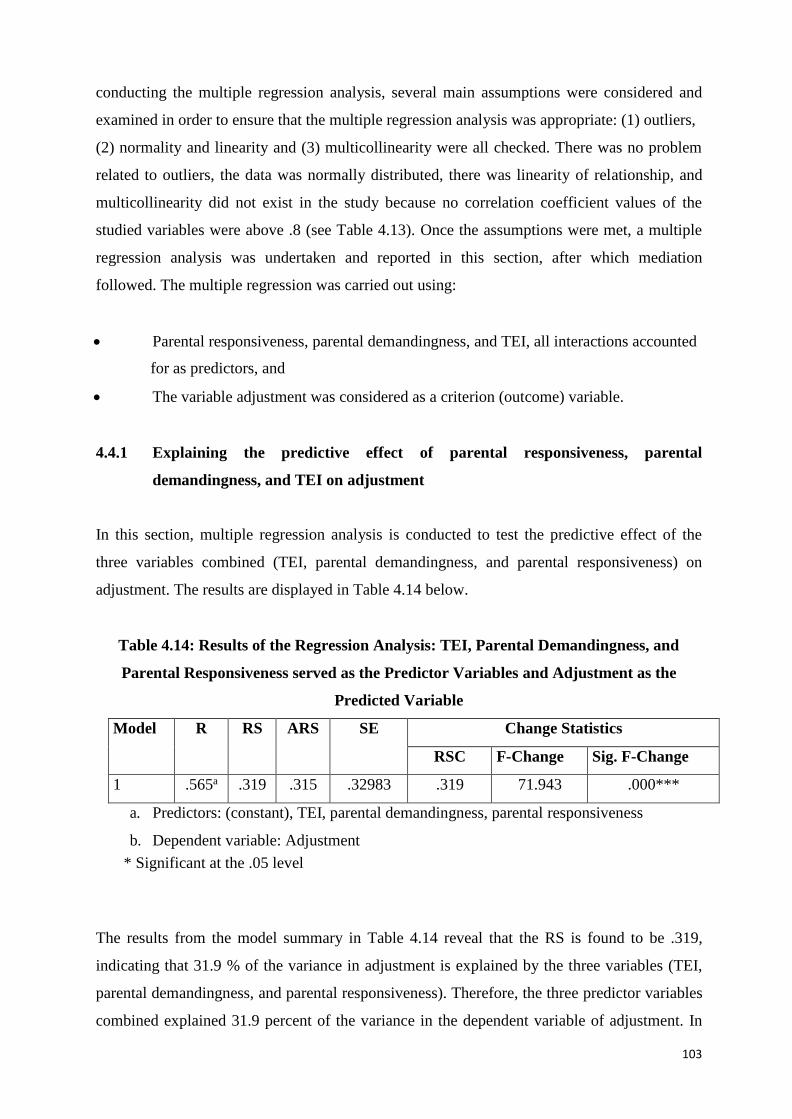
103
conducting the multiple regression analysis, several main assumptions were considered and
examined in order to ensure that the multiple regression analysis was appropriate: (1) outliers,
(2) normality and linearity and (3) multicollinearity were all checked. There was no problem
related to outliers, the data was normally distributed, there was linearity of relationship, and
multicollinearity did not exist in the study because no correlation coefficient values of the
studied variables were above .8 (see Table 4.13). Once the assumptions were met, a multiple
regression analysis was undertaken and reported in this section, after which mediation
followed. The multiple regression was carried out using:
Parental responsiveness, parental demandingness, and TEI, all interactions accounted
for as predictors, and
The variable adjustment was considered as a criterion (outcome) variable.
4.4.1 Explaining the predictive effect of parental responsiveness, parental
demandingness, and TEI on adjustment
In this section, multiple regression analysis is conducted to test the predictive effect of the
three variables combined (TEI, parental demandingness, and parental responsiveness) on
adjustment. The results are displayed in Table 4.14 below.
Table 4.14: Results of the Regression Analysis: TEI, Parental Demandingness, and
Parental Responsiveness served as the Predictor Variables and Adjustment as the
Predicted Variable
Model R RS ARS SE Change Statistics
RSC F-Change Sig. F-Change
1 .565a .319 .315 .32983 .319 71.943 .000***
a. Predictors: (constant), TEI, parental demandingness, parental responsiveness
b. Dependent variable: Adjustment
* Significant at the .05 level
The results from the model summary in Table 4.14 reveal that the RS is found to be .319,
indicating that 31.9 % of the variance in adjustment is explained by the three variables (TEI,
parental demandingness, and parental responsiveness). Therefore, the three predictor variables
combined explained 31.9 percent of the variance in the dependent variable of adjustment. In
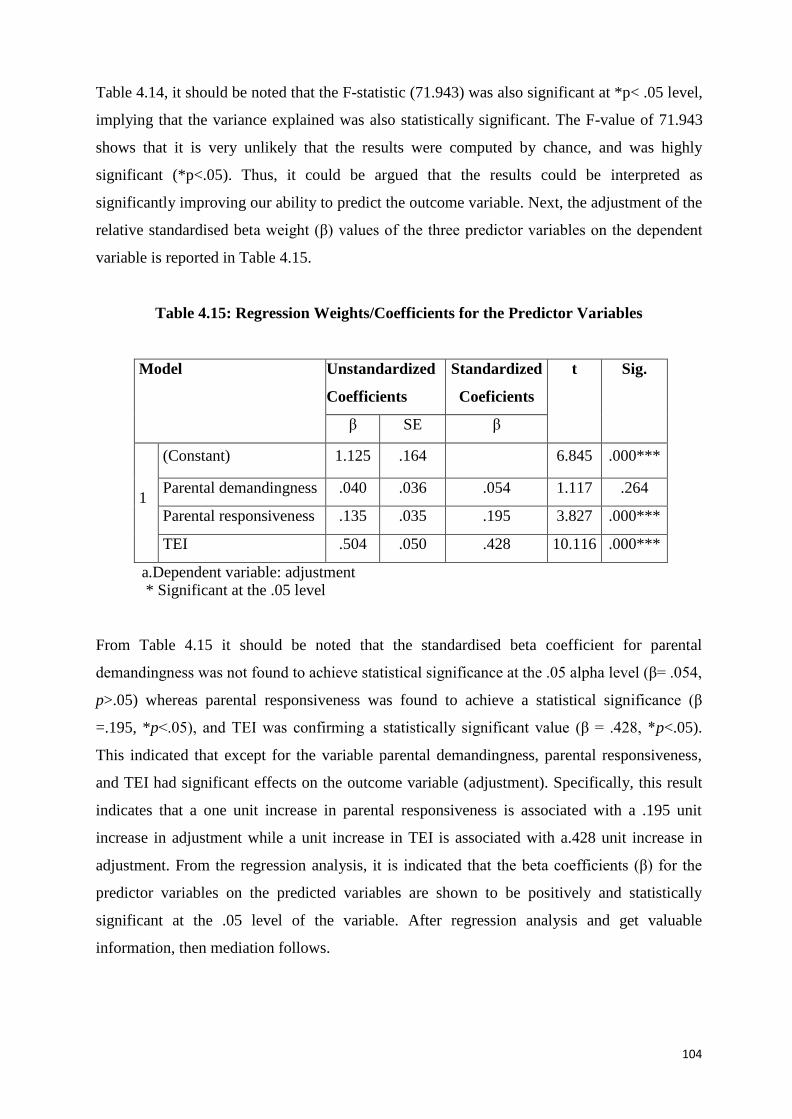
104
Table 4.14, it should be noted that the F-statistic (71.943) was also significant at *p< .05 level,
implying that the variance explained was also statistically significant. The F-value of 71.943
shows that it is very unlikely that the results were computed by chance, and was highly
significant (*p<.05). Thus, it could be argued that the results could be interpreted as
significantly improving our ability to predict the outcome variable. Next, the adjustment of the
relative standardised beta weight (β) values of the three predictor variables on the dependent
variable is reported in Table 4.15.
Table 4.15: Regression Weights/Coefficients for the Predictor Variables
Model Unstandardized
Coefficients
Standardized
Coeficients
t Sig.
β SE β
1
(Constant) 1.125 .164 6.845 .000***
Parental demandingness .040 .036 .054 1.117 .264
Parental responsiveness .135 .035 .195 3.827 .000***
TEI .504 .050 .428 10.116 .000***
a. Dependent variable: adjustment * Significant at the .05 level
From Table 4.15 it should be noted that the standardised beta coefficient for parental
demandingness was not found to achieve statistical significance at the .05 alpha level (β= .054,
p>.05) whereas parental responsiveness was found to achieve a statistical significance (β
=.195, *p<.05), and TEI was confirming a statistically significant value (β = .428, *p<.05).
This indicated that except for the variable parental demandingness, parental responsiveness,
and TEI had significant effects on the outcome variable (adjustment). Specifically, this result
indicates that a one unit increase in parental responsiveness is associated with a .195 unit
increase in adjustment while a unit increase in TEI is associated with a.428 unit increase in
adjustment. From the regression analysis, it is indicated that the beta coefficients (β) for the
predictor variables on the predicted variables are shown to be positively and statistically
significant at the .05 level of the variable. After regression analysis and get valuable
information, then mediation follows.
105
4.5 MEDIATION ANALYSIS
In section 4.4.1 the combined predictive effect of parental responsiveness, parental
demandingness, and TEI on adjustment when these variables were entered together, and their
respective weight/coefficient on adjustment, were discussed. The result showed that all three
variables combined predicted 31.9 percent of the variance on the dependent variable of
adjustment, indicating that these three variables are strong predictors for students’ university
adjustment. When their beta weights are taken into account, parental responsiveness, parental
demandingness, and TEI respectively account for (β= .195, β = .054, and β= .428). While
parental demandingness was entered into a regression model together with parental
responsiveness and TEI, its regression weight was not very small per se when compared to the
other two predictors, but it also had no statistically significant effect on the predicted variable
adjustment at (.05). Once again, in the path analysis (section 4.3.4) the path from parental
demandingness to TEI was omitted since in path model 4.1 unless the path from parental
demandingness to TEI is deleted the model was not fit against the absolute fit index
parameters. On the contrary, all four variables had statistically significant correlations at (.05)
level though parental demandingness had a weak correlation with TEI and adjustment
respectively, with values of (.295 and .300) as compared to the correlation value which
parental responsiveness had with TEI and adjustment respectively (.411 and .404), see Table
4.13). Due to the above facts, it seems pretty controversial to undertake mediation analysis
using parental demandingness. On the other hand, it is also a premature decision to drop
mediation analysis using parental demandingness as a predictor and TEI as a mediator
between parental demandingness and adjustment. It was decided instead to carry out a series
of regression analyses between parental demandingness and TEI (mediator), and parental
demandingness and adjustment (predicted) and see if the outcome was more accommodative
and logical. In relation to this, Baron and Kenny (1986) suggested in their guidelines that to
establish mediation, a series of regression analyses must be performed. Based on this, it is
essential to consider whether parental demandingness affects the adjustment through the
mediator TEI by using subsequent multiple regression analysis. In a basic mediation analysis
an independent variable is hypothesised to influence a mediator which, in turn, influences the
dependent variable. To this effect, Baron and Kenny (1986) indicated that there must be a
significant relationship between the predictors and the dependent variable before testing for a
mediating effect. This was adequately checked (see Table 4.13).
106
After significant correlations have been established among the variables considered, as
suggested by Baron and Kenny (1986), mediation is generally present when the requirements
of four steps are met, in the following order:
The first condition is that the predictor variable (parental demandingness and parental
responsiveness separately) must be significantly correlated with the presumed
mediating variable (TEI).
The second condition of mediation is that the predictor variable (parental
demandingness and parental responsiveness separately) must be significantly
correlated with the dependent variable or criterion (adjustment).
The third condition is that the mediating variable (TEI) is significantly correlated
with the dependent variable or criterion(adjustment)
The fourth condition states that when mediating variable (TEI) is controlled, the
coefficient of correlation between the predictors (parental demandingness and the
predicted variable (adjustment) and parental responsiveness and the predicted variable
(adjustment) is reduced. In the case of full mediation, the independent variable must
no longer significantly predict the dependent variable when the mediator is controlled;
hence the path from the independent to the dependent variable must be zero. Whereas,
in the case of partial mediation, the path from the independent to the dependent
variable is reduced in absolute size, but still different from zero when the mediator is
controlled.
Using those (the above) steps, the following two mediation analyses together with the
regression analysis are discussed in the following order:
The mediation effect of TEI on the relationship between parental responsiveness and
adjustment.
The mediation effect of TEI in the relationship between parental demandingness and
adjustment.
4.5.1 TEI mediates the relationship between parental responsiveness and adjustment
To answer this question as has been suggested by Baron and Kenny (1986), a mediation effect
is generally present when the requirements of the four steps, in order, can be met. Basically,
the first three conditions were met (tested) through the Pearson-correlation analysis conducted
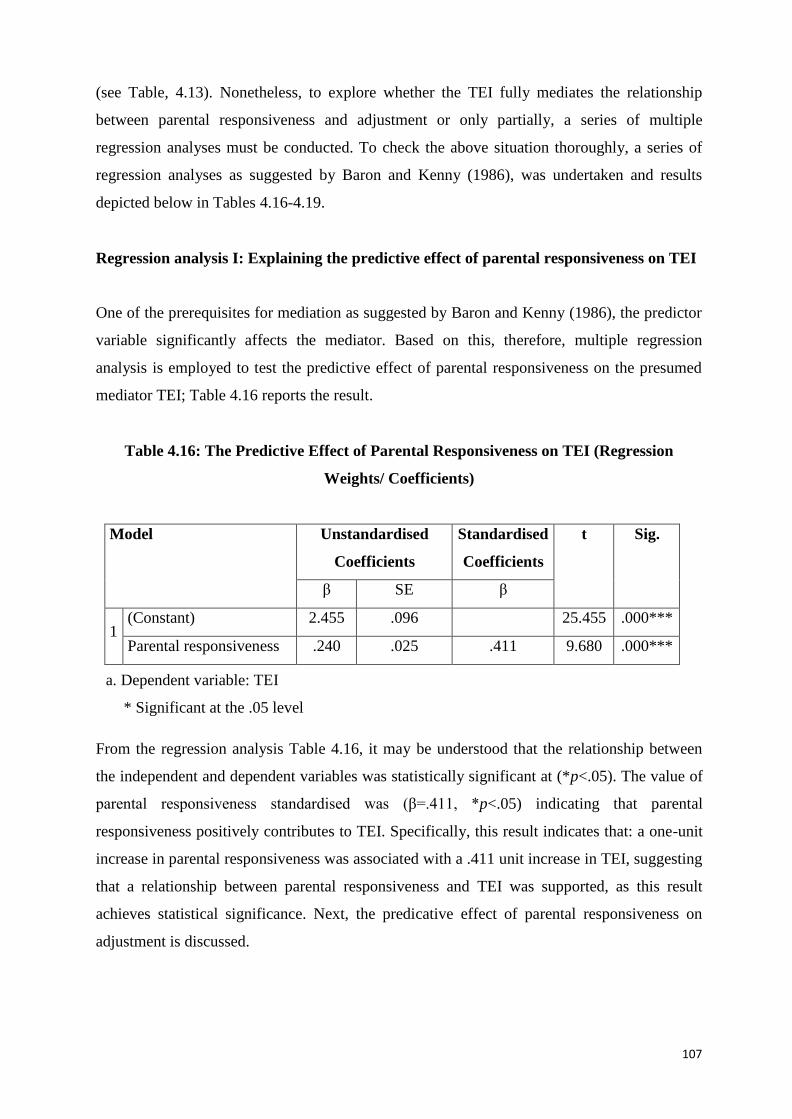
107
(see Table, 4.13). Nonetheless, to explore whether the TEI fully mediates the relationship
between parental responsiveness and adjustment or only partially, a series of multiple
regression analyses must be conducted. To check the above situation thoroughly, a series of
regression analyses as suggested by Baron and Kenny (1986), was undertaken and results
depicted below in Tables 4.16-4.19.
Regression analysis I: Explaining the predictive effect of parental responsiveness on TEI
One of the prerequisites for mediation as suggested by Baron and Kenny (1986), the predictor
variable significantly affects the mediator. Based on this, therefore, multiple regression
analysis is employed to test the predictive effect of parental responsiveness on the presumed
mediator TEI; Table 4.16 reports the result.
Table 4.16: The Predictive Effect of Parental Responsiveness on TEI (Regression
Weights/ Coefficients)
Model Unstandardised
Coefficients
Standardised
Coefficients
t Sig.
β SE β
1 (Constant) 2.455 .096 25.455 .000***
Parental responsiveness .240 .025 .411 9.680 .000***
a. Dependent variable: TEI
* Significant at the .05 level
From the regression analysis Table 4.16, it may be understood that the relationship between
the independent and dependent variables was statistically significant at (*p<.05). The value of
parental responsiveness standardised was (β=.411, *p<.05) indicating that parental
responsiveness positively contributes to TEI. Specifically, this result indicates that: a one-unit
increase in parental responsiveness was associated with a .411 unit increase in TEI, suggesting
that a relationship between parental responsiveness and TEI was supported, as this result
achieves statistical significance. Next, the predicative effect of parental responsiveness on
adjustment is discussed.

108
Regression Analysis II: Explaining the predictive effect of parental responsiveness on
adjustment
Table 4.16 confirmed that parental responsiveness had a positive direct effect on TEI; this
meets the demands of the first suggestion given by Baron and Kenny (1986). In this section,
their suggestion was that the predictor must significantly influence the outcome variable. In
order to test this, a multiple regression analysis was executed taking parental responsiveness as
the predictor and adjustment as the predicted variable; Table 4.17 discloses this result.
Table 4.17: Results of the Predictive Effect of Parental Responsiveness on Adjustment
(Regression Weights/Coefficients)
Model Unstandardized
Coefficients
Standardized
Coefficients
t Sig.
β SE β
1 (Constant) 2.414 .114 21.176 .000***
Parental responsiveness .279 .029 .404 9.501 .000***
a. Dependent variable: adjustment
* Significant at the .05 level
Table 4.17 reported that the coefficient for parental responsiveness was found to achieve
statistical significance at the .05 alpha level (β= .404), indicating that there is a significant
positive relationship between the predictor (parental responsiveness) and outcome variable
(adjustment). The following section focuses on explaining the predictive effect of TEI on
adjustment.
Regression Analysis III: Explaining the predictive effect of TEI on adjustment
As noted in Table 4.17, the multiple regression analysis was executed in between parental
responsiveness and adjustment. Thus, the second suggestion given by Baron and Kenny
(1986) was satisfied. In this section, attention is paid to testing the third suggestion by Baron
and Kenny (1986) who stated that the presumed mediator variable must significantly influence
the predicted variable. In order to assess this, a multiple regression analysis is executed taking
TEI as the predictor and adjustment as the predicted variable, where Table 4.18 records this
result.

109
Table 4.18: Results of the Predictive Effect of TEI on Adjustment (Regression Weights/
Coefficients)
Model Unstandardized
Coefficients
Standardized
Coefficients
t Sig.
β SE β
(Constant) 1
TEI
1.400
.617
.159
.047
.524
8.829
13.220
.000***
.000***
a. Dependent variable: adjustment
* Significant at the .05 level
Table 4.18 depicts that the coefficient for TEI was found to achieve statistical significance at
the .05 alpha level (β= .524), indicating that there is a significant relationship between the
predictor (TEI) and outcome variable (adjustment). Specifically, this result makes it clear that
a one-unit increase in TEI was associated with a .524 unit increase in adjustment.
To conclude, parental responsiveness significantly influences both TEI and adjustment, and
TEI significantly predicts/influences adjustment (see Table 4.16-4.18), which confirmed steps
1-3 of Baron and Kenny’s (1986) recommendation. Therefore, the next phase was to examine
step 4, which would testify whether there is partial or full mediation of TEI on the relation
between parental responsiveness and adjustment. This will be discussed in the regression
analysis section IV.
Regression Analysis IV: Explaining the mediating effect of TEI, when parental
responsiveness and TEI were entering in a stepwise respectively as a predictor and a
mediator variable in explaining adjustment
At this point, step 4 would be tested if statistical significance was in fact found. Here, the
mediator (TEI) and the predictor (parental responsiveness) were both included as independent
variables in the analysis, while the outcome variable (adjustment) was included as the
dependent variable. In other words, simultaneous entry, rather than hierarchical entry, was
employed. This would then serve to determine whether partial or full mediation is present.
Table 4.19 below presents the result.
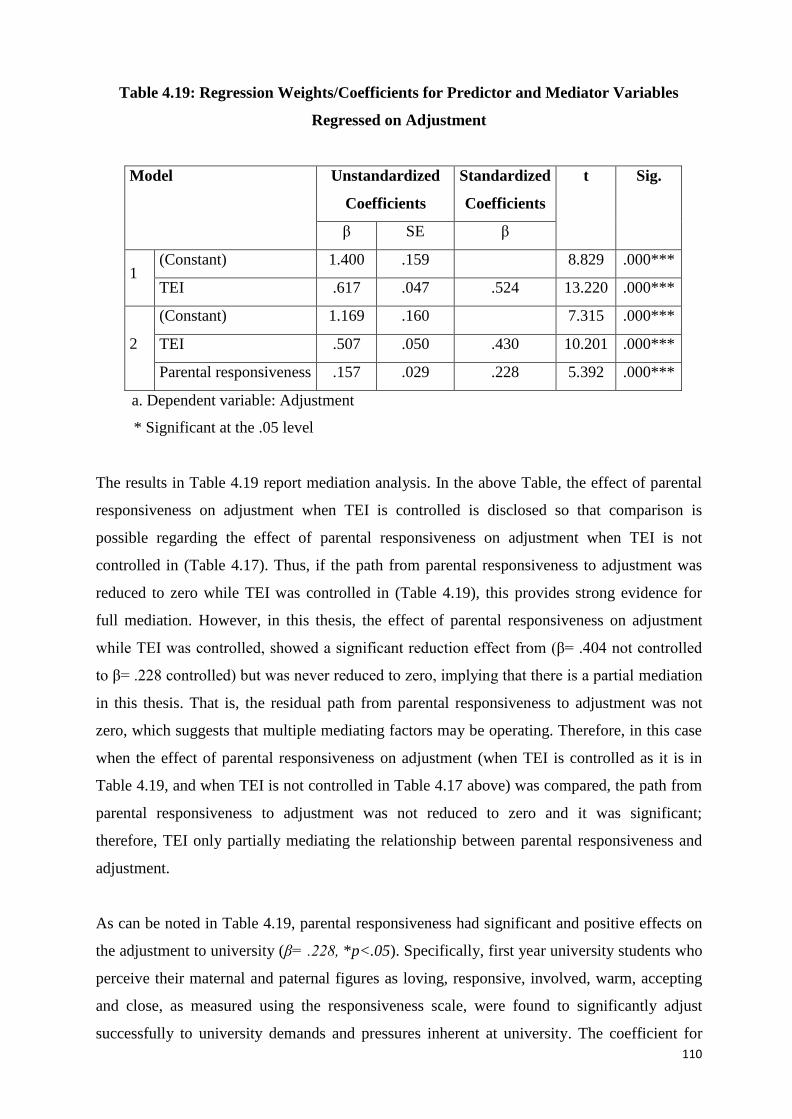
110
Table 4.19: Regression Weights/Coefficients for Predictor and Mediator Variables
Regressed on Adjustment
Model Unstandardized
Coefficients
Standardized
Coefficients
t Sig.
β SE β
1 (Constant) 1.400 .159 8.829 .000***
TEI .617 .047 .524 13.220 .000***
2
(Constant) 1.169 .160 7.315 .000***
TEI .507 .050 .430 10.201 .000***
Parental responsiveness .157 .029 .228 5.392 .000***
a. Dependent variable: Adjustment
* Significant at the .05 level
The results in Table 4.19 report mediation analysis. In the above Table, the effect of parental
responsiveness on adjustment when TEI is controlled is disclosed so that comparison is
possible regarding the effect of parental responsiveness on adjustment when TEI is not
controlled in (Table 4.17). Thus, if the path from parental responsiveness to adjustment was
reduced to zero while TEI was controlled in (Table 4.19), this provides strong evidence for
full mediation. However, in this thesis, the effect of parental responsiveness on adjustment
while TEI was controlled, showed a significant reduction effect from (β= .404 not controlled
to β= .228 controlled) but was never reduced to zero, implying that there is a partial mediation
in this thesis. That is, the residual path from parental responsiveness to adjustment was not
zero, which suggests that multiple mediating factors may be operating. Therefore, in this case
when the effect of parental responsiveness on adjustment (when TEI is controlled as it is in
Table 4.19, and when TEI is not controlled in Table 4.17 above) was compared, the path from
parental responsiveness to adjustment was not reduced to zero and it was significant;
therefore, TEI only partially mediating the relationship between parental responsiveness and
adjustment.
As can be noted in Table 4.19, parental responsiveness had significant and positive effects on
the adjustment to university (β= .228, *p<.05). Specifically, first year university students who
perceive their maternal and paternal figures as loving, responsive, involved, warm, accepting
and close, as measured using the responsiveness scale, were found to significantly adjust
successfully to university demands and pressures inherent at university. The coefficient for
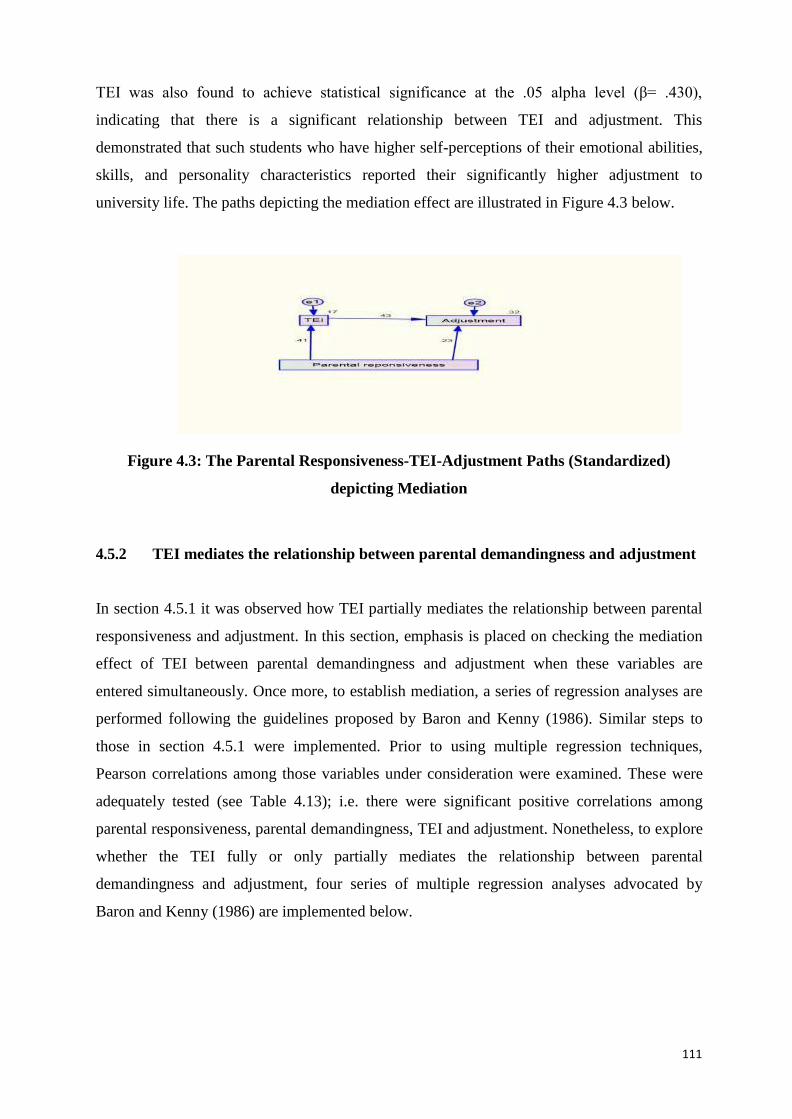
111
TEI was also found to achieve statistical significance at the .05 alpha level (β= .430),
indicating that there is a significant relationship between TEI and adjustment. This
demonstrated that such students who have higher self-perceptions of their emotional abilities,
skills, and personality characteristics reported their significantly higher adjustment to
university life. The paths depicting the mediation effect are illustrated in Figure 4.3 below.
Figure 4.3: The Parental Responsiveness-TEI-Adjustment Paths (Standardized)
depicting Mediation
4.5.2 TEI mediates the relationship between parental demandingness and adjustment
In section 4.5.1 it was observed how TEI partially mediates the relationship between parental
responsiveness and adjustment. In this section, emphasis is placed on checking the mediation
effect of TEI between parental demandingness and adjustment when these variables are
entered simultaneously. Once more, to establish mediation, a series of regression analyses are
performed following the guidelines proposed by Baron and Kenny (1986). Similar steps to
those in section 4.5.1 were implemented. Prior to using multiple regression techniques,
Pearson correlations among those variables under consideration were examined. These were
adequately tested (see Table 4.13); i.e. there were significant positive correlations among
parental responsiveness, parental demandingness, TEI and adjustment. Nonetheless, to explore
whether the TEI fully or only partially mediates the relationship between parental
demandingness and adjustment, four series of multiple regression analyses advocated by
Baron and Kenny (1986) are implemented below.
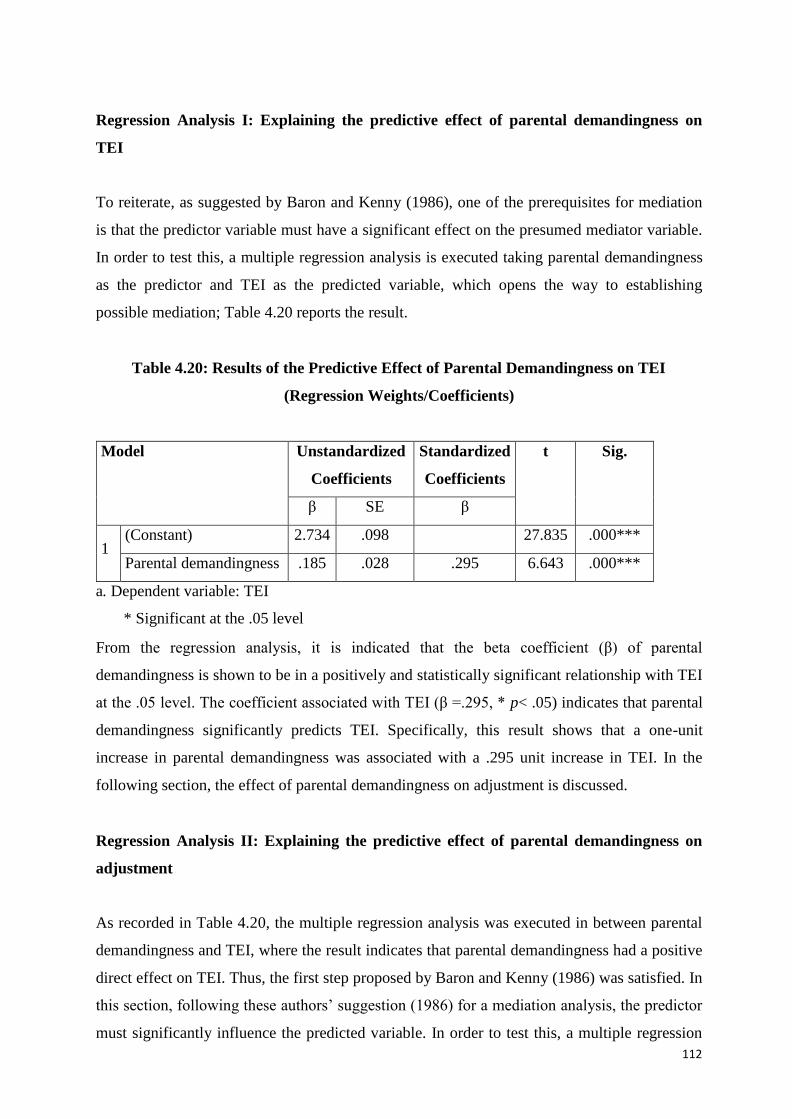
112
Regression Analysis I: Explaining the predictive effect of parental demandingness on
TEI
To reiterate, as suggested by Baron and Kenny (1986), one of the prerequisites for mediation
is that the predictor variable must have a significant effect on the presumed mediator variable.
In order to test this, a multiple regression analysis is executed taking parental demandingness
as the predictor and TEI as the predicted variable, which opens the way to establishing
possible mediation; Table 4.20 reports the result.
Table 4.20: Results of the Predictive Effect of Parental Demandingness on TEI
(Regression Weights/Coefficients)
Model Unstandardized
Coefficients
Standardized
Coefficients
t Sig.
β SE β
1 (Constant) 2.734 .098 27.835 .000***
Parental demandingness .185 .028 .295 6.643 .000***
a. Dependent variable: TEI
* Significant at the .05 level
From the regression analysis, it is indicated that the beta coefficient (β) of parental
demandingness is shown to be in a positively and statistically significant relationship with TEI
at the .05 level. The coefficient associated with TEI (β =.295, * p< .05) indicates that parental
demandingness significantly predicts TEI. Specifically, this result shows that a one-unit
increase in parental demandingness was associated with a .295 unit increase in TEI. In the
following section, the effect of parental demandingness on adjustment is discussed.
Regression Analysis II: Explaining the predictive effect of parental demandingness on
adjustment
As recorded in Table 4.20, the multiple regression analysis was executed in between parental
demandingness and TEI, where the result indicates that parental demandingness had a positive
direct effect on TEI. Thus, the first step proposed by Baron and Kenny (1986) was satisfied. In
this section, following these authors’ suggestion (1986) for a mediation analysis, the predictor
must significantly influence the predicted variable. In order to test this, a multiple regression
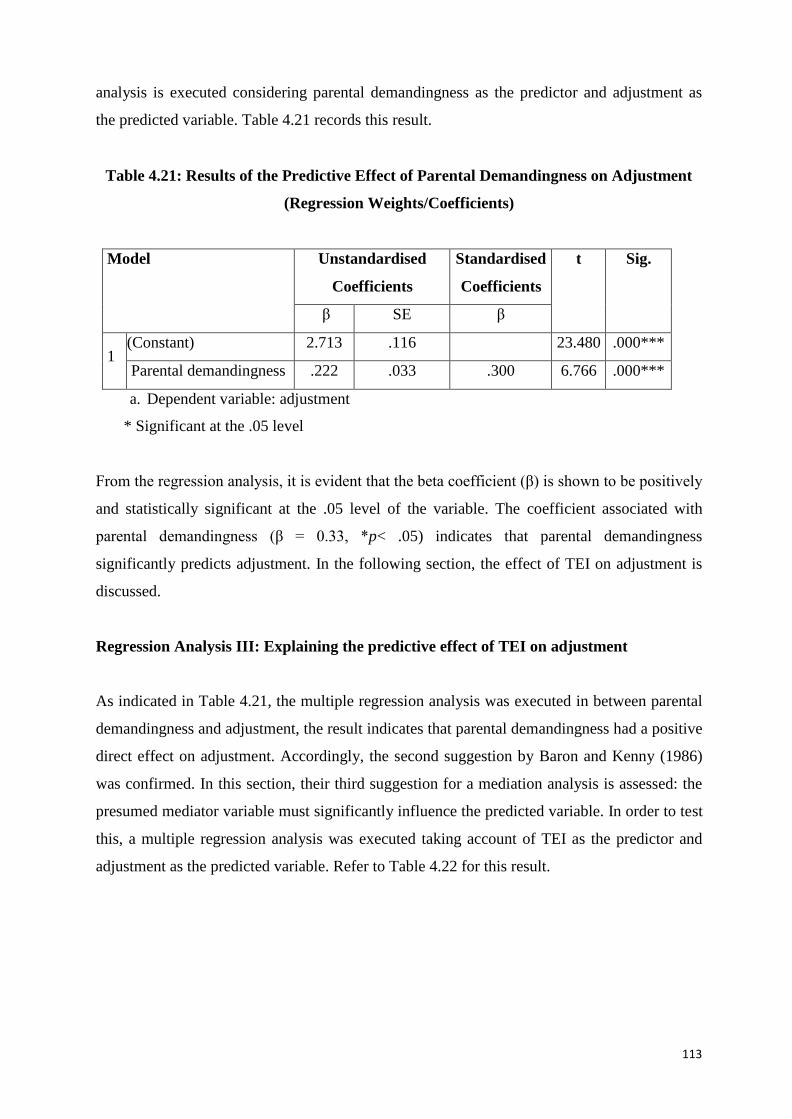
113
analysis is executed considering parental demandingness as the predictor and adjustment as
the predicted variable. Table 4.21 records this result.
Table 4.21: Results of the Predictive Effect of Parental Demandingness on Adjustment
(Regression Weights/Coefficients)
Model Unstandardised
Coefficients
Standardised
Coefficients
t Sig.
β SE β
1 (Constant) 2.713 .116 23.480 .000***
Parental demandingness .222 .033 .300 6.766 .000***
a. Dependent variable: adjustment
* Significant at the .05 level
From the regression analysis, it is evident that the beta coefficient (β) is shown to be positively
and statistically significant at the .05 level of the variable. The coefficient associated with
parental demandingness (β = 0.33, *p< .05) indicates that parental demandingness
significantly predicts adjustment. In the following section, the effect of TEI on adjustment is
discussed.
Regression Analysis III: Explaining the predictive effect of TEI on adjustment
As indicated in Table 4.21, the multiple regression analysis was executed in between parental
demandingness and adjustment, the result indicates that parental demandingness had a positive
direct effect on adjustment. Accordingly, the second suggestion by Baron and Kenny (1986)
was confirmed. In this section, their third suggestion for a mediation analysis is assessed: the
presumed mediator variable must significantly influence the predicted variable. In order to test
this, a multiple regression analysis was executed taking account of TEI as the predictor and
adjustment as the predicted variable. Refer to Table 4.22 for this result.
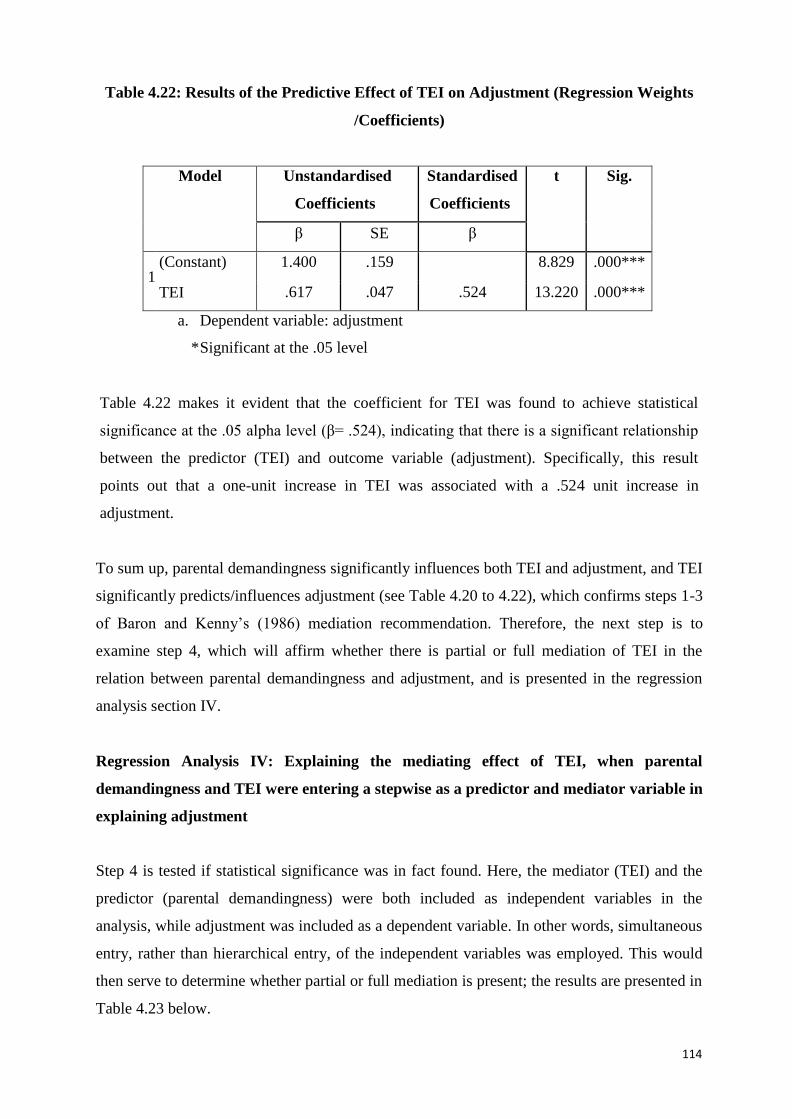
114
Table 4.22: Results of the Predictive Effect of TEI on Adjustment (Regression Weights
/Coefficients)
Model Unstandardised
Coefficients
Standardised
Coefficients
t Sig.
β SE β
1 (Constant) 1.400
.617
.159
.047
.524
8.829
13.220
.000***
.000*** TEI
a. Dependent variable: adjustment
* Significant at the .05 level
Table 4.22 makes it evident that the coefficient for TEI was found to achieve statistical
significance at the .05 alpha level (β= .524), indicating that there is a significant relationship
between the predictor (TEI) and outcome variable (adjustment). Specifically, this result
points out that a one-unit increase in TEI was associated with a .524 unit increase in
adjustment.
To sum up, parental demandingness significantly influences both TEI and adjustment, and TEI
significantly predicts/influences adjustment (see Table 4.20 to 4.22), which confirms steps 1-3
of Baron and Kenny’s (1986) mediation recommendation. Therefore, the next step is to
examine step 4, which will affirm whether there is partial or full mediation of TEI in the
relation between parental demandingness and adjustment, and is presented in the regression
analysis section IV.
Regression Analysis IV: Explaining the mediating effect of TEI, when parental
demandingness and TEI were entering a stepwise as a predictor and mediator variable in
explaining adjustment
Step 4 is tested if statistical significance was in fact found. Here, the mediator (TEI) and the
predictor (parental demandingness) were both included as independent variables in the
analysis, while adjustment was included as a dependent variable. In other words, simultaneous
entry, rather than hierarchical entry, of the independent variables was employed. This would
then serve to determine whether partial or full mediation is present; the results are presented in
Table 4.23 below.
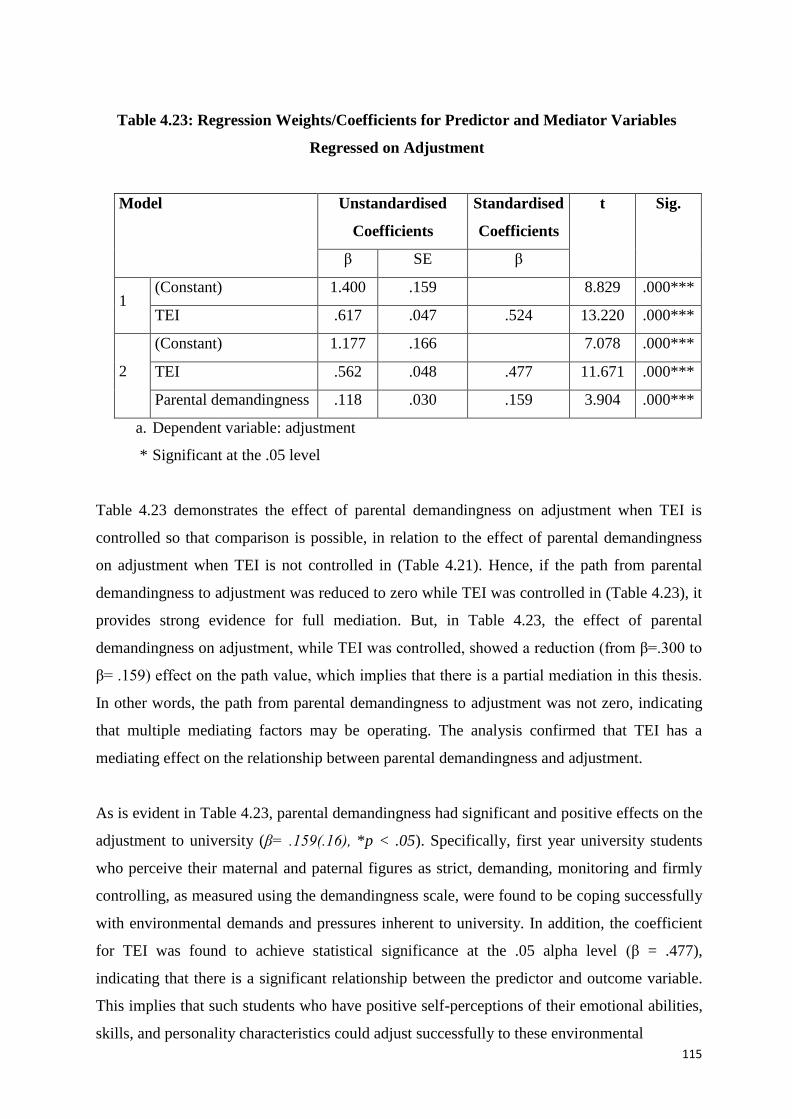
115
Table 4.23: Regression Weights/Coefficients for Predictor and Mediator Variables
Regressed on Adjustment
Model Unstandardised
Coefficients
Standardised
Coefficients
t Sig.
β SE β
1 (Constant) 1.400 .159 8.829 .000***
TEI .617 .047 .524 13.220 .000***
2
(Constant) 1.177 .166 7.078 .000***
TEI .562 .048 .477 11.671 .000***
Parental demandingness .118 .030 .159 3.904 .000***
a. Dependent variable: adjustment
* Significant at the .05 level
Table 4.23 demonstrates the effect of parental demandingness on adjustment when TEI is
controlled so that comparison is possible, in relation to the effect of parental demandingness
on adjustment when TEI is not controlled in (Table 4.21). Hence, if the path from parental
demandingness to adjustment was reduced to zero while TEI was controlled in (Table 4.23), it
provides strong evidence for full mediation. But, in Table 4.23, the effect of parental
demandingness on adjustment, while TEI was controlled, showed a reduction (from β=.300 to
β= .159) effect on the path value, which implies that there is a partial mediation in this thesis.
In other words, the path from parental demandingness to adjustment was not zero, indicating
that multiple mediating factors may be operating. The analysis confirmed that TEI has a
mediating effect on the relationship between parental demandingness and adjustment.
As is evident in Table 4.23, parental demandingness had significant and positive effects on the
adjustment to university (β= .159(.16), *p < .05). Specifically, first year university students
who perceive their maternal and paternal figures as strict, demanding, monitoring and firmly
controlling, as measured using the demandingness scale, were found to be coping successfully
with environmental demands and pressures inherent to university. In addition, the coefficient
for TEI was found to achieve statistical significance at the .05 alpha level (β = .477),
indicating that there is a significant relationship between the predictor and outcome variable.
This implies that such students who have positive self-perceptions of their emotional abilities,
skills, and personality characteristics could adjust successfully to these environmental
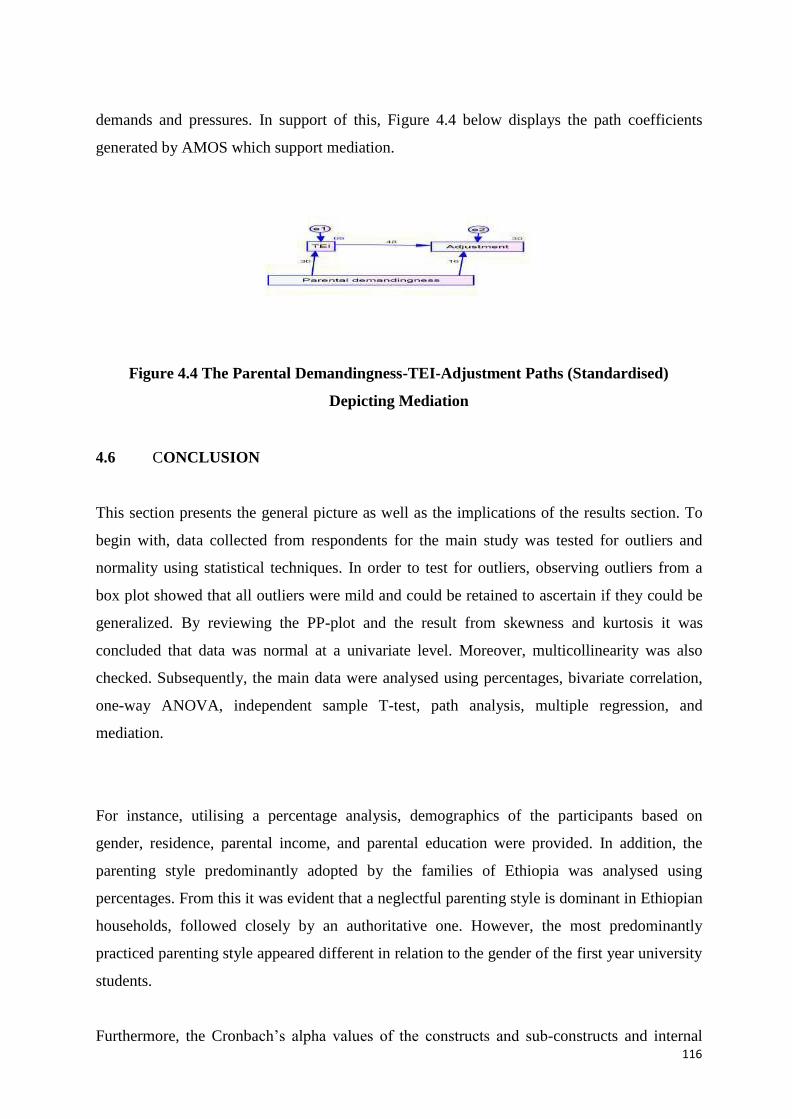
116
demands and pressures. In support of this, Figure 4.4 below displays the path coefficients
generated by AMOS which support mediation.
Figure 4.4 The Parental Demandingness-TEI-Adjustment Paths (Standardised)
Depicting Mediation
4.6 CONCLUSION
This section presents the general picture as well as the implications of the results section. To
begin with, data collected from respondents for the main study was tested for outliers and
normality using statistical techniques. In order to test for outliers, observing outliers from a
box plot showed that all outliers were mild and could be retained to ascertain if they could be
generalized. By reviewing the PP-plot and the result from skewness and kurtosis it was
concluded that data was normal at a univariate level. Moreover, multicollinearity was also
checked. Subsequently, the main data were analysed using percentages, bivariate correlation,
one-way ANOVA, independent sample T-test, path analysis, multiple regression, and
mediation.
For instance, utilising a percentage analysis, demographics of the participants based on
gender, residence, parental income, and parental education were provided. In addition, the
parenting style predominantly adopted by the families of Ethiopia was analysed using
percentages. From this it was evident that a neglectful parenting style is dominant in Ethiopian
households, followed closely by an authoritative one. However, the most predominantly
practiced parenting style appeared different in relation to the gender of the first year university
students.
Furthermore, the Cronbach’s alpha values of the constructs and sub-constructs and internal
117
consistency reliability were verified. With internal consistency, reliability of all construct
scores (TEI, student adjustment, parental responsiveness and demandingness) was calculated.
This approach would ensure that analysis results were manageable in this thesis.
Next, differences in TEI and adjustment as a function of parenting style were examined using
one way ANOVA, and the result indicated that a statistically significant TEI and adjustment
means score difference were found among the four parenting style categories. To identify
which parenting style TEI and adjustment means differ from other parenting style TEI and
adjustment means, multiple comparisons of means tests (Tukey’s test) were conducted on the
TEI and adjustment means scores calculated for the four parenting style groups.
Moreover, an independent sample T-test was employed to examine whether the dependent
variables (TEI and adjustment) were statistically significantly different in terms of the gender
of the research participants. In this regard, there was a statistically significant difference in
TEI score between male and female first year university students t (436.897) = .350, *p< .05,
homogeneity of variance not assumed). Nevertheless, no statistically significant adjustment to
university score was noted between these groups of students t (462) = -1.217, p> .05,
homogeneity of variance assumed).
Thereafter, to prepare the way for path analysis, multiple regression analysis, and mediation
analysis, correlation analysis was executed among the major variables under consideration.
The results showed that major study variables were positively significantly correlated to one
another. Their correlation matrix indicates that multicollinearity between variables to be
included in the path analysis does not exist; once again the signs between variables are all
positive and thus in the predicted direction to conduct path analysis.
After this, a path diagram was designated using all the necessary inputs taken into account and
the results were derived using AMOS. Basically, this model was a just-identified one with no
degree of freedom, chi-square had a zero value, and probability could not be computed. In
addition, the overall model fit was determined among others using RMSEA, RMSR, CFI, NFI,
GFI, and TLI. Using those parameters, the base-line model partially satisfies some
requirements but not all: therefore, the model was not a fit one to the empirical data. Thereby,
a decision to re-specify the model was mandatory. Therefore, deleting or freeing one or more
of the paths until it was possible to obtain an over-identified model was necessary. In the
second model, modification involves by beginning to free a parameter that was fixed.
118
Accordingly, in the second analysis the direct effect of parental demandingness on TEI was
deleted. In doing so, fortunately the model for the second analysis was then an over-identified
one: with a positive degree of freedom, non-significant chi-square value, along with other fit
indices, such as CFI, GFI, NFI and TLI, being greater than .90 while RMSEA was less than
.06.
Next, the multiple regression analysis was executed using parental responsiveness, parental
demandingness, and TEI: all interactions served as predictors while the variable adjustment
served as the predicted variable. TEI interacted with parental responsiveness and parental
demandingness explain 31.9 percent of the variance on the dependent variable (adjustment).
After the discussion on regression analysis, a mediation analysis followed. To undergo
mediation, Pearson-correlation analysis and series of regression analyses were tested. To
explore whether TEI fully mediates the relationship between parental responsiveness and
adjustment or only partially, a series of multiple regression analyses were conducted first,
using parental responsiveness as an independent variable, TEI as a mediator variable and
adjustment as a dependent variable and followed by parental demandingness as an
independent variable, TEI as a mediator variable and adjustment as a dependent variable. The
overall results revealed that TEI plays a meditation role, but only partially, in the parental
demandingness and adjustment relationship, as well as in the parental responsiveness and
adjustment relationship which confirms potentially that the adjustment scale is able to explain
the relationship between demandingness and responsiveness dimension-variables of parenting
style and TEI.
119
CHAPTER FIVE: DISCUSSION
This chapter provides a discussion related to the results obtained in the data analysis section of
Chapter Four. The aim of that chapter was to empirically examine the variables under
consideration, whereas this chapter aims to discuss the results of the analysis in line with the
previous findings related to the objectives of the study. It will be recalled that the central aims
/goals of the present study were twofold: To research the mediated effect of TEI on the
relationship between parenting style/dimension and first year students’ university adjustment
and to develop an explanatory theory that associates parenting style/dimensions with TEI and
adjustment of these students in Ethiopia.
The chapter begins with a discussion of predominant Ethiopian parenting styles. This is
followed by a discussion relating to whether parenting style influences TEI and adjustment.
The influence of gender on TEI and adjustment is discussed next. After that, path analysis and
multiple regression analysis results are addressed and, finally, the mediating effect of TEI on
the relationship between parental responsiveness and the demandingness dimension-variables
of parenting style and adjustment is considered.
5.1 THE PREDOMINANTLY PRACTICED PARENTING STYLES IN
ETHIOPIA
The study revealed that a neglectful parenting style was found to be the most commonly
practiced style, followed by an authoritative one. In addition, it was found that all four
parenting styles were reported by the participants. However, different parenting styles were
established for males and females. More specifically, parents were perceived by males to use a
neglectful (neither demanding nor responsive) parenting style, followed by an authoritative
(responsive and demanding) parenting style. On the other hand, parents were rated by females
as using an authoritative (responsive and demanding) parenting style, followed by a neglectful
(neither demanding nor responsive) parenting style. The types of parenting style
predominately practiced at household level as well as the different parenting practices for
females and males in Ethiopia may appear controversial. For instance, the finding in this
research that a neglectful parenting style is the most predominantly practiced parenting style
contradicts the results of some previous studies conducted in Ethiopia. In this regard, an
authoritarian style was reported in some studies as being the predominantly employed one
(Habtamu, 1995). In other studies it was found that the authoritative type of parenting style
120
was predominantly practiced in the families of Ethiopia (Seleshi, 1998; Seleshi & Sentayehu,
1998; Yekoyealem, 2005).
However, findings from this research provide compelling reasons that point to a neglectful
parenting style as the predominant parenting practice in the Ethiopian households. First, as
indicated in the analysis section of the socio-demographics, 51.7 % of the respondents resided
in the rural part of Ethiopia whereas 48.3% of the respondents lived in the urban areas.
Secondly, in the analysis of socio-demographics, almost 30.63% of the respondents’ parents
earn an average monthly income below <1000 Ethiopian birr. It was also revealed that the
majority of first year university students had fathers and mothers who received no formal
education respectively (37.9%, 46.4%). Deduced from those facts, first year Ethiopian
students mostly came from poor families and parents with (mostly) limited educational
exposure and the majority of first year university students were from the rural parts of
Ethiopia. These factors might affect the parenting styles these parents exhibit to their children.
Therefore, it might not surprise one that many of the Ethiopian parents practice a neglectful
parenting style.
However, the finding that parenting style differs as a function of the gender of the children is
in agreement with previous research undertaken in Ethiopia using a sample of high school
students (Kassahun, 2005), which demonstrated that an authoritative parenting style was the
most commonly adopted one for daughters, whereas a neglectful one was the predominant
style of parenting for sons. Moreover, the present findings are to some extent in agreement
with the sample of a previous international study which demonstrated that parenting style
differs, depending upon the children’s gender; for instance, in comparison with boys, females
are more often and better supervised by parents than their male peers are (Maggio & Zappulla,
2014). Overall, this different treatment of sons and daughters is not unique to Ethiopia but
applicable to other researches in other countries as well.
A likely reason for the predominance of the different parenting styles for sons and daughters
could result from the fact that their dissimilar behavioural characteristics as a function of their
gender may have caused parents to employ different parenting styles. In this regard, previous
121
studies conducted in Ethiopia (Seleshi, 1998; Seleshi & Sentayehu, 1998), revealed that male
students in junior secondary schools recorded significantly higher levels of problem
behaviours than their female counterparts. Perhaps this might be a reason why parents are
neglectful of their sons or because their sons may have shown behavioural characteristics not
accepted by their parents, which in turn, places limits on maintaining parental authority.
From the above discussion the following can be deduced: that although the present finding and
that of Kassahun (2005) are in agreement that a neglectful parenting style is predominantly
practiced for males, drawing such a conclusion is controversial. Previous studies in Ethiopia
(Seleshi, 1998; Seleshi & Sentayehu, 1998) have revealed that parents attach very high values
to their children in the hope that they will provide social, economic, and psychological support
for their parents, especially when they become older. In consequence, their research
underscores that it is unlikely that a neglectful parenting style is practiced by the Ethiopian
parents for their sons. Therefore, there is a need to undertake further research in the area under
consideration.
Generally, the findings of this study identified that although parenting style differs according
to the children’s gender and the predominately parenting style practiced in the Ethiopian
households is the neglectful one, followed very closely by the authoritative one, when
examined critically, Ethiopian parents do employ all four types of parenting styles. However,
the other studies conducted so far do not provide clear evidence to conclude which parenting
style (i.e., authoritative, authoritarian, indulgent, or neglectful) is most commonly adopted in
the families of Ethiopia. This calls for a further study.
Unexpected results sometimes appear and this research is no exception. For instance, as
mentioned, in the study by Garcia and Gracia (2009), undertaken with 1,416 Spanish
adolescents aged 12 to 17 years old, it was expected that authoritative parenting was being
practiced (e.g. Keshavarz & Baharudin, 2009). Yet, in the study, adolescents were classified as
experiencing all four parenting styles. However, contrary to the said expectation, from the
overall results of their study, Garcia and Gracia (2009) showed that most Spanish parents have
adopted a permissive parenting style. The next section examines the differences in TEI in
relation to parenting style.
122
5.2 TEI AS A FUNCTION OF PERCEIVED PARENTING STYLE
To recapitulate: one of the objectives of this study was establishing whether parenting style
influences TEI. In this regard, a statistically significant TEI score difference was found among
the four parenting style categories F (3; 460; .05) = 2.63. The mean scores of the four
parenting styles (in Table 4.4 of the analysis section), were M = 3.5241, M= 3.3422,
M=3.4399, and M= 3.2283 for authoritative, authoritarian, indulgent, and neglectful parenting
styles respectively. The finding that TEI is influenced by parenting style in the present study is
consistent with the previous suggestions and results. For instance, parents can play a key role
in EI training (Fonte, 2009) because their relationships with their children affect many
different aspects of the latter’s development, including their range and depth of emotions
(Baumarind, 1991; Dornbusch et al., 1987 cited in Sharma & Sahni, 2013). Furthermore, one
of the benefits of EI is that it can be acquired, because individuals can learn, develop and
improve their EI (Brown & Moshavi, 2005; Harms & Crede, 2010). Therefore, the role
parents play in the improvement of children’s EI is obvious. In relation to this again, EI is a
learned a characteristic would be inherent that it can often be expanded and developed by
training (Bar-On, 2000); the same findings are reported by (Goleman, 1995, 1998; Kotsou et
al., 2011).
In addition, the finding that first year students who reported that their parents were
authoritative have high TEI, as compared to those who perceive their parents to be
authoritarian, permissive and neglectful, is in agreement with previous research results: that
adolescents with high scores for home environment on protectiveness, reward, nurturance, and
progressiveness are found to be higher on EI as compared to adolescents with low scores of
home environment on these dimensions–and vice versa (Martinez-Pons,1999; Sharma &
Sahni, 2013;).
Furthermore, with consideration to the specific effect of perceived parenting style on TEI, a
study was carried out by Herzog et al. (2015) revealed that perceived parenting styles
contribute to both emotional regulation and trait emotionality. Consistent with the present
research findings, there is evidence of a connection between parenting and children’s TEI
(Liau et al., 2003). Similarly, Alegre and Benson (2010) found parental availability and
control were related to late adolescents’ TEI.
123
Generally, in the present study as well as in the previous ones, results in the relationship
between EI/TEI and parenting style, especially concerning authoritativeness, appear positive
and informative as well as feasible.
5.3 ADJUSTMENT AS A FUNCTION OF PERCEIVED PARENTING STYLE
In section 5.2 the discussion focused on whether TEI is influenced by parenting style; it was
noted that previous research results have been in agreement that this is the case. This section
considers ‘to what extent the present result that adjustment at university is influenced by
parenting style is in agreement with the previous findings.’
In the current research, results indicate that a statistically significant difference on adjustment
scores was found among first year university students who reported on the four parenting
styles F (3; 460; .05) = 2.63. The mean scores (in Table 4.4 in the analysis M= 3.6328,
M=3.5227, M=3.5192, and M=3.3113 respectively) represent the first year students’
adjustment mean score for those who rated their parents as authoritative, authoritarian,
indulgent, and neglectful. This implies that first year university students who perceive their
parents as employing an authoritative parenting style had significantly high adjustment to
university; i.e. they were better able to meet the academic, social, personal-emotional and
institutional attachment demands at the higher education institution level compared to those
who perceived their parents as using authoritarian, indulgent, and neglectful parenting styles;
hence authoritative parenting was more important for adjustment to university than other
parenting styles.
The finding that adjustment to university is influenced by parenting style concurs with
previous suggestion and results; for instance, research conducted on parenting styles in
relation to adjustment associated with the four styles of parenting using ANOVA, indicating
differences in youth adjustment (Kerr et al., 2012), and post hoc tests confirmed that youths
with authoritative parents were significantly better adjusted on all measures than those with
neglectful parents.
Consistent with the present findings, for example, positive/supportive parenting, characterised
by high levels of warmth, democratic discipline and involvement/supervision, are associated
with lower levels of adjustment problems in Chinese American youth (Kim & Ge, 2000) as
124
well as being associated with positive adjustment to college (Schnuck & Handal, 2011).
Therefore, one of the recommendations for preventing social problems is the further
investigation of parenting style and related factors (Dwairy & Menshar, 2006).
In the present findings, the mean score results showed that first year university students who
perceive their parents as authoritative (M= 3.6328) scored higher on adjustment than those
who perceive their parents as authoritarian (M=3.5227), indulgent (M=3.5192), and neglectful
(M=3.3113). Consistent with this, taking into account of the specific parenting
typologies/styles, developmental research demonstrates that authoritative parenting predicts
many positive outcomes for children and adolescents when compared with authoritarian,
indulgent, and uninvolved parenting (Coplan et al., 2002; Steinberg, 2001). For example,
authoritative parenting is related to adolescents’ social competence (Garcia & Gracia, 2009;
Kazemi et al., 2010; Baumrind, 1991; Lamborn et al., 1991), better academic achievement and
socio-emotional competence (Steinberg, 2001; Winter & Yaffe, 2000), and have greater
academic adjustment in a college setting (Hickman et al.,2000).
Furthermore, Schnuck and Handal (2011) in their study attempted to establish whether
perceived parenting style was related to adjustment as reported by college first year students in
their first semester of college. In the study it was discovered that perceived parenting style was
associated with different adjustment variables; for example, contrary to the present result,
permissive parenting was correlated with negative adjustment and, consistent with the present
study, authoritative parenting was correlated with positive adjustment. The reason for this is
that in the Tukey result, a statistically significant mean difference in adjustment score was
found between those first year university students who perceive their parents as authoritative
and those who regard their parents as permissive (.11358), p> .05).
In particular, the present study was found to be congruent with previous findings that parents
have an important role in students’ college adjustment; for instance, parents who provide high
levels of support contribute greatly in this respect (Mounts, 2004; Mounts et al., 2006). In the
methodology section of 3.4.4 of the SACQ, the higher the score on the SACQ the better the
adjustment to college. So, in the present study, first year students who perceive their parents as
neglectful had lower scores on the adjustment to university than those who perceive their
parenting style as authoritative, authoritarian, and permissive.
125
And this result is consistent with the previous one that parenting style is related to adolescents’
adjustment. For both father and mother, a neglectful parenting style plays a relevant and risky
role in adolescents’ adjustment (Maggio & Zappulla, 2014). In agreement with the present
study, adolescents with uninvolved parents are generally less socially competent and present
adjustment problems in all domains (Baumrind, 1991) whereas adolescents who have
experienced an authoritative parenting style display better psychosocial and behavioural
adjustment than those who have experienced the rest of the parenting styles (Beyers &
Goossens, 1999).
Overall, it could be possible to generalise that the present result is in agreement with the
previous findings that parenting style does have an influence on students’ adjustment to
university.
5.4 DIFFERENCES IN TEI AND ADJUSTMENT BY GENDER OF THE STUDY
PARTICIPANTS
In section 5.3 the influence of parenting style on students’ university adjustment was discussed
in line with the previous research findings, and I came to the conclusion that parenting style
influences students’ university adjustment, and is therefore consistent with most previous
research findings. In the following section, emphasis is placed on checking whether a
statistically significant mean difference existed in the TEI score and adjustment to the
university score by considering the gender of the research participants as a factor.
5.4.1 Gender difference as a function of TEI
The results indicated, in line with one of the objectives, that there is a statistically significant
difference in TEI score between male and female first year university students t (436.897) =
.350, *p < .05, homogeneity of variance not assumed. In the results, the TEI mean score for
male first year university students was slightly higher (M = 3.3826, SD = .36288) than that of
the female university students in their first year (M = 3.3718, SD = .29669).
The finding that TEI differs by gender is consistent with some previous ones: for instance, a
study on TEI revealed gender differences, but contrary to the present result, girls scored higher
than boys (Downey et al., 2008; Mavroveli et al., 2008). Similarly, a study by Mikolajczak et
al. (2007) reported that with the exception of the factor well-being, their findings revealed
126
significant gender differences; i.e. women scored significantly higher on emotionality,
whereas men scored significantly higher on self-control and sociability. Again, in agreement
with the present result is a study in the global TEI score, in which men’s scores were found to
be higher than women’s (Mikolajczak et al., 2007), which once more is consistent with the
finding obtained with the English version of the TEIQue (Petrides & Furnham,2000).
As with the present study, Yelkikalan et al. (2012) revealed that EI score differs with gender:
that men have higher averages in wellbeing, self-control and sociability factors and this
difference is statistically significant (*p<.01) in the wellbeing and sociability factors.
Similarly, research by (Austin et al., 2005; Harrod & Scheer, 2005) discovered that the levels
of EI vary depending on the gender, but their research results are different from those of
Yelkikalan et al. (2012) in that theirs revealed that female students have an overall higher level
of EI in comparison to the male students.
Once more the present finding that TEI differs as a function of gender is inconsistent with a
sample of previous findings. For instance, Poulou (2010) underscored that irrespective of the
measurement tool used, there were no significant differences between gender and TEI.
Similarly, a study by Antoniou et al. (2016) on the relationship between TEI and vocational
interests of Greek 10th and 11th grade students indicated that TEI was independent of the
demographic variable gender.
To conclude, the influence of gender on TEI as well as on specific scores between males and
females on TEI is mixed, though many previous research findings and that of the present one
concur that gender has an influence on TEI. It is therefore cautiously concluded that TEI
TEIQue scores seem influenced by gender. Overall, further studies on TEI are needed to
confirm the different observed results across the present as well as the previous findings.
5.4.2 Gender difference as a function of adjustment level
The issue of whether gender does influence TEI was reported in the sub-section of 5.4.1 and
the present result was to some extent in agreement with many of the previous research
findings; however, not with all. This section carried out a discussion on ‘to what level is the
present result in agreement with the previous ones on whether adjustment score varies with
gender.
127
Gender differences on adjustment score were tested through an independent sample T- test.
The T-test did not reveal significant mean differences on adjustment score in between female
and male first year university students: the males’ adjustment score was (M = 3.4674, SD =
.40854) while females had (M = 3.5135, SD = .38184). This difference was not significant t
(462) = -1.217, p> .05. The finding that adjustment to university life is not significantly
different between male and female first year university students in the present study is
consistent with previous findings (Clinciu, 2013; Kyalo, 2011; Salami, 2011; Sharma &
Kermane, 2015). More importantly, Al-khatib et al. (2012) indicated that adjustment to college
life is not based on gender, study level, college or interaction between them. Rather, it was
related to other factors such as future anxiety about employment after finishing university, or
emotional instability, or other problems related to academic achievement.
Moreover, a study by Wang and Zhang (2015) indicated that there was no significant
difference between male and female college students with regard to adaptability. Even when
taking into account the moderating effects of gender on the relationship between EI and social
adjustment and EI and academic adjustment (Ishak et al., 2011), the result suggested that
gender was not an important moderating factor on the relationship between these research
variables. On the other hand, contrary to the present study, male students adapted to the new
university environment better than their female counterparts (Abdullah et al., 2009; Winter &
Yaffe, 2000; Enochs & Roland, 2006) because separation anxiety seemed to affect females
more than male students (Raj, 2012); thus, males tend to isolate themselves and escape,
whereas females are more likely to seek emotional assistance (Enochs & Roland, 2006), as
mentioned earlier.
To conclude, the present research is sufficiently in agreement with almost all the previous
findings included in the literature consulted in this thesis: that adjustment is not a function of
gender. However, the absence of gender differences in a construct’s mean does not signify that
there is no individual difference with regard to adjustment to university life.
5.5 DISCUSSION ON RESULTS OBTAINED FROM THE PATH MODEL,
MULTIPLE REGRESSION, AND MEDIATION
In the previous discussion sections the dominant parenting styles practiced in the culture of
Ethiopia, the influence of parenting style on students’ TEI and adjustment at university, and
whether TEI and adjustment score vary by gender were presented in order. In this section, the
128
results of the present findings of the path model, predictive effect of parental responsiveness,
parental demandingness, and TEI on the predicted adjustment, and the mediating role of TEI
on the relationship between parental responsiveness and adjustment, as well as on the
relationship between parental demandingness and adjustment in relation to the previous
research results are discussed, in this order.
5.5.1 Interpretation of results obtained from the re-specified path model
The present study sought to test a model where parental responsiveness, parental
demandingness and TEI, interactively and individually, relate to adjustment. Here, in this sub-
section, a discussion is conducted on results obtained from the path model. The analysis of the
fit indices in the present study revealed that the re-specified model showed a good overall fit
with the empirical data, with χ2 (1) = 1.725, p > .189, NFI = .996, CFI = .998, RMSEA = .04,
whereas the base line model displayed rather inadequate data fits, with χ2 (0) = .000, *p< .000,
NFI = 1.00, CFI=1.00, RMSEA=.414. This implies that the re-specified model was
significantly different from the baseline model. Thus, the re-specified model included both
direct and indirect paths from the independent variables (except the dropping of a direct path
from parental demandingness to TEI) to adjustment.
Below, the results derived from the re-specified model (path model 4.2) along with previous
findings are noted:
Parental responsiveness had a direct, positive statistically significant effect on TEI
(standardized, β = .411, *p <.05). This implies that first year university students who
perceive their maternal and paternal figures as loving, responsive, involved, warm,
accepting and close, as measured using the parental responsiveness sub-scale, were
found to have significantly higher self-perceptions of their emotional abilities, skills,
and personality characteristics.
The finding that TEI is influenced by parental responsiveness in the present study is consistent
with the previous suggestions and results; for instance, children, who reported that their
parents modelled, encouraged, facilitated and rewarded emotionally intelligent related
behaviour, enjoyed higher degrees of EI (Martinez-Pons, 1999). Alegre (2011) also reported
that parental responsiveness, parental emotion-related coaching, and parental positive
demandingness are related to children’s higher EI whereas parental negative demandingness is
129
related to children’s lower EI. In line with the present research findings, Liau et al. (2003)
discovered that parental monitoring and supervision are related to children’s TEI, parental
availability and control were also related to late adolescents’ TEI (Alegre & Benson, 2010).
In so far as parental responsiveness had a direct, positive statistically significant
direct (β= .196, *p<.05) and indirect (β=.176, *p<.05) effect on adjustment, implies
that first year university students who perceive their maternal and paternal figures as
loving, responsive, involved, warm, accepting and close, as measured using the
parental responsiveness sub-scale, were found to cope successfully with
environmental demands and pressures inherent at university.
The present finding concurs with the previous finding that positive/supportive parenting,
characterised by high levels of warmth, democratic discipline and involvement /supervision,
has been reported to be associated with lower levels of adjustment problems in Chinese
American youth (Kim & Ge, 2000), positive adjustment to college (Schnuck & Handal, 2011),
and socially competent behaviour (Baumrind, 1991; Lamborn et al., 1991). Moreover, Beyers
and Goossens (2003) indicated that regardless of students’ grade, gender, or perceived
parenting style, high levels of independence from parents predicted higher levels of adjustment
to university. Similarly, if college students had a high level of independence from parents this
could result in a feeling of mutual reciprocity between the parent and a child (Wintre & Yaffe,
2000). The findings of the present study are in line with expectations: it seems that mothers
and fathers play important roles in promoting the adjustment of their children (Maggio &
Zappulla, 2014).
Parental demandingness had a statistically significant direct effect on adjustment (β=
.055, *p <.05). This implies that first year university students who perceive their
maternal and paternal figures as strict, demanding, monitoring and firm controlling, as
measured using the parental demandingness sub-scale, were found to be coping
successfully with environmental demands and pressures inherent at university.
In agreement with the present result, a study by Maggio and Zappulla (2014) showed that
parental strictness/supervision plays the most protective role for boys’ adjustment. In the study
both fathers and mothers promote this adjustment by monitoring and controlling their children
rather than by providing affection and emotional support. This result suggests the importance
130
of focusing particular attention on the dimension of parental strictness/supervision and on its
relationship with adolescents’ adjustment.
TEI had a significant and positive direct effect on adjustment (β = .44, *p < .05). That
is, first year students who reported that they have positive self-perceptions about their
emotional abilities, skills, and personality characteristics which influence their ability
to cope successfully with environmental demands and pressures were found to have
significantly better adjustment experiences at their university.
The present finding that TEI has a direct and indirect effect on adjustment is somewhat
consistent with the previous result that a review of literature pertaining to EI shows that, EI
skills are strong predictors of a student's adjustment to college (Elias et al., 2007; Parker et al.,
2006). Considering the importance of EI to adjustment, individuals who have the capacity to
decode, understand, and regulate emotions, interact with other people, and manage
relationships had a better social and academic adjustment (Goleman, 1998; Low & Nelson,
2005; Mayer & Salovey, 1997).
Again in line with the present results, TEI was related with a host of criteria relating to
individuals’ social, emotional, and behavioural well-being (Greven et al., 2008; Mikolajczak et
al., 2006). For example, in a study by Poulou (2010) on the relationship between TEI and
students’ emotional and behavioural strengths and difficulties, it was reported that the
emotion-related self-perceptions and dispositions included in TEI inventory predicted
adolescents’ emotional and behavioural strengths and difficulties.
Consonant with the present result, TEI is important for university adjustment primarily
because emotional self-efficacy is an important aspect of that construct (Petrides et al., 2007),
which would influence how students persevere in the face of academic difficulties and how
resilient they are to academic stressors. TEI also impacts successful social adjustment at
university (Engelberg & Sjoberg, 2004), and aid adjustment (Christie et al., 2004). Most
importantly, TEI is correlated with social competency (Mavroveli et al., 2007), and measures
of social adjustment in older adolescents and adults (Chapman & Hayslip, 2005; Engelberg &
Sjoberg, 2004).
131
Concurring with the present result, EI plays a role to help students to maintain the adjustment
successfully during their university transition (Low & Nelson, 2005). The implication of this
portion of the finding is that, therefore, students require an early EI programme in order to
adjust their transition (Austin et al., 2005).
Generally, using the re-specified path model and inferring from previous findings, it can be
deduced that adjustment is a function of parental responsiveness, parental demandingness, and
TEI.
5.5.2 The predictive effect of parental responsiveness, parental demandingness, and
TEI on adjustment
One of the objectives of this study was to examine whether the three variables (parental
demandingness, parental responsiveness, and TEI) interactively predict adjustment to
university of first year university students. The results revealed that 31.9 % of the variance in
adjustment is explained by these variables. Therefore, the three predictor variables combined
explained 31.9 percent of the variance in the dependent variable of adjustment.
The finding that the three variables predict adjustment (not in the manner of this study but
indirectly), is fairly consistent with previous findings that the student’s successful transition
into a university is evidenced as being associated with variables or a combination of variables
consisting of academic and non-academic factors. TEI and parental behaviours are among the
factors. In this regard, a longitudinal research by Maggio and Zappulla (2014) conducted to
investigate the predictive role that maternal and paternal characteristics and parenting styles
and the findings proved that they played a role in individuals’ adjustment during development.
Other researchers reported a relationship between adolescents’ adjustment problems and their
parents’ parental behaviours (Jackson et al., 2005; Parmar & Rohner, 2005). A study by Yip
and Martin (2006) also established the existence of a relationship between EI and overall
student adjustment. More specifically, TEI is linked to individuals’ social, emotional, and
behavioural well-being as well (Greven et al., 2008; Mikolajczak et al., 2006).
To conclude, while previous research noted that the individual variables under consideration
were directly or indirectly investigated in a few previous research studies, the combined effect
of the three variables (TEI, parental demandingness, and parental responsiveness) on
132
adjustment has not been researched. As a consequence, it is not possible to compare the
present result with previous studies because the literature does not directly reveal any research
that has examined the interactive effect of the three variables on adjustment. It is difficult to
explain the reasons for the lack of research in this area. Nevertheless, the present research lays
a foundation that will facilitate the discovery of unique elements that could guide future
investigations and theory development.
5.5.3 The mediation effect of TEI on the relationship between parental responsiveness
and adjustment
Section 5.5.2 discusses the predictive effect of parental responsiveness, parental
demandingness, and TEI on adjustment in line with previous research findings in an indirect
way. In this section, attention is paid to checking the mediation effect of TEI on the
relationship between parental responsiveness and adjustment.
The present result indicates that there was no complete mediation: rather, TEI only partially
mediates the relationship between parental responsiveness and adjustment. This implies that
first year university students who perceive their maternal and paternal figures as loving,
responsive, involved, warm, accepting and close, as measured using the parental
responsiveness sub-scale, were found to have significantly higher self-perceptions on their
emotional abilities, skills, and personality characteristics which in turn, influence their ability
to cope successfully with environmental demands and pressures inherent at university.
Indirectly, the present result is in some way related to previous findings that parenting
practices that university students have experienced at a younger age or at present play an
important role in their adjustment during their late adolescent life. For example, late
adolescents’ retrospective reports of the positive parenting they experienced as children were
significantly related to the quality of their current relationship (Dalton et al., 2006). There is
also a clear and well established relationship between parents’ parenting behaviours during
their children’s childhood and early adolescence and their children’s maladjustment during
late adolescence (Parmar & Rohner, 2005).
Again, the studies conducted which are indirectly available in literature depict that TEI is
highly correlated with core personality dimensions (Petrides et al., 2007). In this regard,
133
Schnuck and Handal (2011) attempted to establish if the relationships that were found between
perceived parenting style and student adjustment were mediated by personality traits.
Analyses revealed that this was not the case. In Schnuck’s and Handal’s study it appears that
the mechanism by which parenting is related to adjustment and adaptation to college is largely
not due to personality traits.
Although more research in this area is needed, the available research provides initial support
for the hypothesis that parental behaviours are related to TEI and adjustment. For example,
late adolescents’ retrospective reports of the positive parenting they experienced as children
were significantly related to the quality of their current relationship (Dalton et al., 2006).
There is evidence of a link between parenting style and an adolescent’s TEI (Alegre &
Benson, 2010; Liau et al., 2003; Martinez-Pons, 1999). Moreover, Winter’s and Yaffe’s
(2000) study found that good relations with parents help both male and female students to
adjust to the university. Raj (2012) also reported that students who maintain compatible
relationships with their families are more likely to do well at university. On the other hand,
TEI also impacts successful adjustment (Christie et al., 2004).
Nevertheless, it is not possible to compare the present results with previous studies because
the literature does not directly reveal any investigations that have examined the relation
between parental responsiveness as a predictor variable and adjustment as the predicted
variable while TEI has been the mediator variable. It is hard to elucidate the reasons for the
lack of research in this area or the absence of studies that investigate the relation between
parental responsiveness and adjustment and TEI. Also, the inter-relationship of these concepts
interactively and individually, especially the concept TEI, is still in its infancy stage as there is
not enough understanding of this important issue under consideration. Therefore, this aspect of
the objective of the study and its result is unique, and might be used to replicate it in the
future, which could guide future investigations and theory development.
5.5.4 The mediation effect of TEI on the relationship between parental
demandingness and adjustment
Section 5.5.3 discusses the results that TEI partially mediates the relationship between parental
responsiveness and adjustment in line with the indirectly available previous researches. In this
section, the focus is placed on checking the mediation effect of TEI on the relationship
between parental demandingness and adjustment. The result confirms that TEI plays a
134
mediation role, but only partially, in the parental demandingness and adjustment relationship,
which confirms potentially that the adjustment scale could explain the relationship between
parental demandingness and TEI. The implication is that first year university students who
perceive their maternal and paternal figures as strict, demanding, monitoring and firm
controlling (e.g., control and parental firmness) as measured using the parental demandingness
sub-scale were found to have significantly higher self-perceptions of their emotional abilities,
skills, and personality characteristics which in turn, influence their ability to cope successfully
with environmental demands and pressures inherent to university.
In this regard in a similar manner with section 5.5.3, only studies which were conducted
indirectly are available in the literature. Though more research in this area is needed, the
available research provides initial support for the hypothesis that parental behaviours are
related to TEI and adjustment. For example, Alegre (2011) earlier reported that parental
responsiveness, parental emotion-related coaching, and parental positive demandingness are
related to children’s higher EI while parental negative demandingness is related to children’s
lower EI. Longitudinal research also verified that maternal and paternal characteristics and
parenting styles played a part in individuals’ adjustment during development (Maggio &
Zappulla, 2014). Moreover, TEI also impacts successful social adjustment at university
(Engelberg & Sjoberg, 2004).
Again, it is not possible to compare the present results with previous studies because the
literature does not directly reveal any studies that have examined the relation between parental
demandingness as a predictor variable and adjustment as the predicted variable while TEI as a
mediator variable. It is difficult to explain the reasons for the absence of studies that
investigate the relation between parental demandingness and adjustment and TEI. Therefore,
this study is unique enough and will facilitate the discovery of unique elements that can guide
future investigations and theory development.
135
CHAPTER SIX
SUMMARY AND CONCLUSIONS OF THE STUDY
This chapter summarises key elements of the study, draws conclusions, discusses the strengths
and limitations of the current project and identifies directions for future research. This is
followed by a brief discussion of the practical, theoretical, and methodological contributions
of the study. The chapter also makes relevant recommendations for designing intervention
strategies based on the results of the study.
6.1 SUMMARY
The main objective of this study was to develop a conceptual framework of the parenting-
student adjustment relationship that is affected by the meditating impact of TEI. To achieve
this objective, questions for this research were:
Main research question:
How are TEI and parenting style/dimension affecting adjustment at university of first
year students in institutions of higher education?
Sub- research questions:
How does TEI mediate the relationship between demandingness and responsiveness
dimension-variables of parenting style and adjustment at university of first year
students?
Does the combined effect of the three variables (parental demandingness, parental
responsiveness, and TEI) predict adjustment to university of first year university
students?
Is there a statistically significant gender difference with respect to TEI and
adjustment level of first year university students?
Does the university life adjustment scale explain the relationship between TEI and
demandingness and responsiveness dimension-variables of parenting style,
controlling for the level of degree of adjustment with university life?
136
Which type of parenting style is predominantly practiced by the families of Ethiopia?
Are there significant differences in adjustment and TEI as a function of first year
university students’ perceived parenting style (authoritative, authoritarian, neglectful,
and indulgent types)?
In order to achieve the objective of the present study and build the theoretical background, the
researcher undertook a systematic literature review which is presented in Chapter Two. Here,
the investigator critically reviewed those most influential theories and approaches related to
the TEI-parenting style/dimension-adjustment. Subsequently, I proposed a methodology for
this study based on the positivist paradigm by using a survey questionnaire to obtain data to
test the research questions. The proposed model was tested and the research questions of the
study were examined based on the data obtained from 464 (M=282 & F=182) undergraduate
first year university students recruited via a stratified random sampling technique from 3
randomly selected public universities in Ethiopia. The survey questionnaire was personally
administered and accompanied by a supporting letter to fully explain the objectives of this
study. For the purpose of this study SPSS 20.0 software and AMOS 18.0 were used to analyse
the data. Data collected from respondents for the main study were tested for outliers, normality
and multicollinearity. In addition, the main data were analysed using percentages, one-way
ANOVA, independent sample T-test, bivariate correlation, path analysis, multiple regressions,
and mediation.
Subsequently, in Chapter Four, all the analyses related to the proposed model and the research
questions were presented. To begin, findings revealed that the parenting style predominantly
adopted in the families of Ethiopia was a neglectful one, followed very closely by an
authoritative one. However, the most predominantly practiced parenting style appeared to
differ with regard to the gender of the first year university students. An authoritative parenting
style, followed by a neglectful one, were commonly practiced for female first year university
students whereas for males a neglectful parenting style was found to be the most frequently
adopted, followed by an authoritative one.
The one-way ANOVA result indicated a statistically significant TEI score difference among
the four parenting style categories F (3; 460; .05) = 2.63, which implies that parenting style
statistically significantly impacts TEI. The ANOVA result also indicated a statistically
significant difference in adjustment mean scores among the four parenting style categories F
137
(3; 460; .05) = 2.63, which implies that parenting style statistically significantly impacts first
year students’ adjustment to university life.
The independent sample T-test result made it clear that there was a statistically significant
difference in TEI score between male and female first year university students. Nevertheless,
no statistically significant adjustment to university score was noted between female and male
university students in their first year.
The results of the Pearson test demonstrated that adjustment was positively statistically
correlated to TEI (r=.52, *p<.05), parental responsiveness (r= .40, *p<.05), and parental
demandingness (r=.30, *p<.05). TEI significantly correlated with parental responsiveness
(r=41, p<.05), and parental demandingness (r=.30, *p<.05). Moreover, a strong statistically
significant correlation was found between parental responsiveness and demandingness (r=.61,
*p<.05).
Concerning the path analysis, two path diagrams were derived: the first path model derived
from Amos-18.0 was a just-identified one with no DF, it had a zero chi-square value, and
probability could not be computed. The second model, on the other hand, was an over-
identified one: with a positive DF, non-significant chi-square value, along with other fit
indices such as CFI, GFI, NFI, and TLI which were greater than .90 while RMSEA-was less
than .06.
The multiple regression results showed that the three variables (TEI, parental demandingness,
and parental responsiveness) combined explained 31.9 percent of the variance in the
dependent variable of adjustment. Moreover, the mediation analysis depicts that TEI has a
partially mediating effect on the relationship between parental responsiveness and adjustment.
The results also indicate that TEI only partially mediates the relationship between parental
demandingness and adjustment. Chapter Five presents a discussion by relating the results
obtained from Chapter Four, with the previous findings.
Finally, Chapter Six offers a summary of the present research alongside the conclusions, the
strengths, and limitations of this study with suggested future research directions, contributions
of the research based on the theoretical, methodological and practical perspectives, and
implications for practice.
138
6.2 CONCLUSIONS
Based on the results of the current study, the following conclusions were drawn:
The present study seeks to test a model where parental responsiveness, parental
demandingness and TEI, interactively and individually, relate to adjustment. Therefore, path
analysis was used to assess whether the model fits the empirical data; the following major
findings were evident:
The analysis of the fit indices in the present study revealed that the re-specified model
shows a good overall fit to the empirical data, with χ2(1)=1.725, p>.189, NFI= .996,
CFI = .998, RMSEA = .04, whereas the base line model displayed rather inadequate
data fits, with χ2 (0) = .000, *p< .000, NFI = 1.00, CFI=1.00, RMSEA=.414. This
implies that the re-specified model was significantly different from the baseline
model; hence, carrying out restrictions on the base line model to derive the re-
specified model that fitted the empirical data was justifiable and logical.
Parental responsiveness had a direct, positive statistically significant effect on TEI.
Parental responsiveness had direct, positive statistically significant direct and indirect
effects on adjustment.
Parental demandingness had a statistically significant direct effect on adjustment.
In addition, TEI had a significant and positive direct effect on adjustment.
Generally, it may be deduced from the path model that adjustment is a function of
parental responsiveness, parental demandingness, and TEI. When comparisons of the
strength of the paths from the predictors (parental responsiveness, parental
demandingness, and TEI) to the criterion (adjustment) were taken into account, the
path from TEI to adjustment was stronger, followed by the path from parental
responsiveness and demandingness to adjustment. Therefore, parental responsiveness
is a strong predictor and has a relatively stronger effect on the TEI development than
on adjustment.
139
Beyond the path model, the following conclusions can be drawn
With respect to the most commonly practiced parenting style in Ethiopia, identified in
the present study, it was found that there is a difference in such styles based on the
gender of university students. Specifically, an authoritative one is the predominantly
employed parenting style for daughters whereas a neglectful one is that most
commonly adopted for sons.
Parenting style statistically significantly impacts students’ TEI and first year students’
adjustment to university life. TEI, unlike adjustment to university life, was
statistically significantly impacted by gender.
TEI, parental demandingness, and parental responsiveness interactively explained 31.9
percent of the variance on the dependent variable of adjustment.
TEI partially mediates the relationship between parental responsiveness and
adjustment, and also partially mediates the relationship between parental
demandingness and adjustment.
6.3 STRENGTHS, LIMITATIONS, AND FUTURE RESEARCH
In this section, critical evaluations are provided on the strengths and limitations of the study,
and insights for future research. The thesis represents an important contribution to the analysis
of the complex relationship among parenting style/dimension, TEI, and students’ university
adjustment. In particular, the current work displays the following main strengths:
First, the study has considered parenting according to both typological and
dimensional approaches. In this way, university students’ adjustment and TEI were
investigated in relation to parenting style typologies (authoritative, authoritarian,
neglectful, and indulgent) as well as in relation to parenting dimensions
(responsiveness/acceptance and demandingness/ strictness). The multi-approach
assessment of the responsiveness and demandingness-dimension variables of
parenting style as well as the use of the categorical variable parenting style allow for
the comparison of the results in relation to the previous cross-cultural research, if any,
with the current study.

140
In addition, this thesis investigates responsiveness and demandingness separately and
interactively. This strategy does assume that the dimensions are equally salient in explaining an
individual’s developmental outcomes. While this study served to advance the literature with
regard to parenting style/dimension, TEI and adjustment within the country of Ethiopia, these
paths will also advance theory development and prevention/intervention efforts in general.
Despite these strengths, the study has a number of limitations that call for caution in the
interpretation of the results, all of which suggest rewarding avenues for further research. The
following are the limitations:
The first limitation concerns the measures, which were only self-report questionnaires
administered to first year university students, thus limiting the accuracy of the data.
In other words, there was no investigation of how these students’ perceptions might
compare with parents’ reports of their own behaviour or observers’ reports. Of course,
one must bear in mind that this limitation was also a feature of all of the frequently
cited parenting-style studies that were referred to in this research. Therefore, future
research should employ multiple methods and informants (collect data directly from
mothers and fathers in assessing the parenting styles of both), which would help to
compare parents’ and children’s perceptions.
Second, it is believed that the potential factors affecting TEI and adjustment of first
year university students cannot be understood fully without considering and
examining other background information factors which have not been included in this
study. In grasping and applying this, the future research will need to scrutinize the
effects of other background variables on the dependent variables (i.e., TEI and
students’ university adjustment).
The third limitation is in regard to a common concern of self-report data, which is
social desirability (i.e., the bias in self-report data accounted for by respondents’
desire to look good, which is because of their need for self-protection and social
approval). Since the data for parenting styles, TEI, and adjustment were collected
using self-report questionnaires, the participants’ responses may have been influenced
by social desirability and therefore might represent all the known validity problems
associated with this type of data. It is important to note that although university
students can respond behaviourally and emotionally to their own perceptions of the

141
parenting that they experience and their own TEI and adjustment to university, what
they experience and recall may differ from what is actually experienced in families
with regard to their parents’ parenting styles. Furthermore, their perceptions of their
own trait EI and adjustment may differ from their actual TEI and adjustment.
Therefore, future research should include observation and a longitudinal study as well
as focus group discussions in an attempt to curb the problem.
Fourth, as the study involved three Ethiopian public universities, it is recommended
that in the future, a more comprehensive study should be carried out to cover a wider
range of students from more higher education institutions in Ethiopia.
Fifth, the survey used in this study was quantitative in nature. One main benefit of
quantitative analysis is that hypotheses can be directly tested based on the data
collected. However, a future study incorporating qualitative analysis could serve to
further explore parenting styles, TEI, and adjustment to university culture in Ethiopia
or abroad in greater depth than can be achieved through the use of a survey
questionnaire.
Six, the researcher was unable to find very relevant documents, journals, and others’
work, especially on the area of TEI and its relationship with the major study variables.
He was therefore unable to include very up-to-date relevant works of others
concerning the major study variables of this research, in the expected manner. Thus,
future research could overcome the problem at least in part by referring to this
research work as a benchmark.
6.4 PRACTICAL, THEORETICAL AND METHODOLOGICAL CONTRIBU-
TIONS OF THE STUDY
Despite the aforementioned caveats, the results of this study have made practical, theoretical,
and methodological contributions. The implications of this research are now discussed in
order.

142
6.4.1 Practical contributions of the study
The findings of this study, to mention just a few, make the following practical contributions
for policy makers, higher learning institutions, student counselors, parents and university
students. That is, from the present findings they will be able to comprehend that both the
mediator variable TEI and parenting style/dimension significantly affect students’ university
adjustment. Having knowledge and understanding of this will help in the development of
different strategies for timely interventions aimed at improving the adjustment level of first
year students at university.
Knowing and understanding the factors which are operating will enable:
Higher learning institutions and policy makers to develop strategies and techniques
for intervention to maximize students’ adjustment at an optimal level. For example,
these stakeholders will be empowered to develop strategies and techniques for how
students can adjust themselves to the new university culture, as well as for ways in
which they can be supported when they encounter different types of problems which
are associated with their studies in these institutions.
Teachers in higher education institutions can play a significant role in enabling
students to feel more at home, thereby improving adjustment by establishing and
maintaining supportive and welcoming pedagogical environments and employing
those teaching and evaluation methodologies which are focused on students’
adjustment as well as their educational needs and overall development.
The findings of this study have important implications for parents, in particular to
support the use of an authoritative parenting style in their child-rearing practices and
facilitate the conditions which are essential to foster their students’ adjustment and
TEI.
6.4.2 Theoretical contributions of the study
As mentioned, the main objective of this study was to develop a conceptual framework of the
parenting-student adjustment relationship that is affected by the meditating impact of TEI.
Therefore, this study provides new findings which are extremely relevant to this area of
research. Hence, these offer many theoretical contributions.
143
First, these findings enable us to understand better the effect of parenting
style/dimension on TEI and adjustment of first year university students and to
contribute in expanding knowledge to theories in these fields. Specifically, the
findings of the present study help one to grasp that the theories of parenting
style/dimension, TEI, and adjustment are applicable beyond Western, individualist
countries – at least with regard to Ethiopia–and these traits have the same effects on
the adjustment level of students in this collectivist African country as they do in
individualist countries such as the USA and most European countries.
Second, the findings and implications of this study have considerable importance for
theorists in the field of socialisation, assisting them to understand the parenting style
predominantly practiced in Ethiopia, which will expand knowledge of the
socialisation of children in the Ethiopian cultural context.
Third, the findings and implications of the current study are critical for building on
previous research in the area, and fill a gap in empirical work, since studies in the area
under consideration have been mainly focused on Asian and Western countries.
6.4.3 Methodological contributions of the study
The methodological contributions of this study are the following:
First, it is one of the few to examine the mediating impact of TEI on the relationship
between parenting dimension/style and adjustment to university outside of the western
cultural setting and, specifically, in Ethiopia.
Second, because this study uses statistical procedures to check the reliability and
validity of the measurement items before incorporating them into this study, it has
provided evidence that the tools used for data collection, such as the PDQ, TEIQue,
and he SACQ appear to be reliable instruments in the Ethiopian cultural context.
According to the findings, all the scales which have been used appear valid and
reliable in their general content but, of course, the numbers of purified items used in
this study are not identical to those in the original scales which were used in other
countries. Therefore, it could be argued that this study contributes to the literature by
examining and judiciously adapting constructs of well-established models in the
context of Ethiopia, which typically represents a collectivist country.
144
6.5 RECOMMENDATIONS FOR FUTURE INTERVENTIONS
Based on the findings of this thesis, the following implications/recommendations are provided.
This research is focused on parenting style/dimension, TEI and students’ adjustment that could
better equip students, parents, counsellors, and institutions of higher education with methods
of handling various adaptation issues. This research study furnishes conclusive evidence with
respect to the influence of parenting behaviours and TEI on students’ university adjustment.
Therefore, results of this study contribute knowledge as regards the implementation of
programmes for new first year university students.
Research based information could be used to educate parents to better support their
students with their first year transition or to improve their parenting skills as needed.
Programmes should include orientation workshops for parents of new students which
address the relationship of parenting style, TEI and student adjustment at university.
This research can be used as the basis for educating parents about the effects of their
parenting style and how to help their students effectively transition into and gain
greater adjustment success.
Guidance counsellors should offer parenting classes that incorporate an authoritative
style of parenting. To do so, the diverse parenting styles of multicultural populations
should be considered in developing the programme for parents.
Teachers should be more sensitive to the students in the classroom who come from
diverse parenting environments and consider the appropriateness of authoritative
parenting style such as methods of pedagogy to the different environmental situations,
including the classroom settings due to the strong relationship of this style with
improvement of TEI and adjustment, which in turn, promotes higher graduation rates
and better outcomes in the future.
In summary, interventions for future practice should include more incorporation of parenting
practices, university representatives, teaching strategies and guidance and counsellors in a
collaborative effort to promote more learning opportunities that foster and raise the adjustment
level of first year university students. Parent orientations, university visitations, life skills
training for both the parents and students, peer education programmes, family welcome
parties, internships and school/business collaborations are examples of learning opportunities
145
that could assist in raising the aspirations and thus, the adjustment level of first year university
students, and provide parents with the necessary skills to support their children’s adjustment.
6.6 RECOMMENDATIONS FOR FUTURE RESEARCH
Finally, additional future research that incorporates the following would be helpful in adding
knowledge to this study: (a) include second year university students to determine if university
adjustment problems continues into the sophomore year, (b) include CEE scores, (c) on-
campus or off-campus residence as well as having a roommate affects adjustment, also, (d)
family dynamics including, parenting socialization of their children, educational support of
parents, parents’ martial relationships, and sibling relationships.
146
REFERENCES
Abdullah, M. C., Elias, H., Mahyddin, R., & Uli, J. (2009). Adjustment amongst first year
students in a Malaysian university. European Journal of Social Sciences, 8(3), 496-505.
Retrieved on June 20, 2013 from Http://Www.Eurojournals.Com/Ejss_8_3_13.Pdf.
ACT, (2002).College graduation rates steady despite increase in enrollment. Retrieved on
June 09, 2014 from Http:Www.Act.Org/News.
Alegre, A., & Benson, M. J. (2010). Parental behaviours and adolescent adjustment:
Mediation via adolescent trait emotional intelligence. Individual Differences Research 8
(2), 83-96.
Alegre, A. (2011). Parenting styles and children's emotional intelligence: What do we know?
The Family Journal, 19(1), 56-62. Doi: 10.1177/1066480710387486.
Al-Khatib, B. A., Awamleh, H. S., & Samawi, F. S. (2012). Student's adjustment to college
life at Albalqa Applied University. American International Journal of Contemporary
Research, 2(11).
Andrei, F., & Petrides, K. V. (2013).Trait emotional intelligence and somatic complaints with
reference to positive and negative mood. Psihologija, 46, 5–15.
Antoniou, A. S., Kaprara, N., & Drosos, N. (2016). The relationship between trait emotional
intelligence and vocational interests of Greek 10th and 11th grade students.Psychology,7,
523-532.http://dx.doi.org/10.4236/psych.2016.74053.
Austin, E.J., Evans, P., Goldwater, R., & Potter, V. (2005). A preliminary study of emotional
intelligence, empathy, and exam performance in first year medical students. Personality
and Individual Differences, 39, 1395-1405.
Ayele, G. A. (2012). Effects of parenting styles, academic self-efficacy, and achievement
motivation on the academic achievement of university students in Ethiopia. Unpublished
Doctoral Dissertation. Edith Cowan University.
Azar, N. N., & Reshadatjoo, H. (2014). Adjustment amongst first year students in an Iranian
university. Journal of Education Research and Behavioral Sciences, 3(5), 102-105.
Baker, R.W., & Siryk, B. (1984). Measuring adjustment to college. Journal of Counseling
Psychology, 31, 179-189.
Baker, R. W., & Siryk, B. (1986). Exploratory intervention with a scale measuring adjustment
to college. Journal of Counseling Psychology, 33(1), 31-38.
Baker, R. W., & Siryk, B. (1989). SACQ: Student Adaptation to College Questionnaire
manual. Los Angeles: Western Psychological Services.
147
Baker, R., & Siryk, B. (1999). SACQ: Student Adaptation to College Questionnaire manual
(2nd. Ed.). Los Angeles: Western Psychological Services.
Bar-On, R. (1997). Bar-on emotional quotient inventory: A measure of emotional intelligence.
Toronto, On: Multi-Health System.
Bar-On, R. (2000). Emotional expression and implications for occupational stress: An
application of the emotional inventory (Eq-I). Personality and Individual Differences.
Bar-On, R. (2004). The Bar-On Emotional Quotient Inventory (EQ-i): Rationale, description
and psychometric properties. In G. Geher (Ed.), Measuring emotional intelligence:
Common ground and controversy. Hauppauge, NY: Nova Science.
Bar-On, R. (2006). The Bar-On model of emotional-social intelligence. Psicothema, 18, 13-
25.
Baron, R. M., & Kenny, D. A. (1986). The moderator-mediator variable distinction in social
psychological research: Conceptual, strategic, and statistical considerations. Journal of
Personality and Social Psychology, 51, 1173–1182.
Baron, R., & Parker, J. D. (2000). E.Q.I:YvBar-On emotional quotient inventory: Youth
version. Technical Manual. North Towanda, Ny: Multi-Health Systems Inc.
Baumrind, D. (1967). Child cares practices anteceding three patterns of preschool behavior.
Genetic Psychology Monographs, 75, 43-88.
Baumrind, D. (1971). Current patterns of parental authority. Developmental Psychology
Monographs, 4(2), 1–103.
Baumrind, D. (1972). An exploratory study of socialization effects on black children: Some
black-white comparison. Child Development, 43, 261–267.
Baumrind, D. (1991). The influence of parenting style on adolescent competence and
substance use. Journal of Early Adolescence, 11, 56–95.
Baumrind, D. (1997). The discipline encounter: Contemporary issues. Aggression and Violent
Behavior, 2(4), 321-335. Doi: 10.1016/S1359-1789(97)00018-9.
Bernie-Lefcovitch, S. (2000). Student perceptions of the transition from high school to
university: Implications for preventative programming. Journal of the First Year
Experience and Students in Transition, 12(2), 61-88.
Bernier, A., Larose, S., & Whipple, N. (2005). Leaving home for college: A potentially
stressful event for adolescent with preoccupied attachment patterns. Attachment and
Human Development, 7, 171-185.
148
Beyers, W., & Goossens, L. (1999). Emotional autonomy, psychosocial adjustment, and
parenting: Interactions, moderating, and mediating effects. Journal of Adolescence, 22,
753-769.
Beyers, W., & Goossens, L. (2003). Psychological separation and adjustment to university:
Moderating effects of gender, age, and perceived parenting style. Journal of Adolescent
Research, 18(4), 363-382.
Boulter, T.(2002). Self-concept as a predictor of college freshman academic adjustment.
College Student Journal, 36 (2), 234-246.
Brackett, M. A., Rivers, S. E., Shiffman, S., Lerner N., & Salovey, P. (2006). Relating
emotional abilities to social functioning: A comparison of self-report and performance
measures of emotional intelligence. Journal of Personality and Social Psychology, 91,
197 –212.
Briggs, A.R.J., Clark, J., & Hall, I. (2012). Building bridges: Understanding student transition
to university. Quality in Higher Education, First Article, 1–19.
Brown, F. W., & Moshavi, D. (2005). Transformational leadership and emotional intelligence:
A potential pathway for an increased understanding of interpersonal influence. Journal of
Organizational Behavior, 26(7), 867-871.
Burgess, T., Crocombe, L., Kelly, J., & Seet, P. S. (2009).The effect of cultural background on
the academic adjustment of First Year Dental Students.Ergo,1(2):5-24.
Buri, J. R. (1991). Parental authority questionnaire. Journal of Personality Assessment,
57,110-119. http://doi.org/b92.
Cabrera, N.J., Tamis-Lemonda, C.S., Bradley, R.H., Hofferth, S., & Lamb, M.E. (2000).
Fatherhood in the twenty-first century. Child Development, 71, 127–136.
Central Statistical Agency (2012). Inter-censual population survey report. Addis Ababa,
Ethiopia.
Chapman, B. P., & Hayslip, B. (2005). Incremental validity of a measure of emotional
intelligence. Journal of Personality Assessment, 85(2), 154–169.
Christie, H., Munro, M., & Fisher, T. (2004). Leaving university early: Exploring the
differences between continuing and non-continuing students. Studies in Higher
Education, 29,617-636.
Clinciu, A. I. (2013). Adaptation and stress for the first year university students. Social and
Behavioral Sciences 78, 718–722. Available online at www.sciencedirect.com.
Consolvo, C. (2002). Building student success through enhanced coordinated student services.
Journal of College Student Development, 284-287.
149
Cooke, R., Beewick, B.M., Barkham, M., Bradley, M., & Audin, K. (2006). Measuring,
monitoring, and managing the psychological wellbeing of first year university students.
British Journal of Guidance and Counseling, 34 (4), 505-517.
Coplan, R. J., Hastings, P. D., Lagace-Seguin, D. G., & Moulton, C. E. (2002 ). Authoritative
and authoritarian mothers’ parental goals, attributions, and emotions across different child
rearing contexts. Parenting: Science and Practice, 2, 1–26.
Dalton, W. T., Frick-Horbury, D., & Kitzmann, K. M. (2006). Young adults’ retrospective
reports of parenting by mothers and fathers: Associations with current relationship
quality. Journal of General Psychology, 133(1), 5–18.
Darling, N. (1999). Parenting style and its correlates. Eric Digest, 99-3, 1-2.
Darling, N., & Steinberg, L. (1993). Parenting style as context: An integrative model.
Psychological Bulletin, 113, 487–496.
Doyle, M.S., & Walker, L.S. (2002). Teaching the first year student. Instructional
Development Office, Memorial University of Newfoundland.
Dwairy, M. A., & Mensha, K.E. (2006). Parenting style, individuation, and mental health of
Egyptian adolescents. Journal of Adolescence, 29: 103-17.
Dwairy, M.A. (2010). Parental inconsistency: A third cross-cultural research on parenting and
psychological adjustment of children. Journal of Child Family Study, 19, 23–29.
Dyson, R., & Renk, K. (2006). Freshmen adaptation to university life: Depressive symptoms,
stress, and coping. Journal of Clinical Psychology, 62(10), 1231-1244.
Elias, H., Mahyuddin, R., & Noordin, N. (2007). Academic adjustment among second year
students in Malaysian Universities. International Journal of Interdisciplinary Social
Sciences, 4(3), 237-252.
Engelberg, E., & Sjoberg, L. (2004). Emotional intelligence, affect intensity, and social
adjustment. Personality and Individual Differences.
Enochs, W. K., & Roland, C.B. (2006). Social adjustment to college freshmen: the importance
of gender and living environment. College Student Journal, 40(1), 63-72.
Estrada, L., Dupoux, E., & Wolman, C. (2005). The personal-emotional social adjustment of
English-language learners to a community college. Community College Journal of
Research and Practice, 29(7), 557-568.
Finn, J., & Jacobson, M. (2008). Just practice: A social justice approach to social work.
Peosta, IL: Eddie bowers publishing.
Fonte, B. A. (2009). Relationship between parenting style, emotional intelligence, and self-
esteem.

150
Friedlander, L. J., Reid, G. J., Shupak, N., & Cribbie, R. (2007). Social support, self-esteem,
and stress as predictors of adjustment to university among first year undergraduates.
Journal of College Student Development, 46(3), 223-236.
Gafoor, A., K., & Kurukkan, A. (2014). Construction and validation of scale of parenting
style. Guru Journal of Behavioral and Social Sciences, 2(4), 2320-9038www.gjbss.org.
Gall, T. L., Evans, D. R., & Bellerose, S. (2000). Transition to first-year University: Patterns
of change in adjustment across life domains and time. Journal of Social and Clinical
Psychology, 19 (4), 544-567.
Garcia, F., & Gracia, E. (2009). Is always authoritative the optimum parenting style? Evidence
from Spanish families. Adolescence, 44, 101–131.
Gohm, C. L., Corser, G. C., & Dalsky, D. J. (2005). Emotional intelligence under stress:
Useful, unnecessary, or irrelevant? Personality and Individual Differences, 39, 1017–
1028.
Goleman, D. (1995). Emotional intelligence; why it can matter more than IQ?. New York
Bantam Books.
Goleman, D. (1998). Working with emotional intelligence. New York: Bantam Books.
Gracia, E., Garcia, F., & Lila, M. (2008). What is the best for your children? Authoritative vs
indulgent parenting styles and psychological adjustment of Spanish adolescents.
University of Valencia, Spain.
Grant-Vallone, E., Reid, K., Umali, C., & Pohlert, E. (2004). An analysis of the effects of self-
esteem, social support, and participation in student support services on students
adjustment and commitment to college. Journal of College Student Retention, 5(3), 255-
274.
Grehan, P. M., Flanagan, R., & Malgady, R. G. (2011). Successful graduate students: The
roles of personality traits and emotional intelligence. Psychology in the Schools, 48(4).
Wiley Periodicals, Doi:10.1002/Pits.20556.
Greven, C., Chamorro-Premuzic, T., Arteche, A., & Furnham, A. (2008). A hierarchical
integration of dispositional determinants of general health in students: The big five, trait
emotional intelligence and humor styles. Personality and Individual Differences, 44,
1562–1573.
Groot, J. M. (2009). Assessing behavior and social competence of severely emotionally
disturbed youth admitted to psychiatric residential treatment. Journal of Child and
Adolescent Psychiatric Nursing, 22, 143–149.
151
Habibah, E., Noordin, N., & Mahyuddin, R. (2010). Achievement motivation and self-efficacy
in relation to adjustment among university students. Journal of Social Sciences, 6(3), 333-
339.
Habtamu, W. (1995). Dominant values and parenting styles: Major limiting factors on the
development of entrepreneurship in Ethiopia. Proceedings of the first annual conference
on management in Ethiopia: On the theme Entrepreneurship. Addis Ababa University,
Addis Ababa, Ethiopia.
Harms, P. D., & Credé, M. (2010). Emotional intelligence and transformational and
transactional leadership: A Meta-Analysis. Journal of Leadership and Organizational
Studies, 17(1), 5-17.
Harrod, N.R., Scheer, S. D. (2005). An exploration of adolescent emotional intelligence in
relation to demographic characteristics. Adolescence, 40(159).
Herzog, K. T., Hill-Chapman, C., Hardy, K. T., Wrighten, A. S., & El-Khabbaz, R.
(2015).Trait emotion, emotional regulation, and parenting styles. Journal of Educational
and Developmental Psychology, 5(2).
Hickman, G. P., Bartholomae, S., & McKenry, P. C. (2000). Influence of parenting styles on
the adjustment and academic achievement of traditional college freshmen. Journal of
College Student Development, 41, 41-54.
Hu, L. T., & Bentler, P. M. (1999). Cut-off criteria for fit indices in covariance structure
analysis: Conventional criteria versus new alternatives. Structural Equation Modeling, 6,
1–55.
Huang, X. (2007). Parental acculturation, parenting practices, and adolescent depressive
symptoms in Chinese American families. Doctoral Dissertation, University of Texas at
Austin. Retrieved on February 09, 2014 from Https://Www.Lib.Utexas.
Ishak, Noor-Azniza, Jdaitawi, M. T., Ibrahim, Y. S., & Mustafa, F. T. (2011). Moderating
effect of gender, and age on the relationship between emotional intelligence with social
and academic adjustment among first year university students. Doi:10.5539/Ijps
.V3n1p78.
Jackson, L. M., Pratt, M. W., Hunsberger, B., & Pancer, S. M. (2005). Optimism as a mediator
between perceived parental authoritativeness and adjustment among adolescents: Finding
the sunny side of the street. Social Development, 14,273–304.
Jacobson, M., Pruitt Chapin, K., & Rugeley, C. (2009). Toward reconstructing poverty
knowledge: Addressing food insecurity through grassroots research design and
implementation. Journal of Poverty, 13(1), 1-19.
152
Jambunathan, S., & Counselman, K. (2002). Parenting attitudes of Asian Indian mothers living
in the United States and in India. Early Child Development & Care, 172(6), 657– 662.
Karavasilis, L., Doyle, A. B., & Markiewicz, D. (2003). Associations between parenting style
and attachment to mother in middle childhood and adolescence. International Journal of
Behavioral Development, 27(2), 153-164. Doi: 10.1080/0165025024400015.
Kassahun, H. (2005). The relationship of parenting styles and academic performance among
primary and secondary school students in Debre Markos Town. Unpublished Master’s
Thesis, Addis Ababa University, Addis Ababa, Ethiopia.
Kazemi, A., Ardabili, H., & Solokian, S. (2010). The association between social competence
in adolescents and mothers’ parenting style: A cross sectional study in Iranian girls. Child
Adolescence Social Work Journal, 27,395–403/. DOI 10.1007/S10560-010-0213-X.
Kerr, M., Stattin, H., & Ozdemir, M. (2012). Perceived parenting style and adolescent
adjustment: Revisiting directions of effects and the role of parental knowledge.
Developmental Psychology, 48(6), 1540–1553.
Keshavrz, S., & Baharudin, R. (2009). Parenting style in collectivist culture of Malaysia.
European Journal of Social Sciences.10(1), 66.
Kim, S.Y., & Ge, X. (2000). Parenting practices and adolescent depressive symptoms in
Chinese American Families. Journal of Family Psychology, 14(3), 420–435.
Kothari, C. (2004). Research methodology; Methods and techniques. New Age International
Publishers; New Delhi, India.
Kyalo, P. M. (2011). Selected factors influencing social and academic adjustment of
undergraduate students of Egerton University; Njoro campus. International Journal of
Business and Social Science, 2(18).
Lamborn, S. D., Mounts, N. S., Steinberg, L., & Dornbusch, S. M. (1991). Patterns of
competence and adjustment among adolescents from authoritative, authoritarian,
indulgent, and neglectful families. Child Development, 62, 1049–1065.
Liau, A. K., Liau, A. W. L., Teoh, G. B. S., & Liau, M. T. L. (2003). The case for emotional
literacy: The influence of emotional intelligence on problem behaviours in Malaysian
secondary school students. Journal of Moral Education, 32, 51–66.
Liem, J. H., Cavell, E. C., & Lustig, K. (2010). The influence of authoritative parenting during
adolescence on depressive symptoms in young adulthood: Examining the mediating roles
of self-development and peer support. The Journal of Genetic Psychology, 17, 73–92.
153
Low, G., & Nelson, D. (2005). Emotional intelligence: The role of transformation learning in
academic excellence. Texas Study of Secondary Education, 14 (2), 41-44.
Maccoby, E. E., & Martin, J. A. (1983). Socialization in the context of the family: Parent-child
interaction. In P. H. Mussen (Ed.), Handbook of Child Psychology, 4, 1–101. New York:
Wiley.
Maggio, R. D., & Zappulla, C. (2014). Mothering, fathering, and Italian adolescents’ problem
behaviors and life satisfaction: Dimensional and typological approach. J Child Fam Stud,
(23), 567–580.
Martinez, I., Cruise, E., Garcia O. F., & Murgui, S.(2017). English validation of the parental
socialization scale—ESPA29. Front Psychol, 8(865).
Martinez-Pons, M. (1999). Parental inducement of emotional intelligence. Imagination,
Cognition, and Personality, 18, 3-23.
Mavroveli, S., Petrides, K. V., Rieffe, C., & Bakker, F. (2007). Trait emotional intelligence,
psychological well-Being and peer related social competence in adolescence. British
Journal of Developmental Psychology, 25, 263–275.
Mayer, J. D., & Salovey, P. (1990). Emotional intelligence. Imagination, Cognition, and
Personality, 9, 185 – 211.
Mayer, J. D., & Salovey, P. (1995). Emotional intelligence and the construction and regulation
of feelings. Applied and Preventive Psychology, 4, 197-208.
Mayer, J. D., & Salovey, P. (1997). What is emotional intelligence? Emotional development
and emotional intelligence: Educational Implications, 3-31.
Mayer, J. D., Caruso, D. R., & Salovey, P. (2000). Emotional intelligence meets traditional
standards for intelligence. Intelligence, 27, 267-298.
Mayer, J. D., Roberts, R. D., & Barsade, S. G. (2008). Human abilities: Emotional
intelligence.
Mayer, J. D., Salovey, P., & Caruso, D.R (2004). Emotional intelligence: Theory, findings,
and implications. Psychological Inquiry, 15, 197-215.
Mayer, J. D., Salovey, P., & Caruso, D. R. (2008). Emotional intelligence: New ability or
eclectic traits? American Psychologist, 63(6), 503 – 517.
Mckinney, C., & Renk, K. (2008). Differential parenting between mothers and fathers:
Implications for late adolescents. Journal of Family Issues, 29, 806–827.
Mikolajczak, M., & Luminet, O. (2008). Trait emotional intelligence and the cognitive
appraisal of stressful events: An exploratory study. Personality and Individual
Differences, 44, 1445–1453.
154
Mikolajczak, M., Luminet, O., & Menil, C. (2006). Predicting resistance to stress: Incremental
validity of emotional intelligence over and above alexithymia and optimism. Psicothema,
18, 79–88.
Mikolajczak, M., Luminet, O., Leroy, C., & Roy, E. (2007). Psychometric properties of the
trait emotional intelligence questionnaire: Factor structure, reliability, construct, and
incremental validity in a French-speaking population. Journal of Personality Assessment,
88(3), 338–353. Lawrence Erlbaum Associates, Inc.
Mikolajczak, M., Menil, C., & Luminet, O. (2007). Explaining the protective effect of trait
emotional intelligence regarding occupational stress: Exploration of emotional labor
processes. Journal of Research on Personality, 41, 1107–1117.
Ministry of Education [MoE, 2013]. Ethiopian Federal Ministry of Education: Educational
statistics annual abstract. Addis Ababa, Ethiopia: Ministry of Education.
Ministry of Education [MoE, 2014]. The Federal Democratic Republic of Ethiopia Ministry of
Education: Gender strategy for the education and training sector. Addis Ababa, Ethiopia:
Ministry of Education.
Mounts, N. S. (2004).Contributions of parenting and campus climate to freshmen adjustment
in a multi-ethnic sample. Journal of Adolescent Research, 19(4), 468-491.
Mounts, N. S., Valentiner, D. P., Anderson, K. L., & Boswell, M. K. (2006). Shyness,
sociability, and parental support for the college transition: Relation to adolescents’
adjustment. Journal of Youth and Adolescence, 35, 71–80.
O’connor, J. R. M., & Little, I. S. (2003).Revisiting the predictive validity of emotional
intelligence: Self-report versus ability-based measures. Personality and Individual
Differences, 35, 1893–1902. Doi: 10. 1016/S0191-8869(03)00038-2.
Paramo, M. F., Martinez, Z., Tinajero, C., & Rodríguez, M. S. (2014). The impact of
perceived social support in first year Spanish college students’ adjustment. Journal of
International Scientific Publications, 12,1314-7277.
Parker, J. D. A., Hogan, M. J., Eastabrook, J. M., Oke, A., & Wood, L. M. (2006). Emotional
intelligence and students’ retention: Predicting the successful transition from high school
to university. Personality and Individual Differences, 41(7), 1329-1336.
Parker, J., Summerfeldt, L., Hogan, M., & Majeski, S. (2004). Emotional intelligence and
academic success: Examining the transition from high school to university. Personality
and Individual Differences, 36(1), 163-172.
155
Parmar, P., & Rohner, R. P. (2005).Relations among perceived intimate partner acceptance,
remembered parental acceptance, and psychological adjustment among young adults in
India. Ethos, 33, 402-413.
Petrides, K. V. (2001). A psychometric investigation into the construct of emotional
intelligence. University College, London.
Petrides, K. V. (2009). Technical manual for the trait emotional intelligence questionnaires
(Teique).London, England: London Psychometric Laboratory.
Petrides, K. V. (2010). Trait emotional intelligence theory. Psychological Inquiry, 3, 136–139.
Petrides, K. V., & Furnham, A. (2000). Gender differences in measured and self-estimated
trait emotional intelligence. Sex Roles, 42, 449 –461.
Petrides, K. V., & Furnham, A. (2001). Trait emotional intelligence: Psychometric
investigation with reference to established trait taxonomies. European Journal of
Personality, 15, 425–448.
Petrides, K. V., & Furnham, A. (2003). Behavioral validation in two studies of emotion
recognition, and reactivity to mood induction. European Journal of Personality, 17, 39 –
57.
Petrides, K. V., Frederickson, N., & Furnham, A. (2004).The role of trait emotional
intelligence in academic performance and deviant behavior at school. Personality and
Individual Differences, 36, 277–293.
Petrides, K. V., Furnham, A., & Mavroveli, S. (2007). Trait emotional intelligence: Moving
forward in the field of emotional intelligence. In G. Matthews, M. Zeidner, & R. Roberts
(Eds.), emotional intelligence: Knowns and unknowns (Series in Affective Science).
Oxford: Oxford University Press.
Petrides, K.V., Pita, R., & Kokkinaki, F. (2007). The location of trait emotional intelligence in
personality factor space. British Journal of Psychology, 98(2), 273-289.
Poulou, M. S. (2010). The role of trait emotional intelligence and social and emotional skills
in students’ emotional and behavioral strengths and difficulties: A Study of Greek
Adolescents’ Perceptions, 2(2),30-47.
Punia, S., & Sangwan, S. (2011). Emotional intelligence and social adaptation of school
children. Journal of Psychology, 2 (2), 83-87.
Qualter, P., Whiteley, H., Morley, A., & Dudiak, H. (2009). The role of emotional intelligence
in the decision to persist with academic studies in HE. Research in Post-Compulsory
Education, 14 (3), 219-231.
156
Raj, K. (2012). Social and academic adjustment of first-year university students. Journal of
Social Science, 33(2), 251-259. University of Venda, Thohoyandou, South Africa.
Ramsay, S., Jones, E., & Barker, M. (2007). Relationship between adjustment and support
types: Young and mature-aged local and international first year university students.
Higher Education, 54(2), 247-265. Doi: 10.1007/S10734-006-9001-0.
Rudy, D., & Grusec, J. E. (2006). Authoritarian parenting in individualist and collectivist
groups: associations with maternal emotion and cognition and children’s self-esteem.
Journal of Family Psychology, 20(1), 68–78.
Sabattini, L., & Leaper, C. (2004). The relation between mothers’ and fathers’ parenting styles
and their division of labor in the home: Young adults’ retrospective reports. Sex Roles,
50,217–225.
Salami, S.O. (2008). Gender, identity status, and career maturity of adolescents in south west
Nigeria. Journal of Social Sciences, 161, 35-49.
Salami, S.O. (2011). Psychosocial predictors of adjustment among first year college of
education students.US-China Education Review, 8(2), 239-248.
Salovey, P., Stroud, L. R., Woolery, A., & Epel, E. S. (2002). Perceived emotional
intelligence, stress reactivity, and symptom reports: Further explorations using the trait
meta-mood scale. Psychology and Health, 17,611–627.
Sanoff, A. (2006). A perception gap over students’ preparation. Chronicle of Higher
Education, 52 (27).
Schnuck, J., & Handal, P. J. (2011). Adjustment of college freshmen as predicted by both
perceived parenting style and the five factor model of personality. Psychology, 2, 275–
282.
Seleshi, Z. (1998). An exploratory study of parenting styles among four ethnic groups in urban
settings. Ethiopian Journal of Development Research, 20(2), 1-24.
Seleshi, Z., & Sentayehu T. (1998). Parenting style differences among selected ethnic groups
in Ethiopia. Unpublished research paper, forum on street children– Ethiopia in
cooperation with Radda Barnen (Swedish Save the Children), Addis Ababa, Ethiopia.
Sharma, B. (2012). Adjustment and emotional maturity among first year college students.
Pakistan Journal of Social and Clinical Psychology, 10(2) 32-37.
Sharma, N., & Kermane, M. M. (2015). Adjustment problems of college students in relation to
gender, socioeconomic status, and academic achievement. International Journal of
Current Research, 7(04), 14574-14578.
157
Sharma, A., & Sahni, M.(2013). Emotional intelligence in relation to home environment and
personality of adolescents. International Women Online Journal of Distance Education,
2(1), 2147-0367.Retrieved on October 10, 2014 from www.wojde.Org.
Slobodskaya, H. R., Safronova, M. V., & Windle, M. (2005). Personality, temperament, and
adolescent adjustment in modern Russia. Personality and Individual Differences, 39,167-
178.
Steinberg, L. (2001). We know some things: Parent-adolescent relationships in retrospect and
prospect. Journal of Research on Adolescence, 11, 1–19.
Steinberg, L., Dornbusch, S. M., & Brown, B. B. (1992). Ethnic differences in adolescent
achievement: An ecological perspective. American Psychologist, 47, 723–729.
Stewart, S.M., & Bond, M.H. (2002). A critical look at parenting research from the
mainstream: Problems uncovered while adapting western research to non-western
cultures. British Journal of Developmental Psychology, 20,379–392.
Sufian, N. (2004). Introduction in personality and counseling, Taez: Faculty of education.
Super, C. M., & Harkness, S. (1986). The developmental niche: A conceptualization at the
interface of child and culture. International Journal of Behavioural Development, 9, 545–
569.
Tamis-Lemonda, C. S., Way, N., Hughes, D., Yoshikawa, H., Kalman, R. K., & Niwa, E.Y.
(2008). Parents’ goals for children: The dynamic coexistence of individualism and
collectivism in cultures and individuals. Social Development, 17(1), 183–209.
Thorndike, E. L. (1920). Intelligence and its uses. Harper’s Magazine, 140, 227 – 235.
Tigist, M. T. (2013).The relationship between parenting style, self-regulated learning, and
academic achievement in selected primary schools in Ethiopia. Unpublished Doctoral
Dissertation. University of South Africa.
Tinto, V. (1996). Reconstruction the first year of college. Planning for Higher Education,
25(1), 1-6.
Tinto, V. (2000).Learning better together: The impact of learning communities on student
success in higher education. Journal of Institutional Research, 9 (1), 48-53.
Wang, Q., & Zhang, Q. (2015). An investigation of psychological adjustment differences
among Chinese college students: From the perspectives of their gender, major, and grade.
Psychology, 6, 2119-2124. Available online at http://dx.doi.org/10.4236/psych..616208.
Wangeri, T., Kimani, E., & Mutweleli, S. M. (2012). Transitional challenges facing university
first year students in Kenyan public universities: A case of Kenyatta University.
Interdisciplinary Review of Economics and Management, 2(1).
158
Whittaker, K. A., & Cornthwaite, S. (2000). Benefits for all: Outcomes from a positive
parenting evaluation study. Clinical Effectiveness in Nursing, 4, 189–197.
Winsler, A., Madigan A.L., & Aquillino, S.A. (2005). Correspondence between maternal and
paternal parenting styles in early childhood. Early Child Research, 20, 1–12.
Wintre, M.G., & Yaffe, M. (2000). First year students’ adjustment to university life as a
function of relationships with parents. Journal of Adolescent Research, 15, 9-37.
Yalew, E. (2003). Causes of students’ attrition in Bahir Dar University: Qualitative and
quantitative analyses. The Ethiopian Journal of Education, 23(1), 31-66.
Yamane, T. (1967). Statistics: An Introductory Analysis, 2nd Ed., New York: Harper and Row.
Yekoyealem, D. (2005). The relationship between parenting style and identity status of
secondary and preparatory school adolescents at Debre Berhan Town. Unpublished
Master’s Thesis, Addis Ababa University, Addis Ababa, Ethiopia.
Yelkikalan, N., Hacioglu, G., Kiray, A., Ezilmez, B., Soylemezoglu, E., Cetin, H., Sonmez,
R., & Ozturk, S. (2012). Emotional intelligence characteristics of students studying at
various faculties and colleges of universities. Journal of European Scientific, 8(8),33-50.
Yip, J., & Martin, R. (2006). Sense of homer, emotional intelligence, and social competence.
Journal of Research in Personality, 40 (6), 1202-1208.
Yusuf, O, A. (1998). Gender sensitive counseling: A hand book for Ethiopian Counselors.
Addis Ababa: Addis Ababa University Press.
159
Addendum A: Questionnaire
DEBRE BIRHAN UNIVERSITY
COLLEGE OF SOCIAL SCIENCE AND HUMANITIES
PSYCHOLOGY DEPARTMENT
Questionnaire to be filled-in by First Year University Students
Dear participant!
Your honest and active participation in this research is greatly appreciated. I am conducting a
Doctoral Dissertation research regarding the relationship between parenting style, Trait
Emotional Intelligence (TEI), and adjustment at university among first year university
students. To do this, I am conducting a survey among first year university students using
questionnaires developed for this purpose. I would appreciate your assistance with the study a
great deal. Findings of this research are believed to be useful to improve the parenting
practices that have been employed in Ethiopia, and for designing intervention strategies and
techniques for higher education institutions to better understand and assist first year students in
their adjustment to a university life.
Therefore, the information and responses that will be obtained from you are very important for
this research to meet its prime objective. The study can be successfully accomplished only
when you complete all the items honestly, frankly and genuinely. I, therefore, kindly request
you to provide genuine and accurate information for all items found in the 8 pages. Please,
note that the information you provide will be kept strictly confidential and will be used only
for the purpose of this study. Moreover, there is no need of writing your name in any parts of
the questionnaire.
Thank you in advance!

160
Part I: Background Information (BGI)
Instruction: This part seeks your background information. Please put a tick mark (
) in the box for multiple choice items and write your response for other items.
1. Gender Male Female
2. Age
3. Field of study
4. Where do your parents live-in? Rural Urban others(specify)
5. Your families’/family estimated monthly income in birr:
Less than1000 1001-2000 2001-3000 3001-4000
4001-5000 5001-6000 6001-7000 7001-8000 8001-9000 9001-10,000 10,000 and above
Others (specify)
6. Your father’s level of education:
No formal education Primary School Junior School Secondary School
Diploma First Degree Master PhD & above
Others (specify)
7. Your mother’s level of education:
No formal education Primary School Junior School Secondary school
Diploma First Degree Master PhD &above others (specify)
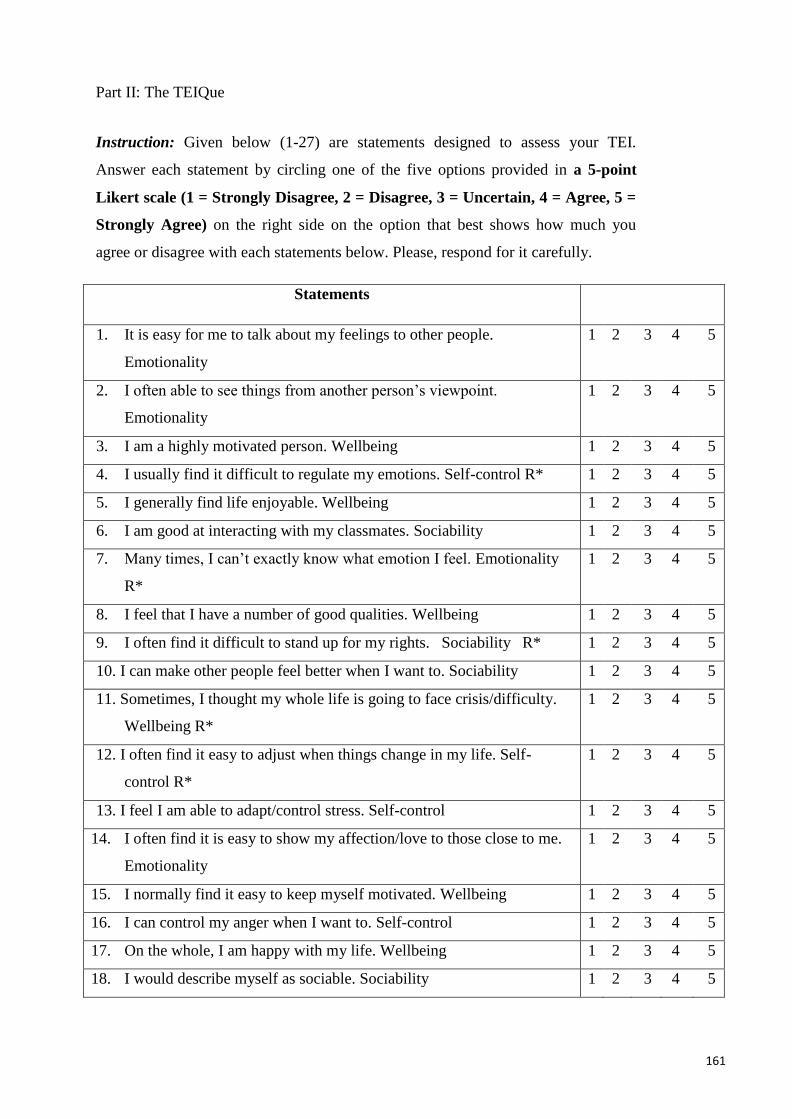
161
Part II: The TEIQue
Instruction: Given below (1-27) are statements designed to assess your TEI.
Answer each statement by circling one of the five options provided in a 5-point
Likert scale (1 = Strongly Disagree, 2 = Disagree, 3 = Uncertain, 4 = Agree, 5 =
Strongly Agree) on the right side on the option that best shows how much you
agree or disagree with each statements below. Please, respond for it carefully.
Statements
1. It is easy for me to talk about my feelings to other people.
Emotionality
1 2 3 4 5
2. I often able to see things from another person’s viewpoint.
Emotionality
1 2 3 4 5
3. I am a highly motivated person. Wellbeing 1 2 3 4 5
4. I usually find it difficult to regulate my emotions. Self-control R* 1 2 3 4 5
5. I generally find life enjoyable. Wellbeing 1 2 3 4 5
6. I am good at interacting with my classmates. Sociability 1 2 3 4 5
7. Many times, I can’t exactly know what emotion I feel. Emotionality
R*
1 2 3 4 5
8. I feel that I have a number of good qualities. Wellbeing 1 2 3 4 5
9. I often find it difficult to stand up for my rights. Sociability R* 1 2 3 4 5
10. I can make other people feel better when I want to. Sociability 1 2 3 4 5
11. Sometimes, I thought my whole life is going to face crisis/difficulty.
Wellbeing R*
1 2 3 4 5
12. I often find it easy to adjust when things change in my life. Self-
control R*
1 2 3 4 5
13. I feel I am able to adapt/control stress. Self-control 1 2 3 4 5
14. I often find it is easy to show my affection/love to those close to me.
Emotionality
1 2 3 4 5
15. I normally find it easy to keep myself motivated. Wellbeing 1 2 3 4 5
16. I can control my anger when I want to. Self-control 1 2 3 4 5
17. On the whole, I am happy with my life. Wellbeing 1 2 3 4 5
18. I would describe myself as sociable. Sociability 1 2 3 4 5
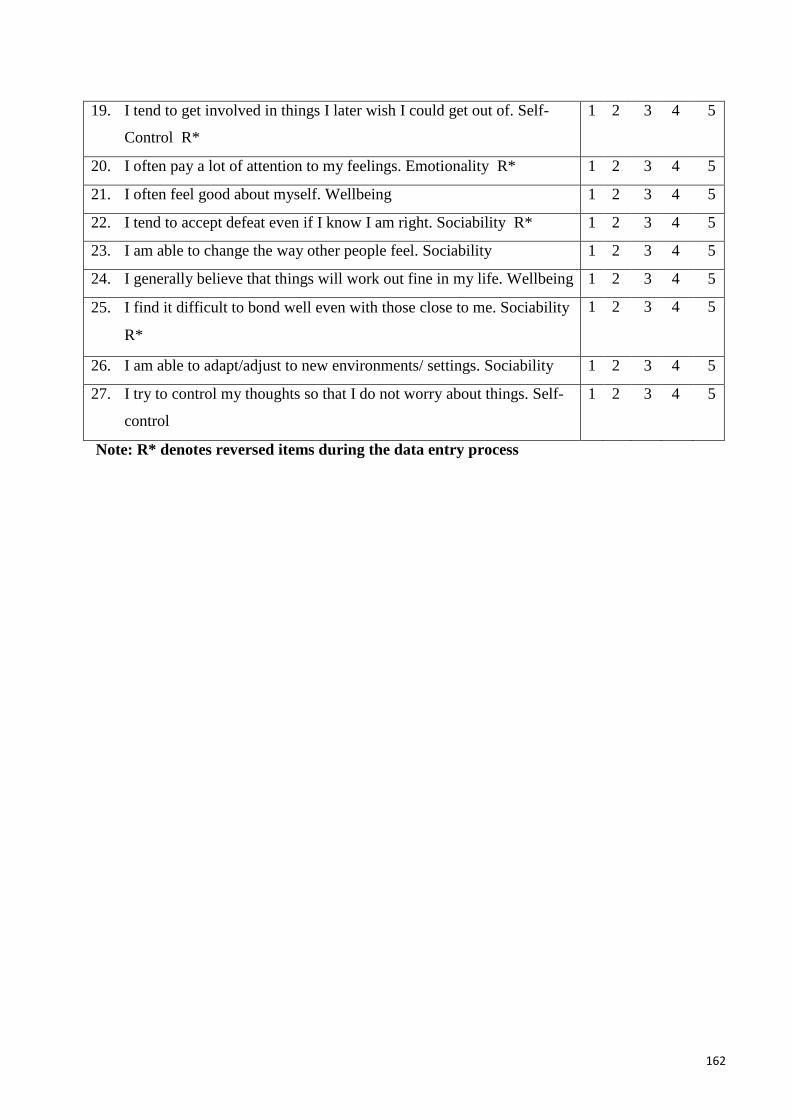
162
19. I tend to get involved in things I later wish I could get out of. Self-
Control R*
1 2 3 4 5
20. I often pay a lot of attention to my feelings. Emotionality R* 1 2 3 4 5
21. I often feel good about myself. Wellbeing 1 2 3 4 5
22. I tend to accept defeat even if I know I am right. Sociability R* 1 2 3 4 5
23. I am able to change the way other people feel. Sociability 1 2 3 4 5
24. I generally believe that things will work out fine in my life. Wellbeing 1 2 3 4 5
25. I find it difficult to bond well even with those close to me. Sociability
R*
1 2 3 4 5
26. I am able to adapt/adjust to new environments/ settings. Sociability 1 2 3 4 5
27. I try to control my thoughts so that I do not worry about things. Self-
control
1 2 3 4 5
Note: R* denotes reversed items during the data entry process
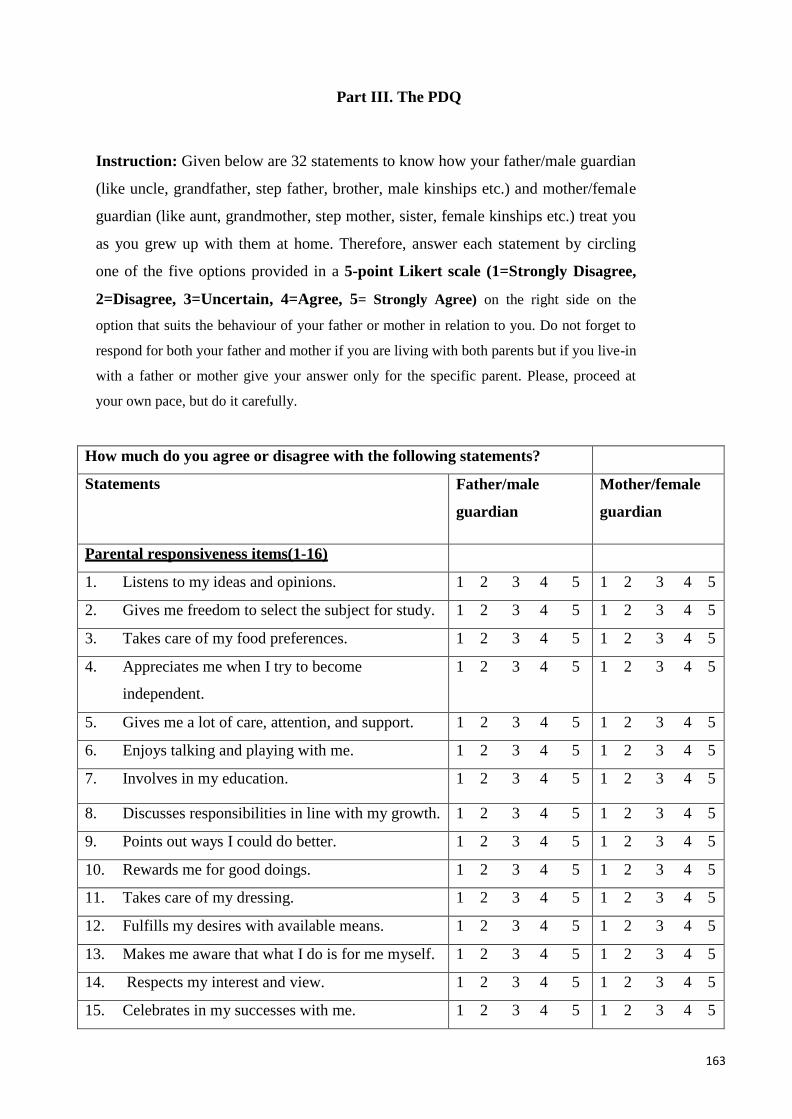
163
Part III. The PDQ
Instruction: Given below are 32 statements to know how your father/male guardian
(like uncle, grandfather, step father, brother, male kinships etc.) and mother/female
guardian (like aunt, grandmother, step mother, sister, female kinships etc.) treat you
as you grew up with them at home. Therefore, answer each statement by circling
one of the five options provided in a 5-point Likert scale (1=Strongly Disagree,
2=Disagree, 3=Uncertain, 4=Agree, 5= Strongly Agree) on the right side on the
option that suits the behaviour of your father or mother in relation to you. Do not forget to
respond for both your father and mother if you are living with both parents but if you live-in
with a father or mother give your answer only for the specific parent. Please, proceed at
your own pace, but do it carefully.
How much do you agree or disagree with the following statements?
Statements Father/male
guardian
Mother/female
guardian
Parental responsiveness items(1-16)
1. Listens to my ideas and opinions. 1 2 3 4 5 1 2 3 4 5
2. Gives me freedom to select the subject for study. 1 2 3 4 5 1 2 3 4 5
3. Takes care of my food preferences. 1 2 3 4 5 1 2 3 4 5
4. Appreciates me when I try to become
independent.
1 2 3 4 5 1 2 3 4 5
5. Gives me a lot of care, attention, and support. 1 2 3 4 5 1 2 3 4 5
6. Enjoys talking and playing with me. 1 2 3 4 5 1 2 3 4 5
7. Involves in my education. 1 2 3 4 5 1 2 3 4 5
8. Discusses responsibilities in line with my growth. 1 2 3 4 5 1 2 3 4 5
9. Points out ways I could do better. 1 2 3 4 5 1 2 3 4 5
10. Rewards me for good doings. 1 2 3 4 5 1 2 3 4 5
11. Takes care of my dressing. 1 2 3 4 5 1 2 3 4 5
12. Fulfills my desires with available means. 1 2 3 4 5 1 2 3 4 5
13. Makes me aware that what I do is for me myself. 1 2 3 4 5 1 2 3 4 5
14. Respects my interest and view. 1 2 3 4 5 1 2 3 4 5
15. Celebrates in my successes with me. 1 2 3 4 5 1 2 3 4 5
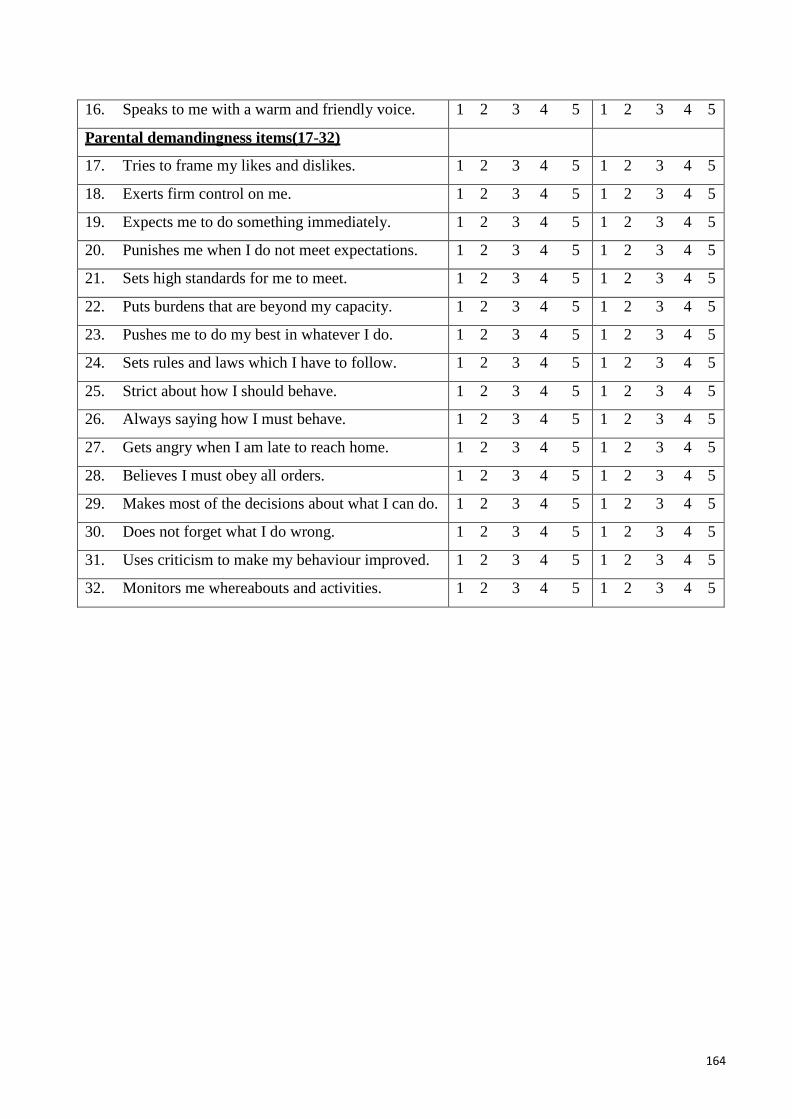
164
16. Speaks to me with a warm and friendly voice. 1 2 3 4 5 1 2 3 4 5
Parental demandingness items(17-32)
17. Tries to frame my likes and dislikes. 1 2 3 4 5 1 2 3 4 5
18. Exerts firm control on me. 1 2 3 4 5 1 2 3 4 5
19. Expects me to do something immediately. 1 2 3 4 5 1 2 3 4 5
20. Punishes me when I do not meet expectations. 1 2 3 4 5 1 2 3 4 5
21. Sets high standards for me to meet. 1 2 3 4 5 1 2 3 4 5
22. Puts burdens that are beyond my capacity. 1 2 3 4 5 1 2 3 4 5
23. Pushes me to do my best in whatever I do. 1 2 3 4 5 1 2 3 4 5
24. Sets rules and laws which I have to follow. 1 2 3 4 5 1 2 3 4 5
25. Strict about how I should behave. 1 2 3 4 5 1 2 3 4 5
26. Always saying how I must behave. 1 2 3 4 5 1 2 3 4 5
27. Gets angry when I am late to reach home. 1 2 3 4 5 1 2 3 4 5
28. Believes I must obey all orders. 1 2 3 4 5 1 2 3 4 5
29. Makes most of the decisions about what I can do. 1 2 3 4 5 1 2 3 4 5
30. Does not forget what I do wrong. 1 2 3 4 5 1 2 3 4 5
31. Uses criticism to make my behaviour improved. 1 2 3 4 5 1 2 3 4 5
32. Monitors me whereabouts and activities. 1 2 3 4 5 1 2 3 4 5
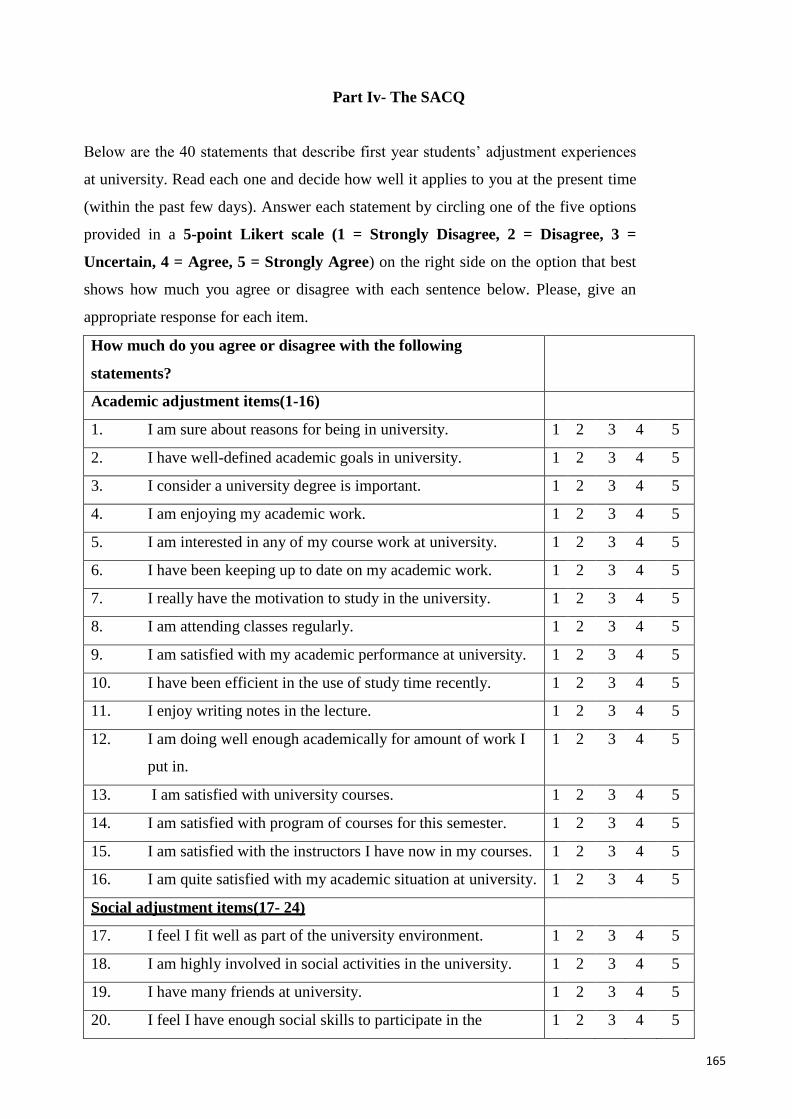
165
Part Iv- The SACQ
Below are the 40 statements that describe first year students’ adjustment experiences
at university. Read each one and decide how well it applies to you at the present time
(within the past few days). Answer each statement by circling one of the five options
provided in a 5-point Likert scale (1 = Strongly Disagree, 2 = Disagree, 3 =
Uncertain, 4 = Agree, 5 = Strongly Agree) on the right side on the option that best
shows how much you agree or disagree with each sentence below. Please, give an
appropriate response for each item.
How much do you agree or disagree with the following
statements?
Academic adjustment items(1-16)
1. I am sure about reasons for being in university. 1 2 3 4 5
2. I have well-defined academic goals in university. 1 2 3 4 5
3. I consider a university degree is important. 1 2 3 4 5
4. I am enjoying my academic work. 1 2 3 4 5
5. I am interested in any of my course work at university. 1 2 3 4 5
6. I have been keeping up to date on my academic work. 1 2 3 4 5
7. I really have the motivation to study in the university. 1 2 3 4 5
8. I am attending classes regularly. 1 2 3 4 5
9. I am satisfied with my academic performance at university. 1 2 3 4 5
10. I have been efficient in the use of study time recently. 1 2 3 4 5
11. I enjoy writing notes in the lecture. 1 2 3 4 5
12. I am doing well enough academically for amount of work I
put in.
1 2 3 4 5
13. I am satisfied with university courses. 1 2 3 4 5
14. I am satisfied with program of courses for this semester. 1 2 3 4 5
15. I am satisfied with the instructors I have now in my courses. 1 2 3 4 5
16. I am quite satisfied with my academic situation at university. 1 2 3 4 5
Social adjustment items(17- 24)
17. I feel I fit well as part of the university environment. 1 2 3 4 5
18. I am highly involved in social activities in the university. 1 2 3 4 5
19. I have many friends at university. 1 2 3 4 5
20. I feel I have enough social skills to participate in the 1 2 3 4 5
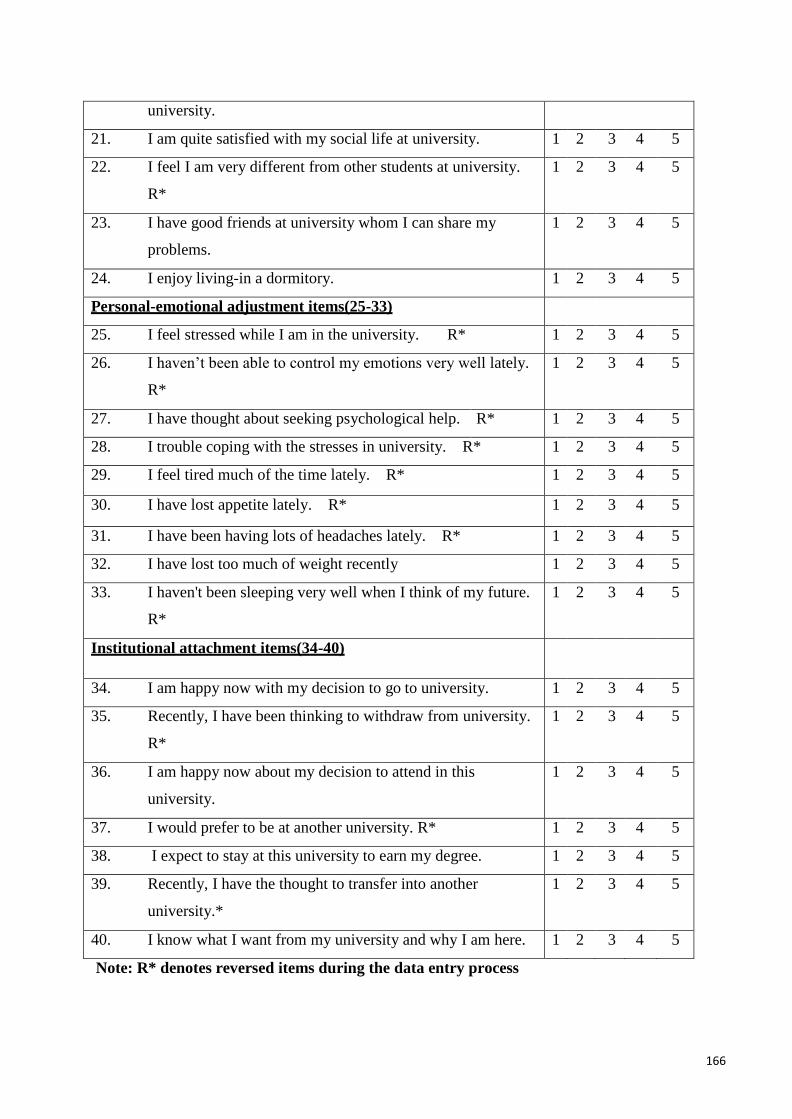
166
university.
21. I am quite satisfied with my social life at university. 1 2 3 4 5
22. I feel I am very different from other students at university.
R*
1 2 3 4 5
23. I have good friends at university whom I can share my
problems.
1 2 3 4 5
24. I enjoy living-in a dormitory. 1 2 3 4 5
Personal-emotional adjustment items(25-33)
25. I feel stressed while I am in the university. R* 1 2 3 4 5
26. I haven’t been able to control my emotions very well lately.
R*
1 2 3 4 5
27. I have thought about seeking psychological help. R* 1 2 3 4 5
28. I trouble coping with the stresses in university. R* 1 2 3 4 5
29. I feel tired much of the time lately. R* 1 2 3 4 5
30. I have lost appetite lately. R* 1 2 3 4 5
31. I have been having lots of headaches lately. R* 1 2 3 4 5
32. I have lost too much of weight recently 1 2 3 4 5
33. I haven't been sleeping very well when I think of my future.
R*
1 2 3 4 5
Institutional attachment items(34-40)
34. I am happy now with my decision to go to university. 1 2 3 4 5
35. Recently, I have been thinking to withdraw from university.
R*
1 2 3 4 5
36. I am happy now about my decision to attend in this
university.
1 2 3 4 5
37. I would prefer to be at another university. R* 1 2 3 4 5
38. I expect to stay at this university to earn my degree. 1 2 3 4 5
39. Recently, I have the thought to transfer into another
university.*
1 2 3 4 5
40. I know what I want from my university and why I am here. 1 2 3 4 5
Note: R* denotes reversed items during the data entry process
167
Addendum B: Information Letter to the Vice President
Dear Madam/Sir.
My name is Tarekegn Desalegn Fenta and I am undertaking a doctoral dissertation
research regarding the relationship between parenting style, trait emotional
intelligence, and adjustment to university among first year university students. To
do this, I am conducting a survey among first year university students; using
questionnaires developed for this purpose. I would appreciate your assistance with
the study a great deal. Findings of this research are believed to be useful to improve
the parenting practices being employed in Ethiopia, and for designing intervention
strategies and techniques for higher education institutions to better understand and
assist first year students in their overall adjustment to university life. This should
enable university students to be effective and successful in their higher education in
particular and in their future life in general.
The questionnaire will be administered by me and data collectors, and will take
approximately 40-45 minutes. Participation in this study is completely voluntary
and they are free to withdraw at any time, without providing any reasons for doing
so and this will not affect them in any way. Your university and the participants in
this study will be randomly selected. All information disclosed by the participants
will be kept confidential. Since participants will not need to write their names in any
parts of the questionnaire, their names will not appear on any publications and their
total anonymity will be guaranteed. Upon completion, the results of the study will
be discussed with you if there is a request.
If you are happy to allow permission to undertake the research in your university
and your first year students, please read and sign the attached consent form.
Tarekegn Desalegn
Kind regards

168
Addendum C: Vice President Consent Form
I, in my capacity as vice president of the university of
, have read the Subject Information Sheet and give
my consent for first year university students to participate in the research study to be
undertaken by Tarekegn Desalegn. I give permission for the students concerned and
I agree that access to academic and personal information about the students
concerned are allowed to Tarekegn Desalegn for the purposes of this research. I
understand that total confidentiality is guaranteed and that they may withdraw from
this study at any time without providing reasons for doing so and that this decision
will not be treated negatively. I agree that feedback will only be given for us on a
request at anytime.
Date:
Vice president:
169
Addendum D: Information Letter to Participants of the Study
Dear Participant,
My name is Tarekegn Desalegn and I am undertaking a Doctoral Dissertation
research regarding the relationship between parenting style, trait emotional
intelligence, and adjustment to university life among first year university students.
To do this, I am conducting a survey among first year university students; using
questionnaires developed for this purpose. I would appreciate your assistance with
the study a great deal. Findings of this research are believed to be useful to improve
the parenting practices being employed in Ethiopia, and for designing intervention
strategies and techniques for higher education institutions to better understand and
assist first year students in their overall adjustment to university life. This should
enable university students to be effective and successful in their higher education in
particular and in their future life in general.
The questionnaire will be administered by me and data collectors, and will take
approximately 40-45 minutes. Participation in this study is completely voluntary
and you are free to withdraw at any time, without providing any reasons for doing
so and this will not affect you in any way. Your university and your participation in
this study were randomly selected. All information disclosed by you as a participant
will be kept confidential. Since you will not need to write your name in any parts of
the questionnaire, your name will not appear on any publications and your total
anonymity will be guaranteed. Upon completion, the results of the study will be
discussed with you if there is a request.
If you are happy to take part in the research in your university, please read and sign
the attached consent form.
Thank you in advance for your
assistance! Tarekegn Desalegn
170
Addendum E: Student Consent Form
I understand that this confidential study involves research for a Doctoral
Dissertation conducted by Tarekegn Desalegn at the University of UNISA.
I understand that my participation in this study is completely voluntary and that I
may refuse to participate or withdraw my consent to participate at any time without
providing reasons for doing so and that there will be no
repercussions/consequences. I understand that my identity and responses on the
questionnaires will be kept in strict confidence. Also, I understand that this survey
will take approximately 40-45 minutes to complete. I am 18 years of age or older
and voluntarily agree to participate in this research project.
I, read the information letter and therefore, I agree------------- do not agree-----------to
allow a researcher (Mr. Tarekegn Desalegn Fenta) to conduct Doctoral research on
“Parenting Style and First Year Students’ Adjustment at University:
Mediation via Trait Emotional Intelligence in Higher Education Institutions- A
Dimensional and Typological Approach. Date:
Student

171
Addendum F: Letters of Cooperation to the Three Public universities
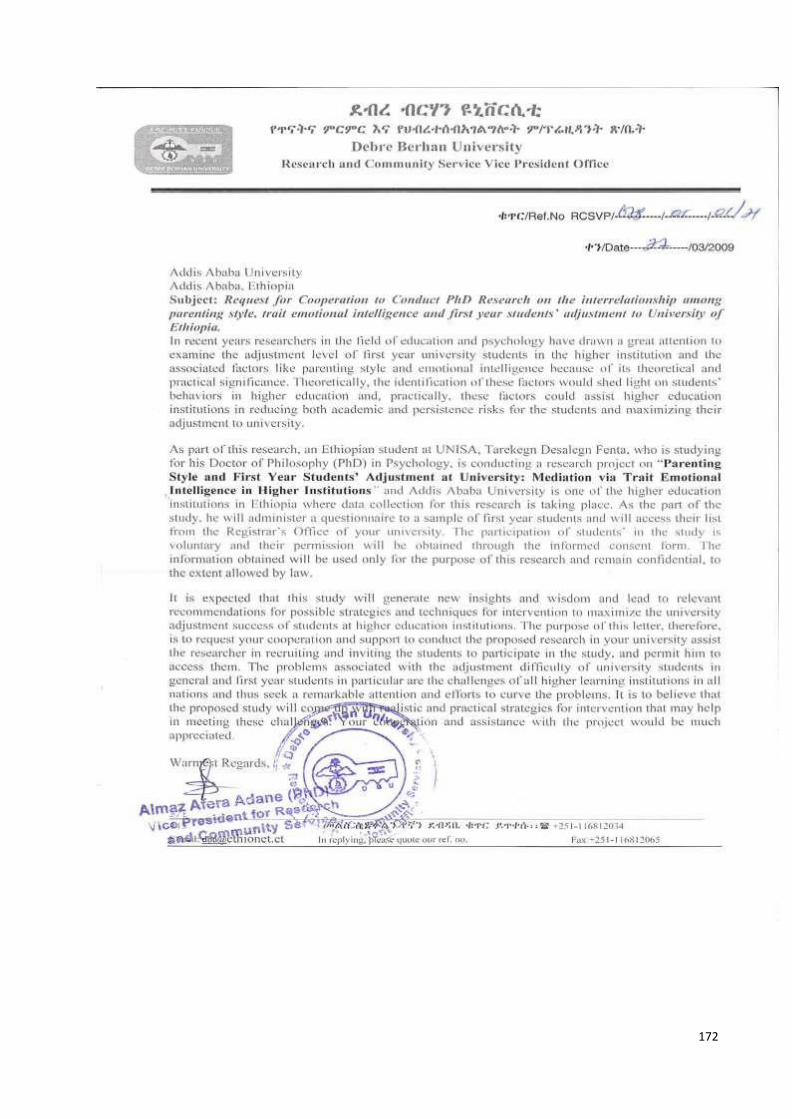
172
173
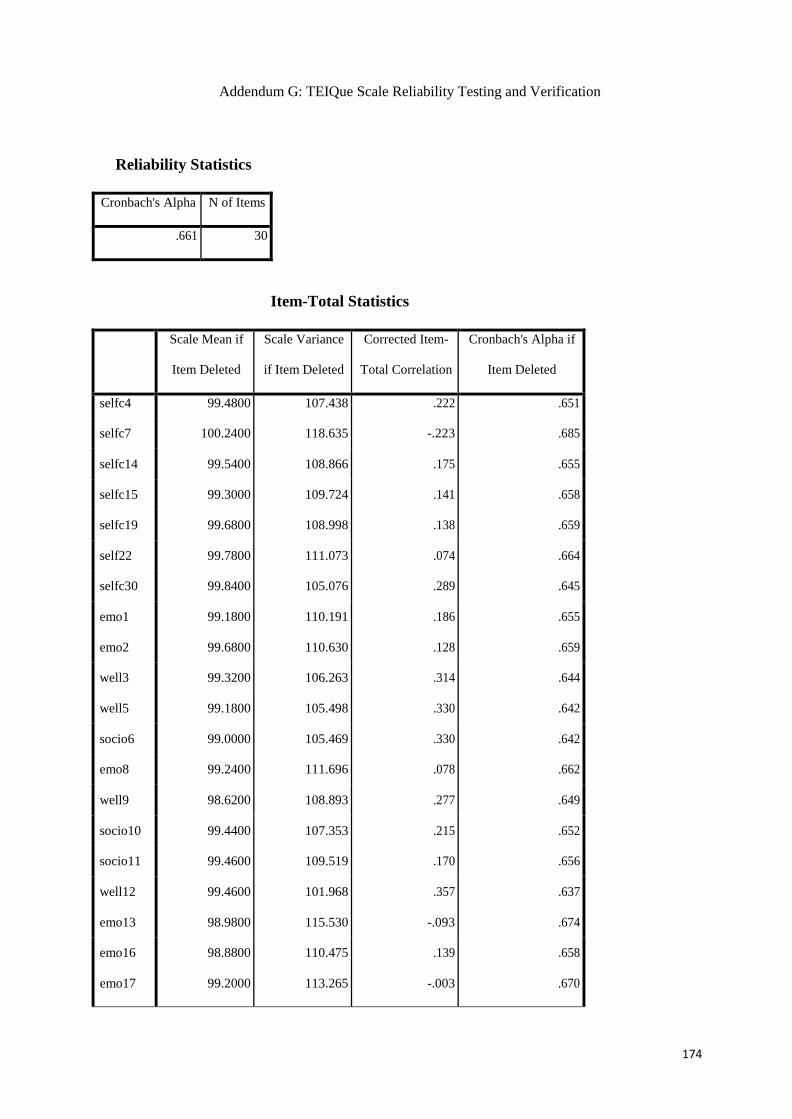
174
Addendum G: TEIQue Scale Reliability Testing and Verification
Reliability Statistics
Cronbach's Alpha N of Items
.661 30
Item-Total Statistics
Scale Mean if
Item Deleted
Scale Variance
if Item Deleted
Corrected Item-
Total Correlation
Cronbach's Alpha if
Item Deleted
selfc4 99.4800 107.438 .222 .651
selfc7 100.2400 118.635 -.223 .685
selfc14 99.5400 108.866 .175 .655
selfc15 99.3000 109.724 .141 .658
selfc19 99.6800 108.998 .138 .659
self22 99.7800 111.073 .074 .664
selfc30 99.8400 105.076 .289 .645
emo1 99.1800 110.191 .186 .655
emo2 99.6800 110.630 .128 .659
well3 99.3200 106.263 .314 .644
well5 99.1800 105.498 .330 .642
socio6 99.0000 105.469 .330 .642
emo8 99.2400 111.696 .078 .662
well9 98.6200 108.893 .277 .649
socio10 99.4400 107.353 .215 .652
socio11 99.4600 109.519 .170 .656
well12 99.4600 101.968 .357 .637
emo13 98.9800 115.530 -.093 .674
emo16 98.8800 110.475 .139 .658
emo17 99.2000 113.265 -.003 .670
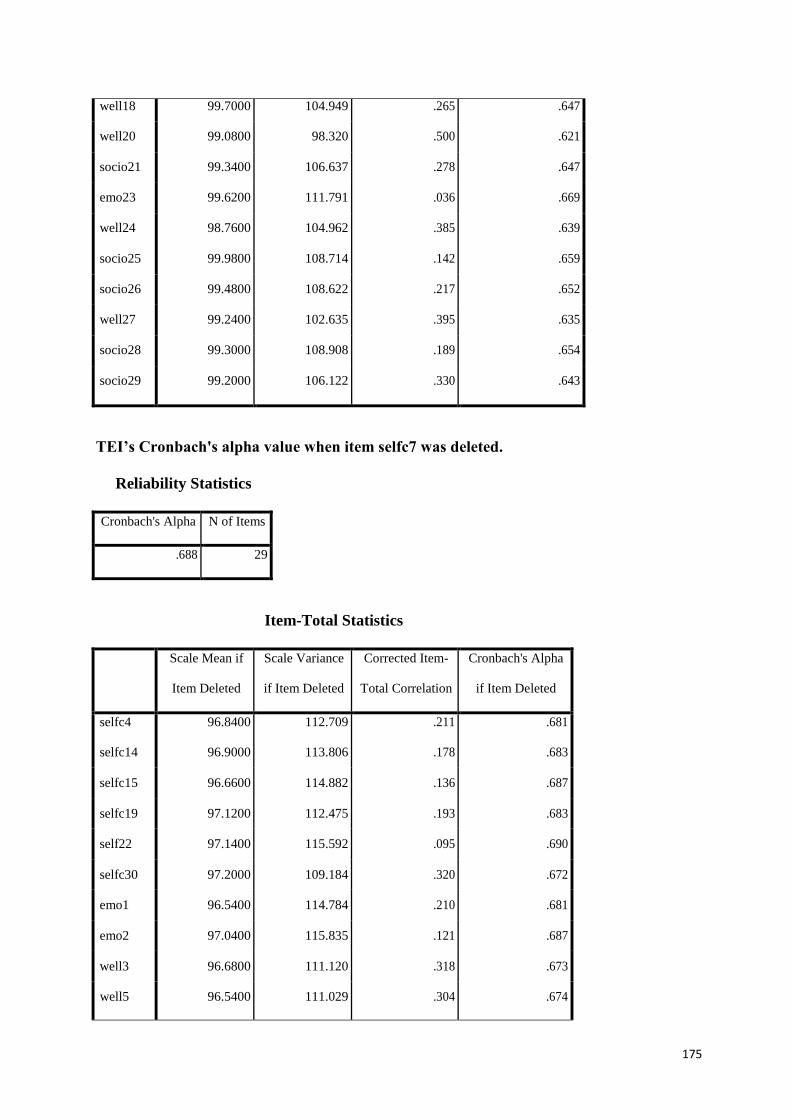
175
well18 99.7000 104.949 .265 .647
well20 99.0800 98.320 .500 .621
socio21 99.3400 106.637 .278 .647
emo23 99.6200 111.791 .036 .669
well24 98.7600 104.962 .385 .639
socio25 99.9800 108.714 .142 .659
socio26 99.4800 108.622 .217 .652
well27 99.2400 102.635 .395 .635
socio28 99.3000 108.908 .189 .654
socio29 99.2000 106.122 .330 .643
TEI’s Cronbach's alpha value when item selfc7 was deleted.
Reliability Statistics
Cronbach's Alpha N of Items
.688 29
Item-Total Statistics
Scale Mean if
Item Deleted
Scale Variance
if Item Deleted
Corrected Item-
Total Correlation
Cronbach's Alpha
if Item Deleted
selfc4 96.8400 112.709 .211 .681
selfc14 96.9000 113.806 .178 .683
selfc15 96.6600 114.882 .136 .687
selfc19 97.1200 112.475 .193 .683
self22 97.1400 115.592 .095 .690
selfc30 97.2000 109.184 .320 .672
emo1 96.5400 114.784 .210 .681
emo2 97.0400 115.835 .121 .687
well3 96.6800 111.120 .318 .673
well5 96.5400 111.029 .304 .674
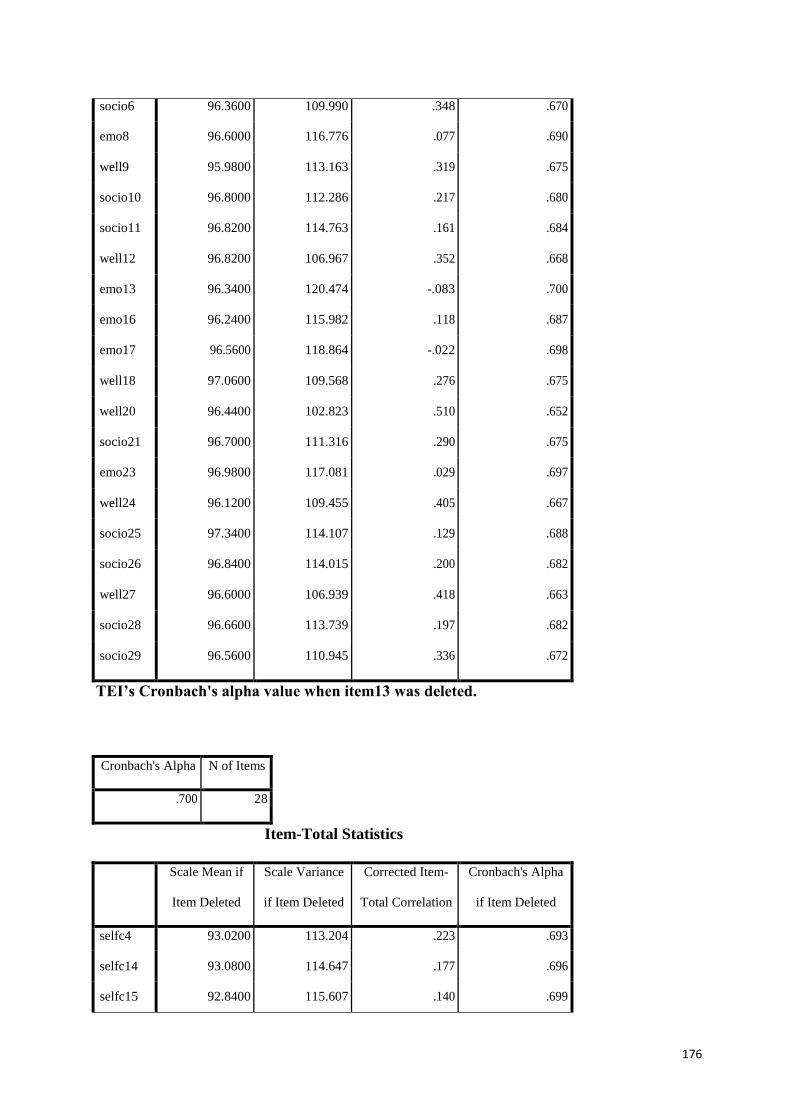
176
socio6 96.3600 109.990 .348 .670
emo8 96.6000 116.776 .077 .690
well9 95.9800 113.163 .319 .675
socio10 96.8000 112.286 .217 .680
socio11 96.8200 114.763 .161 .684
well12 96.8200 106.967 .352 .668
emo13 96.3400 120.474 -.083 .700
emo16 96.2400 115.982 .118 .687
emo17 96.5600 118.864 -.022 .698
well18 97.0600 109.568 .276 .675
well20 96.4400 102.823 .510 .652
socio21 96.7000 111.316 .290 .675
emo23 96.9800 117.081 .029 .697
well24 96.1200 109.455 .405 .667
socio25 97.3400 114.107 .129 .688
socio26 96.8400 114.015 .200 .682
well27 96.6000 106.939 .418 .663
socio28 96.6600 113.739 .197 .682
socio29 96.5600 110.945 .336 .672
TEI’s Cronbach's alpha value when item13 was deleted.
Cronbach's Alpha N of Items
.700 28
Item-Total Statistics
Scale Mean if
Item Deleted
Scale Variance
if Item Deleted
Corrected Item-
Total Correlation
Cronbach's Alpha
if Item Deleted
selfc4 93.0200 113.204 .223 .693
selfc14 93.0800 114.647 .177 .696
selfc15 92.8400 115.607 .140 .699
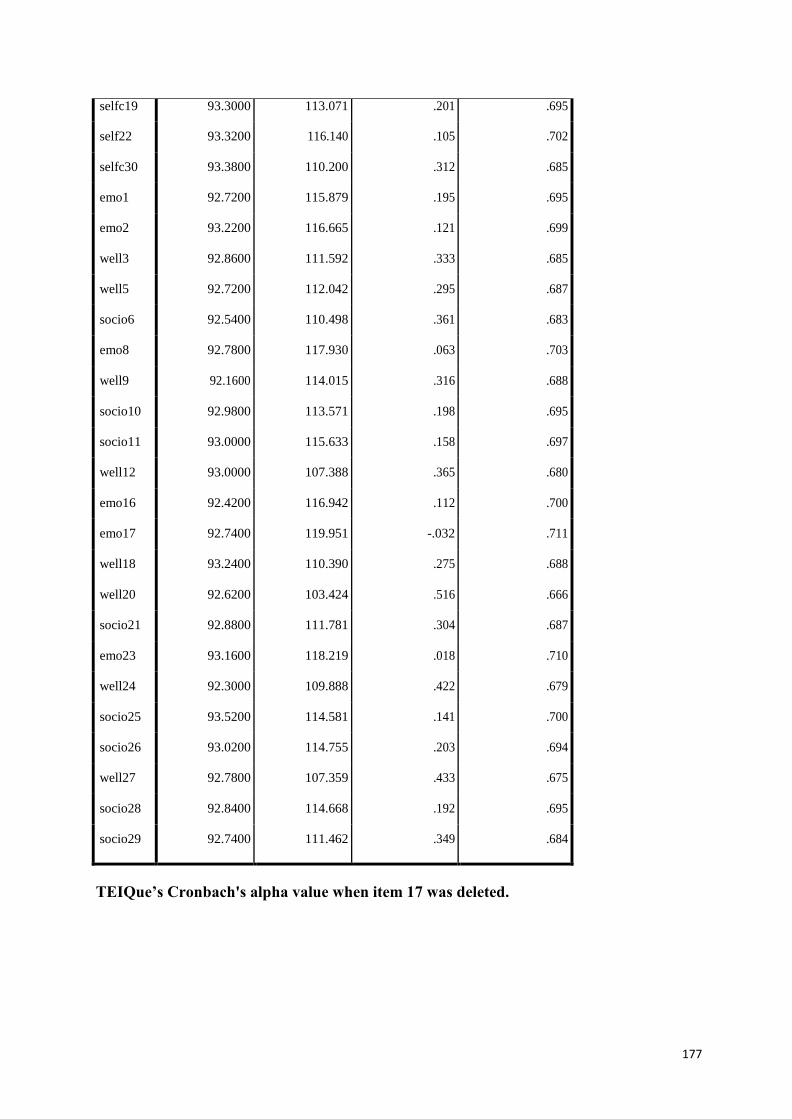
177
selfc19 93.3000 113.071 .201 .695
self22 93.3200 116.140 .105 .702
selfc30 93.3800 110.200 .312 .685
emo1 92.7200 115.879 .195 .695
emo2 93.2200 116.665 .121 .699
well3 92.8600 111.592 .333 .685
well5 92.7200 112.042 .295 .687
socio6 92.5400 110.498 .361 .683
emo8 92.7800 117.930 .063 .703
well9 92.1600 114.015 .316 .688
socio10 92.9800 113.571 .198 .695
socio11 93.0000 115.633 .158 .697
well12 93.0000 107.388 .365 .680
emo16 92.4200 116.942 .112 .700
emo17 92.7400 119.951 -.032 .711
well18 93.2400 110.390 .275 .688
well20 92.6200 103.424 .516 .666
socio21 92.8800 111.781 .304 .687
emo23 93.1600 118.219 .018 .710
well24 92.3000 109.888 .422 .679
socio25 93.5200 114.581 .141 .700
socio26 93.0200 114.755 .203 .694
well27 92.7800 107.359 .433 .675
socio28 92.8400 114.668 .192 .695
socio29 92.7400 111.462 .349 .684
TEIQue’s Cronbach's alpha value when item 17 was deleted.
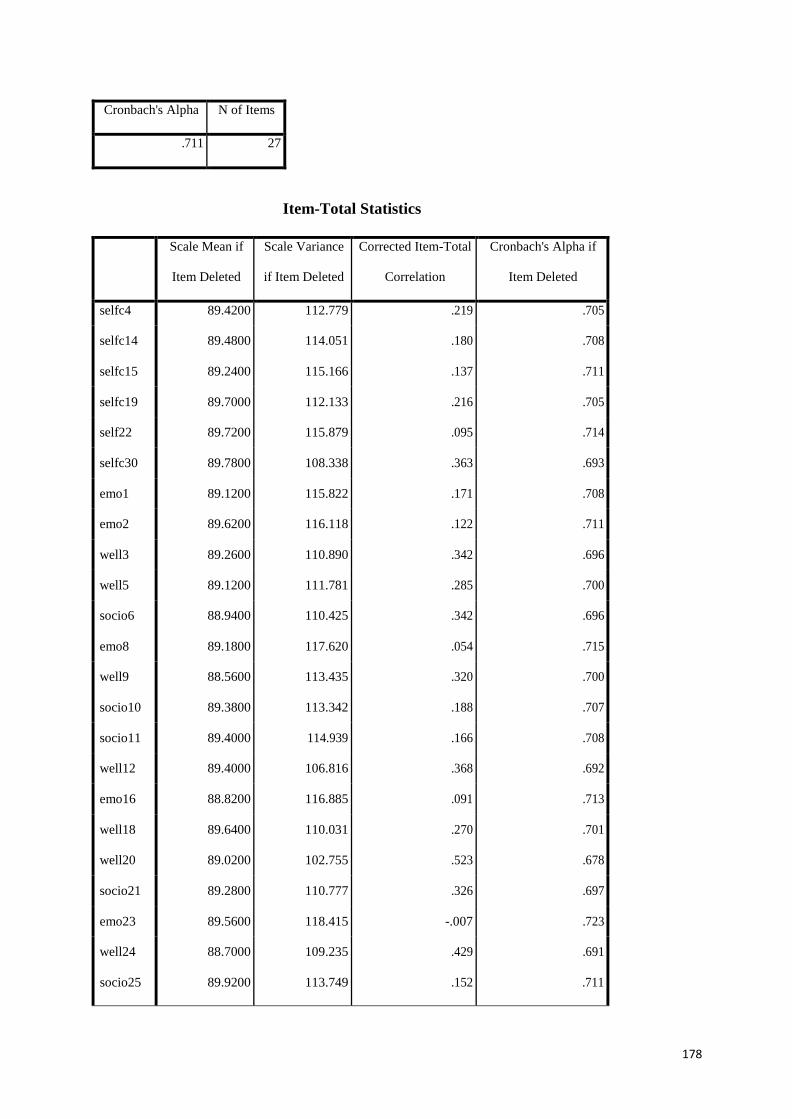
178
Cronbach's Alpha N of Items
.711 27
Item-Total Statistics
Scale Mean if
Item Deleted
Scale Variance
if Item Deleted
Corrected Item-Total
Correlation
Cronbach's Alpha if
Item Deleted
selfc4 89.4200 112.779 .219 .705
selfc14 89.4800 114.051 .180 .708
selfc15 89.2400 115.166 .137 .711
selfc19 89.7000 112.133 .216 .705
self22 89.7200 115.879 .095 .714
selfc30 89.7800 108.338 .363 .693
emo1 89.1200 115.822 .171 .708
emo2 89.6200 116.118 .122 .711
well3 89.2600 110.890 .342 .696
well5 89.1200 111.781 .285 .700
socio6 88.9400 110.425 .342 .696
emo8 89.1800 117.620 .054 .715
well9 88.5600 113.435 .320 .700
socio10 89.3800 113.342 .188 .707
socio11 89.4000 114.939 .166 .708
well12 89.4000 106.816 .368 .692
emo16 88.8200 116.885 .091 .713
well18 89.6400 110.031 .270 .701
well20 89.0200 102.755 .523 .678
socio21 89.2800 110.777 .326 .697
emo23 89.5600 118.415 -.007 .723
well24 88.7000 109.235 .429 .691
socio25 89.9200 113.749 .152 .711
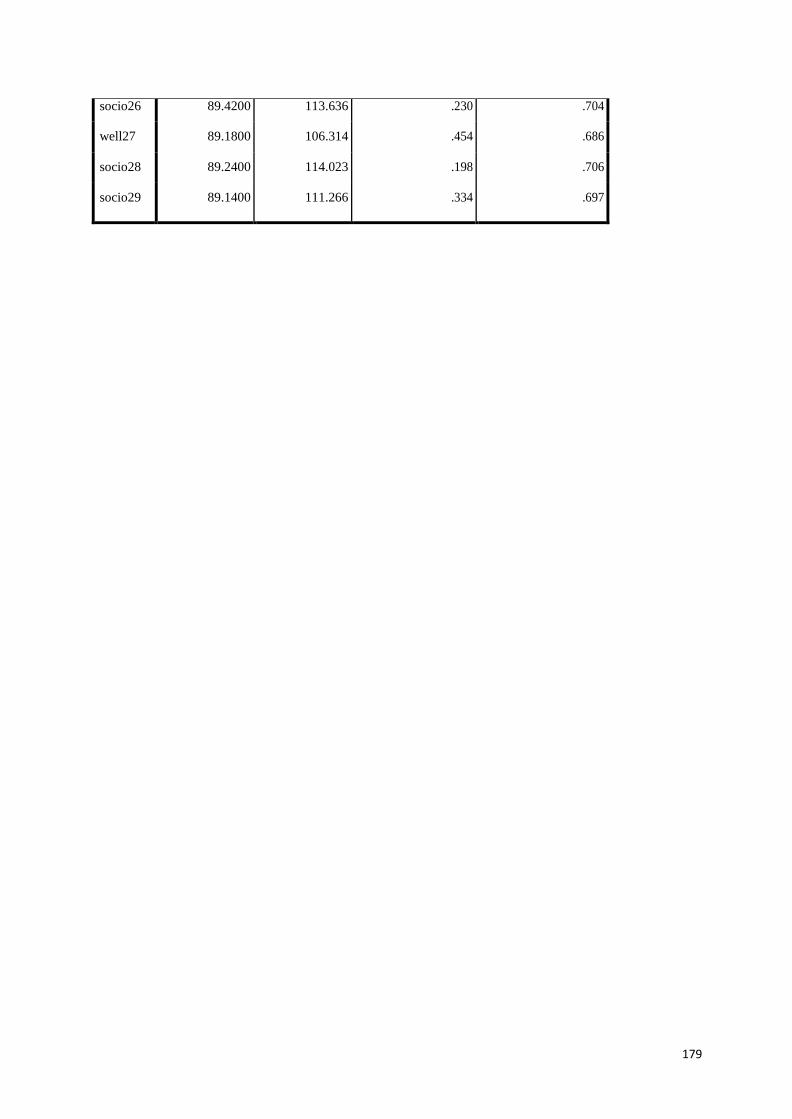
179
socio26 89.4200 113.636 .230 .704
well27 89.1800 106.314 .454 .686
socio28 89.2400 114.023 .198 .706
socio29 89.1400 111.266 .334 .697
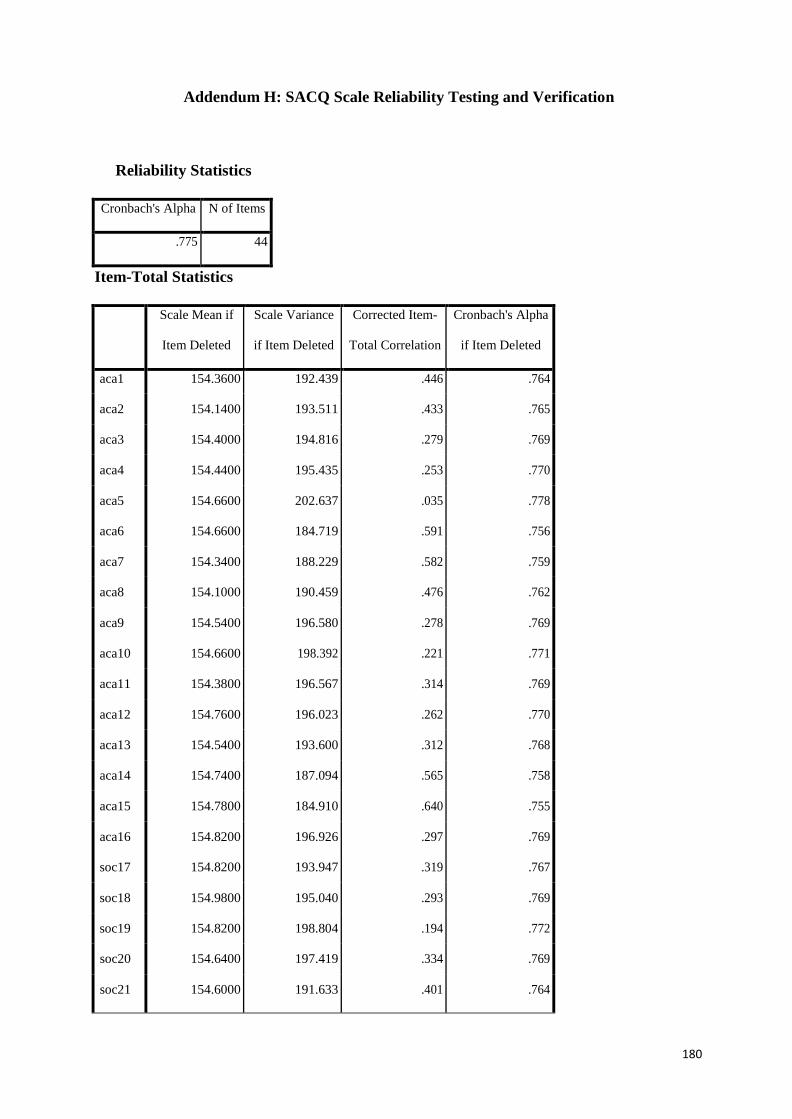
180
Addendum H: SACQ Scale Reliability Testing and Verification
Reliability Statistics
Cronbach's Alpha N of Items
.775 44
Item-Total Statistics
Scale Mean if
Item Deleted
Scale Variance
if Item Deleted
Corrected Item-
Total Correlation
Cronbach's Alpha
if Item Deleted
aca1 154.3600 192.439 .446 .764
aca2 154.1400 193.511 .433 .765
aca3 154.4000 194.816 .279 .769
aca4 154.4400 195.435 .253 .770
aca5 154.6600 202.637 .035 .778
aca6 154.6600 184.719 .591 .756
aca7 154.3400 188.229 .582 .759
aca8 154.1000 190.459 .476 .762
aca9 154.5400 196.580 .278 .769
aca10 154.6600 198.392 .221 .771
aca11 154.3800 196.567 .314 .769
aca12 154.7600 196.023 .262 .770
aca13 154.5400 193.600 .312 .768
aca14 154.7400 187.094 .565 .758
aca15 154.7800 184.910 .640 .755
aca16 154.8200 196.926 .297 .769
soc17 154.8200 193.947 .319 .767
soc18 154.9800 195.040 .293 .769
soc19 154.8200 198.804 .194 .772
soc20 154.6400 197.419 .334 .769
soc21 154.6000 191.633 .401 .764
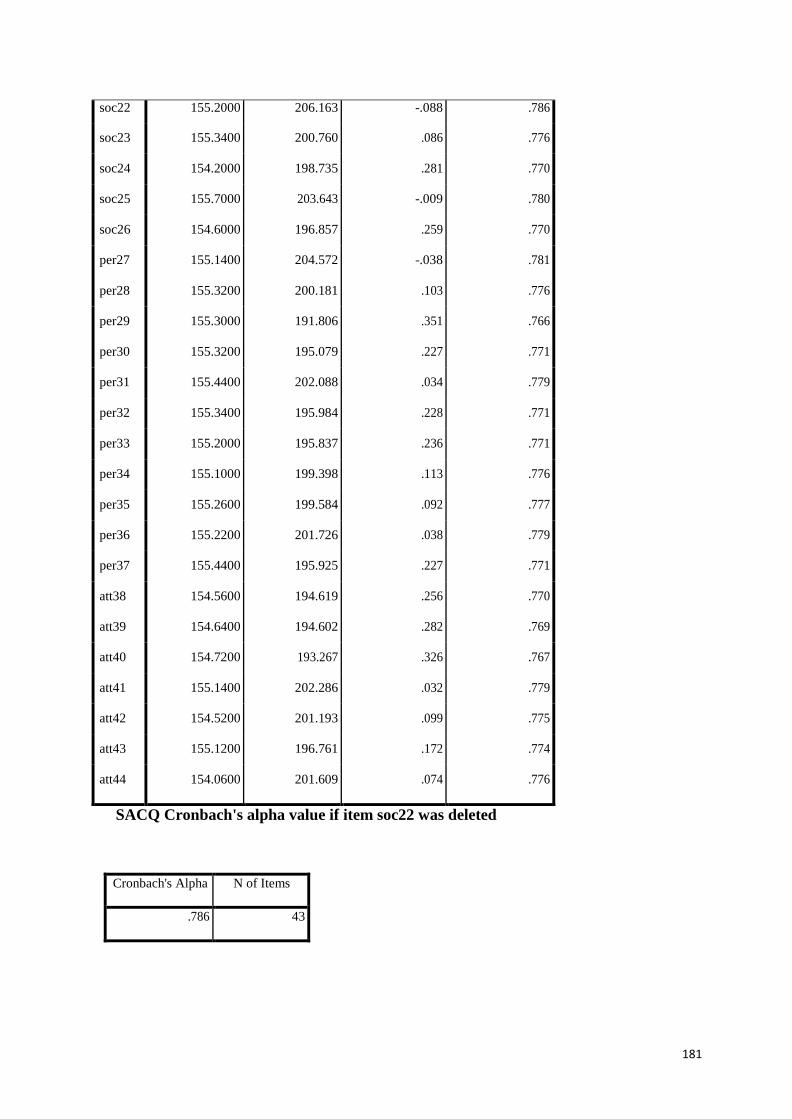
181
soc22 155.2000 206.163 -.088 .786
soc23 155.3400 200.760 .086 .776
soc24 154.2000 198.735 .281 .770
soc25 155.7000 203.643 -.009 .780
soc26 154.6000 196.857 .259 .770
per27 155.1400 204.572 -.038 .781
per28 155.3200 200.181 .103 .776
per29 155.3000 191.806 .351 .766
per30 155.3200 195.079 .227 .771
per31 155.4400 202.088 .034 .779
per32 155.3400 195.984 .228 .771
per33 155.2000 195.837 .236 .771
per34 155.1000 199.398 .113 .776
per35 155.2600 199.584 .092 .777
per36 155.2200 201.726 .038 .779
per37 155.4400 195.925 .227 .771
att38 154.5600 194.619 .256 .770
att39 154.6400 194.602 .282 .769
att40 154.7200 193.267 .326 .767
att41 155.1400 202.286 .032 .779
att42 154.5200 201.193 .099 .775
att43 155.1200 196.761 .172 .774
att44 154.0600 201.609 .074 .776
SACQ Cronbach's alpha value if item soc22 was deleted
Cronbach's Alpha N of Items
.786 43
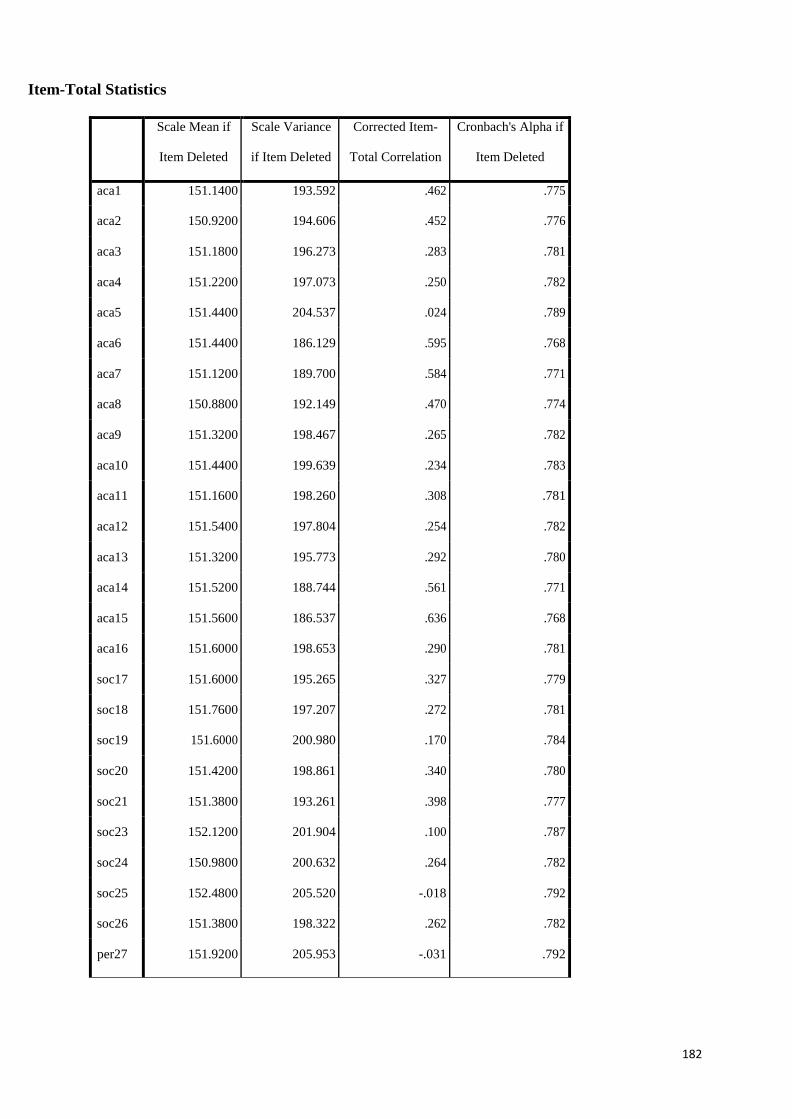
182
Item-Total Statistics
Scale Mean if
Item Deleted
Scale Variance
if Item Deleted
Corrected Item-
Total Correlation
Cronbach's Alpha if
Item Deleted
aca1 151.1400 193.592 .462 .775
aca2 150.9200 194.606 .452 .776
aca3 151.1800 196.273 .283 .781
aca4 151.2200 197.073 .250 .782
aca5 151.4400 204.537 .024 .789
aca6 151.4400 186.129 .595 .768
aca7 151.1200 189.700 .584 .771
aca8 150.8800 192.149 .470 .774
aca9 151.3200 198.467 .265 .782
aca10 151.4400 199.639 .234 .783
aca11 151.1600 198.260 .308 .781
aca12 151.5400 197.804 .254 .782
aca13 151.3200 195.773 .292 .780
aca14 151.5200 188.744 .561 .771
aca15 151.5600 186.537 .636 .768
aca16 151.6000 198.653 .290 .781
soc17 151.6000 195.265 .327 .779
soc18 151.7600 197.207 .272 .781
soc19 151.6000 200.980 .170 .784
soc20 151.4200 198.861 .340 .780
soc21 151.3800 193.261 .398 .777
soc23 152.1200 201.904 .100 .787
soc24 150.9800 200.632 .264 .782
soc25 152.4800 205.520 -.018 .792
soc26 151.3800 198.322 .262 .782
per27 151.9200 205.953 -.031 .792
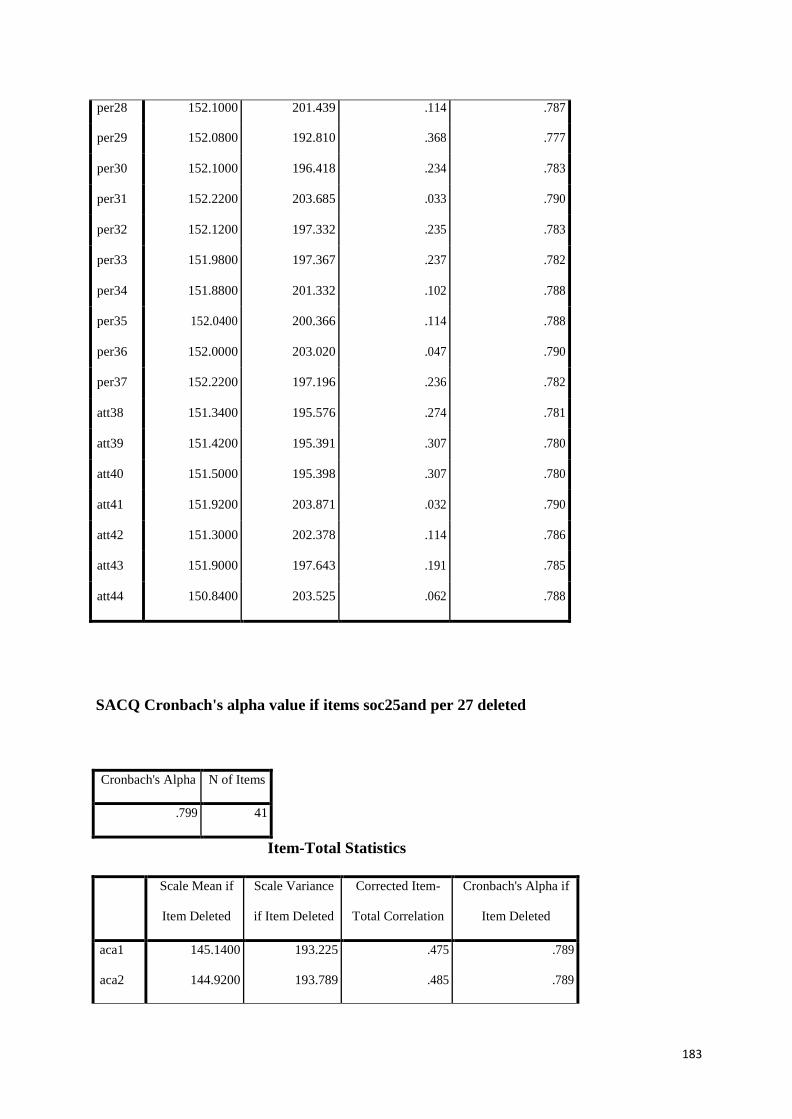
183
per28 152.1000 201.439 .114 .787
per29 152.0800 192.810 .368 .777
per30 152.1000 196.418 .234 .783
per31 152.2200 203.685 .033 .790
per32 152.1200 197.332 .235 .783
per33 151.9800 197.367 .237 .782
per34 151.8800 201.332 .102 .788
per35 152.0400 200.366 .114 .788
per36 152.0000 203.020 .047 .790
per37 152.2200 197.196 .236 .782
att38 151.3400 195.576 .274 .781
att39 151.4200 195.391 .307 .780
att40 151.5000 195.398 .307 .780
att41 151.9200 203.871 .032 .790
att42 151.3000 202.378 .114 .786
att43 151.9000 197.643 .191 .785
att44 150.8400 203.525 .062 .788
SACQ Cronbach's alpha value if items soc25and per 27 deleted
Cronbach's Alpha N of Items
.799 41
Item-Total Statistics
Scale Mean if
Item Deleted
Scale Variance
if Item Deleted
Corrected Item-
Total Correlation
Cronbach's Alpha if
Item Deleted
aca1
aca2
145.1400
144.9200
193.225
193.789
.475
.485
.789
.789
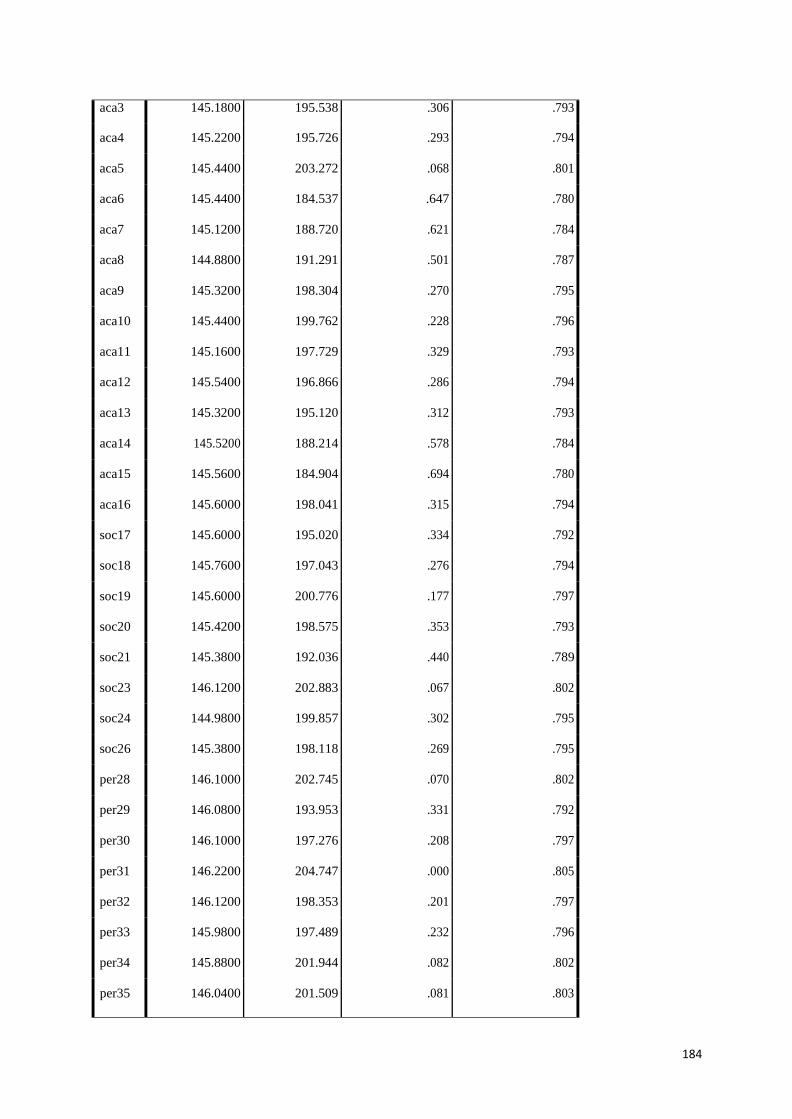
184
aca3 145.1800 195.538 .306 .793
aca4 145.2200 195.726 .293 .794
aca5 145.4400 203.272 .068 .801
aca6 145.4400 184.537 .647 .780
aca7 145.1200 188.720 .621 .784
aca8 144.8800 191.291 .501 .787
aca9 145.3200 198.304 .270 .795
aca10 145.4400 199.762 .228 .796
aca11 145.1600 197.729 .329 .793
aca12 145.5400 196.866 .286 .794
aca13 145.3200 195.120 .312 .793
aca14 145.5200 188.214 .578 .784
aca15 145.5600 184.904 .694 .780
aca16 145.6000 198.041 .315 .794
soc17 145.6000 195.020 .334 .792
soc18 145.7600 197.043 .276 .794
soc19 145.6000 200.776 .177 .797
soc20 145.4200 198.575 .353 .793
soc21 145.3800 192.036 .440 .789
soc23 146.1200 202.883 .067 .802
soc24 144.9800 199.857 .302 .795
soc26 145.3800 198.118 .269 .795
per28 146.1000 202.745 .070 .802
per29 146.0800 193.953 .331 .792
per30 146.1000 197.276 .208 .797
per31 146.2200 204.747 .000 .805
per32 146.1200 198.353 .201 .797
per33 145.9800 197.489 .232 .796
per34 145.8800 201.944 .082 .802
per35 146.0400 201.509 .081 .803
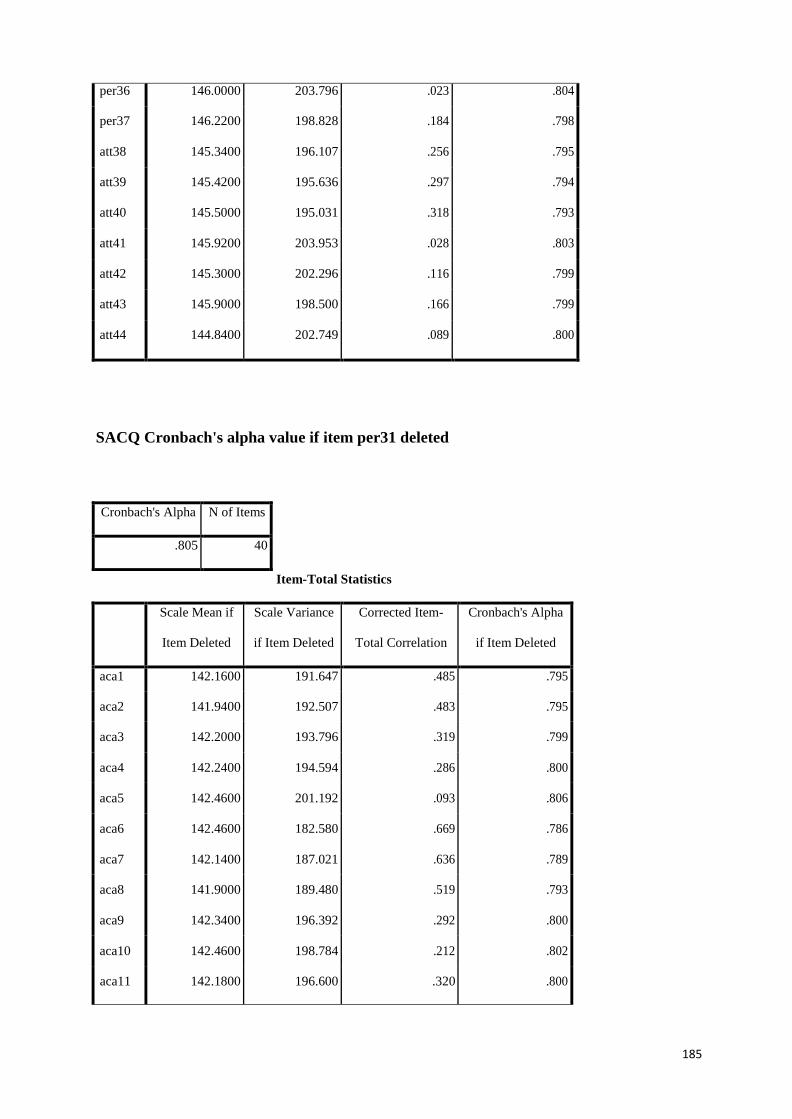
185
per36 146.0000 203.796 .023 .804
per37 146.2200 198.828 .184 .798
att38 145.3400 196.107 .256 .795
att39 145.4200 195.636 .297 .794
att40 145.5000 195.031 .318 .793
att41 145.9200 203.953 .028 .803
att42 145.3000 202.296 .116 .799
att43 145.9000 198.500 .166 .799
att44 144.8400 202.749 .089 .800
SACQ Cronbach's alpha value if item per31 deleted
Cronbach's Alpha N of Items
.805 40
Item-Total Statistics
Scale Mean if
Item Deleted
Scale Variance
if Item Deleted
Corrected Item-
Total Correlation
Cronbach's Alpha
if Item Deleted
aca1 142.1600 191.647 .485 .795
aca2 141.9400 192.507 .483 .795
aca3 142.2000 193.796 .319 .799
aca4 142.2400 194.594 .286 .800
aca5 142.4600 201.192 .093 .806
aca6 142.4600 182.580 .669 .786
aca7 142.1400 187.021 .636 .789
aca8 141.9000 189.480 .519 .793
aca9 142.3400 196.392 .292 .800
aca10 142.4600 198.784 .212 .802
aca11 142.1800 196.600 .320 .800
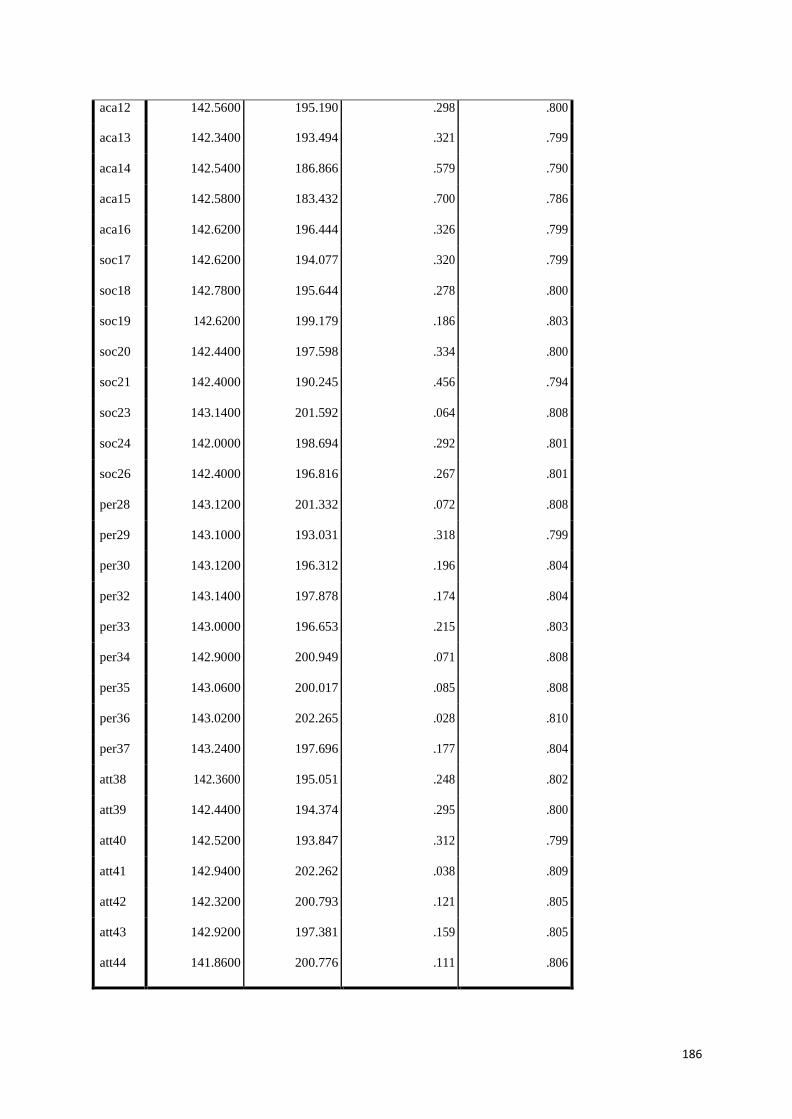
186
aca12 142.5600 195.190 .298 .800
aca13 142.3400 193.494 .321 .799
aca14 142.5400 186.866 .579 .790
aca15 142.5800 183.432 .700 .786
aca16 142.6200 196.444 .326 .799
soc17 142.6200 194.077 .320 .799
soc18 142.7800 195.644 .278 .800
soc19 142.6200 199.179 .186 .803
soc20 142.4400 197.598 .334 .800
soc21 142.4000 190.245 .456 .794
soc23 143.1400 201.592 .064 .808
soc24 142.0000 198.694 .292 .801
soc26 142.4000 196.816 .267 .801
per28 143.1200 201.332 .072 .808
per29 143.1000 193.031 .318 .799
per30 143.1200 196.312 .196 .804
per32 143.1400 197.878 .174 .804
per33 143.0000 196.653 .215 .803
per34 142.9000 200.949 .071 .808
per35 143.0600 200.017 .085 .808
per36 143.0200 202.265 .028 .810
per37 143.2400 197.696 .177 .804
att38 142.3600 195.051 .248 .802
att39 142.4400 194.374 .295 .800
att40 142.5200 193.847 .312 .799
att41 142.9400 202.262 .038 .809
att42 142.3200 200.793 .121 .805
att43 142.9200 197.381 .159 .805
att44 141.8600 200.776 .111 .806
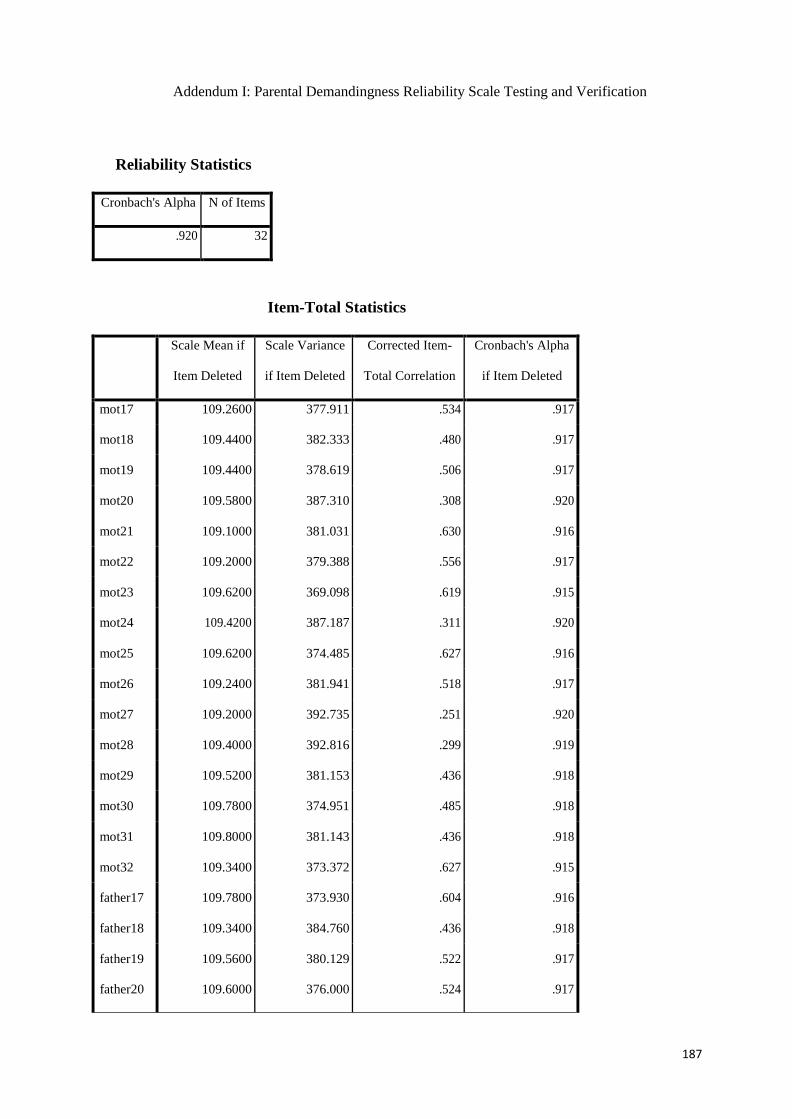
187
Addendum I: Parental Demandingness Reliability Scale Testing and Verification
Reliability Statistics
Cronbach's Alpha N of Items
.920 32
Item-Total Statistics
Scale Mean if
Item Deleted
Scale Variance
if Item Deleted
Corrected Item-
Total Correlation
Cronbach's Alpha
if Item Deleted
mot17 109.2600 377.911 .534 .917
mot18 109.4400 382.333 .480 .917
mot19 109.4400 378.619 .506 .917
mot20 109.5800 387.310 .308 .920
mot21 109.1000 381.031 .630 .916
mot22 109.2000 379.388 .556 .917
mot23 109.6200 369.098 .619 .915
mot24 109.4200 387.187 .311 .920
mot25 109.6200 374.485 .627 .916
mot26 109.2400 381.941 .518 .917
mot27 109.2000 392.735 .251 .920
mot28 109.4000 392.816 .299 .919
mot29 109.5200 381.153 .436 .918
mot30 109.7800 374.951 .485 .918
mot31 109.8000 381.143 .436 .918
mot32 109.3400 373.372 .627 .915
father17 109.7800 373.930 .604 .916
father18 109.3400 384.760 .436 .918
father19 109.5600 380.129 .522 .917
father20 109.6000 376.000 .524 .917

188
father21 109.6000 385.796 .389 .919
father22 109.6200 382.159 .416 .918
father23 109.3600 379.051 .525 .917
father24 109.3000 383.765 .415 .918
father25 109.5600 371.027 .643 .915
father26 109.4400 386.374 .485 .918
father27 109.3200 378.508 .561 .916
father28 109.4600 378.947 .541 .917
father29 109.5400 380.376 .474 .918
father30 109.7200 374.491 .489 .918
father31 109.9400 375.445 .544 .917
father32 109.5200 377.193 .640 .916
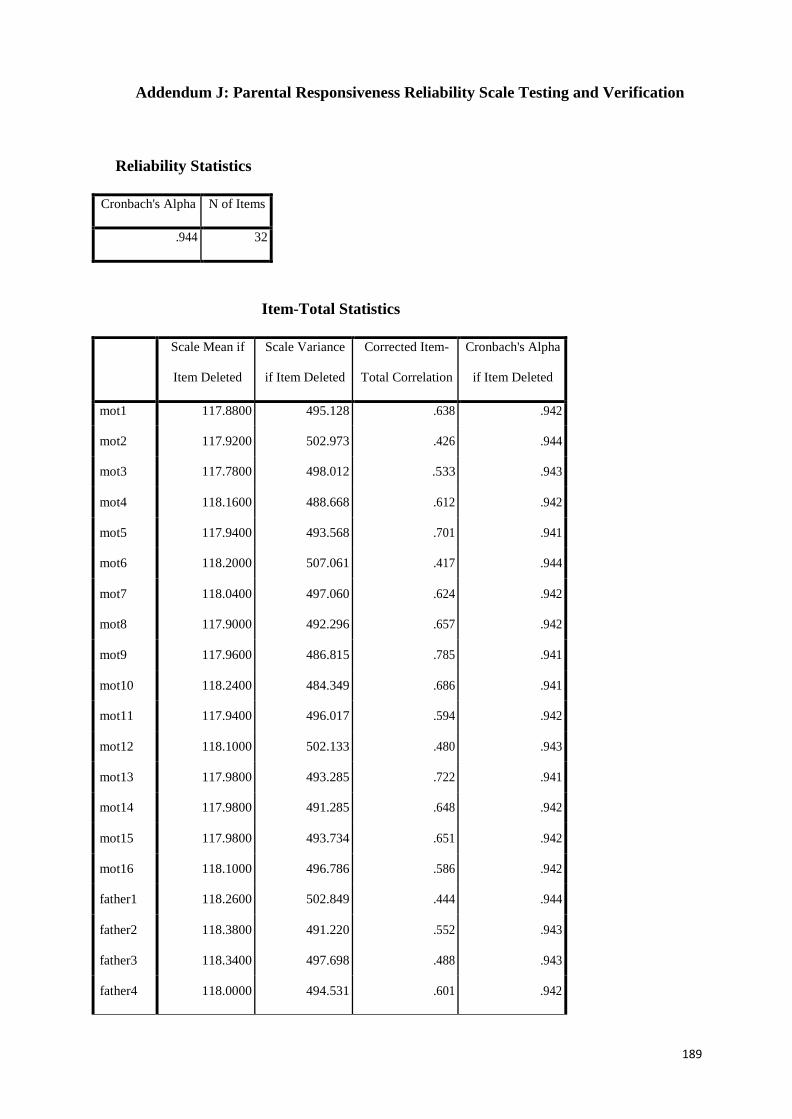
189
Addendum J: Parental Responsiveness Reliability Scale Testing and Verification
Reliability Statistics
Cronbach's Alpha N of Items
.944 32
Item-Total Statistics
Scale Mean if
Item Deleted
Scale Variance
if Item Deleted
Corrected Item-
Total Correlation
Cronbach's Alpha
if Item Deleted
mot1 117.8800 495.128 .638 .942
mot2 117.9200 502.973 .426 .944
mot3 117.7800 498.012 .533 .943
mot4 118.1600 488.668 .612 .942
mot5 117.9400 493.568 .701 .941
mot6 118.2000 507.061 .417 .944
mot7 118.0400 497.060 .624 .942
mot8 117.9000 492.296 .657 .942
mot9 117.9600 486.815 .785 .941
mot10 118.2400 484.349 .686 .941
mot11 117.9400 496.017 .594 .942
mot12 118.1000 502.133 .480 .943
mot13 117.9800 493.285 .722 .941
mot14 117.9800 491.285 .648 .942
mot15 117.9800 493.734 .651 .942
mot16 118.1000 496.786 .586 .942
father1 118.2600 502.849 .444 .944
father2 118.3800 491.220 .552 .943
father3 118.3400 497.698 .488 .943
father4 118.0000 494.531 .601 .942
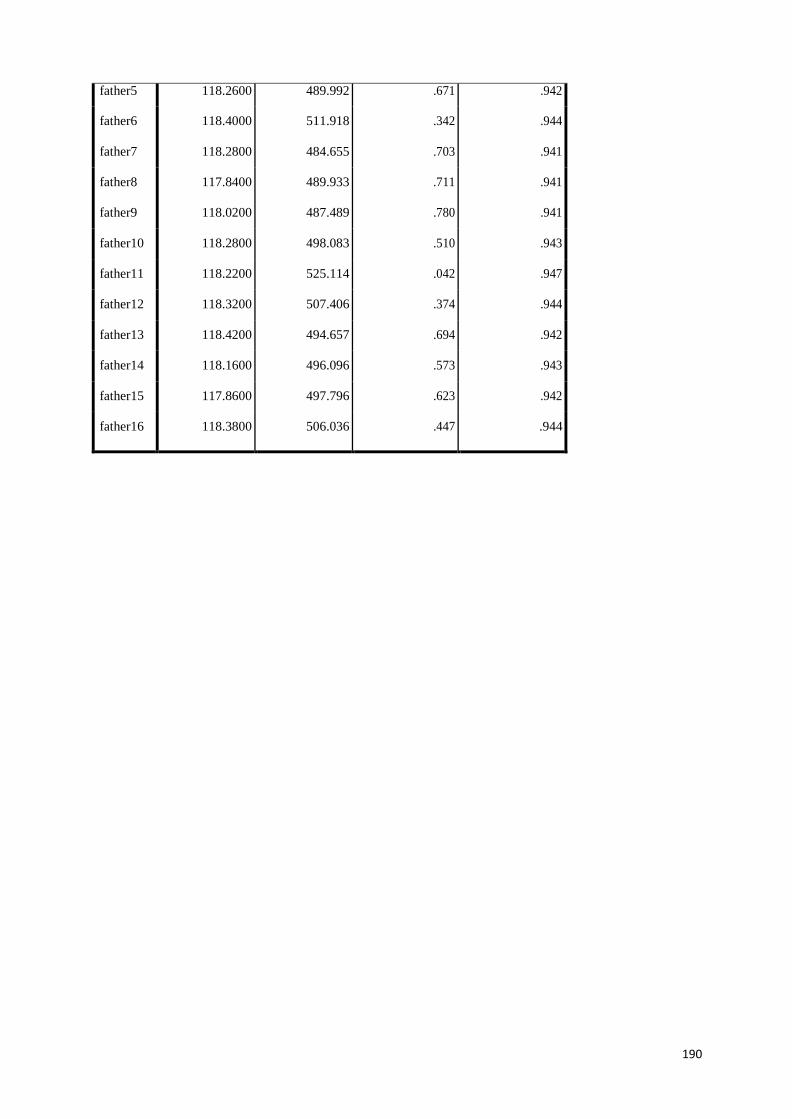
190
father5 118.2600 489.992 .671 .942
father6 118.4000 511.918 .342 .944
father7 118.2800 484.655 .703 .941
father8 117.8400 489.933 .711 .941
father9 118.0200 487.489 .780 .941
father10 118.2800 498.083 .510 .943
father11 118.2200 525.114 .042 .947
father12 118.3200 507.406 .374 .944
father13 118.4200 494.657 .694 .942
father14 118.1600 496.096 .573 .943
father15 117.8600 497.796 .623 .942
father16 118.3800 506.036 .447 .944
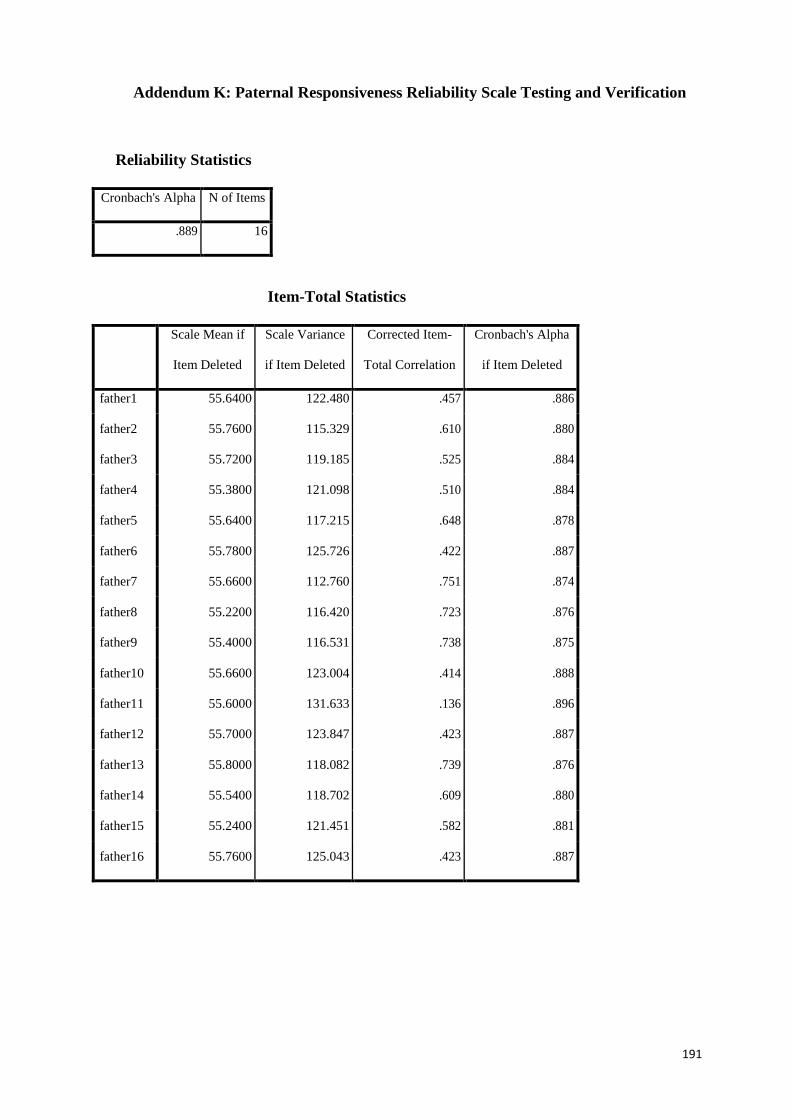
191
Addendum K: Paternal Responsiveness Reliability Scale Testing and Verification
Reliability Statistics
Cronbach's Alpha N of Items
.889 16
Item-Total Statistics
Scale Mean if
Item Deleted
Scale Variance
if Item Deleted
Corrected Item-
Total Correlation
Cronbach's Alpha
if Item Deleted
father1 55.6400 122.480 .457 .886
father2 55.7600 115.329 .610 .880
father3 55.7200 119.185 .525 .884
father4 55.3800 121.098 .510 .884
father5 55.6400 117.215 .648 .878
father6 55.7800 125.726 .422 .887
father7 55.6600 112.760 .751 .874
father8 55.2200 116.420 .723 .876
father9 55.4000 116.531 .738 .875
father10 55.6600 123.004 .414 .888
father11 55.6000 131.633 .136 .896
father12 55.7000 123.847 .423 .887
father13 55.8000 118.082 .739 .876
father14 55.5400 118.702 .609 .880
father15 55.2400 121.451 .582 .881
father16 55.7600 125.043 .423 .887
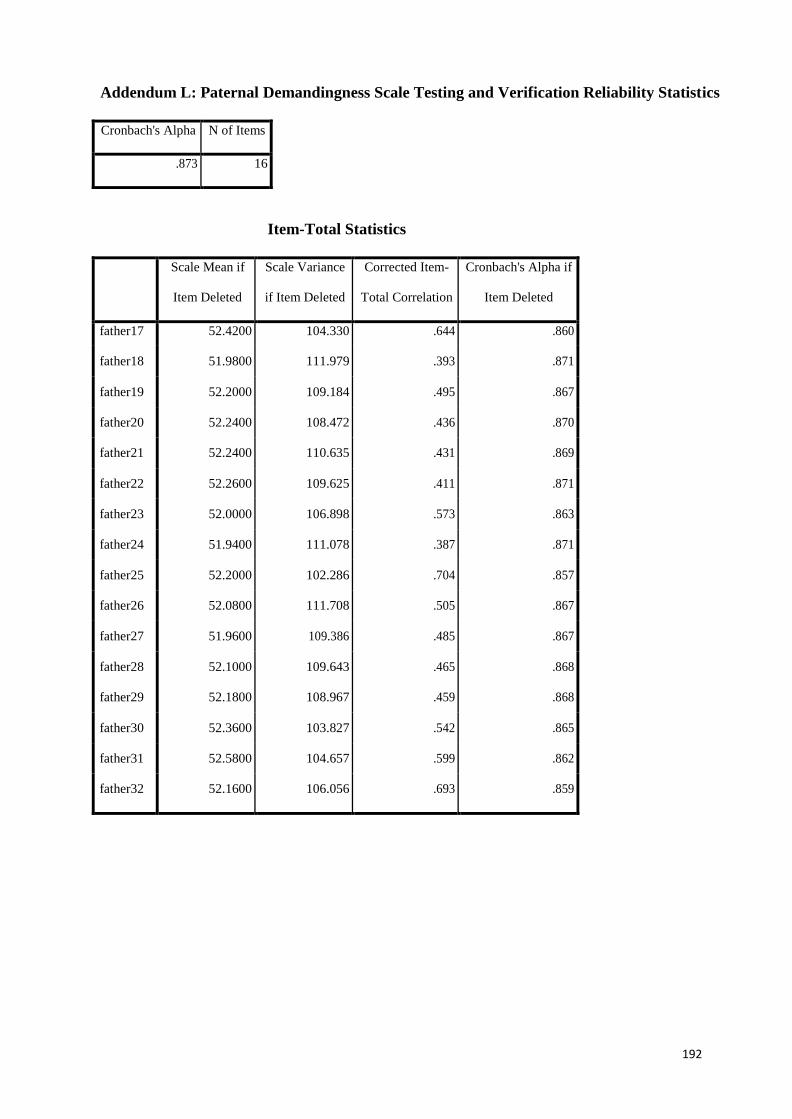
192
Addendum L: Paternal Demandingness Scale Testing and Verification Reliability Statistics
Cronbach's Alpha N of Items
.873 16
Item-Total Statistics
Scale Mean if
Item Deleted
Scale Variance
if Item Deleted
Corrected Item-
Total Correlation
Cronbach's Alpha if
Item Deleted
father17 52.4200 104.330 .644 .860
father18 51.9800 111.979 .393 .871
father19 52.2000 109.184 .495 .867
father20 52.2400 108.472 .436 .870
father21 52.2400 110.635 .431 .869
father22 52.2600 109.625 .411 .871
father23 52.0000 106.898 .573 .863
father24 51.9400 111.078 .387 .871
father25 52.2000 102.286 .704 .857
father26 52.0800 111.708 .505 .867
father27 51.9600 109.386 .485 .867
father28 52.1000 109.643 .465 .868
father29 52.1800 108.967 .459 .868
father30 52.3600 103.827 .542 .865
father31 52.5800 104.657 .599 .862
father32 52.1600 106.056 .693 .859
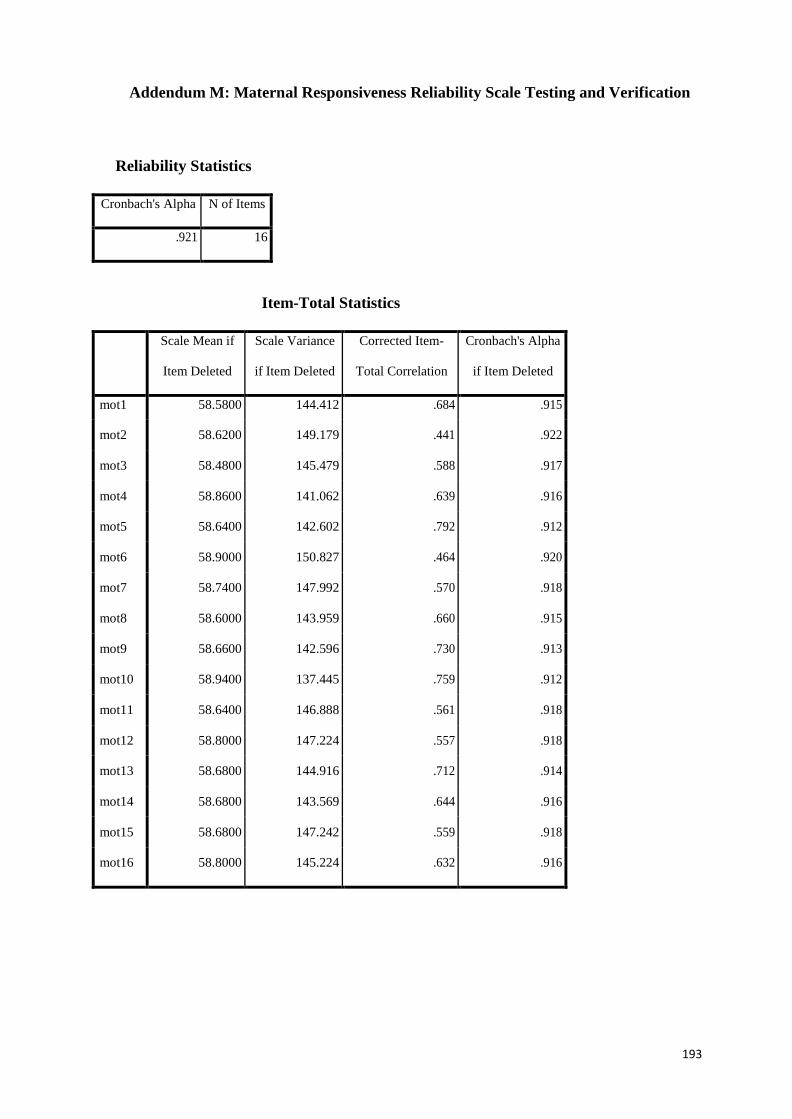
193
Addendum M: Maternal Responsiveness Reliability Scale Testing and Verification
Reliability Statistics
Cronbach's Alpha N of Items
.921 16
Item-Total Statistics
Scale Mean if
Item Deleted
Scale Variance
if Item Deleted
Corrected Item-
Total Correlation
Cronbach's Alpha
if Item Deleted
mot1 58.5800 144.412 .684 .915
mot2 58.6200 149.179 .441 .922
mot3 58.4800 145.479 .588 .917
mot4 58.8600 141.062 .639 .916
mot5 58.6400 142.602 .792 .912
mot6 58.9000 150.827 .464 .920
mot7 58.7400 147.992 .570 .918
mot8 58.6000 143.959 .660 .915
mot9 58.6600 142.596 .730 .913
mot10 58.9400 137.445 .759 .912
mot11 58.6400 146.888 .561 .918
mot12 58.8000 147.224 .557 .918
mot13 58.6800 144.916 .712 .914
mot14 58.6800 143.569 .644 .916
mot15 58.6800 147.242 .559 .918
mot16 58.8000 145.224 .632 .916

194
Addendum N: Maternal Demandingness Reliability Scale Testing and Verification Reliability Statistics
Cronbach's Alpha N of Items
.850 16
Item-Total Statistics
Scale Mean if
Item Deleted
Scale Variance
if Item Deleted
Corrected Item-
Total Correlation
Cronbach's Alpha if
Item Deleted
mot17 53.6000 93.061 .593 .835
mot18 53.7800 95.073 .556 .837
mot19 53.7800 93.971 .537 .838
mot20 53.9200 98.034 .343 .849
mot21 53.4400 96.496 .609 .837
mot22 53.5400 95.437 .542 .838
mot23 53.9600 92.407 .516 .839
mot24 53.7600 96.962 .390 .846
mot25 53.9600 92.284 .648 .832
mot26 53.5800 98.330 .422 .844
mot27 53.5400 100.090 .338 .848
mot28 53.7400 102.237 .285 .849
mot29 53.8600 97.266 .375 .847
mot30 54.1200 96.149 .350 .850
mot31 54.1400 96.490 .408 .845
mot32 53.6800 90.671 .697 .829
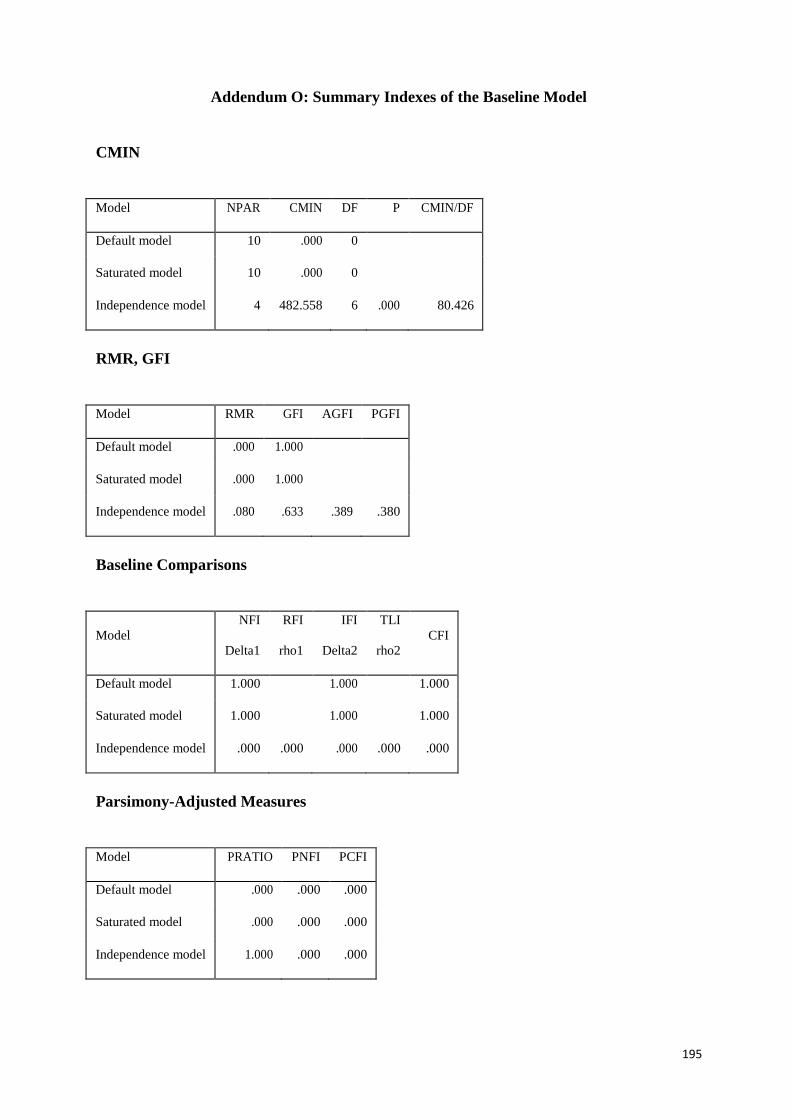
195
Addendum O: Summary Indexes of the Baseline Model
CMIN
Model NPAR CMIN DF P CMIN/DF
Default model 10 .000 0
Saturated model 10 .000 0
Independence model 4 482.558 6 .000 80.426
RMR, GFI
Model RMR GFI AGFI PGFI
Default model .000 1.000
Saturated model .000 1.000
Independence model .080 .633 .389 .380
Baseline Comparisons
Model
NFI
Delta1
RFI
rho1
IFI
Delta2
TLI
rho2
CFI
Default model 1.000 1.000 1.000
Saturated model 1.000
1.000
1.000
Independence model .000 .000 .000 .000 .000
Parsimony-Adjusted Measures
Model PRATIO PNFI PCFI
Default model .000 .000 .000
Saturated model .000 .000 .000
Independence model 1.000 .000 .000
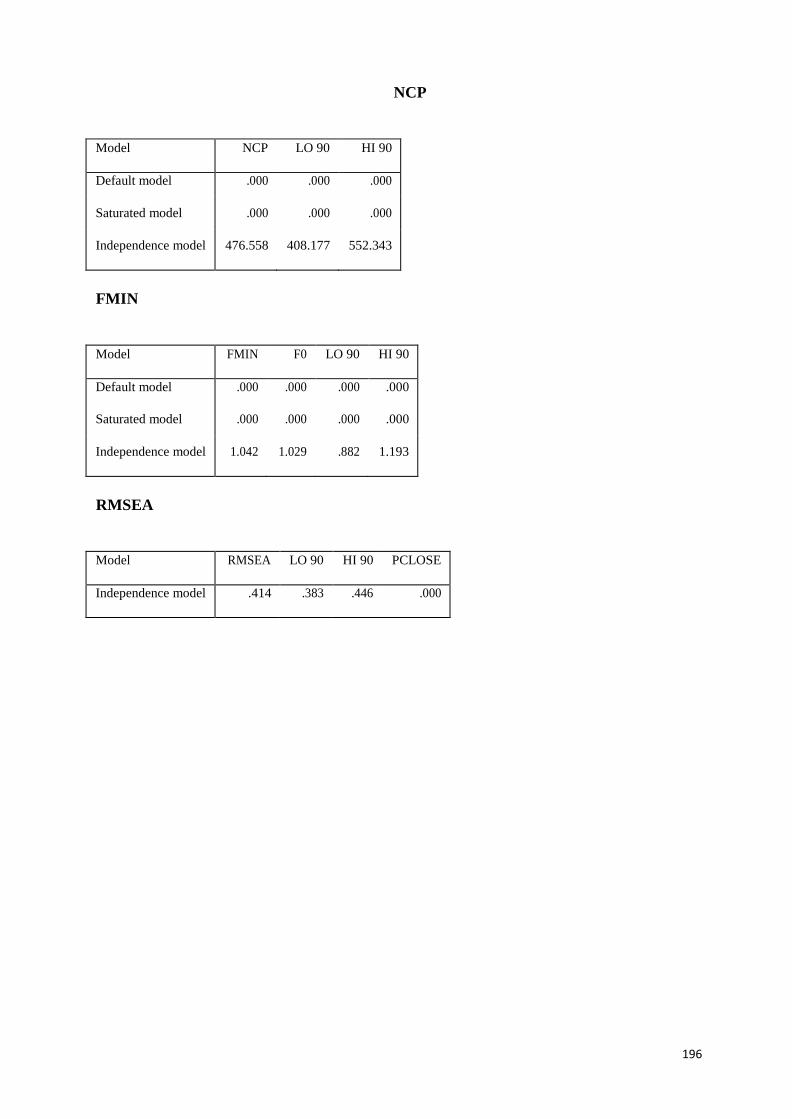
196
NCP
Model NCP LO 90 HI 90
Default model .000 .000 .000
Saturated model .000 .000 .000
Independence model 476.558 408.177 552.343
FMIN
Model FMIN F0 LO 90 HI 90
Default model .000 .000 .000 .000
Saturated model .000 .000 .000 .000
Independence model 1.042 1.029 .882 1.193
RMSEA
Model RMSEA LO 90 HI 90 PCLOSE
Independence model .414 .383 .446 .000
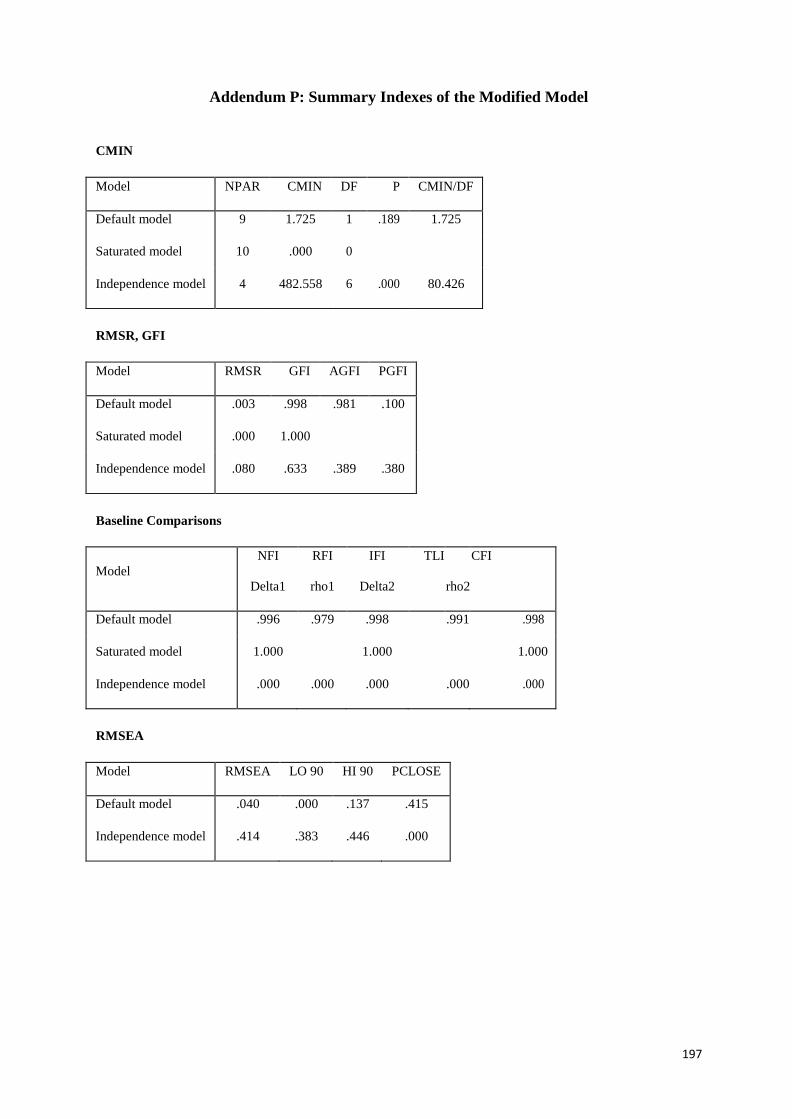
197
Addendum P: Summary Indexes of the Modified Model
CMIN
Model NPAR CMIN DF P CMIN/DF
Default model 9 1.725 1 .189 1.725
Saturated model 10 .000 0
Independence model 4 482.558 6 .000 80.426
RMSR, GFI
Model RMSR GFI AGFI PGFI
Default model .003 .998 .981 .100
Saturated model .000 1.000
Independence model .080 .633 .389 .380
Baseline Comparisons
Model
NFI
Delta1
RFI
rho1
IFI
Delta2
TLI
rho2
CFI
Default model .996 .979 .998 .991 .998
Saturated model 1.000
1.000
1.000
Independence model .000 .000 .000 .000 .000
RMSEA
Model RMSEA LO 90 HI 90 PCLOSE
Default model .040 .000 .137 .415
Independence model .414 .383 .446 .000
198
Addendum Q: Ethical Clearance Information
199
The proposed research may now commence with the proviso that:
1) The researcher/s will ensure that the research project adheres to the values and principles
expressed in the UNISA Policy on Research Ethics.
2) Any adverse circumstance arising in the undertaking of the research project that is relevant to the
ethicality of the study, as well as changes in the methodology, should be communicated in writing to
the Psychology Department Ethics Review Committee. An amended application could be requested if
there are substantial changes from the existing proposal, especially if those changes affect any of the
study-related risks for the research participants.
3) The researcher will ensure that the research project adheres to any applicable national legislation,
professional codes of conduct, institutional guidelines and scientific standards relevant to the specific
field of study.