parallel visualization - cornell university center for ... · from startup type select manual and...
TRANSCRIPT

Parallel Visualization
Greg Abram*
*with a little help from my friends

Parallel Systems Background
• “Node”: analogous to a workstation, laptop etc: – 1 or more CPUs (or cores)
– Physical resources: memory, I/O devices, graphics etc.
• “Process”: An instance of a program – “Virtualized” resources – notably, memory
“Parallel process” Shared-memory or “Multi-core”
1 process – so 1 memory space
>1 “threads of execution” running on >1 cores (OpenMP, pthreads)
Requires intra-process synchronization
Distributed-memory >1 process
Communicate by message-passing (MPI)
1 process / node – or processes must share physical resources of node

Other approaches:
• Co-Processors
– Node hosts an accelerator – special processor
programmed separately from main processor(s)
– Program manages parallel execution on
accelerator
– GPGPU, Cell Processor, Cuda (Nvidia), OpenCl
• Hybrids
– Distributed multi-threaded processes
– … with accelerators?

Parallel Visualization
• Why? Performance
– Processing may be too slow on one CPU
• Interactive visualization requires real-time frame rates
• Use lots of CPUs
• Shared-memory/multicore or distributed
– Data may be too big for available node
• Virtual memory works, but paging is slow
• Use lots of nodes to increase physical memory size
• Big shared-memory/multicore scaling is costly ($/CPU)
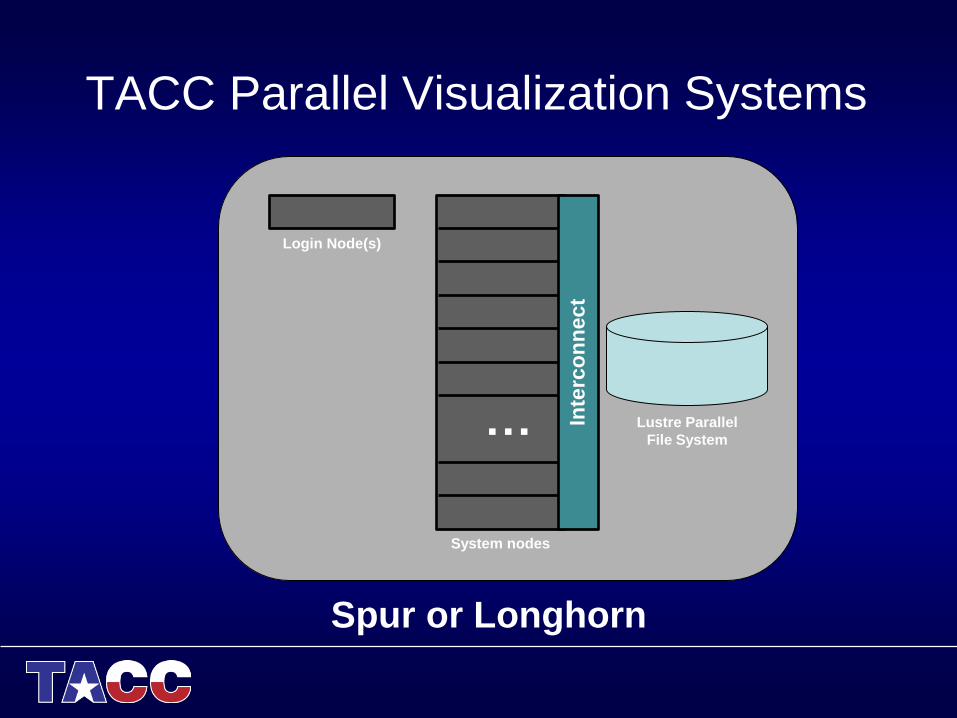
TACC Parallel Visualization Systems
Login Node(s)
Lustre Parallel
File System …
System nodes
Inte
rco
nn
ect
Spur or Longhorn

TACC Parallel Visualization Systems
Login Node(s)
Lustre Parallel
File System …
System nodes
Inte
rco
nn
ect
Local
Disk
CPU 0
CPU n
… Memory
gfx 0
gfx n
…
Spur or Longhorn

TACC Parallel Visualization Systems
• Spur
– 8 nodes
– 16 cores per node (128 total)
– 4 GPUs per node (32 total)
– DDR (dual data rate) Infiniband interconnect
• Longhorn
– 256 nodes
– 8 cores per node (2048 total)
– 2 GPUs per node (512 total)
– QDR (quad data rate) Infiniband interconnect

Visualization In Parallel

Parallel Visualization Apps At TACC
• Ensight Gold, Paraview and VisIT
• (I don’t know much about Ensight, we’ll focus on
ParaView and VisIt)
• PV and Visit are very similar in many ways: – Based on VTK
– Client/Server Architecture
Client
App App
GUI
Server
Process Data

Parallel Visualization Apps At TACC
• Both utilize a distributed, data-parallel serve
architecture
Client
App App
GUI
Server
Process Data Server
Process Data Server
Process Data Server
Process Data Server
Process Data Server
Process Data Server
Process Data Server
Process
n
Data
n

Mapping Parallel PV, VisIt to TACC
Visualization Systems
1. Allocate set of nodes on visualization system. This will start a VNC
server one one node, which you will connect to (as before)
Login Node(s)
Lustre Parallel
File System …
System nodes
Inte
rco
nn
ect
VNC
viewer
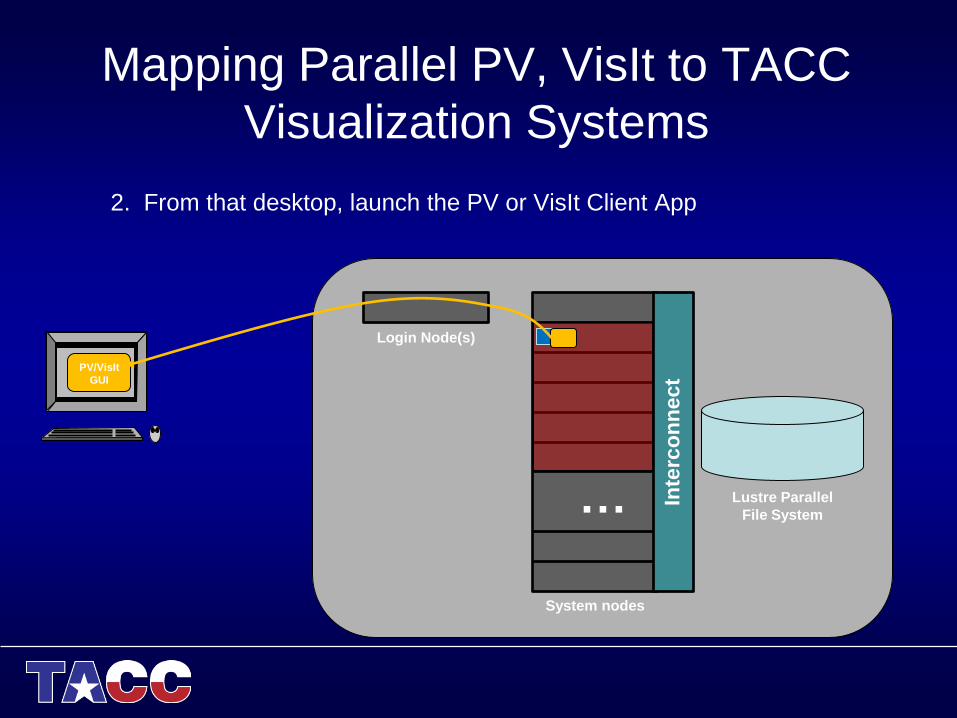
Mapping Parallel PV, VisIt to TACC
Visualization Systems
2. From that desktop, launch the PV or VisIt Client App
Login Node(s)
Lustre Parallel
File System …
System nodes
Inte
rco
nn
ect
VNC
viewer
PV/VisIt
GUI

Mapping Parallel PV, VisIt to TACC
Visualization Systems
3. Start PV or VisIt Server Processes - PV, from command line; VisIt through GUI
Login Node(s)
Lustre Parallel
File System …
System nodes
Inte
rco
nn
ect
VNC
viewer
PV/VisIt
GUI

Mapping Parallel PV, VisIt to TACC
Visualization Systems
4. Multiple processes/node to take advantage of multiple cores/node
Login Node(s)
Lustre Parallel
File System …
System nodes
Inte
rco
nn
ect
VNC
viewer
PV/VisIt
GUI

Way-ness: The Number of
Processes Per Node
Process memory is limited to 1/n of node memory for each of n
processes on that node If you need large memory per process,
use fewer processes per node
Why would you need to?
– Data is partitioned in large chunks
– Visualization algorithms can expand the data
Way-ness is set up at allocation time
– Parallel jobs launched from VNC desktop will adopt the way-ness specified
when the VNC server job is launched
– VNC sessions launched through the portal are full-way
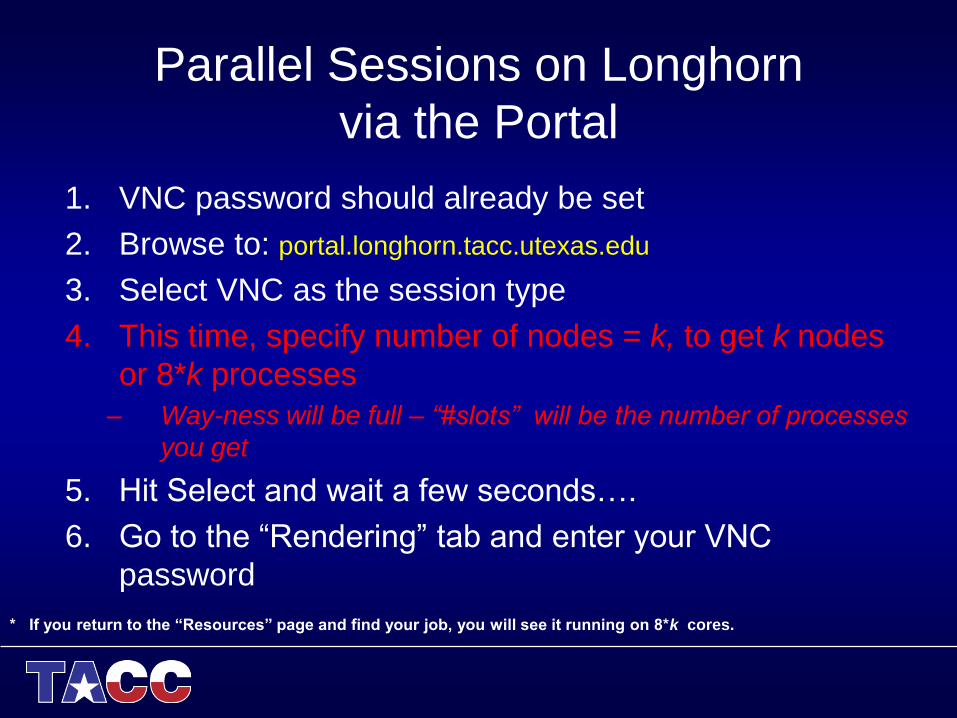
Parallel Sessions on Longhorn
via the Portal
1. VNC password should already be set
2. Browse to: portal.longhorn.tacc.utexas.edu
3. Select VNC as the session type
4. This time, specify number of nodes = k, to get k nodes
or 8*k processes
– Way-ness will be full – “#slots” will be the number of processes
you get
5. Hit Select and wait a few seconds….
6. Go to the “Rendering” tab and enter your VNC
password
* If you return to the “Resources” page and find your job, you will see it running on 8*k cores.
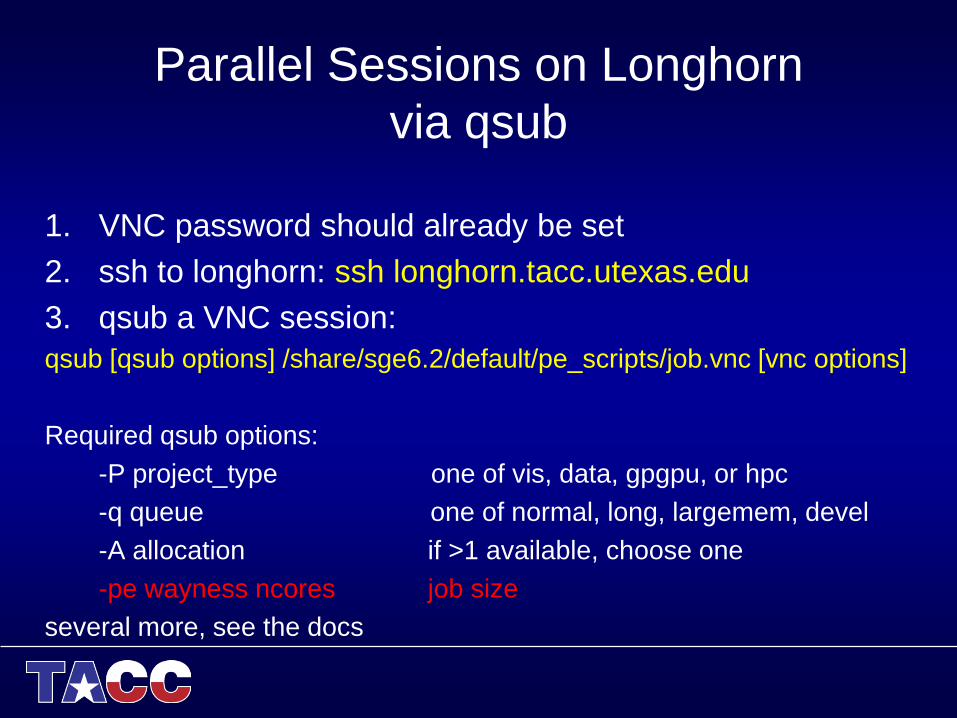
Parallel Sessions on Longhorn
via qsub
1. VNC password should already be set
2. ssh to longhorn: ssh longhorn.tacc.utexas.edu
3. qsub a VNC session:
qsub [qsub options] /share/sge6.2/default/pe_scripts/job.vnc [vnc options]
Required qsub options:
-P project_type one of vis, data, gpgpu, or hpc
-q queue one of normal, long, largemem, devel
-A allocation if >1 available, choose one
-pe wayness ncores job size
several more, see the docs

Running Paraview in Parallel
1. Start it as before: in the white xterm, module paraview
vglrun paraview
Paraview will appear
2. In a second xterm, start the parallel server… module paraview
(csh) env NO_HOSTSORT=1 ibrun tacc_xrun pvserver
(bash) NO_HOSTSORT=1 ibrun tacc_xrun pvserver
You will see “Waiting for client…”

Running Parallel Paraview (2)
3. Connect client to server
a. Click File->Connect to bring up Choose Server dialog
b. If first time:
i. Click Add Server
ii. Set the server configuration name to “manual”
iii. Click Configure
iv. From Startup Type select Manual and click Save
c. Select manual from the list and click Connect
In client xterm, you should see “Waiting for server…”
In server xterm, you should see “Client connected.”

Running VisIt in Parallel
• Its really easy….
module load visit
vglrun visit

Paraview In Parallel
• Demonstrate: – Click Sources->Sphere
– Max out Theta Resolution and Phi Resolution
– Click Apply
Up comes a white sphere
– Click Filters->Alphabetical->Process Id Scalars
– Click Apply
Segments are colored by which process handles
them
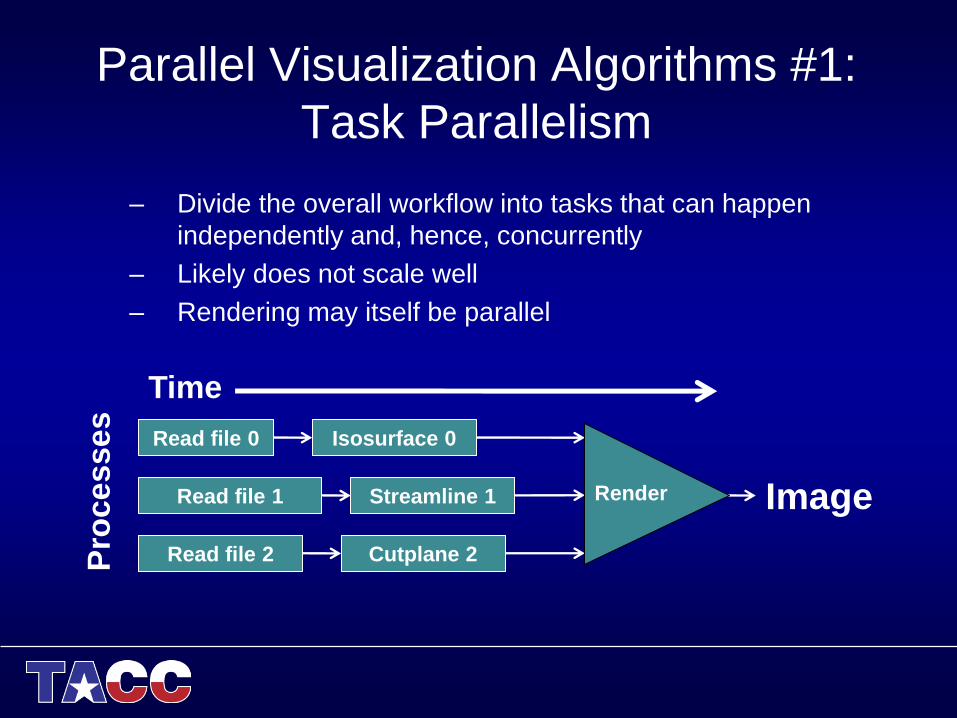
Parallel Visualization Algorithms #1:
Task Parallelism
– Divide the overall workflow into tasks that can happen
independently and, hence, concurrently
– Likely does not scale well
– Rendering may itself be parallel
Time
Pro
cesses
Image
Read file 0
Read file 1
Read file 2
Streamline 1
Cutplane 2
Isosurface 0
Render
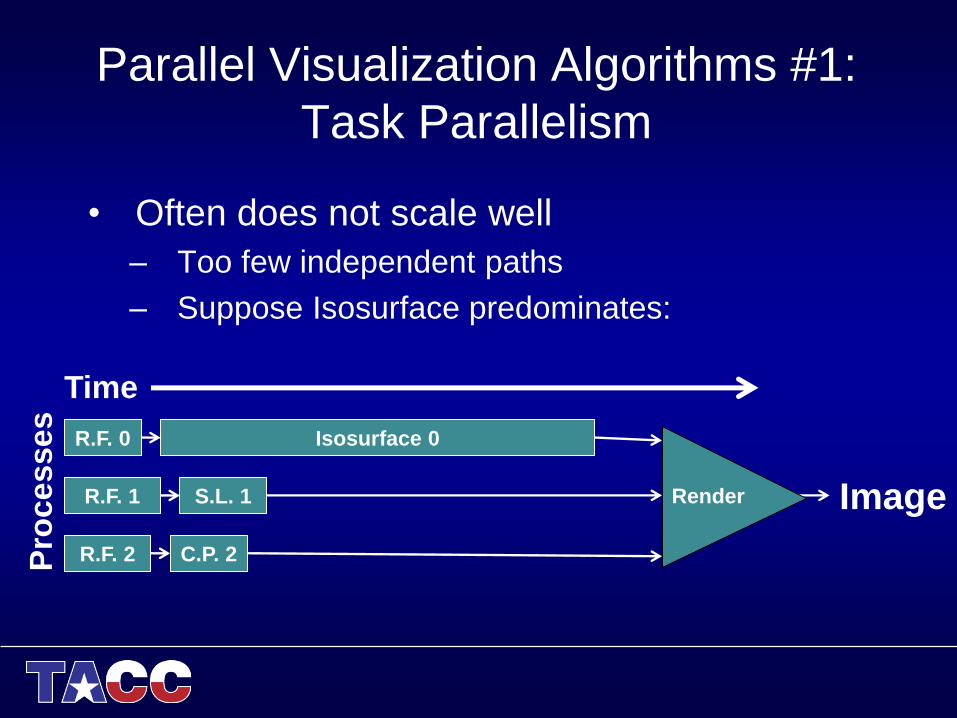
Parallel Visualization Algorithms #1:
Task Parallelism
• Often does not scale well
– Too few independent paths
– Suppose Isosurface predominates:
Time
Pro
cesses
Image
R.F. 0
R.F. 1
R.F. 2
S.L. 1
C.P. 2
Isosurface 0
Render

Parallel Visualization Algorithms #2:
Data Parallelism
– Data set is partitioned among the processes and all processes
execute same operations on the data.
– Scales well as long as the data and operations can be decomposed.
Image
Time
Read p0
Read p1
Read pn
…
Iso p0
Iso p1
Iso pn
… …
Com
posite
Render
p0
p1
pn
Dataset 0
Similar
for
dataset 1
streamlines
Similar
for
dataset 2
cutplanes

Parallel Visualization Algorithms #2:
Data Parallelism
• Generally scales well if:
– Tasks are amenable to data-parallelism • Many are (isosurfaces etc.)
• A few just aren’t (streamlines!)
– Work is evenly distributed over partitions
– Alternative is to have >>partitions than processors for load-balancing
• Inter-Partition Boundaries In Distributed Implementations
– Some applications require neighborhood information to get right
answer
– Requires access to data assigned to neighboring partitions (called
ghost zones)
– Overhead increases with number of partitions
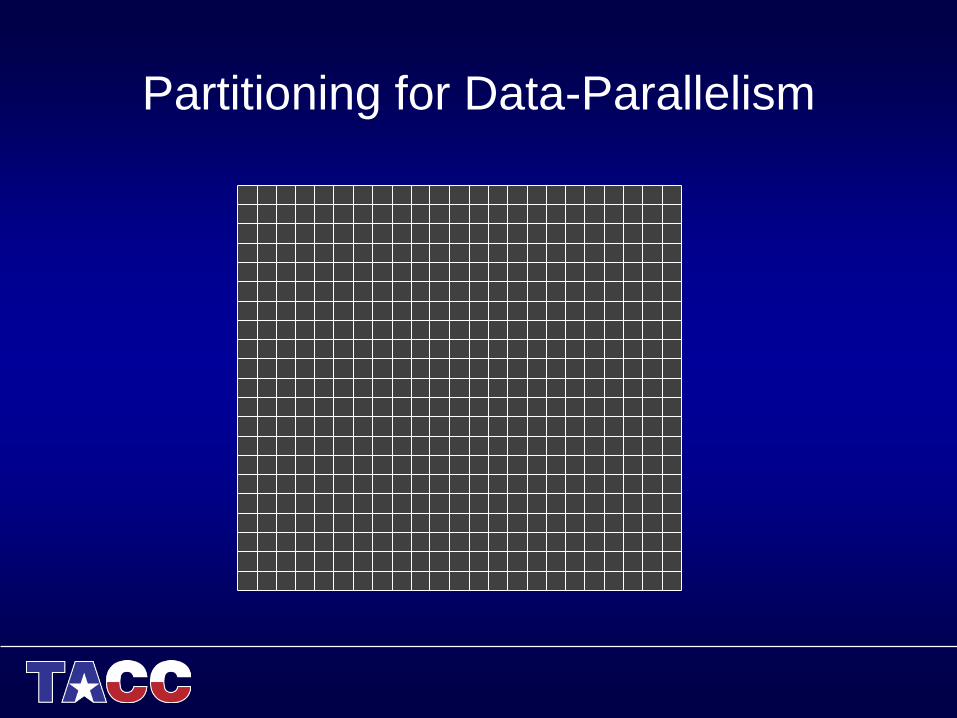
Partitioning for Data-Parallelism

Partitioning for Data-Parallelism
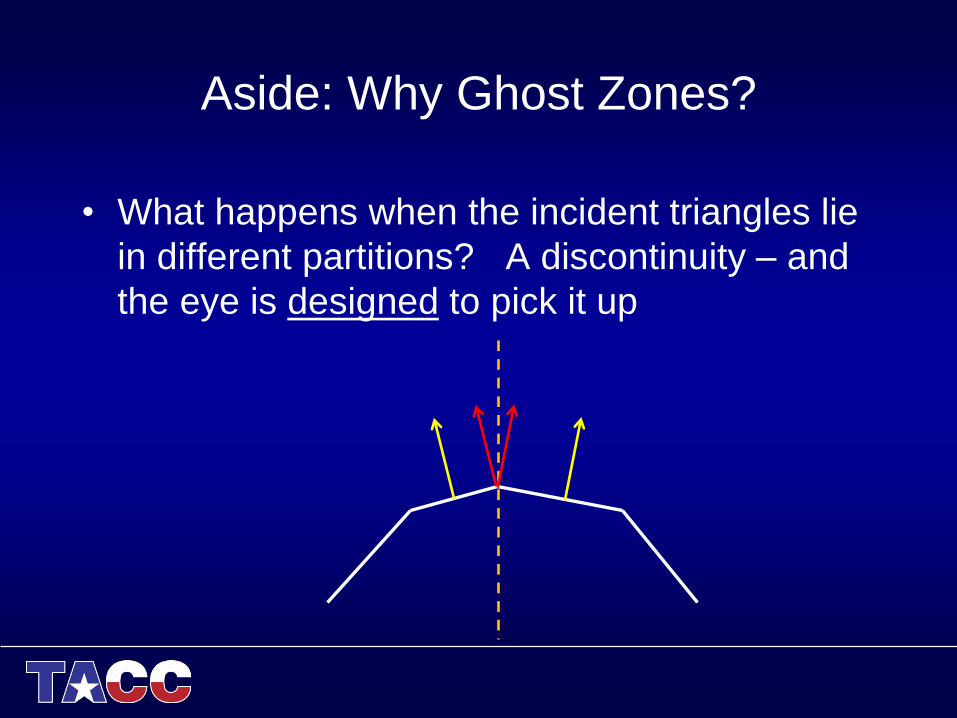
Aside: Why Ghost Zones?
• What happens when the incident triangles lie
in different partitions? A discontinuity – and
the eye is designed to pick it up
Performance Issues
• Memory Utilization
• Parallel Data Management
– Supporting parallel compute
– Supporting parallel I/O
• Non-data parallel algorithms
• Parallel rendering overhead
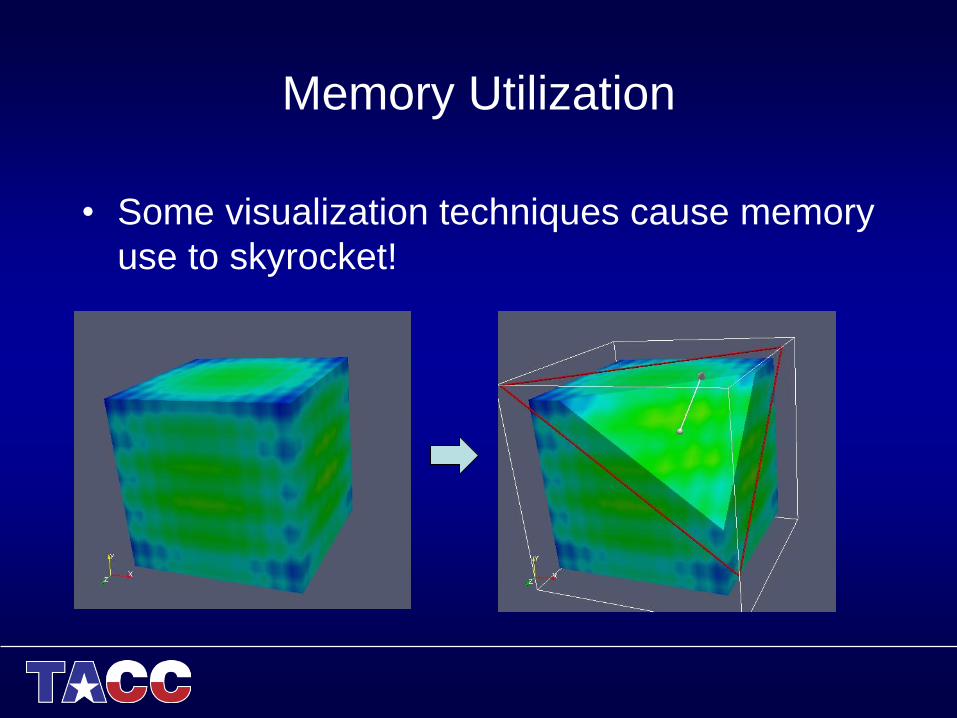
Memory Utilization
• Some visualization techniques cause memory
use to skyrocket!

Memory Utilization
• Regular grids
• Grid and mesh are specified by:
•(xyz) origin
•(dx,dy,dz) delta vectors
•(nx,ny,nz) counts
•Requires diddly-squat memory

Memory Utilization
• Chop off the corner -> Unstructured Grids
• Specified by:
•Explicit list of vertices
•Explicit list of triangles (2D)
•Memory use can go up many
times

Memory Utilization
• Bad solution: Clip volume, extract bundary

Memory Utilization
• Better Solution: extract the boundary and
chop, add in cap

In Paraview

Parallel Data Management
• Data must be distributed across parallel processes to take
advantage of resources
• How does it get there?
– Some PV and VisIt readers import in parallel
• Explicit parallel formats use separate files for partitions (.pvti, global.silo)
• Implicit parallel formats – parallel processes figure out what they need – (.vti,
brick-of-values)
– Some may seem to import in parallel
• Actually, import serially and then distribute
• Bad bad bad – 1 process needs enough memory for entire dataset plus
additional space for partitioning
– And some just don’t
• … and leave it to you (D3 filter in Paraview)
• See Bad bad bad above

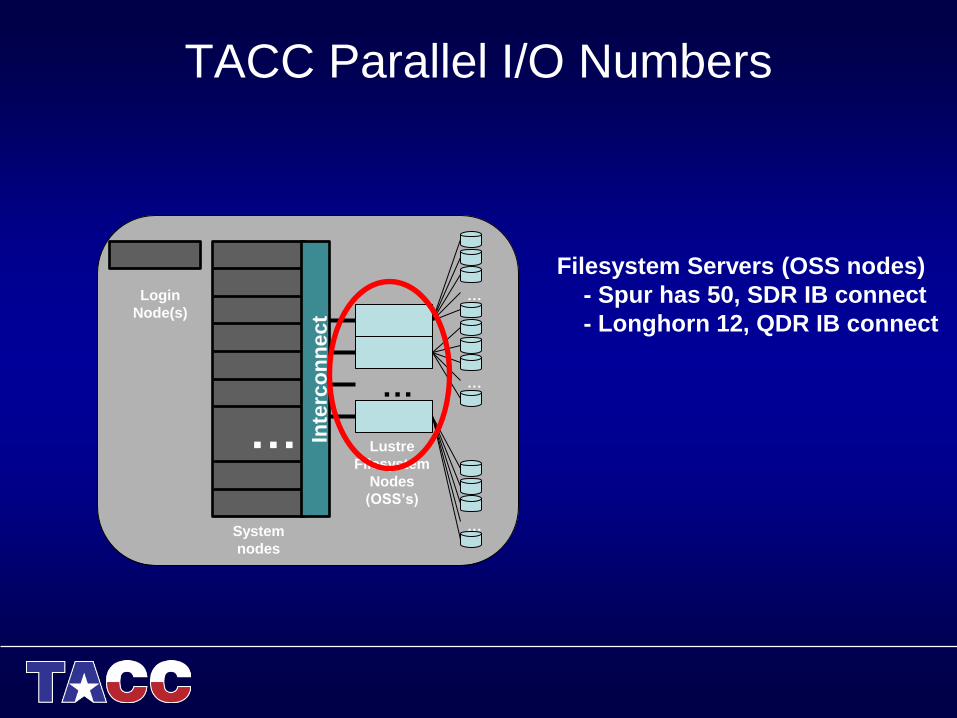
TACC Parallel I/O Numbers
Login
Node(s)
…
Lustre
Filesystem
Nodes
(OSS’s)
…
System
nodes
Inte
rco
nn
ec
t
…
…
…
Number of disks per server:
- 2 Logical Units (LUNs)
- 6(+1 redundant) disks/LUN
TACC Parallel I/O Numbers
Login
Node(s)
…
Lustre
Filesystem
Nodes
(OSS’s)
…
System
nodes
Inte
rco
nn
ect
…
…
…
Filesystem Servers (OSS nodes)
- Spur has 50, SDR IB connect
- Longhorn 12, QDR IB connect

Lustre File System
• No files are local
– any process can access any file, or any part of a file
• Files are served across network
– Bandwidth into node across interconnect >> bandwidth from
a few local disks
• Multiple pinch-points remain
– Total number of disks (~30-40 MB/sec per disk)
– Total number of file servers (IB connectivity)
• Layout of files becomes important
– File striping across disks in each file server
– File striping across file servers

Luster OSS Striping
• Stripe across >1 OSS node for performance
(and capacity) with diminishing (negative)
returns – Spur defaults to 4, Longhorn to 2
• Striping is under user control
– lfs getstripe file
• see lmm_stripe_count for current striping
– lfs getstripe dir
• stripe_count will be applied to all files written to that dir
– lfs setstripe dir
• Set the stripe count to apply to all files written to that dir

Finally, Some Things Just Don’t Lend
Themselves To Parallel Execution
• Streamlines!
– Not data-parallel
– Partial streamlines must be passed from
processor to processor as the streamline moves
from partition to partition
– No more parallelism available than the number of
streamlines!
– If >1 streamlines pass through the same partition,
you may not even get that

Rendering
• Got lots of triangles spread out over nodes
• 2 rendering solutions
– 1. Gather triangles onto one node, render there
• Best when there’s not a lot of data to render
– 2. Render triangles in place, gather and
Z-composite the results
• Best when there is a lot of data to render
• Overhead is almost independent of data size
• VisIt and Paraview both do it both ways
– User controls threshold

Summary
• Paraview and VisIt are designed to look the
same whether serial or parallel
• You can’t completely ignore the realities
– Choose your file formats well!
– Consider file system realities!
– Watch out for memory explosion!