paper machine transition troubleshooting from stock ... · transition issue may be well known but...
TRANSCRIPT

Paper Machine Transition Troubleshooting from Stock Blending to the Reel Timothy F. Murphy & Kevin Starr ABB Automation Inc. Westerville, OH 43082 Abstract Grade change transitions can be a significant production loss on a large percentage of paper machines worldwide. The demand to make quick and frequent transitions has continued to be a common requirement and future needs will only become greater. There are several different available control approaches that can be used to automate grade change transitions[1][2][3
• What are top five perceived issues that are preventing transition success
]. There are also documented methods to quantify grade change performance that can be used to point to areas that are under performing. With the combination of existing automated transitions and methods to quantify performance, several common issues have been identified. This paper will provide several examples of common grade change transition issues that have been observed on many different machines and paper grade types. For each issue, a detailed explanation is provided and corresponding solution or recommendation used to improve the identified issue. This includes several process areas including stock blending, stock approach, wet end, drying, and reel / paper test lab. With this set of documented troubleshooting examples and recommended solutions other paper machines with transition issues can benefit from the results of this analysis and can also achieve similar improvements in overall transition performance. Introduction At this point the remainder of this discussion will refer to a grade change transition only by the word “transition”. Troubleshooting an unacceptable transition can be a very daunting task. Typically, this process initiates as an entry in an operator log book, data trend printout, or general complaint from production during a morning meeting. In some cases it may actually be an increase in the documented average production loss during the transition process over a given period of time. In any case, the fact that there is a transition issue may be well known but the process of properly troubleshooting and correcting the issue is not always obvious. This discussion will present some specific process and control areas to consider as well as provide actual examples from several different machines to help reinforce the proposed troubleshooting process. In order to effectively troubleshoot paper machine grade change transitions several prerequisites must first be addressed, which include:
• Is there any quantified historical data available that provides a benchmark of grade change success or failure?
• Are there documented procedures that operations’ uses to complete grade change transitions?
• Is there process data collection and quantification of both manual and automatic grade change performance available?[4
It is important to understand what the perceived issues are with automatic transitions. This is important to not only know what areas need attention but to also ensure future improvements meet expectations of end users. Having some way to quantify the transition performance is critical and this usually requires some type of data collection that is free of compression and can be collected at a sufficiently fast sample rate (e.g. 5 to 10 sec). It is also important to be able to identify when controllers are in manual versus automatic mode from the data collection. For many controllers this can be achieved by logging the working setpoint which will track the process measurement when the controller is in manual mode. Finally, if there is a written procedure the operator can reference for training or when questions come up this should be reviewed to understand if there are some outdated or questionable steps that are affecting overall transition performance.
]
Control Systems 2012 Page 565

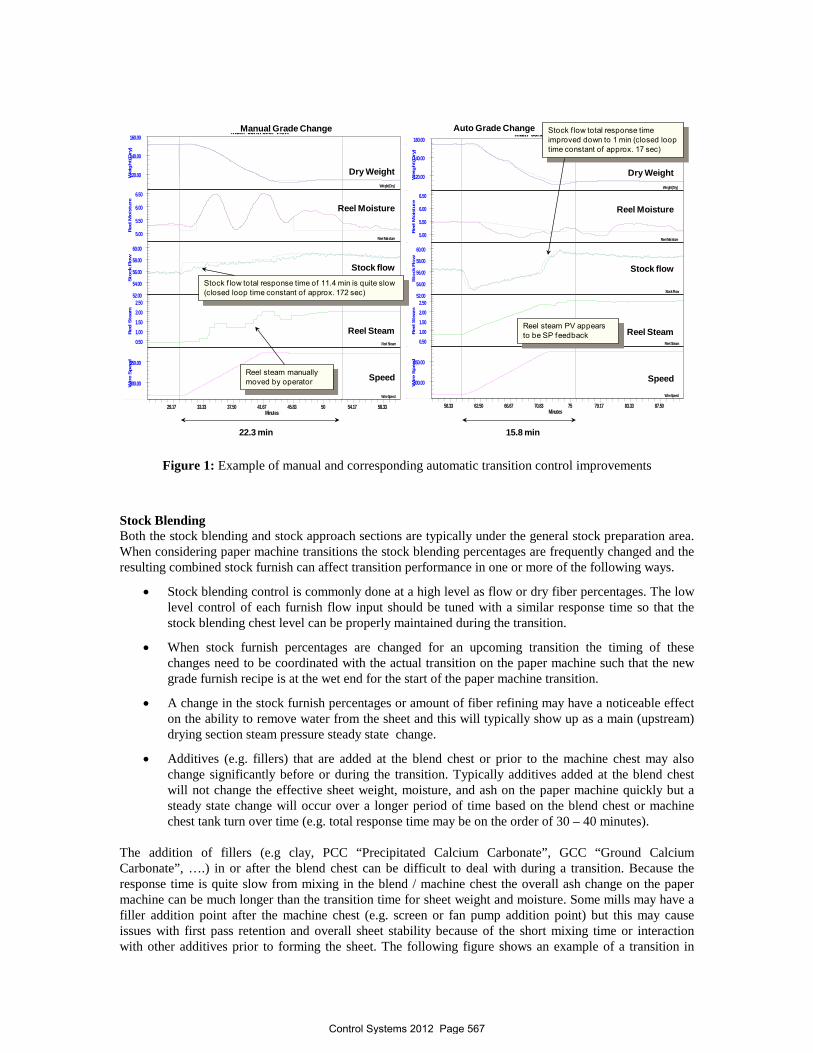
Based on the initial assessment of transition performance, one or several of the following process areas will be the focus of the investigation and future improvements. The focus areas include stock blending, stock approach, wet end, drying, and reel / paper test lab. Each area will be discussed in more detail and for each area several key process measurement and control loops will be mentioned related to transitions. Manual and Automatic Transitions Over the past two decades significant progress has been made in achieving automatic transitions on a large number of paper machines. The main focus of this discussion is related to troubleshooting automatic transitions (automatic grade change) but almost everything presented is also applicable to manual transitions. Presently there is a percentage of machines that complete transitions manually but as the demand for more grades produced on a given machine increases the need for automatic transition control needs to be embraced. It is important to keep in mind that adding automatic transition capability to a machine is not always simple and straightforward. If there are performance issues with the low level PID control loops or MD (machine direction) control loops these issues will become more obvious while commissioning automatic transition control. In all cases it is critical that low level PID and MD control issues are resolved before attempting transition control commissioning or performance improvements. Even with the PID and MD control performance at an acceptable level there will still be occasions in which the automatic transition control does not perform as expected because of an unexpected process disturbance on the machine. Having the expectation that every automatic transition will complete flawlessly is unrealistic. What should be expected is that with automatic transition control the grade change process should be more repeatable and the average performance will be above the average manual transition performance. There is usually at least one experienced operator that can do a very good job in completing a satisfactory manual transition but it is not practical to have this operator available 365 days a year. Discussing the procedure a skilled operator uses to complete a manual transition can be quite enlightening and in some cases the operator’s methodology can be applied to the configuration of the automatic transition control. It should be noted though that the operator’s perception of transition performance may be biased by a lack of understanding of process dynamics versus steady state operation. It is the process or control engineer’s job to take the operator input and apply it appropriately based on his or her understanding of the transition control configuration and tuning. In order to have some expectation of what can be achieved with automatic transition control the following figure provides an example of a paper machine in which automatic grade change was commissioned. The two transitions that are compared are similar changes in sheet weight and speed. The manual transition was completed by manually moving the stock flow and steam pressure while the machine speed was increased. The majority of the weight change is achieved by increasing the machine speed. The manual transition time of 22.3 min was limited by the reel moisture which was upset by the manual stock flow and steam pressure changes. The automatic transition time of 15.8 min (30% reduction in transition time) was limited by the sheet dry weight. It is important to note that as part of the automatic transition control implementation the stock flow level 1 PID flow controller response time was dramatically improved by a factor of 10, which also helped with overall MD weight control recovery during and after the transition ramp completed. Another notable feature of the automatic transition control is that the stock flow change included a transient response model to help minimize the moisture upset that is related to fan pump changes required to maintain the headbox jet to wire ratio during the large speed increase.
Control Systems 2012 Page 566
Weight(Dry)
Reel Moisture
Stock Flow
Reel Steam
Wire Speed
120.00
140.00
160.00
5.00
5.50
6.00
6.50
52.00
54.00
56.00
58.00
60.00
0.50
1.00
1.50
2.00
2.50
300.00
350.00
29.17 33.33 37.50 41.67 45.83 50 54.17 58.33
Multi controller viewW
eight(
Dry
)Ree
l Mois
ture
Sto
ck F
low
Ree
l Ste
amW
ire
Spee
d
Minutes
Weight(Dry)
Reel Moisture
Stock Flow
Reel Steam
Wire Speed
120.00
140.00
160.00
5.00
5.50
6.00
6.50
52.00
54.00
56.00
58.00
60.00
0.50
1.00
1.50
2.00
2.50
300.00
350.00
58.33 62.50 66.67 70.83 75 79.17 83.33 87.50
Multi controller view
Wei
ght(
Dry
)Ree
l Mois
ture
Sto
ck F
low
Ree
l Ste
amW
ire
Spee
dMinutes
Stock f low total response time of 11.4 min is quite slow (closed loop time constant of approx. 172 sec)
Stock f low total response time improved down to 1 min (closed loop time constant of approx. 17 sec)
Dry Weight
Reel Moisture
Stock flow
Reel Steam
Speed
Dry Weight
Reel Moisture
Stock flow
Reel Steam
Speed
22.3 min 15.8 min
Manual Grade Change Auto Grade Change
Reel steam manually moved by operator
Reel steam PV appears to be SP feedback
Figure 1: Example of manual and corresponding automatic transition control improvements
Stock Blending Both the stock blending and stock approach sections are typically under the general stock preparation area. When considering paper machine transitions the stock blending percentages are frequently changed and the resulting combined stock furnish can affect transition performance in one or more of the following ways.
• Stock blending control is commonly done at a high level as flow or dry fiber percentages. The low level control of each furnish flow input should be tuned with a similar response time so that the stock blending chest level can be properly maintained during the transition.
• When stock furnish percentages are changed for an upcoming transition the timing of these changes need to be coordinated with the actual transition on the paper machine such that the new grade furnish recipe is at the wet end for the start of the paper machine transition.
• A change in the stock furnish percentages or amount of fiber refining may have a noticeable effect on the ability to remove water from the sheet and this will typically show up as a main (upstream) drying section steam pressure steady state change.
• Additives (e.g. fillers) that are added at the blend chest or prior to the machine chest may also change significantly before or during the transition. Typically additives added at the blend chest will not change the effective sheet weight, moisture, and ash on the paper machine quickly but a steady state change will occur over a longer period of time based on the blend chest or machine chest tank turn over time (e.g. total response time may be on the order of 30 – 40 minutes).
The addition of fillers (e.g clay, PCC “Precipitated Calcium Carbonate”, GCC “Ground Calcium Carbonate”, ….) in or after the blend chest can be difficult to deal with during a transition. Because the response time is quite slow from mixing in the blend / machine chest the overall ash change on the paper machine can be much longer than the transition time for sheet weight and moisture. Some mills may have a filler addition point after the machine chest (e.g. screen or fan pump addition point) but this may cause issues with first pass retention and overall sheet stability because of the short mixing time or interaction with other additives prior to forming the sheet. The following figure shows an example of a transition in
Control Systems 2012 Page 567
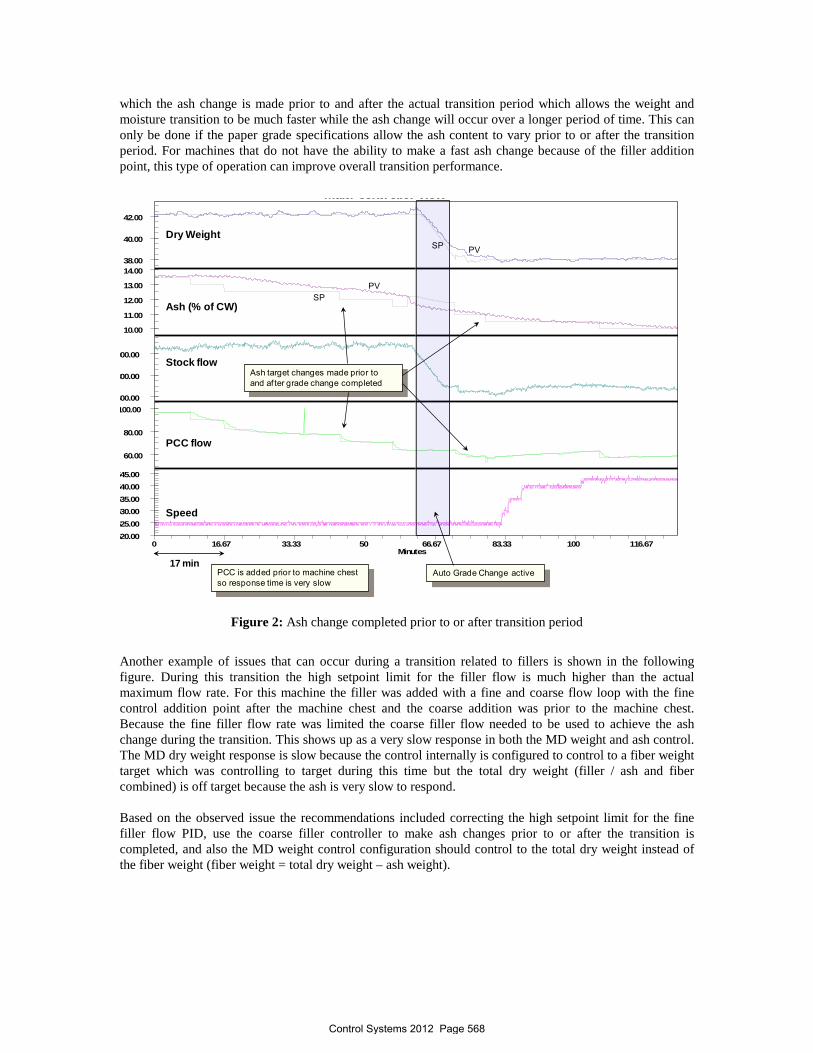
which the ash change is made prior to and after the actual transition period which allows the weight and moisture transition to be much faster while the ash change will occur over a longer period of time. This can only be done if the paper grade specifications allow the ash content to vary prior to or after the transition period. For machines that do not have the ability to make a fast ash change because of the filler addition point, this type of operation can improve overall transition performance.
38.00
40.00
42.00
10.00
11.00
12.00
13.00
14.00
600.00
800.00
000.00
60.00
80.00
100.00
520.00
525.00
530.00
535.00
540.00
545.00
0 16.67 33.33 50 66.67 83.33 100 116.67
Multi controller view
Minutes
Dry Weight
Ash (% of CW)
Stock flow
PCC flow
Speed
SPPV
SP PV
Ash target changes made prior to and af ter grade change completed
PCC is added prior to machine chest so response time is very slow
17 minAuto Grade Change active
Figure 2: Ash change completed prior to or after transition period
Another example of issues that can occur during a transition related to fillers is shown in the following figure. During this transition the high setpoint limit for the filler flow is much higher than the actual maximum flow rate. For this machine the filler was added with a fine and coarse flow loop with the fine control addition point after the machine chest and the coarse addition was prior to the machine chest. Because the fine filler flow rate was limited the coarse filler flow needed to be used to achieve the ash change during the transition. This shows up as a very slow response in both the MD weight and ash control. The MD dry weight response is slow because the control internally is configured to control to a fiber weight target which was controlling to target during this time but the total dry weight (filler / ash and fiber combined) is off target because the ash is very slow to respond. Based on the observed issue the recommendations included correcting the high setpoint limit for the fine filler flow PID, use the coarse filler controller to make ash changes prior to or after the transition is completed, and also the MD weight control configuration should control to the total dry weight instead of the fiber weight (fiber weight = total dry weight – ash weight).
Control Systems 2012 Page 568

50.00
51.00
52.00
53.00
14.00
16.00
18.00
500.00
600.00
40.00
60.00
80.00
100.00
600.00
650.00
700.00
750.00
800.00
4.10
4.20
4.30
4.40
50 58.33 66.67 75 83.33 91.67 100 108.33 116.67 125
Multi controller view
Minutes
Weight control is af fected by slow ash response
Clay setpoint is way above max measurement. Maximum clay setpoint set incorrectly
Stock consistency decrease also contributes to slow weight recovery with drystock disabled
Dry Weight
Ash (% of CW)
Stock flow
Fine Clay flow
Speed
Stock Consistency
SP
PV
SP
PV
SP
PV
8 min
Figure 3: Filler flow limit and overall effect on MD weight and ash control
Stock Approach The definition of the stock approach system for this discussion is from the machine chest through the thin stock delivery to the paper machine headbox. Based on this, the two key process measurements that must be investigated for transitions are thick stock flow and thick stock consistency. The following points need to be considered regarding transitions and the stock approach area.
• Acceptable stock flow level 1 PID control is one of the keys to successful transitions. The total automatic setpoint response time should be in the order of 30 to 80 sec (closed loop time constant of 8 to 20 sec).
• Machines with dual stock valve actuators (fine and coarse stock valves) will likely run into issues during transitions when the fine control loop becomes limited and needs to be re-ranged. During transitions the stock flow change should be completed directly with the coarse valve.
• Using valve position feedback or inferred stock flow from valve position as stock flow PID PV (process value) is not acceptable for transitions because the flow curve is nonlinear relative to valve position and normally not implemented correctly in controller (e.g. simple gain conversion).
• Stock consistency measurement between the machine chest pump and fan pump can be very helpful in maintaining correct dry fiber flow at the stock valve by using a drystock feed forward5
• If significant fillers / additives are added or the furnish blending changes significantly in the stock approach before or during the transition this might affect the consistency measurement instrument performance based on the type used (e.g. mechanical blade, mechanical rotary, microwave, optical,
but the consistency transmitter needs to be continuously monitored for calibration issues.
Control Systems 2012 Page 569
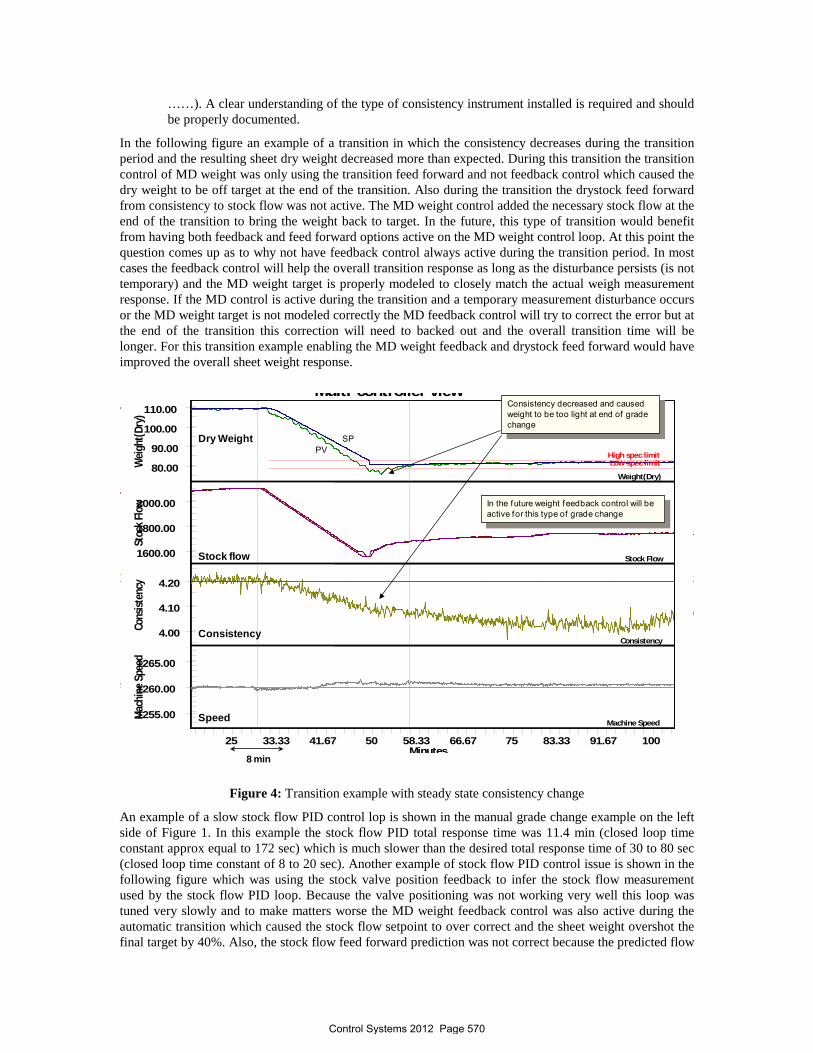
……). A clear understanding of the type of consistency instrument installed is required and should be properly documented.
In the following figure an example of a transition in which the consistency decreases during the transition period and the resulting sheet dry weight decreased more than expected. During this transition the transition control of MD weight was only using the transition feed forward and not feedback control which caused the dry weight to be off target at the end of the transition. Also during the transition the drystock feed forward from consistency to stock flow was not active. The MD weight control added the necessary stock flow at the end of the transition to bring the weight back to target. In the future, this type of transition would benefit from having both feedback and feed forward options active on the MD weight control loop. At this point the question comes up as to why not have feedback control always active during the transition period. In most cases the feedback control will help the overall transition response as long as the disturbance persists (is not temporary) and the MD weight target is properly modeled to closely match the actual weigh measurement response. If the MD control is active during the transition and a temporary measurement disturbance occurs or the MD weight target is not modeled correctly the MD feedback control will try to correct the error but at the end of the transition this correction will need to backed out and the overall transition time will be longer. For this transition example enabling the MD weight feedback and drystock feed forward would have improved the overall sheet weight response.
Low spec limitHigh spec limit
Weight(Dry)
Stock Flow
Consistency
Machine Speed
80.00
90.00
100.00
110.00
1600.00
1800.00
2000.00
4.00
4.10
4.20
1255.00
1260.00
1265.00
25 33.33 41.67 50 58.33 66.67 75 83.33 91.67 100
Multi controller view
Wei
ght(D
ry)
Stoc
k Flo
wCo
nsist
ency
Mac
hine
Spe
ed
Minutes
Consistency decreased and caused weight to be too light at end of grade change
In the future weight feedback control will be active for this type of grade change
Dry Weight
Stock flow
Consistency
Speed
SPPV
8 min
Figure 4: Transition example with steady state consistency change
An example of a slow stock flow PID control lop is shown in the manual grade change example on the left side of Figure 1. In this example the stock flow PID total response time was 11.4 min (closed loop time constant approx equal to 172 sec) which is much slower than the desired total response time of 30 to 80 sec (closed loop time constant of 8 to 20 sec). Another example of stock flow PID control issue is shown in the following figure which was using the stock valve position feedback to infer the stock flow measurement used by the stock flow PID loop. Because the valve positioning was not working very well this loop was tuned very slowly and to make matters worse the MD weight feedback control was also active during the automatic transition which caused the stock flow setpoint to over correct and the sheet weight overshot the final target by 40%. Also, the stock flow feed forward prediction was not correct because the predicted flow
Control Systems 2012 Page 570

did not actually match the actual stock flow PV from the fact that the predicted valve curve did not match the actual installed valve to flow curve.
100
105
110
115
120
1700
1800
1900
2000
1170
1175
1180
58.33 66.67 75 83.33 91.67 100 108.33
Multi controller view
Wei
ght(
Dry)
Stoc
k Fl
owM
achi
ne S
peed
Minutes
Reel Dry Weight
Stock Flow
Speed
SPInferred Flow
Stock f low setpoint is increased by MD weight feedback control during grade change by too much because stock f low level 1 is too slow and f low measurement is inferred f rom valve position
Weight overshoot by 40%
MD weight feedback was active during this grade change
8 min
Figure 5: Transition example with stock flow control using inferred flow from valve position
Wet End The wet end of the paper machine includes the headbox and wire forming section. This is another critical area when considering transition performance. In many cases a transition will include significant changes in machine speed which in turn requires the headbox jet velocity to also change by a similar amount in order to maintain the jet to wire ratio or headbox rush drag. The thin stock flow rate into the headbox is changed by means of a variable speed fan pump or some type of bypass flow control loop. The resulting change in the head box pressure is typically not as fast as the corresponding wire speed change which will result in an upset in the overall jet to wire ratio measurement. The following points must be considered when evaluating transition performance at the wet end section of the paper machine.
• The wet end of the paper machine is the initial point at which the machine speed control must first be evaluated. Some transitions will require a speed change of 20 to 30% of the starting speed in order to achieve a significant sheet weight change. The speed controller ramp rate needs to be able to achieve values in the range of 0.4 to 0.8 ft/min/sec (0.12 m/min/sec to 0.25 m/min/sec).
• Any vertical slice change made during the transition should be completed slowly. This can be done by applying a setpoint ramp rate to slice PID controller or through the automatic transition controller.
• The headbox total head pressure PID controller should be tuned such that the response time is fast enough to keep up with any speed changes that occur during the transition. Expected total response time should be in the range of 50 – 160 sec (closed loop time constant of 12 to 40 sec). In many cases having a feed forward from the machine speed setpoint to the total head PID controller will also help with this.
Control Systems 2012 Page 571

• There is frequently a noticeable temporary response from the total head pressure to the sheet moisture and dry weight for air pad headboxes (liquid level control) and dilution headboxes that can cause a significant upset in the sheet moisture and affect the dry weight response relative to the modeled sheet weight target response[6] [7
• First pass retention changes related to filler, additive, or furnish changes can have a noticeable effect on the overall weight and moisture response during and after the transition period. Ability to continuously measure the headbox and white water total as well as filler consistencies may be helpful to compensate for changes in the first pass retention. Care must be taken to insure these consistency instruments are kept calibrated and are measuring as expected because they can cause more variability in the transition if not working as expected.
]. The automatic transition control must have the ability to properly model and compensate for this type of response.
The following figure provides an example of a transition in which the size (upstream) moisture has a noticeable disturbance increases from 2.2 to 3.2% (45% increase) during the transition. Looking at the headbox rush drag (jet velocity minus wire speed) there is a noticeable upset in the beginning and end of the speed and total head setpoint ramp period. Further inspection of the speed control loop reveals that the speed controller is tuned quite slow and is lagging the total head controller which results in the headbox rushing too much at the start of the speed ramp and dragging too much at the end of the speed ramp. The speed level 1 PID total response time is too slow at 200 sec (time constant of 50 sec) compared to the expected total response time of 10 to 20 seconds. Note that the speed is always a rate limited controller and the measurement ramp rate will dominate the overall response time. The recommended controller response time is considered based on a small speed setpoint change. The speed setpoint ramp rate must be set correctly for the large speed change that can occur during a transition. A way to approximate the speed level 1 closed loop controller response time is by calculating the effective time delay (lag) between the speed setpoint and measurement during the transition ramping period. It is also important to note that the stock flow decreased during the transition which would not contribute to the size moisture increase. The size steam pressure decreased which could have contributed to the size moisture being too wet during the transition but steady state steam pressure after the ramp completed was fairly close to the steam setpoint at the end of the ramping period. Another transition on the same machine in which the machine speed did not change was compared in an overlap trend to the one in the following figure and is shown in Figure 7. The size moisture upset is minimal when the speed remained constant during the example transition (green trend lines) compared to size moisture upset when the machine speed was increased by 110 ft/min (33 m/min) (blue trend lines). In order to properly address the headbox control upset that is occurring during transitions the PID tuning of the speed controller response needs to be improved and the speed to total head feed forward capability, if available, should also be re-tuned.
Control Systems 2012 Page 572

Size Moisture
Sec 5
Headbox
Total Head
Stock
Speed
1.00
2.00
3.00
80.00
85.00
-20.00
-15.00
-10.00
-5.00
110.00
115.00
120.00
125.00
130.00
4500.00
4600.00
4700.00
4800.00
1550.00
1600.00
1650.00
45.83 50 54.17 58.33 62.50 66.67 70.83 75 79.17 83.33 87.50 91.67 95.83
ut co t o e e
Size
Moi
stur
eSe
c 5He
adbo
xTo
tal H
ead
Stoc
kSp
eed
Minutes
Size Moisture
Size Steam Pressure
Stock flow
Total Head Pressure
Speed
Headbox (Rush – Drag)
Speed level 1 PID total response time is too slow at 200 sec (time constant of 50 sec)
SP
PV
SP
PV
Slow speed and headbox control response is contributing to size moisture upset
4 min
Figure 6: Transition example headbox and size moisture control upset
pm_2009-1-1_8-52-37 pm_2009-2-21_4-34-3
pm_2009-1-1_8-52-37 pm_2009-2-21_4-34-3
pm_2009-1-1_8-52-37 pm_2009-2-21_4-34-3
-20.00
-15.00
-10.00
-5.00
1.00
1.50
2.00
2.50
3.00
1560.00
1580.00
1600.00
1620.00
1640.00
1660.00
1680.00
45.83 50 54.17 58.33 62.50 66.67 70.83 75 79.17 83.33 87.50 91.67 95.83
Head
box
Size
Moi
stur
e
Spee
d
Minutes
Two transitions are compared on same machine to show ef fect of machine speed and headbox control on size moisture
Green – no speed changeBlue – 110 f t/min speed change
Size Moisture
Speed
Headbox (Rush – Drag)
4 min
Figure 7: Comparison of transitions with and without speed change on same machine
Control Systems 2012 Page 573
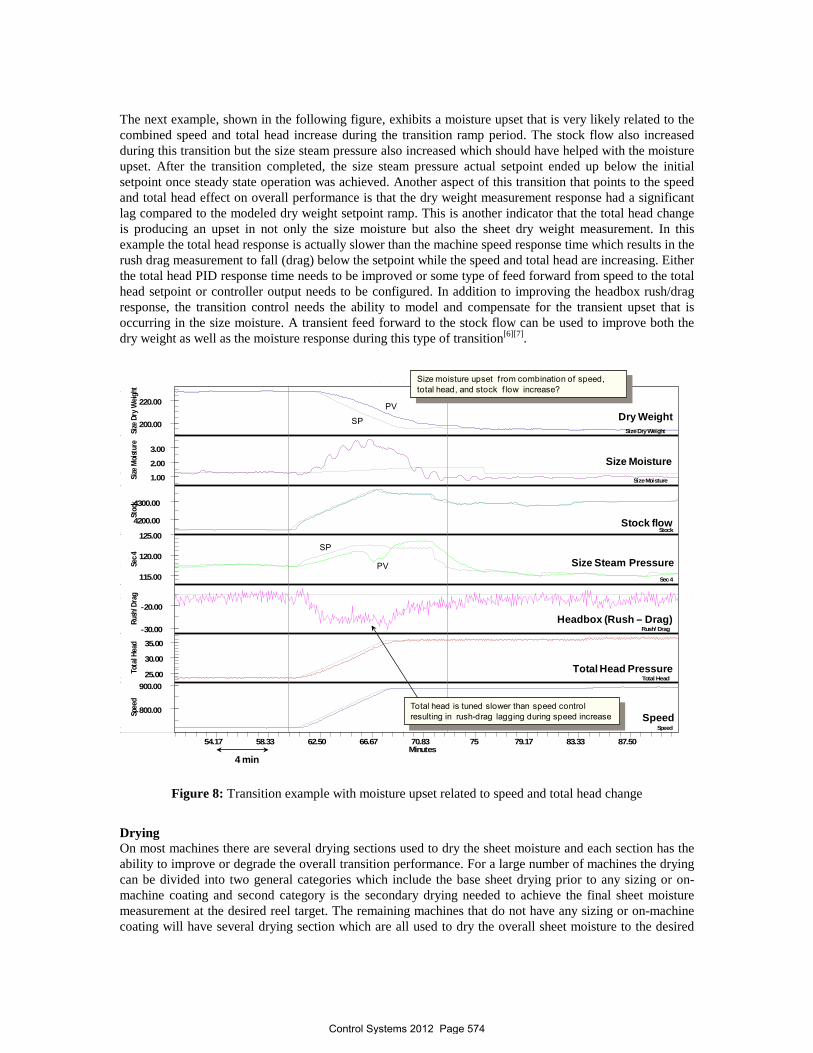
The next example, shown in the following figure, exhibits a moisture upset that is very likely related to the combined speed and total head increase during the transition ramp period. The stock flow also increased during this transition but the size steam pressure also increased which should have helped with the moisture upset. After the transition completed, the size steam pressure actual setpoint ended up below the initial setpoint once steady state operation was achieved. Another aspect of this transition that points to the speed and total head effect on overall performance is that the dry weight measurement response had a significant lag compared to the modeled dry weight setpoint ramp. This is another indicator that the total head change is producing an upset in not only the size moisture but also the sheet dry weight measurement. In this example the total head response is actually slower than the machine speed response time which results in the rush drag measurement to fall (drag) below the setpoint while the speed and total head are increasing. Either the total head PID response time needs to be improved or some type of feed forward from speed to the total head setpoint or controller output needs to be configured. In addition to improving the headbox rush/drag response, the transition control needs the ability to model and compensate for the transient upset that is occurring in the size moisture. A transient feed forward to the stock flow can be used to improve both the dry weight as well as the moisture response during this type of transition[6][7].
Size Dry Weight
Size Moisture
Stock
Sec 4
Rush/Drag
Total Head
Speed
200.00
220.00
1.00
2.00
3.00
4200.00
4300.00
115.00
120.00
125.00
-30.00
-20.00
25.00
30.00
35.00
800.00
900.00
54.17 58.33 62.50 66.67 70.83 75 79.17 83.33 87.50
ut co t o e e
Size
Dry
Wei
ght
Size
Moi
stur
eSt
ock
Sec 4
Rush
/Dra
gTo
tal H
ead
Spee
d
Minutes
Size Moisture
Size Steam Pressure
Stock flow
Total Head Pressure
Speed
Headbox (Rush – Drag)
Dry Weight
Total head is tuned slower than speed control resulting in rush-drag lagging during speed increase
Size moisture upset f rom combination of speed, total head, and stock f low increase?
SP
PV
SP
PV
4 min
Figure 8: Transition example with moisture upset related to speed and total head change
Drying On most machines there are several drying sections used to dry the sheet moisture and each section has the ability to improve or degrade the overall transition performance. For a large number of machines the drying can be divided into two general categories which include the base sheet drying prior to any sizing or on-machine coating and second category is the secondary drying needed to achieve the final sheet moisture measurement at the desired reel target. The remaining machines that do not have any sizing or on-machine coating will have several drying section which are all used to dry the overall sheet moisture to the desired
Control Systems 2012 Page 574

target at the reel of the machine. The following points need to be considered when evaluating transition performance related to dryer sections.
• All drying sections need to be evaluated when considering transition performance. Looking at only the steam section directly controlled by MD moisture control loops will likely miss issues with section that are using a ratio, bias, or controlled separately.
• Always start with the most upstream moisture section when evaluating and improving moisture response during transitions. This is normally the size moisture and typically will include 3 to 5 dryer sections that control the effective size moisture. If there are issues with the size moisture response it is almost guaranteed that the reel moisture response will also be affected in a similar way.
• For effective control of upstream moisture all of the dryer sections should be tied together by a bias or ratio in order to effectively control the size moisture during the transition. This typically does not include the first or second steam sections which are usually less than three dryer cans each and are used to warm up the sheet when entering the main drying sections.
• The overall steam pressure load in the drying sections may change significantly during the transition and this can cause a load upset on the boiler that is supplying the steam to the paper machine. If the boiler cannot keep up with the steam change during the transition this may cause a boiler trip or major upset in the steam header. If the boiler is limited the steam setpoint ramp rate during transitions may need to be set appropriately or tuning improvements to the boiler itself might be needed.
• Operators are always trying to find a way to make manual changes to one or more of the steam sections during automatic transitions. In many case these steam changes are only going to add variability to the moisture response because there are so many other changes occurring at the same time (e.g. weight change, speed change, ash change, ….). There are times though that manual changes can help and preventing the operators from being able to make manual steam changes will likely reduce the automatic transition control utilization.
• Being able to predict the new steam pressure section setpoint for an automatic transition is quite challenging. On most machines the process model used for the machine direction (MD) control is not adequate for the steam pressure prediction in the automatic transition control tuning. Historical data can be used to estimate a more appropriate model and in several cases the moisture modeling may need to be separated into groups based on one or combination of the following categories.
o Any manual steam changes to section that are not under automatic transition control or addition or removal of dryer cans based on paper grade being produced
o Changes in stock / furnish blending which will affect the overall drying rate of the sheet
o Changes to the wet press loading or average steambox setpoint changes
o The effective production rate based on the sheet weight and machine speed
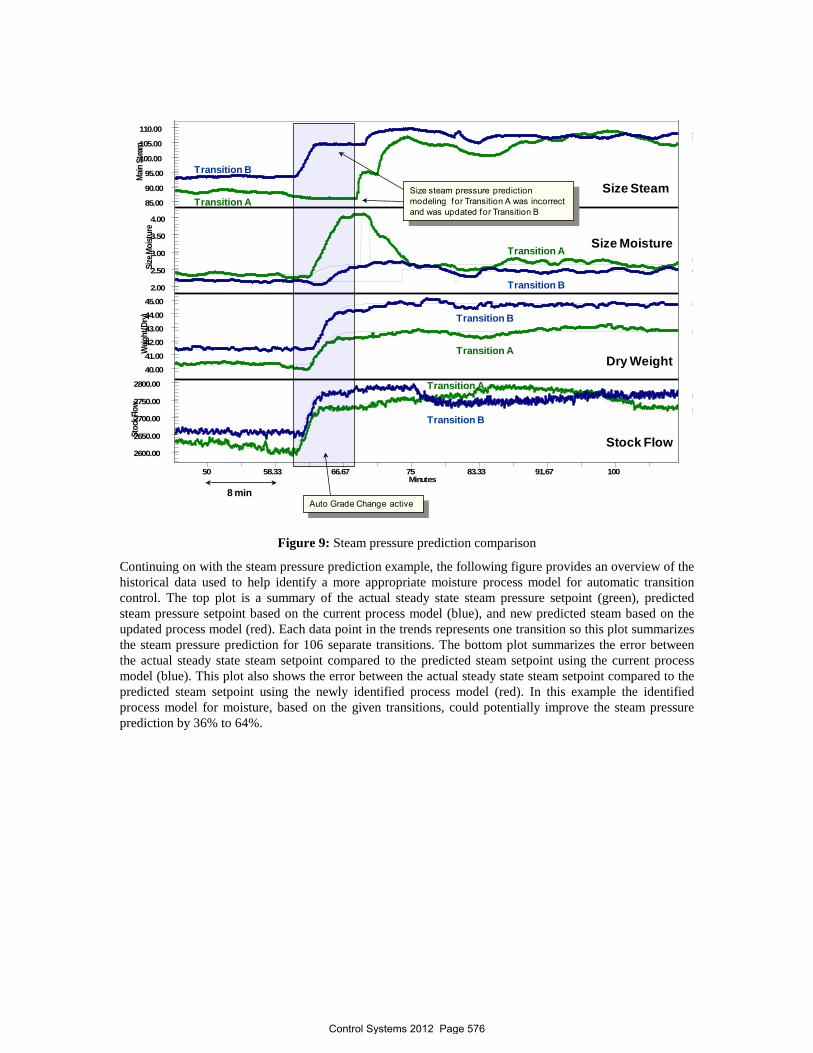
o The amount of filler / ash in the sheet which affects the overall drying rate The following figure shows an example of a two transitions that had similar sheet weight changes but differ by the process model that was used for the steam pressure prediction. In Transition A (green trends) the predicted steam pressure of 87 psi (599 kPa) was actually slightly less than the initial value of 90 psi (620 kPa) and the actual steady state setpoint was more on the order of 105 psi (723 kPa). For this transition the moisture was quite wet during the transition and once the feedback control became active at the end of the transition the needed steam was added in order to bring the moisture back to target. In Transition B (blue trends) the moisture model had been updated based on historical transition data and the new predicted steam setpoint was much closer to the actual steady state setpoint. Note that both transitions were completed with the MD moisture feedback control disabled during the transition ramping in order to more clearly identifiy the accuracy of the moisture process model that was being used for each transition feed forward.
Control Systems 2012 Page 575
85.00
90.00
95.00
100.00
105.00
110.00
2.00
2.50
3.00
3.50
4.00
40.00
41.00
42.00
43.00
44.00
45.00
2600.00
2650.00
2700.00
2750.00
2800.00
50 58.33 66.67 75 83.33 91.67 100
Main
Ste
amSi
ze M
oist
ure
Weig
ht(D
ry)
Stoc
k Flo
w
Minutes
Size Steam
Size Moisture
Dry Weight
Transition B
Transition A
Transition B
Transition A
Transition B
Transition A
Size steam pressure prediction modeling for Transition A was incorrect and was updated for Transition B
Stock Flow
Transition B
Transition A
Auto Grade Change active8 min
Figure 9: Steam pressure prediction comparison
Continuing on with the steam pressure prediction example, the following figure provides an overview of the historical data used to help identify a more appropriate moisture process model for automatic transition control. The top plot is a summary of the actual steady state steam pressure setpoint (green), predicted steam pressure setpoint based on the current process model (blue), and new predicted steam based on the updated process model (red). Each data point in the trends represents one transition so this plot summarizes the steam pressure prediction for 106 separate transitions. The bottom plot summarizes the error between the actual steady state steam setpoint compared to the predicted steam setpoint using the current process model (blue). This plot also shows the error between the actual steady state steam setpoint compared to the predicted steam setpoint using the newly identified process model (red). In this example the identified process model for moisture, based on the given transitions, could potentially improve the steam pressure prediction by 36% to 64%.
Control Systems 2012 Page 576

Parameter Current Recommended
SP Moisture wrt 5th sec – Proc Gain
-0.0283 -0.1600
SP Moisture wrt Stock Flow –Proc Gain
0.0021 0.0123
SP Moisture wrt Machine Speed –Proc Gain
-0.0008 -0.0019
Potential Size Steam Pressure prediction improvement of 36% to 64%
Summary of current and new size steam pressure prediction for 106 grade changes
Figure 10: Steam pressure prediction historical data for modeling
An example of how the operator can manually change the steam pressure setpoint during a transition is shown in the following figure. In this example the operator tries to manually decrease the size steam setpoint in order to bring the moisture up to target but the net effect is the moisture is then too wet and the operator must then increase the steam pressure. This is a case in which leaving the steam pressure setpoint under automatic control would have reduced the time needed to settle out the moisture at the new product target. This example also shows the high correlation between the upstream (size) and downstream (reel) moisture measurements. Improving the size moisture response during transitions will automatically improve the reel moisture response on this machine.
Control Systems 2012 Page 577

Size Moisture
Reel Moisture
Size Steam
Reel Steam
Stock Flow
Speed
8.00
10.00
12.00
14.00
8.00
10.00
12.00
15.00
20.00
10.00
20.00
4400.00
4600.00
4800.00
3700.00
3720.00
3740.00
3760.00
58.33 66.67 75 83.33 91.67 100 108.33 116.67
Multi controller view
Size
Moi
stur
eRe
el M
oist
ure
Size
Ste
amRe
el St
eam
Stoc
k Flo
wSp
eed
Minutes
8 min
Reel Moisture
Reel Steam Pressure
Size Steam Pressure
Speed
Stock Flow
Size Moisture
Manual setpoint changes to size steam pressure by operator
High correlation between size and reel moisture measurements
Figure 11: Example of manual steam pressure changes during transition
Reel and Paper Test Lab The reel and paper test lab are the points at which the final quality measurements are made on sheet. As mentioned in the previous sections, the weight and moisture measurements are the main focus of transition performance and improvements. In addition to the weight and moisture measurements the following points need to be considered:
• In some cases there are other online reel scanner measurements or paper test lab measurements that must be within defined specifications prior to making a sellable sheet. Some of these measurements include but are not limited to brightness, color, caliper, tensile, burst, formation, etc… When quantifying transition performance it is important to include any of these online measurements. The paper test lab measurements can be more challenging because they are not continuous and only made on demand from paper samples taken for the reel.
• It is important to also include cross direction (CD) profile performance as part of the transition
troubleshooting and performance. The sheet profile variability may be significant upset during the machine direction transition and may limit the overall transition time. The calculated profile variability (e.g. 2-sigma) is an overall measure that can be used to identify when the profile is not within the desired specifications. Another possible measure of the profile may be maximum deviation of profile points above or below the MD target (profile average target).
• During most transitions the online sensor calibration slope and offset values may change. If these values are not set correctly based on a good sensor correlation the magnitude of the change may result in an unwanted online measurement change and if the MD feedback control is enabled the level 1 PID may also change more than expected.
Control Systems 2012 Page 578

• Many QCs system will automatically force scanner standardize (off-sheet calibration) at the start of
the transition which from an operations perspective is a bad time to not know the current sheet measurement. In almost all cases this standardize period can be delayed to a point when the machine has settled on the new grade.
Benchmark Transitions All of the discussion and examples up to this point have been used to present issues that occur during transitions. In order to have some reference of what might be considered an acceptable transition the quantification of key performance indicators can be used to identify such transitions. The following two figures provide some examples of transitions that were ranked as desirable performance and can be used as a benchmark when considering future transition performance. It is important to note that even though these transition examples have acceptable performance there is still some room for improvement in each provided example. The first example benchmark transition is a 20 lb (32 gsm) weight and 360 fpm (110 m) speed change which finished in 16 minutes. The effective speed ramp rate for this transition was 0.5 ft/min/sec (0.15 m/min/sec) and the effective weight ramp rate was 1.25 lbs/min (2.0 gsm/min). During this transition both the MD weight and MD moisture feedback control were active in addition to the automatic transition feed forward action. One possible improvement may be related to the MD reel moisture recovery time which appeared to be somewhat slower than expected.
Weight (Dry weight)
Reel Moist
Stock
Reel Steam
Speed
Consistency
50.00
60.00
3.504.00
4.50
5.005.50
1600.00
1700.00
1800.00
1900.00
21.00
22.00
23.00
24.00
1500.00
1600.00
1700.00
1800.00
4.10
4.20
4.30
4.40
54.17 58.33 62.50 66.67 70.83 75 79.17 83.33 87.50 91.67 95.83 100
Wei
ght (
Dry w
eigh
t)Re
el M
oist
Stoc
kRe
el S
team
Spee
dCo
nsist
ency
Minutes
Both feed forward and feedback control enabled during AGC
Dry Weight (44% change)
Reel Moisture
Stock flow
Reel Steam
Speed (20% change)
Stock Consistency
16 min
20 lb weight and 360 fpm speed change f inished in 16 min (0.5 f t/min/sec speed rate limit)
Figure 12: Benchmark transition example 1
The second example benchmark transition is a 39 lb (62.4 gsm) weight and 250 fpm (76 m) speed change which finished in 16 minutes. The effective speed ramp rate for this transition was 0.4 ft/min/sec (0.12 m/min/sec) and sheet weight ramp rate was 2.4 lbs/min (3.9 gsm/min). During this transition both the MD
Control Systems 2012 Page 579

weight and MD moisture feedback control were suspended while the automatic transition feed forward ramping was active. Some notable improvements may be related to the stock flow and reel steam pressure prediction values which were off slightly at the end of the transition ramping period. The stock flow was 20 gpm (75 lpm) below and the reel steam pressure was 5 psi (34 kPa) below the final steady state setpoint values. Another possible improvement would be to enable both the MD weight and MD moisture feedback control during the transition ramp period.
Weight(Dry)
Size Moisture
Stock Flow
4th sec Steam
Machine Speed
Consistency
140.00
160.00
1.00
2.00
3.00
2050.00
2100.00
2150.00
2200.00
55.00
60.00
65.00
70.00
800.00
900.00
1000.00
4.00
4.10
4.20
58.33 66.67 75 83.33 91.67 100 108.33
Multi controller view
Weig
ht(D
ry)
Size
Moi
stur
eSt
ock F
low
4th
sec S
team
Mac
hine
Spe
edCo
nsist
ency
Minutes
Only feed forward control enabled during AGC
Dry Weight (29% change)
Size Moisture
Stock flow
Size Steam
Speed (24% change)
Stock Consistency
14 min
39 lb weight and 250 fpm speed change f inished in 14 min (0.4 f t/min/sec speed rate limit)
Figure 13: Benchmark transition example 2
While the preceding transitions are appropriate benchmarks for acceptable transition performance, it is important to realize that every paper machine has unique challenges when considering transitions. For example a heavy weight packaging board machine may have significantly different challenges around transition performance when compared to a fine writing machine. Sheet properties such as strength and brightness would likely differ greatly when considering a sellable sheet. On the other hand though there are many common factors for all machines when considering transition performance and a comprehensive list of these common factors have been presented in this paper. Continuous Monitoring Now that the process of troubleshooting transition performance has been presented a method to quantify transition performance can be used to quickly point out transitions that need to be subjected to the troubleshooting process. Similar to many currently available PID control loop performance monitoring packages, paper machine transition performance monitoring can be used to provide the needed continuous measure. The following figure provides an example historical transition performance. The performance is quantified based on a single normalized key performance indicator (KPI) which is a combination of the individual performance indices[4]. Examples of individual performance index are transition time, average sheet weight ramp rate, maximum moisture deviation from average, and magnitude of speed change. Each individual index can be normalized based on the perceived range for a particular machine. The range for this overall KPI measure is from zero to one with zero being poor performance and one being the best possible performance.
Control Systems 2012 Page 580

Each data point is a KPI measure for one transition
1.0 = All performance indices have been met (good)0.0 = None of the performance indices have been met (bad)
Desired Limit
Figure 14: Continuous Monitoring of Transition Performance
Conclusion As previously mentioned, the need for successful grade change transitions is a critical component of day to day machine operations. This has driven the need for machines to be equipped with automatic transition control but the ability to identify and correct issues with transitions is not always well understood. With improved process data gathering techniques and storage, many machines already have the capability to collect the needed process data to visualize and quantify transition performance. This paper has presented a set of guidelines and generalized process steps that can be used to troubleshoot paper machine transition (grade change) performance. Production still has the choice of manual and automatic transition operation and when either type of transition does not complete as expected the process or quality engineer can reference the presented information to help identify what root causes in the areas of stock blending, stock approach, wet-end, drying, reel, and / or paper test lab are causing unsatisfactory performance. In the end, there are a large number of potential reasons for a transition to not work as expected and a systematic approach like the one presented is required to successfully diagnostic and implement a solution to improve transition performance.
Control Systems 2012 Page 581

1 T.F. Murphy and S.-C. Chen, "Transition Control of Paper-making Processes: Paper Grade Change", 1999 IEEE CCA and CACSD Conference, Kohola Coast, HI, Aug. 22-27, 1999, pp. 1278-1283. 2 David Lang, Jukka Nokelainen, Timo Rantala, Taisto Huhtelin, Lin Tian, and Risto Kuusisto, “Multivariable Controller Integrating Traditional Scanner Feedback Controls with Wet End Measurements”, TAPPI 1998 Process Control, Electrical & Info. Conference Proceedings 3 T. Zheng(editor), D. Chu, M. Forbes, J. Backström, C. Gheorghe, and Stephen Chu, “Advance Model Predictive Control – Chapt 15: Model Predictive Control and Optimization for Papermaking Processes”, InTech, ISBN 978-953-307-298-2, June 2011 4 T.F Murphy, K. Starr, P. Tran, & T. Mast, “Quantifying Paper Machine Transition Performance”, PAPERCON 2008 Conference, May 5 – 7, 2008, Dallas, TX 5 K. Starr and T.F. Murphy, “Reducing Variability in the Thick Stock System”, TAPPI PaperCon’09 Conference, May 31 – June 3, 2009, St. Louis, MO 6 T.F. Murphy, R. Palumbo, and S.-C. Chen, “Reducing Production Loss From Paper Grade Change”, TAPPI 2000 Process Control, Electrical, and Information Conf., Williamsburg, VA, March 26-30, 2000, pp. 175-181 7 T.F. Murphy and S.C. Chen, “Fast Grade Change for Paper Making Processes”, Proceeding of Control Systems 2000, Victoria, British Columbia, May 1-4, pp. 189-192, 2000.
Control Systems 2012 Page 582