panama canal expansion - cip 3000
TRANSCRIPT

PANAMA CANAL EXPANSIONA Q U E S T I O N O F F U N D I N G
SUMMER 2005 MULTI-CLIENT STUDY
www.globalinsight.com

Panama Canal: A Question of Funding
Copyright © 2005, Global Insight
Ben G. Hackett Executive Managing Director International Trade & Transportation Washington, DC +1 202 481-9218 [email protected] Maria L.C. Bertram Associate Lexington, MA +1 781 301-9438 [email protected]
i

Panama Canal: A Question of Funding
Copyright © 2005, Global Insight
ii

Panama Canal: A Question of Funding
Copyright © 2005, Global Insight
Table of Contents Tables and Figures .............................................................................................................. v Executive Summary .......................................................................................................... vii
Key Assumptions ......................................................................................................... viii Chapter 1 - Overview of the Panama Canal........................................................................ 1
Overview......................................................................................................................... 1 Toll Structure .................................................................................................................. 2 Expansion........................................................................................................................ 4
Chapter 2 - Overview of the Panama Economy.................................................................. 7 Economic Development.................................................................................................. 7 Short – Term Forecast..................................................................................................... 7 President Torrijos’ Agenda ............................................................................................. 8 Growth ............................................................................................................................ 9 Inflation......................................................................................................................... 11 Monetary Policy............................................................................................................ 11 Fiscal Policy and Public Finances................................................................................. 12 Exchange Rates............................................................................................................. 12 Financial System........................................................................................................... 13 Trade and External Accounts........................................................................................ 13 Labor Markets............................................................................................................... 14 Natural Resources ......................................................................................................... 15 Economic Strategy ........................................................................................................ 15 Events to Watch ............................................................................................................ 16
Chapter 3 - Overview of Global Trade Through the Canal: Present and Future .............. 17 The Global Economy .................................................................................................... 17 Outlook for World Trade .............................................................................................. 17 Total World Cargo Trade.............................................................................................. 20 Total World Seaborne Cargo Trade.............................................................................. 20 Seaborne Trade by Region............................................................................................ 21 Trade on Panama Canal Routes .................................................................................... 24
Chapter 4 - Review of ACP Transits ................................................................................ 31 Canal Traffic ................................................................................................................. 31 Panamax Traffic............................................................................................................ 34 Toll Revenues ............................................................................................................... 34 Transit Scenarios........................................................................................................... 35
Chapter 5 – Review of ACP Financial Statements ........................................................... 39 Revenue Accumulation – The “Expansion Fund”........................................................ 39 Retained Earnings ......................................................................................................... 40 Remittances to the Panamanian Government ............................................................... 41 Creditworthiness ........................................................................................................... 42
Chapter 6 – Alternative By-Pass Options ......................................................................... 45 Chapter 7 - Potential Project Costs ................................................................................... 51 Chapter 8 - Financial Markets: Interest Rates and Forecasts............................................ 53 Chapter 9: Re-Defining the Panamax Vessel Size with Canal Expansion ....................... 57
The Post-Panamax Fleet ............................................................................................... 59
iii

Panama Canal: A Question of Funding
Copyright © 2005, Global Insight
Assessment of the Containership fleet transiting the Panama Canal............................ 61 Chapter 10 - Financial Model and Scenarios.................................................................... 63
Key Assumptions .......................................................................................................... 63 Model Discussion.......................................................................................................... 64 Issues in Project Financing ........................................................................................... 67
Chapter 11 - Risks............................................................................................................. 69 Appendix 1: Revenue Calculation .................................................................................... 72 Appendix 2: Transit Scenarios.......................................................................................... 73 Appendix 3: Toll Increase Sensitivity Analysis................................................................ 76 Appendix 4: Loan Repayments......................................................................................... 81 (C) Copyright 2005. ALL RIGHTS RESERVED. All information contained herein is obtained by GLOBAL INSIGHT, Inc. from sources believed by it to be accurate and reliable. All forecasts and predictions contained herein are believed by GLOBAL INSIGHT, Inc. to be as accurate as the data and methodologies will allow. However, because of the possibilities of human and mechanical error, as well as other factors such as unforeseen and unforeseeable changes in political and economic circumstances beyond GLOBAL INSIGHT’s control, the information herein is provided “as is” without warranty of any kind and GLOBAL INSIGHT, Inc., AND ALL THIRD PARTY PROVIDERS MAKE NO REPRESENTATIONS OR WARRANTIES EXPRESS OR IMPLIED TO ANY SUBSCRIBER OR ANY OTHER PERSON OR ENTITY AS TO THE ACCURACY, TIMELINESS, COMPLETENESS, MERCHANTABILITY OR FITNESS FOR ANY PARTICULAR PURPOSE OF ANY OF THE INFORMATION OR FORECASTS CONTAINED HEREIN.
iv

Panama Canal: A Question of Funding
Copyright © 2005, Global Insight
Tables and Figures Table 1.1:History of toll increases Table 1.2: Toll Increase Implementation Schedule Table 2.1: Economic Indicators Figure 2.1: Real GDP Growth Figure 2.2: Consumer Price Index Figure 2.3: Exchange Rates Table 2.2: Trading Partners Figure 2.4: Unemployment Rate Figure 3.1: Total Commodity Global Trade Growth Table 3.1: Growth Rates of Four Major Service Types - Ocean Freight Table 3.2: Seaborne Metric Tons (Millions) — Exports Table 3.3: Seaborne Metric Tons (Millions)—Imports Figure 3.2: Total Container Trade Figure 3.3: Growth Rates of Containerized Exports by Region Figure 3.4: Total Global Trade vs. Trade via the Panama Canal Figure 3.5: Total Commodities Imported to U.S. East Coast (Point of Origin) Figure 3.6: Total Commodities Imported to U.S. East Coast Figure 3.7: Total Commodities Imported to U.S. West Coast (Point of Origin) Figure 3.8: Total Commodities Imported to U.S. West Coast Figure 3.9: Total Commodities Imported to U.S. West Coast Figure 3.10: TEU Commodity Trade North Atlantic to Far East Figure 3.11: TEU Commodity Trade – 2005 vs. 2010 Figure 4.1: Transit Activity Through the Panama Canal Figure 4.2: Canal Traffic by Type of Vessel Figure 4.3: Average PC/UMS Net Tonnage Figure 4.4: Long Tons of Commercial Cargo by Route Figure 4.5: Revenue from Tolls Figure 4.6: Falling Transits but Rising Revenue Table 4.1: Containership Toll Schedule Figure 4.7: Total ACP Revenue from Market Potential and Scenario Analyses Table 4.2: No. of Commercial Transits and Revenue from Various Analyses Table 5.1: Annual Funds Remitted to the Investment Program Figure 5.1: Revenue by Ship Type (% change year ago) Table 5.2: Breakdown of Appropriated Retained Earnings Figure 5.2: Impressive Current Ratio Sustained Table 6.1: Additional Days to U.S. East Coast
Table 6.2: Comparative Transit Times Table 6.3: Costs associated with Traveling via Panama vs. Traveling via Suez Figure 8.1: 30-Year U.S. Treasury vs. LIBOR Figure 8.2: Key Interest Rates Figure 8.3: U.S. Treasury Rates Figure 9.1: The Future of the Containership Fleet
v
Panama Canal: A Question of Funding
Copyright © 2005, Global Insight
Figure 9.2: Size Distribution of the Full Container Fleet in TEU Terms in 2004 Figure 9.3: Size Distribution of the Full Container Fleet in TEU Terms in 2008 Table 9.1: Panamax Dimensions based on Proposed Lock Increases Table 9.2: Costs to Panamax Operators Table 9.3: Range of Ships Table 10.1: Financial Structure and Repayment of the Base Case Scenario Figure 10.1: Annual Loan Payment Repayment Schedule for the Base Case Scenario Table 10.2: Scenarios 1-6 Table 10.3: Necessary Annual Toll Increases at various Financing Rates
vi

Panama Canal: A Question of Funding
Copyright © 2005, Global Insight
Executive Summary As the Panama Canal Authority (ACP) considers a massive expansion program with cost estimates ranging from $4 to $10 billion, members of the international shipping community are left wondering if they will be the ones footing the bill and at what point other options become feasible. Not only does Global Insight’s study aim to forecast the impact that the canal expansion program may have on international shipping costs, but it considers issues facing the international financing community. How much debt can the ACP bear and at what cost to the international shipping community? Key findings of Global Insight’s analysis are as follows:
Tolls will rise as high as 272% over the next 20 years under a pessimistic financing scenario, although tolls are more likely to rise 128% (under the base case scenario). Tolls will have to rise steadily in the early years of the expansion project in order to avoid swinging increases 10 years out when the bulk of the project debt repayment surges upward. To avoid a balloon increase in tolls, the Canal will have to begin raising tolls in 2008 by 5.8% each year until the year 2029. (These forecasts assume a financing cost of LIBOR +400 basis points.)
Toll increases are sensitive to interest rates as well as total borrowing levels. If the canal does not experience large cost overruns and is able to receive favorable financing, expansion efforts with only mild toll increases are plausible.
The recent restructuring in tolls for containerships nearly equalizes the per TEU cost of traveling between the Panama and Suez Canals. With these toll increases, the additional steaming time required to travel through Suez will be virtually insignificant. Additionally, as investments are being made in other routes, Panama will have to utilize caution when raising tolls if it wants to maintain competitiveness.
Toll increases are based on Global Insight's assumption that traffic and ship size will continue to grow. Ultimately, containerships are footing the majority of the bill as they are charged a higher rate and are responsible for a large share of total traffic and tonnage.
The ACP has already begun saving funds for expansion, and with the recent restructuring in containership tolls the ACP will be able to add to its expansion fund quickly in the immediate years leading to construction. The per TEU toll will increase 16.7% between 2005 and 2006, followed by a 10.2% increase between 2006 and 2007. With the implementation of this toll, containerships are essentially financing expansion before construction even begins.
The majority of expansion costs will be borne by the shipping community over the next 15 years, for an asset with a lifespan of 75 years.
Given the Panama Canal’s slow cargo growth in the face of rapid global trade growth, the ACP may be overestimating the future demand for use of its canal.
vii

Panama Canal: A Question of Funding
Copyright © 2005, Global Insight
Key Assumptions Global Insight makes the following assumptions in its base case scenario:
Construction will begin in 2007 following an approval process and the finalization of a series of feasibility studies
The ACP will have accumulated $1 billion in an Expansion fund with which to offset project costs.
Project costs will equal $6 billion The ACP will borrow $5 billion over seven tranches The cost of borrowing will be current LIBOR +400 basis points, or 8%. The cost
of borrowing is held fixed throughout the repayment period. The ACP will have 15 years to repay each tranche
The first two assumptions listed above are fixed in each scenario. The remaining four assumptions vary over the six scenarios tested.
viii

Panama Canal: A Question of Funding
Copyright © 2005, Global Insight
Chapter 1 - Overview of the Panama Canal
Overview In 1903, the United States signed a treaty with Panama, receiving the rights to build, govern, and perpetually operate a canal within the declared Panama Canal Zone. The Panama Canal was opened to the world in August 1914 and gradually became a source of tension between the two countries as the large labor force necessary to operate it was primarily American. Anti-U.S. riots in the 1960s instigated talks toward a new treaty. In 1977 the Torrijos-Carter Treaty was signed between the Republic of Panama and the United States of America, initiating a step-by-step transfer of the Canal to Panama. It wasn't until December 31, 1999 that full control of the Canal's administration, operation and maintenance was assumed by Panama. The Panama Canal Authority (ACP) was established under Title XIV of Panama's National Constitution as an entity of the Government of Panama. The ACP is responsible for the operation, administration, management, preservation, maintenance, and modernization of the canal.1 The ACP was set up to be financially autonomous from the government, with the right to administer its own assets. Likewise, the ACP is organizationally independent of the government, maintaining political separation and integrity of operations. The canal connects the Atlantic and Pacific Oceans through Panama at the narrowest landmass between the two oceans. Ships can navigate through the 50 mile long canal in approximately 8 to 15 hours.2 Between 12,000 and 14,000 vessels from all parts of the world use the canal each year and commercial transportation activities through the canal represent approximately 5% of world trade. The canal consists of locks and dams that enable ships to travel from the Port of Cristobal on the Atlantic side to the Port of Balboa on the Pacific side and vice versa.3 The canal uses a system of locks that function as water lifts. Gates close off the locks in order to raise or lower the water level of each section. Each lock is 33.5 meters wide by 304.8 meters long by 12.5 meters deep. There has been an upward trend in the size of vessels going through the canal. The maximum dimensions of ships that can transit the canal are: 32.3 meters in beam; 294.1 meters in length; and 12 meters in draft, (the depth reach in tropical fresh water).4 According to a March 2005 press release from the ACP, the Panama Canal is currently
1 "ACP Overview." ACP. June 1, 2005. <http://www.pancanal.com/eng/general/acp-overview.html>. 2 Although the actual time from arriving at one side of the Canal to reaching the other (Canal Waters Time), can range anywhere from 22 to 34 hours. 3 "The Panama Canal." Global Perspectives. June 1, 2005. <http://www.cet.edu/earthinfo/camerica/panama/PCtopic1.html> 4 "This is the Canal." ACP. June 1, 2005.<http://www.pancanal.com/eng/general/asi-es-el-canal.html>
1
Panama Canal: A Question of Funding
Copyright © 2005, Global Insight
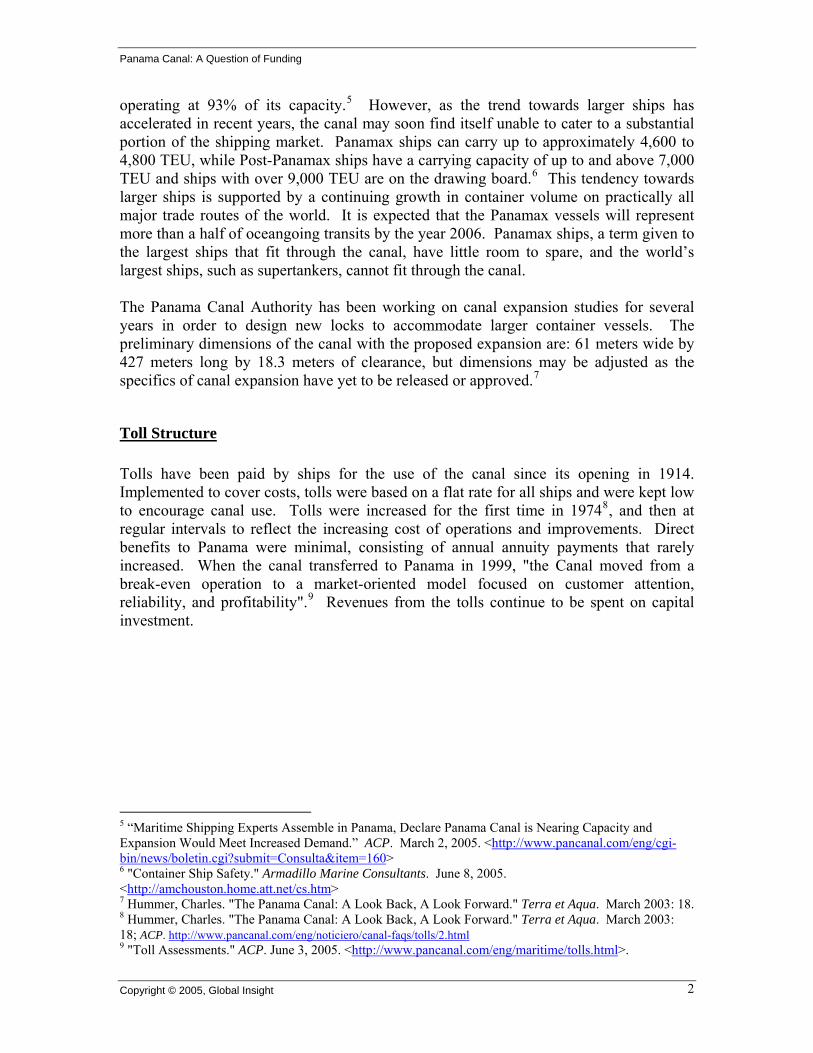
operating at 93% of its capacity.5 However, as the trend towards larger ships has accelerated in recent years, the canal may soon find itself unable to cater to a substantial portion of the shipping market. Panamax ships can carry up to approximately 4,600 to 4,800 TEU, while Post-Panamax ships have a carrying capacity of up to and above 7,000 TEU and ships with over 9,000 TEU are on the drawing board.6 This tendency towards larger ships is supported by a continuing growth in container volume on practically all major trade routes of the world. It is expected that the Panamax vessels will represent more than a half of oceangoing transits by the year 2006. Panamax ships, a term given to the largest ships that fit through the canal, have little room to spare, and the world’s largest ships, such as supertankers, cannot fit through the canal. The Panama Canal Authority has been working on canal expansion studies for several years in order to design new locks to accommodate larger container vessels. The preliminary dimensions of the canal with the proposed expansion are: 61 meters wide by 427 meters long by 18.3 meters of clearance, but dimensions may be adjusted as the specifics of canal expansion have yet to be released or approved.7
Toll Structure Tolls have been paid by ships for the use of the canal since its opening in 1914. Implemented to cover costs, tolls were based on a flat rate for all ships and were kept low to encourage canal use. Tolls were increased for the first time in 19748, and then at regular intervals to reflect the increasing cost of operations and improvements. Direct benefits to Panama were minimal, consisting of annual annuity payments that rarely increased. When the canal transferred to Panama in 1999, "the Canal moved from a break-even operation to a market-oriented model focused on customer attention, reliability, and profitability".9 Revenues from the tolls continue to be spent on capital investment. 5 “Maritime Shipping Experts Assemble in Panama, Declare Panama Canal is Nearing Capacity and Expansion Would Meet Increased Demand.” ACP. March 2, 2005. <http://www.pancanal.com/eng/cgi-bin/news/boletin.cgi?submit=Consulta&item=160> 6 "Container Ship Safety." Armadillo Marine Consultants. June 8, 2005. <http://amchouston.home.att.net/cs.htm> 7 Hummer, Charles. "The Panama Canal: A Look Back, A Look Forward." Terra et Aqua. March 2003: 18. 8 Hummer, Charles. "The Panama Canal: A Look Back, A Look Forward." Terra et Aqua. March 2003: 18; ACP. http://www.pancanal.com/eng/noticiero/canal-faqs/tolls/2.html9 "Toll Assessments." ACP. June 3, 2005. <http://www.pancanal.com/eng/maritime/tolls.html>.
2

Panama Canal: A Question of Funding
Copyright © 2005, Global Insight
Table 1.1: History of toll increases10
July 8, 1974 19.7%
November 18, 1976 19.5%October 1, 1979 29.3%March 12, 1983 9.8%October 1, 1989 9.8%October 1, 1992 9.9%January 1, 1997 8.2%January 1, 1998 7.5%October 1, 2002 8.0%
July 1, 2003 4.5% Beginning October 1994, the canal tolls were assessed on the Panama Canal Universal Measurement System (PC/UMS), the international standard for tonnage measurement, as stated by the 1969 International Convention on Tonnage Measurement of Ships. The laden rate is applied to ships carrying cargo or passengers, while the ballast rate is applied to ships which are not carrying passengers or cargo.11 Other floating craft are charged on the basis of their actual displacement tonnage. In October 2002, Panama implemented a new toll structure based on ship size and type, charging each vessel for the specific services it requires. On May 1, 2005, the ACP replaced the PC/UMS system with the TEU (twenty-foot equivalent unit) as the new measurement unit for full container vessels. Continuing with the segmentation changes started in 2002, this current tolling system is based on the design capacity in terms of twenty foot equivalent containers (TEU), less an allowance for line of sight, applicable to vessels with on-deck container carrying capacity other than full container vessels. For other vessel types with on-deck container carrying capacity, the ACP will continue to apply the PC/UMS tonnage to measure the enclosed spaces and spaces below deck, and will charge a per TEU fee to the actual number of containers carried on-deck. The ACP claims it was correcting a loophole for dues paid by ships carrying containers. The change from a tonnage based system to one based on container-carrying capacity results in higher than anticipated cost increases,12 about a two-third increase for containerships. At a public hearing in Panama in January 2005, the International Chamber of Shipping made it clear that the industry is opposed to the size of the TEU charge. The world shipping industry and the governments of Ecuador, Peru, Chile and South Korea, also objected to the increase. Criticism included the fact that there was no indication that the toll hike was necessary to maintain canal operations. Instead, Carriers
10 ACP. http://www.pancanal.com/eng/noticiero/canal-faqs/tolls/2.html11 "Panama Canal Tolls." ACP. June 3, 2005. <http://www.pancanal.com/eng/general/peajes-en-el-canal.html>. 12 "Key Issues: Canal Issues." The International Chamber of Shipping (ICS) and the International Shipping Federation (ISF). June 3, 2005. <http://www.marisec.org/ics-isfkeyissues2005/text.htm#canal>.
3

Panama Canal: A Question of Funding
Copyright © 2005, Global Insight
believe the higher tolls are funding the canal’s proposed expansion and modernization plans. The fast-paced transition period of three years was also criticized as being too much, too fast, especially given the low inflation rates prevailing in the world economy. Ecuador was one of the most vehement of critics, since most of that country’s imports and exports pass through the canal. The Panama News stated it best: "As one of the poorest countries in the Americas it is one of the least able to absorb a general increase in the cost of doing business".13 Some Carriers believe that this increase in tolls will prompt more in the industry to use the "land bridge" across the continental United States or other alternate routes. The phased-in implementation over three years is as follows:
Table 1.2: Toll Increase Implementation Schedule14
TEU Tolls - Laden TEU Tolls - Ballast Implementation Date
$42 $33.60 May 1, 2005$49 $39.20 May 1, 2006$54 $43.20 May 1, 2007
The Panama Canal Authority states that the segmentation system by vessel type and size enhances its possibility to offer new products to various market segments, and places it in a position to competitively improve its services to users. The ACP plans to continue its modernization program in order to remain as a route of the first order for world trade.
Expansion Several plans are underway to modernize and improve the canal's infrastructure. The Panama Canal Authority has implemented a $1 billion improvement program to maintain the canal and keep it competitive. This plan includes improvements to the locomotives, locks, docks, tugs, and all machinery of the canal operation. In addition, the Panama Canal Authority has announced preparations for constructing a third set of locks in order to accommodate post-Panamax vessel transits. Proposals for a multi-phase program include building additional water reservoirs to increase water availability both for the canal and the terminal cities; dredging the entrances to the canal to allow the entrance of larger ships to the ports; similarly deepening the Gaillard Cut and Gatun Lake; and building new locks and constructing two bridges over the next ten years.15
13 Jackson, Eric. "Despite objections, ACP appears set to enact record toll increase." The Panama News. Jan. 9 - 22, 2005. http://www.thepanamanews.com/pn/v_11/issue_01/business_01.html14 ACP. http://www.pancanal.com/eng/general/peajes-en-el-canal.html15 “Investing in Panama: the Panama Canal.” Business Panama. June 4, 2005. http://www.businesspanama.com/investing/why_invest/panama_canal.php
4

Panama Canal: A Question of Funding
Copyright © 2005, Global Insight
As established by the Constitution, any decision of the Panamanian government to expand the canal will have to be ratified by the people of Panama through a popular referendum. According to Deputy Canal Administrator Manuel Benitez Hawkins, a public referendum to the proposed Panama Canal expansion is expected to take place in late 2005 or early 2006, assuming that the measure is approved by the Panama Canal Authority (ACP) board, the cabinet, and the legislature.16 A vote in the ACP board is expected in mid to late 2005. Pending approval, the project is expected to be constructed in six to seven years (following a 1 ½ -2 year period for detailed planning). While the third lock system is estimated to cost between $4 and $10 billion, depending on the final design, Global Insight is estimating $6 billion in its base-case scenario. The costs for the expansion are expected to be incurred by the shipping community via a toll scheme that will be put in place to recover construction funds from vessels transiting the waterway.17 However, given the shipping industry’s past reactions to toll increases, the potential toll increases that may result given the magnitude of the expansion project may spur some Carriers to consider alternate routes. Should Carriers use alternate routes, the Panama Canal’s dominance as a key trade route may be in jeopardy.
16 The final ACP expansion proposal will have to go through a four-part approval process. First, the ACP Board of Directors must review and approve the proposal. (Part 1 is expected to occur at any time in the near future). Second, the proposal must be approved by the Panamanian Cabinet Council, followed by the Panamanian Legislative Assembly. Finally, Panama’s national public must vote to approve the proposal in a national referendum. Seaport. 17 "Canal Chief Expands on Expansion." Fairplay International Shipping Weekly. May 25, 2005. http://www.fairplay.co.uk.
5

Panama Canal: A Question of Funding
Copyright © 2005, Global Insight 6

Panama Canal: A Question of Funding
Copyright © 2005, Global Insight
Chapter 2 - Overview of the Panama Economy
Economic Development Panama has a small economy with a GDP of around US$10 billion, including the Panama Canal Zone acquired from the United States at the end of 1999. This makes the economy similar in size to Bulgaria or Kenya, but with higher levels of per capita income at just above US$3,000 per annum. Average annual GDP growth during the 1980s was negligible at 0.9%, but rose to 4.2% per annum during the 1990s. While growth in industry contributed to this growth, the main drivers underlying Panama’s economic growth came from the nation’s large services sector, which now accounts for no less than 80% of GDP and includes the “acquired” commercial activities of the Colón Free Zone. The external economic environment broadly improved in the mid-1990s with resurgent trade growth in the Americas. Most important was a program of structural adjustment, which resulted in more sustained—although still quite low—levels of growth. Currently, Panama's principal challenges include a reduction in the income distribution gap, which continues to be one of the most uneven in the world. By contrast, Panama remains attractive to investors because of its dollarized economy, which effectively removes exchange rate risk and provides for a traditionally low inflation environment.
Short – Term Forecast The Panamanian economy should continue to grow at decent rates in 2005–06; however there is uncertainty on both the domestic and external fronts. Domestically, the likely reforms to the Social Security Administration (CSS) and to the fiscal sector may impose severe constraints on aggregate demand, discouraging production. Further, the recently approved tax reform has had a negative impact on business confidence. On the external front, a faster-than-expected slowdown in the world economy would reduce global trade through the Panama Canal, and would also reduce activity in the Colón Free Trade Zone (“CFZ”).18 Proposed ACP expansion plans could significantly alter the medium-term outlook of the Panamanian economy – if expansion efforts and resulting toll increases do not curb Panama Canal volume, the Panamanian economy would stand to gain from increased revenues. Conversely, if toll increases deter transits and volume and the ACP struggles to make its necessary interest payments, ACP finances remitted to the government may slacken.
18 Created in 1948, the CFZ is the largest free zone in the Americas and the second largest in the world, ranking only behind Hong Kong in size and volume of business. Located at the Atlantic entrance to the Canal, the CFZ houses 1,751 merchants, receives more than 250,000 visitors yearly and generates exports and re-exports valued at more than US$11 billion annually. "Investing in Panama – Colon Free Zone." Business Panama. June 21, 2005. http://www.businesspanama.com/investing/opportunities/cfz.php
7

Panama Canal: A Question of Funding
Copyright © 2005, Global Insight
The combination of Global Insight’s forecasted global economic slowdown and the planned fiscal reforms have led Global Insight's latest forecast to call for a 5.0% economic expansion in 2005; down from 6.2% in 2004.
President Torrijos’ Agenda At the end of January 2005, the Panamanian Congress, which is dominated by the ruling party, approved the so-called tax reform. The reform should increase government revenues and reduce expenses in order to reduce a large fiscal gap and make public debt sustainable. The opposition and the business community fiercely contested the tax reform, despite the fact that minor changes were made to the original bill. In June 2005, Panama's President Martín Torrijos approved reforms to the country's cash-strapped social security system despite opposition from unionists and business groups alike. With approved reforms, the retirement age, currently at 57 years for women and 62 for men, will gradually increase to 60 and 65 respectively by 2015. The number of payments to the Social Security Administration (CSS) needed to retire will also increase gradually, from 180 to 300 by 2010. Workers currently pay 7.25% of their salaries to the CSS but will have to pay 8% from 2006 through 2009, after which workers will pay 9%. The government will also help to increase CSS's income by transferring revenue from privatized roads. Unions have reacted angrily to the developments as protests, demonstrations and strikes have resulted. Some form of compromise is increasingly necessary, given the widespread opposition to the reforms. However, some reform to the CSS was imperative, regardless of its unpopularity. The deterioration of CSS' finances has come to the point that the pension fund would be exhausted in 10-15 years if corrective measures were not taken. There are two other controversial issues in the president’s agenda: the first one is the signing of a free trade agreement with the United States, which is opposed by the agricultural sector; the other is the referendum that Torrijos must call for the proposed canal expansion. Despite canal capacity concerns regarding the growth in Post-Panamax size vessels in international shipping, environmental groups and other sectors of the population are against the expansion.
8

Panama Canal: A Question of Funding
Copyright © 2005, Global Insight
Table 2.2: Economic Indicators19
High-Frequency Indicators Mar 2005 Apr 2005 May 2005 Jun 2005 Jul 2005Consumer Price Index (% change from year earlier) 2.0 2.0 1.7 1.4 1.4
Exchange Rate, Month-end (LCU/US$) 1 1 1 1 1Exchange Rate, Average (LCU/US$) 1 1 1 1 1Short-Term Interest Rate (%) 2.7 2.8 2.8 2.9 2.9Trade Balance (Mil. US$) -226 -208 -235 -216 -225 Annual Economic Indicators 2003 2004 2005 2006 2007Real GDP (% change from year earlier) 4.1 6.2 5.0 3.8 4.0Nominal Per-Capita GDP (US$) 4,136 4,405 4,608 4,775 4,960Consumer Price Index (% change from year earlier) 1.4 1.5 1.6 1.2 1.4
Exchange Rate, Average (LCU/US$) 1 1 1 1 1Short-Term Interest Rate (%) 1.5 1.9 2.8 NA NATrade Balance (Mil. US$) -2,317 -2,610 -2,666 -2,700 -2,847Current Account Balance (% of GDP) -3.2 -2.5 -1.7 -1.8 -1.9Fiscal Balance (% of GDP) -1.9 -5.0 -1.6 -1.5 -1.4 In terms of economic stability, Panama continues to enjoy low inflation rates, mainly due to its inactive monetary policy. Traditionally, Panama has enjoyed low risks due to economic stability provided by its monetary regime in which the U.S. dollar circulates as legal tender. Inflation has been–for many years–lower in Panama than in the United States, and there are no exchange rate fluctuations given the fixed nature of the local currency (balboa) to the U.S. dollar. Despite price and exchange rate stability, Panama remains a poor country with income per capita at around US$3,700 per year. One of the major risks to this Central American nation is its high exposure to external shocks; a global economic downturn is relatively rapidly transmitted to Panama, as traffic through the Panama Canal decreases, and re-export activity from the Colón Free Zone to its South American partners shrinks.
Growth Panama's GDP jumped 6.5% in the first quarter of 2005, following a weaker gain in the last three months of 2004 (up 3.8%). Robust performances came in 2005 from ports (20%), agriculture and livestock (10.4%), and commerce (9.6%). On the external front, value added from the canal increased 4.8% in real terms, while the Colón Free Zone expanded 14.7%, aided by the recovery of the South American region.
19 Global Insight
9

Panama Canal: A Question of Funding
Copyright © 2005, Global Insight
20Figure 2.1: Real GDP Growth
4.1
6.2
5.0
3.8 4.0
0.0
1.0
2.0
3.0
4.0
5.0
6.0
7.0
2003 2004 2005 2006 2007
Perc
ent c
hang
e y
ear a
go
The services sector represents the backbone of the economy, constituting no less than 80% of GDP. The growth rate of the services sector has been stable in recent years. Primary activity, including mining and agriculture, accounts for 8% of the economy, and secondary activity, including manufacturing and construction, account for the remaining 12%. The most volatile component of the services sector has been the wholesale activity of the Colón Free Zone, reflecting the income and activity of its important customers in South America. On September 9, 2004, only eight days after the new president, Martin Torrijos, was sworn in, Minister of Finance Ricaurte Vasquez announced that the state of fiscal accounts, as left by the previous Moscoso administration, was far worse than expected. Vasquez stated that the new administration estimates that the fiscal gap will amount to 720 million balboas (1 balboa = 1 U.S. dollar), equivalent to 5.3% of GDP. The fiscal responsibility law (enacted in May 2002) that limits the deficit to 2% of GDP has been temporarily suspended. The Moscoso administration had managed to comply with the rule by using a different accounting methodology. Another important announcement was related to the official GDP growth rate forecast for 2005: Vasquez reduced it from 6.0% to 5.0% - the same level that Global Insight estimates. An important source of risk relates to the international economic environment. If international oil prices remain high in 2005, and the U.S. economy decelerates drastically, a significant slowdown in Panamanian economic activity may be expected. The country boasts a relatively open economy: the Panama Canal depends entirely on international trade, and the Colón Free Zone relies mostly on re-exports to South America. Should global trade through the canal decline (either due to a global trade decline or excessive toll increases), ACP finances remitted to the government may slacken.
20 Global Insight
10

Panama Canal: A Question of Funding
Copyright © 2005, Global Insight
Inflation Historically, inflation has been very low in Panama thanks to the country’s fully dollarized economy and subsequent dependence on the U.S. Federal Reserve for its monetary policy. Inflation in Panama has consistently been lower than inflation in the United States, as demonstrated by an average increase of consumer prices of 1.1% during 2000–04. Although rising oil prices have occasionally exerted upward pressure on wholesale prices, the country has experienced little spillover onto consumer prices. Inflationary pressures remained subdued in late 2003. However, due to higher worldwide oil prices, inflation accelerated in the first quarter of 2005, amounting to 3.3% in April. Despite high oil prices, a long tradition of price stability due to the dollarized economy will preclude any distorting inflationary spike. As such, Global Insight expects consumer price inflation to return to normal as oil prices also trend down in the first half of 2006.
21Figure 2.2: Consumer Price Index
1.0
1.4
1.8
2.2
2.6
3.0
3.4
Jan-03 Jun-03 Nov-03 Apr-04 Sep-04 Feb-05 Jul-05 Dec-05
Perc
ent c
hang
e ye
ar a
go
Monetary Policy In Panama, the U.S. dollar circulates as legal tender – since there is no central bank, there is no monetary policy. The resulting economic stability yields very low inflation and no currency fluctuations relative to the U.S. dollar. Monetary policy risks are, therefore, almost non-existent.
21 Contraloria General de la Republic and Global Insight.
11

Panama Canal: A Question of Funding
Copyright © 2005, Global Insight
Fiscal Policy and Public Finances In the first four months of 2005, current government revenue amounted to 643 million balboas (1 balboa = US$1), up 19% from the similar period of 2004, and 43 million balboas above budgeted income. Better tax enforcement and enhancement of collection methods favored a sizable improvement in total tax revenue, as did new taxes imposed February 6th of 2005. Higher government revenue was also supported by strong economic growth. In 2004 the fiscal deficit amounted to 691 million balboas, equivalent to 5.0% of GDP. At the end of January 2005, the legislative branch approved a controversial tax reform that had been fiercely opposed by the business community and opposition parties in an effort to reduce its deficit. The new fiscal package contains an alternative minimum income tax that calls on businesses to pay the higher of the regular income tax or 1.4% of gross revenues. The workers' tax-free allowance of US$800 per month will be retained, while cheap eateries will continue to be exempt from the 5% service tax. The bill also proposes a 1% tax on businesses in the Colón Free Zone. On the expenditure side, the bill calls for a progressive reduction in number of civil servants such that on January 1, 2008 there will be no more public employees than in December 1999. As a result of this plan, approximately 40,000 government workers are to lose their jobs in the next five years. The weak state of public finances imposes a major constraint on the Panamanian economy. The 2005 budget totals US$6.19 billion; up 3.7% from the previous year. The new budget allocates 23% of expenses to service the public debt and has increased by the same amount as the service of public debit is scheduled to increase. In other words, there have not been any cuts to the other budgeted expenses. The proposed reduction in the fiscal deficit is a consequence of higher projected revenue. The government is still working on a comprehensive reform to the Pension Fund.
Exchange Rates Panama has been a fully dollarized economy since 1904. Its local currency, the balboa, is used only for small transactions and circulates in coins only. U.S. banknotes and coins are the main legal tender. Panama’s use of the dollar is expected to continue. The economy's large service sector (offshore banking in particular) and high foreign involvement ensure the continued use of the dollar, despite the current atmosphere of fiscal instability. Risks to Panama’s exchange rate verses the dollar are almost nonexistent. A major catastrophe in the political environment, where the country encounters serious problems servicing its debt, for example, could add some pressure—but it is not expected to force the country to abandon its currency.
12

Panama Canal: A Question of Funding
Copyright © 2005, Global Insight
22Figure 2.3: Exchange Rates(Units, month-end value)
100.0
105.0
110.0
115.0
120.0
125.0
Jan-03 Jun-03 Nov-03 Apr-04 Sep-04 Feb-05 Jul-05 Dec-050.5
0.6
0.7
0.8
0.9
1.0
Yen vs. US Dollar (left scale) Euro vs. US Dollar (right scale)
Financial System Banking conditions are generally stable and the financial system is highly sophisticated. The government has taken action to improve the quality of supervision and regulation of the banking system, as well as to improve the effectiveness of the anti-money laundering regime. Consequently, the country is no longer on the G8 money laundering blacklist.
Trade and External Accounts In 2004, imports expanded 15%, to $3.59 billion and exports increased 10.2%, amounting to $890 million (these figures do not include trade in the Colón Free Zone). The latest available balance-of-payments data show that in 2004, the current account of the balance of payments posted a deficit of $1.1 billion, up from $437 million in 2003. Most of the deterioration is explained by a wider trade deficit in the Colón Free Zone (CFZ), although this was partially offset by revenues from the Panama Canal Authority. The acceleration of global economic activity benefited transit through the Panama Canal as trade increased worldwide. A strong recovery in Latin America favored the CFZ. Panama is in favor of a free trade agreement with the United States and Central America. Panamanian workers and farmers who wish to see certain Panamanian agricultural products excluded from the deal continue to protest. Panamanian producers understandably believe that the exclusion of the specific products (including milk, beef, sugar, rice, maize, poultry, pork, onions, potatoes, and tomatoes) is crucial if they are to survive in a post-agreement market. 22 Global Insight
13

Panama Canal: A Question of Funding
Copyright © 2005, Global Insight
The country’s exports of farm products are of critical importance, generating up to two-thirds of all foreign exchange. Bananas are the leading export, followed by shrimp and fish products, sugar, clothing, and coffee. The country has always run a large deficit on its merchandise trade (roughly 20% of GDP in 2001), as a result of its heavy dependence on imported fuel. Panama buys more than 70% of its energy abroad and virtually all oil is imported. Likewise, manufactured goods, raw materials, and foodstuffs are also imported. As is made evident in table 2.2, the United States is Panama’s largest trading partner.
Table 2.2: Trading Partners23
Exports to: Share of Total (percent)
Imports from: Share of Total (percent)
United States 23.0 Japan 25.6Germany 11.1 United States 16.1Belgium 7.6 China 12.9Japan 7.1 Singapore 10.1Italy 4.8 Italy 5.4Thailand 4.5 Hong Kong SAR 4.6Sweden 4.2 France 3.7Spain 3.4 Colombia 1.6Costa Rica 3.3 Costa Rica 1.2Honduras 3.0 Spain 1.2
Panama: Main Trading Partners, 2003
Labor Markets The government plays a significant role in the labor market. There is a minimum wage, which is presently US$1 an hour (the highest in the region). Panama's labor code is strongly pro-union and is among the most inflexible in the world, yet the movement of labor around the country remains fairly restricted. According to the CIA World Factbook, the 2004 unemployment rate is estimated to be 12.6%, down from 14.5% in 2003.
23 IMF Direction of Trade Statistics
14

Panama Canal: A Question of Funding
Copyright © 2005, Global Insight
24Figure 2.4: Unemployment Rate
13.1 13.0
16.014.5
12.6
0
2
4
6
8
10
12
14
16
18
1997 2000 2002 2003 2004
Perc
ent
Natural Resources Panama has ambitious plans to develop the domestic hydroelectric potential, but little progress has been made in recent years. Mineral deposits are also arousing interest from international investors, although local objections on environmental grounds are strong. The country has copper reserves of some 6 million tons, ranking it ninth in the world in this category. Optimists predict that mining could account for 15% of GDP within the next 10 to 15 years if the resource were fully tapped. However, the environmental lobby remains strong and will slow such full exploitation of mineral resources. Among the environmental concerns growing in Panama are the rapid destruction of rain forests, or mangrove swamps, the deterioration of the canal watershed, and the lack of the appropriate water and sewerage utilities.
Economic Strategy The handover of the Panama Canal and the former Canal Military Zone to Panamanian sovereignty at the end of 1999 presented a huge opportunity for the country to build on its reputation as a world-class center for trade and services. Currently, the canal basin, adjacent cities, and Interoceanic Region (former Canal Military Zone) account for 75% of GDP and 75% of the country's exports. President Torrijos will face tough challenges on the future of the Panama Canal during his term in office as he will be forced to put expansion plans to a vote in a public referendum before construction can begin.25 Public support of the expansion remains low due the possibility that people will be displaced, the environment may be damaged, and the fear that the ACP may have difficulty
24 CIA World Factbook 25 Expansion plans must pass through three other approvals before reaching the public referendum.
15

Panama Canal: A Question of Funding
Copyright © 2005, Global Insight
financing the expansion. As such, the proposed expansion will be a tough sell to the public.
Events to Watch
• Balance of Panama’s fiscal accounts and foreign debt level, currently at more than 70% of GDP
• The reform to the Social Security Administration (CSS) • Impact of higher oil prices on economic activity and domestic prices • Economic activity indicators: Panama Canal revenues, activity in the Colón free-
trade zone and tourist visits
16

Panama Canal: A Question of Funding
Copyright © 2005, Global Insight
Chapter 3 - Overview of Global Trade Through the Canal: Present and Future
The Global Economy As of the second quarter of 2005, the global economy was well past its peak growth on a quarter-on-quarter basis, and is headed for a substantial deceleration over the next few quarters. In recent months, doubts about the current strength of global economic growth have taken center stage, and uncertainties about sustaining above-trend growth rates through next year have increased as a result of high oil prices and weak labor markets. While global growth will likely decelerate further in the coming quarters, Global Insight believes the world economy's recent setbacks are temporary, and expect its pace to remain strong enough to maintain an above-trend pace through at least next year. Specifically, Global Insight's latest forecast projects the world average growth rate to decelerate from 4.1% in 2004 to 3.1% in 2005 and 3.2% in 2006. On a year-on-year basis, we estimate that the world economy's quarterly growth decelerated to 3.5% in the fourth quarter of 2004, after having peaked at 4.4% in the second quarter. We project the deceleration to continue in the coming quarters, to 3.7% year on year in the fourth quarter and 3.3% in the first quarter of 2006. However, this year's projected growth represents a substantial improvement over the global economy's lackluster performance during the preceding three years, and is above the global economy’s long-term trend growth rate of 3.1% per year. Our projected average annual growth rate for the next five years—from 2005 through 2009—is 3.2%, compared with 2.6% for the last five years (1999–2004).26
Outlook for World Trade Last year, the world economy and world trade both reached their highest rates of growth since the global "recession" of 2001. The pent-up demand built up for consumption and investment coming out of recession was largely satisfied in most countries during the past two years. Consequently, in 2005 the world economic and trade growth is expected to decelerate. What has increased the slowing of growth is the sustained high price of oil. High energy prices have pushed up producer costs and have raised households’ energy expenditures resulting in consumers having less income remaining for everything else. As such, the force of consumer demand behind the continued expansion is constrained, which, in turn restrains production. United States-
26 Global Insight World Trade Review. 2005.
17

Panama Canal: A Question of Funding
Copyright © 2005, Global Insight
For the United States, the weaker dollar has helped its exports but done little so far in narrowing the huge trade deficit. The reality is that foreign-made goods are still inexpensive. Retailers are fighting with domestic producers to stop Congress from restricting imports. Yet even domestic producers are seeking low-cost inputs regardless of their origin. We are projecting that despite the drop in the value of the dollar, U.S. import volume will continue to outweigh export volumes. Behind the sustained U.S. import boom has been the fact that consumer savings have been outweighing producer losses from lower cost imports. While there is no doubt that low cost imports have hurt the U.S. manufacturing sector, the overall net income gain from low cost imports has been supporting the growth of other sectors, including the especially-strong housing sector. Overall, despite the huge U.S. trade deficit, U.S. unemployment is relatively low at 5.2%, relative to the 8.9% in the Eurozone. Future significant reductions in the U.S. trade deficit could occur if unemployment increases substantially, when the job losses in the manufacturing sector can no longer be absorbed by the service sector and moves to restrict imports become attractive to politicians.
China- Despite authorities' actions to achieve a soft economic landing, several months into 2005 demand for inexpensive Chinese goods has held up and domestic Chinese economic growth has not slowed as much as previously expected. In the first quarter of 2005, Chinese exports grew in nominal terms by 34.9% compared to the same period a year ago. The major growth came in computers, apparel and textiles, footwear, cell phones, furniture, home electronics, steel, etc. This indicates that China continues to take a larger share in the world markets for these goods, rather than global market expansion. China’s expansion has come at the cost of loss of share for other developing countries. In the U.S., retailers increased their imports from China and reduced their imports from Central American and other source supply countries. Some economists explain that China is really hurting other developing countries' exports not the remaining domestic producers in developed economies. Nevertheless, retailers welcome Chinese-made apparel, because the low prices allow them more sales and/or the prospect of better margins. Thus, even if the U.S. and Europe pass further restrictions, they will unlikely be restraining enough to truly shelter their domestic producers from import competition over the long-term. On the Chinese import side, there has been some loss of momentum. In the first quarter of 2005, even in nominal value terms, Chinese exports 'only' grew by 12.2% compared to the same period a year ago. Major growth came from electronic components, crude oil, iron ore, primary forms of plastics, etc. But in physical terms, for many commodities, China’s import volumes are actually smaller than the same period last year. In physical volume, imports of crude oil declined by 12.7% in the first two months, though that should only be a temporary reduction in response to oil price increases. Commodities that have solid import growth in China are electronics components, iron ore, aluminum, grain and mill products, etc. Much of these Chinese imports are for use in production of export goods. The domestic market for imported consumer goods is still limited due to
18

Panama Canal: A Question of Funding
Copyright © 2005, Global Insight
the relatively small, but growing middle class. Even in high-end goods only sold to the wealthy in China, such as autos, foreign producers have been disappointed in their sales in China. Mainly discouraged by high gas prices, in the first two months of 2005 China imported fewer than 10 thousand cars, a decline of about 60% from the same period last year. With regard to exports, we should not expect that Chinese export growth can be maintained at two-digit growth rates in the long run. Chinese export manufacturing expansion will gradually slow towards the rate of overall world import demand growth combined with the resistance from countries with large trade deficits. Within China, the rising prices of energy, raw materials, and labor will gradually diminish the current Chinese production cost advantages. Market forces and organization by factory workers, tired of collusion and low wages, are beginning to have an upward affect on wages. Environmental conditions for air and water have deteriorated to such a degree that pollution control measures and congestion mitigation costs will now begin to be incurred by new entrants attempting to add even more factories, raising costs of production.
Latin America- Latin America should see comparatively high economic growth rates this year. The IMF recently raised its 2005 real GDP expectation to 4.4%. From Global Insight's perspective, we see Chile accelerating this year, with concomitant increases in its trade. Peru, Colombia, Brazil, and Argentina will see slower growth in 2005 compared to 2004. Strength in oil prices will help to boost Venezuela, Ecuador, and Mexico. Imports by Latin American countries are already up and are expected to improve in 2005 and 2006, as consumers expand their purchases. Import demand will be fueled by a stronger dependence on internal demand growth. Other- For other countries, a slowing in economic and trade growth is the general trend for 2005 whether due to the pent-up demands having largely been satisfied, or the impacts of high energy prices, or both. The exceptions to this situation are the oil exporting countries and countries where there is little link between economic growth and energy-consuming industries. Oil exporting countries are receiving large inflows of revenues from the high oil prices and their appetites for imports remains strong. In India, their recent economic growth has been largely rooted in growth in exports of Information Technology services. India has been the leading developing country benefiting from efforts to achieve lower IT costs through outsourcing of IT and other service functions by companies in the developed world. Global Insight forecasts higher growth for India in 2005 than in 2004, and double digit growth rates in India's imports.
19

Panama Canal: A Question of Funding
Copyright © 2005, Global Insight
Total World Cargo Trade The latest update to Global Insight's World Trade Model forecasts international trade growth of 4.1% in 2005, which is slower than last year's 5.0% and even slower than the "record" growth in 2003 of 6.2%. Total tonnage this year will hit more than 8.7 billion metric tons. Historically, the world's international trade fell in 2002 by 5.1%, and most of this was overland cargo moves which collapsed by more than 15%. Seaborne trade still increased, but only by 1.6% in 2002.
Total World Seaborne Cargo Trade Of the four service types in Global Insight’s model, namely, Dry Bulk, Tanker, Container, and General Cargo, the container sector will continue to grow faster than the others, as general cargo becomes increasingly containerized and port facilities are upgraded to handle containers. Over the long term, we expect tanker shipments to experience the slowest growth due to slower demand and economic growth. Tanker shipments are also likely to be hindered by the long-term substitution of other fuels for oil. Dry bulk shipments are forecast to slow to 1.2% per year between 2015 and 2024. Growth in coal and gain shipments will also slow in line with a long-term decline in economic growth.
27Figure 3.1: Total Commodity Global Trade Growth
-10.0%
-5.0%
0.0%
5.0%
10.0%
15.0%
2000 2002 2004 2006 2008 2010 2012 2014 2016 2018 2020
Seaborne Metric Tons Dry Bulk Metric Tons
Liquid Bulk (Tanker) Metric Tons General Cargo/Neo Bulk Metric Tons
Container Tons TEUs (20 Foot Container Equivalent Units)
27 The sources for the following trade-related Figures in Chapter 3 are Global Insight World Trade Review. 2005, and the Global Insight Global Trade Navigator.
20

Panama Canal: A Question of Funding
Copyright © 2005, Global Insight
Table 3.1: Growth Rates of Four Major Service Types - Ocean Freight
2000-05 2005-10 2010-15 2015-24Dry Bulk 4.80% 3.50% 2.10% 1.20%Tanker 1.20% 2.70% 1.90% 1.00%General Cargo/Neo Bulk 2.50% 4.10% 3.20% 2.50%Container 8.10% 5.80% 5.00% 4.40%
Seaborne Trade by Region It is no surprise that, in tonnage terms, the Middle East dominates the list of export regions, with its crude oil exports. However, Latin America's position as the second largest export region is more surprising. Latin American growth is fueled by crude oil as well, but also by dry bulks such as iron ore and grain, as well as fruits and other perishables. The Middle East's position will slide to #2 by 2024 as China, and Northeast Asia in general, expands seaborne exports; - Latin America will subsequently fall to #3. Of particular note is the very strong export performance in the Indian subcontinent, which is forecast to grow faster than Northeast Asia through the end of the forecast horizon. This reflects the very strong economic expectations for the region – India is now in a take-off position similar to China's position 20 years ago.
Table 3.2: Seaborne Metric Tons (Millions) — Exports
Long-Range Forecast
Export Region/Year 2003 2005 2010 2015 2024 2003-05 2005-10 2010-24North America 500 549 614 658 727 4.70% 2.30% 1.20%North Europe 271 293 337 374 408 4.00% 2.90% 1.40%Northeast Asia 594 676 891 1121 1573 6.70% 5.70% 4.10%Southeast Asia 487 525 592 648 735 3.90% 2.40% 1.60%Mediterranean 154 167 185 201 224 4.00% 2.00% 1.40%Middle East 909 974 1126 1249 1376 3.50% 2.90% 1.40%Indian Subcontinent 96 131 219 299 408 16.90% 10.80% 4.50%Australia/New Zealand 502 594 738 825 925 8.80% 4.40% 1.60%Latin America (inc Mex/CRB) 848 938 1076 1172 1305 5.20% 2.80% 1.40%
Avg. Annual Growth
As for global seaborne imports Northeast Asia has dominated the import picture for many years, feeding its export machine; this year's imports of more than 2.1 billion metric tons represent a 7.6% increase over 2004. One of the major recipients of the region's exports, namely North America, is the second largest importing region worldwide, and this position will be held throughout the forecast even though North America's long-term
21

Panama Canal: A Question of Funding
Copyright © 2005, Global Insight
import growth rate of about 1.6% per year is forecast to be lower than the growth in imports in such regions as the Indian Subcontinent, the Middle East, and Latin America. Again, as India begins to expand rapidly over the next 10+ years, its imports will also increase to fuel the expansion. Latin America's imports, although growing at 2.4% per year, will place the region as 7th out of 10 by the end of the forecast period, simply because the other, larger regions are predicted to grow faster, or are too large to be caught.
Table 3.3: Seaborne Metric Tons (Millions)—Imports28
Long-Range Forecast
Import Region/Year 2003 2005 2010 2015 2024 2003-05 2005-10 2010-24North America 967 1048 1152 1256 1434 4.10% 1.90% 1.60%North Europe 539 575 620 662 746 3.20% 1.50% 1.30%Northeast Asia 1883 2145 2774 3223 3722 6.70% 5.30% 2.10%Southeast Asia 372 400 449 497 584 3.70% 2.30% 1.90%Mediterranean 444 469 506 540 603 2.90% 1.50% 1.30%Middle East 91 101 122 141 178 5.30% 3.90% 2.80%Indian Subcontinent 186 221 311 408 572 8.90% 7.00% 4.50%Australia/New Zealand 75 82 90 96 107 4.70% 1.70% 1.30%Latin America (inc Mex/CRB) 282 311 350 394 489 5.00% 2.40% 2.40%
Avg. Annual Growth
Containerized Traffic- World container trade in TEUs has been growing at double-digit rates over the 2002-04 period, reaching 11.2% in 2004. We expect that the economic slowdown this year worldwide will cause container shipping to ease somewhat, averaging 8.6% this year (2005) at the world level. While this is still a substantial growth rate overall, it is important to note that it is a slowing of growth and that 2005 will not represent a recession – simply a slowdown in the rate of growth.
28 Global Insight Global Trade Navigator. 2005. Remaining data in Chapter 3 also from Global Insight Global Trade Navigator, 2005.
22

Panama Canal: A Question of Funding
Copyright © 2005, Global Insight
Figure 3.2: Total Container Trade(TEUs)
0
20,000,000
40,000,000
60,000,000
80,000,000
100,000,000
120,000,000
140,000,000
160,000,000
180,000,000
200,000,000
2000 2002 2004 2006 2008 2010 2012 2014 2016 2018 2020
Regionally, container exports will be dominated by China, even under the assumption of slower economic growth in China over time. Indeed, China is expected to dominate container exports by a substantial margin. The figures show that, by 2006, China will export 3 times as many TEUs as the U.S. The other striking aspect of the forecast is that, of the top 5 exports in the world, the US's share of the total is falling rapidly, from 23% last year (2004), to 18.8% in 2007. This trend is forecast to continue. Growth rates of containerized exports will be highest for Northeast Asia in 2005, but will be passed by a small margin by the Indian subcontinent in 2006.
23

Panama Canal: A Question of Funding
Copyright © 2005, Global Insight
Figure 3.3: Growth Rates of Containerized Exports by Region
-4.0% 1.0% 6.0% 11.0% 16.0%
NE Asia
Indian Sub.
Latin Am.
Med
SE Asia
N. Europe
N. America
Mid. East200620052004
Trade on Panama Canal Routes The following discussion provides current and forecast analysis of global trade on routes that utilize the Panama Canal. These forecasts do not consider Panama Canal capacity constraints or the impacts of the proposed expansion. Imports to the U.S. East Coast- The growth in trade involving China is likely to increase the demand for passage through the Panama Canal considerably (ceteris paribus). Figure 3.5 illustrates imports to the U.S. East Coast from four key points of origin. Considering the aforementioned growth in trade from China, it is not surprising that the Far East represents the largest share and growth in exports to the U.S. East Coast. Exports from the West Coast of South America to the East Coast of the United States will continue to retain their second place status in terms of tonnage through the canal. Despite the growth in global trade, the Panama Canal is only capturing a fraction of this trade. As is evident in Figure 3.4, global trade in real value grew at a compound annual growth rate (CAGR) of 6.1% between 1995 and 2004, while global Seaborne Metric Tons grew at a CAGR of 3.7% over the same period. However, total cargo in long tons traveling through the Panama Canal grew at a CAGR of a mere 0.6% over the aforementioned period. Given the ideal location of the canal, as well as the continued
24

Panama Canal: A Question of Funding
Copyright © 2005, Global Insight
improvements that the canal has made over the last 10 years,29 it is unclear as to why the Panama Canal has not captured a larger portion of global trade growth.
Figure 3.4: Total Global Trade vs. Trade via the Panama Canal
-4.0% -2.0% 0.0% 2.0% 4.0% 6.0% 8.0% 10.0% 12.0%
1997
1998
1999
2000
2001
2002
2003
2004
Worldwide Total Trade Real Value ($Thousands)Worldwide Seaborne Metric TonsPanama Canal Cargo, Long Tons Millions
Figure 3.5: Total Commodities Imported to U.S. East Coast (Seaborne Metric Tons)
0
10,000,000
20,000,000
30,000,000
40,000,000
50,000,000
60,000,000
70,000,000
80,000,000
2000 2004 2008 2012 2016 2020
West Coast South America Far East Australia/New Zealand Indian SubContinent
China’s impact on the Canal is further felt when reviewing total commodity imports to the U.S. East Coast by type of trade. In Figure 3.6, it is evident that container tons from
29 i.e. adding lights to extend working hours; the addition of the reserve booking system.
25

Panama Canal: A Question of Funding
Copyright © 2005, Global Insight
the Far East clearly dominate exports to the U.S. East Coast. However, several other categories should earn an honorable mention for their expected growth over the forecast period. Namely, cargo, TEUs, and dry bulk from the Indian Sub-Continent are each expected to grow at CAGRs of 8.8%, 6.8%, and 5.4%, respectively from 2005-2020. For comparison, container trade from the Far East is expected to grow at a CAGR of 6.5% over the same period. Further, TEU trade from the Far East is expected to grow at a CAGR of 7.1% between 2005 and 2020. Figure 3.6 illustrates the largest players along routes to the U.S. East Coast via the Panama Canal.
Figure 3.6: Total Commodities Imported to U.S. East Coast
0
5,000,000
10,000,000
15,000,000
20,000,000
25,000,000
30,000,000
35,000,000
40,000,000
45,000,000
50,000,000
2005 2010 2015 2020
Container Tons - Far East Container Tons - Indian SubContinent
Cargo, Bulk Metric Tons - Far East TEU - Far East
Dry Bulk Metric Tons - W. Coast S. America Dry Bulk Metric Tons - Far East
Imports to the U.S. West Coast- Imports to the U.S. West Coast on routes via the Panama Canal are less dominated by one player; both Northern Europe and the East Coast of South America have a dominant presence. Though not surprisingly, the East Coast of South America comprises the largest share of imports to the U.S. West Coast, and is expected to continue this trend through 2020.
26

Panama Canal: A Question of Funding
Copyright © 2005, Global Insight
Figure 3.7: Total Commodities Imported to U.S. West Coast
(Seaborne Metric Tons)
0
1,000,000
2,000,000
3,000,000
4,000,000
5,000,000
6,000,000
7,000,000
8,000,000
2000 2002 2004 2006 2008 2010 2012 2014 2016 2018 2020
East Coast South America North Europe Caribbean Basin
The largest contributor to imports to the U.S. West Coast is liquid bulk trade from the East Coast of South America. Coming in second are container tons from Northern Europe. Growth rates over the forecast period shed more light onto trade via this route. For instance, while container trade from Northern Europe maintains high levels of tonnage on this route over the forecast period, its CAGR is 2.3% between 2005 and 2020, compared with a CAGR of 1.7% for liquid bulk trade from the East Coast of South America. TEUs from Northern Europe and the East Coast of South America will have the highest CAGRs through 2020 at 2.5% and 3.2%, respectively. Containers and TEUs from the Caribbean, and dry bulk from Northern Europe each have negative growth rates, at -0.45%, -0.40%, and -0.79%, respectively. Figure 3.8 illustrates the largest players along routes to the U.S. West Coast via the Panama Canal, while figure 3.9 depicts the detail of the smaller players.
27

Panama Canal: A Question of Funding
Copyright © 2005, Global Insight
Figure 3.8: Total Commodities Imported to U.S. West Coast
0500,000
1,000,0001,500,0002,000,0002,500,0003,000,0003,500,0004,000,0004,500,0005,000,000
2005 2010 2015 2020
Liquid Bulk Metric Tons - E. Coast S. America Liquid Bulk Metric Tons - N. Europe
Liquid Bulk Metric Tons - Caribbean Basin Container Tons - E. Coast S. America
Container Tons - N. Europe Container Tons - Caribbean
Figure 3.9: Total Commodities Imported to U.S. West Coast
0
200,000
400,000
600,000
800,000
1,000,000
1,200,000
2005 2010 2015 2020
Dry Bulk - E. Coast S. America Dry Bulk Metric Tons - N. EuropeDry Bulk Metric Tons - Caribbean Cargo, Bulk Metric Tons - E. Coast S. AmericaCargo, Bulk Metric Tons - N. Europe Cargo, Bulk Metric Tons - Caribbean TEU - E. Coast S. America TEU - N. EuropeTEU - Caribbean
TEU Trade Between the North Atlantic and the Far East- The most efficient way for seaborne trade to travel between the North Atlantic and the Far East (in its current state) is via the Panama Canal. The following figures indicate the future growth in commodities traded along this route. Those experiencing the highest CAGRs between 2005 and 2020 include furniture and fixtures (10.1%), electrical
28

Panama Canal: A Question of Funding
Copyright © 2005, Global Insight
apparatus (12.4%), and electrical appliances and housewares (12.0%). This growth is propelled by China, who currently dominates these markets. While there are several smaller players that will experience growth of less than 5%, and even less than 1%, over the forecast horizon, the CAGR for total commodities along this route is expected to be 7.1%. In most cases, growth will be strongest in the first 5 years of the forecast before slowing modestly through 2020.
Figure 3.10: TEU Commodity Trade North Atlantic to Far East
0
500,000
1,000,000
1,500,000
2,000,000
2,500,000
2000 2002 2004 2006 2008 2010 2012 2014 2016 2018 2020
Furniture and Fixtures Other Manufacturing, nes.Wearing Apparel Metal ProductsElectrical Apparatus, nec. Plastic Products, nec.Textiles Synthetic ResinsFootw ear Electrical Appliances and Housew are
29

A Question of Funding
Copyright © 2005, Global Insight 30
Figure 3.11: TEU Commodity Trade – 2005 vs. 2010
TEU Commodity Trade: N. Atlantic to Far East2005
Wearing Apparel6%
Other38% Other
Manufacturing12%
Metal Products6%
Electrical Apparatus
5%Plastic Products
4%Textiles3%
Synthetic Resins3%
Footw ear3%
Electrical Appliances and
Housew are3%
Furniture and Fixtures
17%
TEU Commodity Trade: N. Atlantic to Far East2020
Furniture and Fixtures
25%
Electrical Apparatus
10%
Other Manufacturing
10%Electrical
Appliances and Housew are
6%
Other29%
Wearing Apparel5%
Plastic Products4%Metal Products
4%
Parts of Motor Vehicles
3%
Textiles2%
Footw ear2%
The above pie charts indicate the top 10 commodities traded in 2005 and 2020 on the North Atlantic –Far East route. The “other” category is expected to decline by 9% during the 15-year period, indicating that trade will be increasingly concentrated in the larger commodities. The furniture and fixtures category is expected to gain share as production from China continues to soar.
Conclusion- Growth in the Far East will propel global trade throughout the forecast period. However, given the Panama Canals’s slow growing volume in the face of rapid trade growth, it remains unclear how much of global trade the Panama Canal will actually capture.
Panama Canal:

Panama Canal: A Question of Funding
Copyright © 2005, Global Insight
Chapter 4 - Review of ACP Transits
Canal Traffic According to the ACP's Department of Corporate Planning and Marketing, a total of 12,518 cargo ships, cargo/passenger ships, and other vessels were recorded as transiting the Panama Canal during FY2004, up over the 11,725 transits in FY2003 and reversing the 1.1% decline in transits between 2003 and 2002. The number of vessels passing through the Canal has been in decline since 1999, averaging -0.8% over the last 5 years. The decline in vessels reflects the world's increased fleet size of Panamax and post-panamax vessels, the latter of which do not fit through the canal.
30Figure 4.1: Transit Activity Through the Panama Canal
10,500
11,000
11,500
12,000
12,500
13,000
13,500
14,000
1985 1987 1989 1991 1993 1995 1997 1999 2001 20030
100
200
300
400
500
600
700
800
Millions
Number of Commercial Transits (left scale) Toll Revenue (right scale)
Cargo, Long Tons (right scale) PC/UMS (right scale)
The compound annual growth rates of cargo and PC/UMS are relatively flat at 1.9% and 2.4% over the last 19 years. During the same period, toll revenues have increased at a CAGR of 5.0%.
30 Note: 1985-94: Panama Canal Net Tonnage, FY1995 on PCUMS Data from PCC & ACP Annual Reports: (Oceangoing Commercial Traffic Table 1 to 1999). 2004 data from Department of Corporate Planning and Marketing, Table No. 4. http://www.pancanal.com/eng/maritime/reports/table04.pdf
31

Panama Canal: A Question of Funding
Copyright © 2005, Global Insight
The number of full containerships, refrigerated cargo ships, and vehicle carriers traveling through the canal has grown. Over the last 5 years, the compound annual growth rate in transits is 9.3% for full containerships, 2.6% for refrigerated cargo ships, and 5.4% for vehicle carriers. Meanwhile, the number of dry bulk carriers and tankers transiting the canal has declined to CAGRs of -5.8% and -3.3% respectively. Over the last five years, the number of full containerships transiting the canal has experienced the largest increase, up 908 vessels, for a total of 2,536 vessels in 2004. This compares to an overall decline of all vessel types, down 485 vessels between 1999 and 2004, with a total of 12,518 vessels in 2004. Figure 4.2 illustrates the types of vessels that travel through the canal. Dry bulk carriers have carried the largest total cargos, ranging from 80 to 106 million long tons per year. Vehicle carriers and tankers represent the fewest number of transits and although tankers experienced rebounded growth between 2003 and 2004, it is unlikely that tankers will surpass the remaining ship types in terms of number of transits through the canal.
31Figure 4.2: Canal Traffic by Type of Vessel
0
500
1,000
1,500
2,000
2,500
3,000
3,500
4,000
1998 1999 2000 2001 2002 2003 2004
Num
ber o
f Tra
nsits
Vehicle Carriers Tankers Refrigerated Cargo Ships
Dry Bulk Carriers Full Container Ships Other
As can be seen in Figure 4.3, tonnage on oceangoing commercial vessels has been on the rise. The average PC/UMS net tonnage (millions) of all vessels transiting the canal in 1992 was 15,000, while in 2003 the average had grown close to 20,700 and surpassed 21,200 in 2004. Average PC/UMS tonnage experienced a CAGR of 2.9% between 1992
31Data from ACP Annual Reports (1998 – 2003).
32

Panama Canal: A Question of Funding
Copyright © 2005, Global Insight
and 2004. However, total net tonnage (PC/UMS) has only grown at a CAGR of under 1% over the same period.
32Figure 4.3: Average PC/UMS Net Tonnage
14,000
16,000
18,000
20,000
22,000
1992 1993 1994 1995 1996 1997 1998 1999 2000 2001 2002 2003 2004
Mill
ions
Figure 4.4 illustrates which routes dominate canal traffic. With the exception of the “other” category, cargo traveling the East Coast United States–Asia route clearly dominates the Panama Canal’s cargo. It is unclear why that share is decreasing, although it may indicate that the growing trade from China is using other routes.
33Figure 4.4: Long Tons of Commercial Cargo by Route
020
4060
80100120
140160
180200
1992 1993 1994 1995 1996 1997 1998 1999 2000 2001 2002 2003
Mill
ions
of L
ong
Tons
East Coast US - Asia OtherAsia - East Coast US East Coast US - West Coast South AmericaEurope - West Coast US East Coast US - West Coast Central AmericaEast Coast South America - West Coast US
33 Figures 4.3 and 4.4 Calculated by Global Insight using data from ACP Annual Reports.
33

Panama Canal: A Question of Funding
Copyright © 2005, Global Insight
Panamax Traffic Growth is best measured by the size of the vessels passing through the canal. The share of Panamax vessels have been increasing over time. The percent share of Panamax vessels that pass through the canal has been rising steadily with the most significant growth occurring since 1999. In fact, Panamax-sized vessel transits increased 6.2% in the first quarter of 2005.34 The growth in Panamax transits indicates the trend toward larger ships, and is an impetus behind the ACP’s proposal to expand the canal to accommodate Post-Panamax vessels.
Toll Revenues Tolls have been implemented since the opening of the canal to cover costs of operations and improvements. Revenue from tolls has steadily increased over the years, growing 67% in 10 years, from $398 million collected in 1993 to $666 million collected in 2003. The amount of tolls paid by full containerships has grown the most relative to other vessel types, as is evident in Figure 4.5.
Figure 4.5: Revenue from Tolls
$0
$50
$100
$150
$200
$250
1992 1993 1994 1995 1996 1997 1998 1999 2000 2001 2002 2003 2004
Mill
ions
of D
olla
rs
Refrigerated Cargo Ships TankersVehicle Carriers Full Container ShipsOther Dry Bulk Carriers
34 “ACP Announces Fiscal Year 2005 First Quarter Metrics.” ACP. February 16, 2005. Public presentations by the ACP (February 2005).
34

Panama Canal: A Question of Funding
Copyright © 2005, Global Insight
Figures 4.5 and 4.6 display the trend that as the total number of vessels that pass through the Panama Canal has decreased over the last several years, the revenue received from collecting tolls continues to grow. Greater revenue in the face of fewer transits is evidence of the larger ship sizes that are transiting the canal. Note Figure 4.3 which indicates growth in PC/UMS.
35Figure 4.6: Falling Transits but Rising Revenue
10,500
11,000
11,500
12,000
12,500
13,000
13,500
14,000
1992 1994 1996 1998 2000 2002 2004
Vess
els
in T
rans
it
$0
$100
$200
$300
$400
$500
$600
$700
$800
Toll Revenue
(Millions of D
ollars)
Total Transits (left scale) Total Revenue from Tolls (right scale)
Even without implementation of the proposed expansion plans, revenues are already set to increase further due to the new containership toll structure. This new toll structure removes containerships from PC/UMS calculations and leads to substantial toll increases on containerships. Thus, containerships will continue to compose the lion’s share of the ACP’s toll revenue. The following toll increase will be levied in phases, with the maximum Laden rate of $54 being implemented May 1, 2007.
Table 4.1: Containership Toll Schedule36
TEU Tolls - Laden TEU Tolls - Ballast Implementation Date
$42 $33.60 May 1, 2005$49 $39.20 May 1, 2006$54 $43.20 May 1, 2007
Transit Scenarios In order to understand the impetus behind the canal’s proposal to expand, Global Insight has prepared a glimpse of the market potential for the canal. In addition, due to the fact that the ACP’s ability to repay its expansion loans will be largely determinant on the 35 Figures 4.6 and 4.7 data from ACP Annual Reports. 36 ACP. http://www.pancanal.com/eng/general/peajes-en-el-canal.html
35

Panama Canal: A Question of Funding
Copyright © 2005, Global Insight
levels of revenue the canal generates in the future, Global Insight has prepared three scenarios of future transits and analyzes their impact on revenue.37 It is important to note that only revenue from tolls is projected. Revenue from asset sales and other fees is not considered.38
Market Potential- The Market Potential scenario assumes that there are no capacity constraints and that the canal can accept all traffic that demands its use. Under Global Insight’s projections, the canal has a market potential for 2.3% annual growth, resulting in 12,800 total transits in 2005, 14,350 in 2010 and 16,000 transits in 2015.39 Cargo (in long tons) is expected to grow from its 2004 level of 200 million to 220 million in 2006, 256 million in 2010 and 314 million long tons in 2015.40 The forecast of PC/UMS only includes non-containerships beginning in 2005 but is projected to grow at 1.5% reaching 196 million in 2010 (up from the 2005 level of 182 million), and 212 million in 2015.41 Based on these projections and the unconstrained growth in transits, revenue will grow at roughly 2.5% each year from 2005 onward. This revenue growth figure includes growth in revenue from containerships at 6.0% each year while revenue from non-containerships declines a little over 1% each year.42 Under these growth rates, the market potential for the canal includes a revenue bump from $699 million in 2004 up to $803 million in 2005 (due to the implementation of the new toll structure). By 2010, revenue could be up to $971 million and soar as high as $1104 million by 2015. Given the market potential, the canal certainly seems justified in its desire to expand – especially in the face of expected growth of larger ships. It is important to note, however, that the canal has not been able to successfully capture a large share of global trade growth in recent years. In fact, while global trade has grown at a CAGR of 7% in the last 20 years, total tonnage PC/UMS has grown at a CAGR of less than 1%. Even with expansion, the canal may still not be able to capture a large portion of this trade. Scenario 1: Base-
37 With each scenario, analysis of containerships and non-containerships is separated due to the ACP’s change in toll structure which removed containerships from PC/UMS calculations. 38 In 2003, 72% of the canal’s revenue came from tolls. ACP Annual Report. 2003. 39 Assuming annual growth of 2.3%. Full containerships are forecast to grow at 0.1% each year with non-containerships growing at 2.2% annually. 40 Cargo is projected using a weighted average growth rate for each year of trade along the West Coast and North Atlantic routes. Forecasts of these trade routes was obtained from the Global Insight Trade Navigator. 41 PC/UMS Millions was projected at 1.5% each year. This figured was derived as a weighted average CAGR for PCUMS between 1994-2003. 42 See Appendix 1 for a description of revenue calculations.
36

Panama Canal: A Question of Funding
Copyright © 2005, Global Insight
Global Insight’s base case transit scenario is the scenario that we believe to be most likely given the canal’s current capacity constraints.43 Despite the canal’s recent achievement of 12,518 transits in 2004, Global Insight assumes that transits will slowly decline to 11,500 transits a year over the forecast period based on transit levels witnessed in 2002 during improvements, limited transits during expansion construction beginning in 2007, and the proclivity towards larger ships and fewer transits. Under this scenario, cargo (in long tons) is expected to grow at 2.3% reaching 229 million in 2010 and 257 million long tons in 2015. Total tonnage PC/UMS is projected to grow at 0.8% to reach 188 million in 2010 and 196 million in 2015. Based on these constrained projections, revenue will grow at roughly 1.4% each year from 2005 onward. This revenue growth figure includes growth in revenue from containerships of 2.0% each year while revenue from non-containerships is a positive 0.8% each year. Under these growth rates, revenue in 2005 will be the same as in the market potential scenario, and reach $898 in 2010. By 2015, revenue could be up to $961 million. Scenario 2- Scenario 2 holds total annual transits to 12,500. Under this scenario, cargo and PC/UMS are expected to grow at the same rates as in Scenario 1 and will reach the same annual levels. The difference in the two scenarios surfaces in the cargo and total tonnage PC/UMS per transit figures, which are ultimately used to calculate revenues (as seen in Appendix 1). Based on the cap of 12,500 transits per year, revenue will grow to $865 million in 2006, $950 in 2010 and $1016 million in 2015. The bulk of the canal’s revenue comes from larger containerships. In this scenario, it is expected that excess cargo from would-be transits over 12,500 can spill over onto ships transiting the canal, thereby increasing the average ship size and increasing revenue. Scenario 3- Scenario 3 is clearly the optimistic scenario with transits topping out at 13,500 – a level not witnessed by the canal since 1999. Under this scenario, revenue is recognized more slowly as transits grow at 2.3% each year until the maximum level of 13,500 is reached. As in scenarios 1 and 2, cargo and PC/UMS growth rates are held constant across the constrained scenarios leaving the per-transit statistics to vary and subsequently determine revenues. Based on the cap of 13,500 transits each year, revenue will grow to $871 million in 2006, $976 million in 2010 and $1062 million in 2015.
43 Global Insight does not assume an increase in transits upon the completion of construction.
37

Panama Canal: A Question of Funding
Copyright © 2005, Global Insight
Figure 4.7: Total ACP Revenue from Market Potential and Scenario Analyses
800850900950
1,0001,0501,1001,1501,2001,2501,300
2005 2007 2009 2011 2013 2015 2017 2019
Mill
ions
Market Potential - Total Revenue Scenario 1 - Total Revenue
Scenario 2 - Total Revenue Scenario 3- Total Revenue
Table 4.2: No. of Commercial Transits and Revenue from Various Analyses
2005 2006 2010 2015 2020Market PotentialNo. of Commercial Transits 12,806 13,100 14,348 16,076 18,011Total Revenue (Millions) 803 864 971 1,104 1,293
Scenario 1No. of Commercial Transits 12,500 12,000 11,500 11,500 11,500Total Revenue (Millions) 802 839 897 961 1,031
Scenario 2No. of Commercial Transits 12,500 12,500 12,500 12,500 12,500Total Revenue (Millions) 807 864 950 1,016 1,088
Scenario 3No. of Commercial Transits 12,806 13,100 13,500 13,500 13,500Total Revenue (Millions) 806 871 976 1,063 1,158
Note: for further detail regarding Transit Scenarios, please refer to Appendix 2.
38

Panama Canal: A Question of Funding
Copyright © 2005, Global Insight
Chapter 5 – Review of ACP Financial Statements
Revenue Accumulation – The “Expansion Fund” Since the transfer of the Canal to Panama, there has been a savings fund for future modernization and expansion efforts of the Panama Canal. Titled the “Investment Program,” a portion of each year’s retained earnings is remitted for future expansion projects. The amount of retained earnings to be allocated are based on the expectation of investments to be realized during the current year.44 Given the magnitude of proposed expansion plans, it is expected and highly likely that the investment fund will be utilized for this project. Under the 1999 transfer agreement, the Panama Canal Commission paid 176,035 Balboa to the investment program. An additional 1,700,000B was allocated for a “locks overhaul reserve.”45 As seen in Table 5.1, since 2001, the ACP has committed roughly 70% of its retained earnings to the expansion fund.
Table 5.1: Annual Funds Remitted to the Investment Program46
Investment Program (Expansion Fund), Thousands of Panamanian Balboa
2003 2002 2001 2000
Ending Balance 341,616 215,403 137,276 62,776
Annual Contribution from ACP 126,213 78,127 74,500 62,776
Share of Total Retained Earnings 69.8% 67.3% 72.6% 61.8% The ACP received 72% of its revenue from tolls in 2003. Figure 5.1 illuminates not only the growth in revenue that the ACP has witnessed since 2002, but also the ship types that are generating that revenue. Despite the negative growth in revenue by tankers and dry bulk vessels in 2002 and 2003, high growth in containerships, as well as growth in the other ship categories will be enough to generate high revenue growth in the near future.47
44 ACP Financial Statements 2000. 45 Now assumed to be included in the overall Investment Program. ACP Financial Statements 2000. Assume 1 Balboa=1USD. The Balboa is at par with the US Dollar. Although the ACP reports figures in Balboa, the U.S. dollar is the circulating currency in Panama. 46 ACP Financial Statements; data reported in Panama Canal Fiscal Years. 47 See Chapter 4 for more detail on revenue forecasts.
39

Panama Canal: A Question of Funding
Copyright © 2005, Global Insight
Figure 5.1: Revenue by Ship Type (% change year ago)
-15%-10%-5%0%5%
10%15%20%25%30%35%40%
1992 1993 1994 1995 1996 1997 1998 1999 2000 2001 2002 2003
Dry Bulk Full ContainershipsVehicle Carriers TankersReefers Other
The new container toll structure will greatly add to the revenue of the ACP. With a 16.7% increase in the per TEU toll between 2005 and 2006, followed by a 10.2% increase between 2006 and 2007, the ACP will be able to add to its expansion fund quickly in the immediate years leading to construction. In reality, containerships are financing expansion before construction even begins. Based on the historic proclivity to commit an approximate 70% of total retained earnings to the investment program, coupled with the growth in revenue over 2002 and 2003, Global Insight estimates that the ACP will be able to accumulate a rough $1bn before construction begins in 2007. Whatever the ACP is able to accumulate, Global Insight assumes that revenue accumulation in the expansion fund will be used to finance expansion costs up front to delay borrowing and subsequent interest expense as long as possible.
Retained Earnings The ACP divides its retained earnings into “Appropriated” and “Unappropriated” Retained Earnings. Appropriated retained earnings divert ACP Net Income to a handful of designated programs. The list of designated programs has grown somewhat since 2000 – in 2000 appropriated earnings assigned 62,776,000 Balboa48 to the investment program (otherwise known as the expansion fund) and 8,000,000 Balboa for a catastrophic risk reserve fund.49 In 2001, the ACP added a Social and Environmental program for the canal which sets aside funds to protect the canal watershed. While up to 48 Assume 1 Balboa=1USD. The Balboa is at par with the US Dollar. Although the ACP reports its financial statements in Balboa, the U.S. dollar is the circulating currency in Panama. 49 ACP Financial Statements, 2000.
40

Panama Canal: A Question of Funding
Copyright © 2005, Global Insight
10,000,000B is able to be appropriated to the environmental program, in 2001, the ACP set aside 5,000,000B.50 In 2003, the ACP Board of Directors approved the creation of a reserve for contingencies and working capital. Rather than setting a firm limit for this reserve, the Board determines when the reserve should be funded on a periodic basis. 10,000,000B was initially set aside for this reserve. Additionally, the Board of Directors approved an increase in the catastrophic risk fund of up to 36,000B. However, the ACP has not yet contributed the maximum amount of funds allowed. As seen in Table 5.2, the ACP added 15,000B to the Catastrophic Risk Fund in 2003 for an ending balance of 26,000B.51
52Table 5.2: Breakdown of Appropriated Retained Earnings
Appropriated Retained Earnings, Thousands of Panamanian Balboa Ending Balance of Funds
2003 2002 2001 2000Investment Program (Expansion Fund) 341,616 215,403 137,276 62,776
Reserve for Catastrophic Risk 26,000 11,000 11,000 8,000
Social and Environmental Program of the Canal watershed 5,000 5,000 5,000 N/A
Contingencies and working capital corporate reserve 10,000 N/A N/A N/A
Appropriated Retained Earnings 382,616 231,403 153,276 70,776
The remaining retained earnings after necessary revenue is diverted to the programs in Appropriated earnings is grouped into Unapropriated earnings. Unappropriated earnings are then remitted to the Panamanian government.
Remittances to the Panamanian Government
Article 41, Section Three, Chapter III of the Organic Law stipulates "After covering the costs of Canal operation, investment modernization and expansion, as well as the necessary reserves provided by the Law and the Regulations, any surplus shall be forwarded to the Panamanian Treasury in the following fiscal period."53 Thus, all unappropriated retained earnings are remitted to the government. In other words, the net income for a given period, after deducting the reserves provided by the respective laws and regulations is transferred to the Panamanian Treasury in the following fiscal period.
50 ACP Financial Statements, 2001. 51 ACP Financial Statements 2003. 52 ACP Financial Statements. 53 ACP Financial Statements 2001.
41

Panama Canal: A Question of Funding
Copyright © 2005, Global Insight
Further remittances to the government are required through Article 39 of Panamanian Organic Law. Under Article 39, the ACP shall remit to the Panamanian Treasury a portion of its “revenue collected from vessels paying tolls for use of the Canal.” In 2003, the ACP paid the Panamanian Treasury 14,098,000B.
Finally, the ACP pays the Panamanian government a required “public service fee.” In 2001, 2002 and 2003, this fee was 29,000,000B54 but is expected to increase as the government faces increased fiscal problems and is likely to tap the ACP for more resources.
The ACP is a reliable source of revenue for the fiscally strapped Panamanian government. However, it is unclear how the amount of funds paid to the government will change should the ACP have difficulty meeting expansion loan repayments. Will the ACP attempt to withhold much needed revenue from the government, or will the ACP be forced into higher tolls and/or debt restructuring?
Creditworthiness Long –Term Debt?- A typical credit analysis involves the study of various debt ratios. What is unique about the ACP is that they have no long-term debt on their balance sheets. To this point the canal has been able to finance its improvements on its own. The lack of long-term debt should enhance the ACP’s appeal to creditors due to the fact that whatever debt is incurred for financing the canal expansion will not have to compete with existing debt for order of repayment in the event of a liquidity crunch. However, analysis of the ACP’s current ratio indicates that under current circumstances, a liquidity crunch is not likely. Current Ratio- The current ratio is used as a measure of an entity’s ability to meet its short-term obligations. While it is more likely that the ACP will obtain long-term financing to fund the canal expansion, the current ratio does indicate how liquid the canal has been since 2000. Companies often hope for a current ratio of 1 or 1.5 – the ACP never dropped below 3.0 (3x the current assets to current liabilities) and was neared 4.0 in 2003.
54 ACP Financial Statements, 2003.
42

Panama Canal: A Question of Funding
Copyright © 2005, Global Insight
Figure 5.2: Impressive Current Ratio Sustained
2000
2001
2002
2003
0.0 1.0 2.0 3.0 4.0 5.0
What will be important for creditors to remember is should the ACP choose to borrow in the neighborhood of $5 billion, the magnitude of loan payments will place the ACP in a situation it has never before faced. High current ratios are not as significant when considering the fact that the ACP has never taken on debt of this nature. It remains to be seen how the ACP will respond to being under this mountain of debt. What becomes clear from analyzing the ACP’s financial statements is that the ACP will have to turn to external financing for the majority of the expansion costs. Even in an optimistic scenario where expansion costs are only $4.5 billion, the $1 billion expansion fund will only put a dent in total costs. Further, even if the ACP liquidated its current assets, based on the current assets available in 2003, this would only give the canal another $600 million to put towards expansion costs. On a positive note, the ACP will benefit from a creditworthy state of finances (to say nothing of other risks that will influence cost of borrowing).
43

Panama Canal: A Question of Funding
Copyright © 2005, Global Insight
44

Panama Canal: A Question of Funding
Copyright © 2005, Global Insight
Chapter 6 – Alternative By-Pass Options The Panama Canal has been able to capture a large share of freight traffic largely because it is the shortest trip along key trade routes - namely, routes between Asia and the east coast of the United States, the west coast of South and Central America and the east coast U.S., and Europe to the west coast of the U.S. and Canada. However, Panama is not the only viable option. The two most feasible alternatives to the Panama Canal for the dominant Asia to U.S. East Coast trade are the mini-landbridge across the United States and the Suez Canal. Consider a scenario in which a containership travels from Shanghai to New York. The time differential between traveling through the Panama or the Suez Canal is not significant if one considers a routing that has the vessel stopping at Los Angeles or Long Beach before proceeding to the East Coast via the Panama Canal. This scenario is a very likely routing for any ship over 6,000 TEU. The differential is estimated in Table 6.1:
Table 6.1: Additional Days to U.S. East Coast
Direct Panama Route Panama via Los Angeles/Long Beach via Suez
Savannah 2.0 4.4New York 2.1 3.0
45

A Question of Funding
Copyright © 2005, Global Insight
46
Table 6.2 displaying the comparative transit time of the all water route via the Panama Canal and the U.S. mini-landbridge also indicates that alternative routings to the Panama Canal are plausible from most origins to New York. In other words, if the U.S. and Canadian railways continue to make major investments and to improve their service, they can be competitive in terms of transit times.
Table 6.2: Comparative Transit Times55
New York/New Jersey via All Water Service
Sea+days in Los Angeles/Long
Beach
+days on Mini-Land
Bridge
+delays in Port/Rail
RoadTOTAL Sea
+days in Seattle/ Tacoma
+days on Mini-Land
BridgeTOTAL Days
vs. Los Angeles/Long
Beach
vs. SeatTaco
from:ong 12 2 7 2 23 10 2 7 19 20
tle/ma
FastestHong K 1
China - South 12 2 7 2 23 11 2 7 20 23 0 3
China - Central 11 2 7 2 22 12 2 7 21 26 4 5
China - North 12 2 7 2 23 17 2 7 26 29 6 3
Taiwan 11 2 7 2 22 11 2 7 20 19 )
South Korea 9 2 7 2 20 10 2 7 19 20 0 1
Japan 9 2 7 2 20 8 2 7 17 23 3 6
Singapore 16 2 7 2 27 16 2 7 25 26 1
via U.S. West Coast - Pacific Southwest Days Longer (Shorter) via All Water Service
Fastest Transit to New York/New Jersey
via U.S. West Coast - Pacific Northwest
(3)
(3) (1
(1)
55 CompairData; Containerisation International
Panama Canal:

Panama Canal: A Question of Funding
Copyright © 2005, Global Insight
From Shanghai, travel across the U.S. landbridge to New York (as opposed to travel via Panama) will add an approximate 3 days of transit time on the shortest overland and sea distance option via the Pacific Northwest. Travel via the Suez canal will add roughly a similar number of additional days steaming time to the trip. Considering the risk of the waiting time at the Panama Canal that ships incur when opting out of the canal’s booking system however, 2-3 additional days steaming time via the alternate routes is often negligible. Additional steaming time does come at an average cost of $35,000 per day for containerships. However, while this cost may seem high to the layman, it is usually an insignificant cost for a large containership when the additional steaming time is only 3 days. Turning our attention to the issue of cost competitiveness the recently announced container toll increase by the ACP narrows the gap between the cost of traveling through the Panama Canal and alternate routes. On a raw per TEU basis, use of the U.S. landbridge costs shippers $800. Currently, the raw per TEU cost for traveling through the Panama and Suez Canals are $42 and $51 respectively, for the Carrier. In response to these tolls, shipping lines are passing these higher costs along by levying surcharges on shippers up to $165 per TEU according to rate quotes from carriers and from press reports. The estimated total freight rate of a 40ft high cube container loaded with textiles from Shanghai to New York via Panama is $2437 on a TEU basis. However, the freight rate from Shanghai to Los Angeles is only $1829 per TEU, indicating an additional freight cost of $608 per TEU to travel via Panama as opposed to stopping in Los Angeles.56 With an $800 per TEU charge to travel from Los Angeles to New York via rail, the United States mini-landbridge only costs $200 per TEU more than traveling through the Panama Canal. As the tolls increase, as announced, this competitive edge will be eroded. For containers destined to the Midwest, the competitive edge is not apparent. Global Insight assumes that the terminal handling charge is equal on both coasts and therefore not a factor. On a per TEU basis, the cost of traveling via Panama and Suez are close the same at the 2005 toll of $42 per TEU, and will be virtually the same at the 2006 toll of $49 per TEU. Further, at the planned 2007 rate of $54 per TEU, Panama’s tolls surpass the cost of transiting Suez on a per TEU basis. 57 Table 6.3 also displays possible toll increases that could be levied by the ACP to finance expansion. The declining price differential (including the cost of 3 days additional steaming time) as tolls increase indicates the growing ease at which Carriers may find it optimal to travel via Suez rather than Panama.
56 Global Insight conducted several interviews with major carriers to obtain the aforementioned rates. 57 The new toll structure will be phased in. The $54 rate will be implemented in 2007. http://www.pancanal.com/eng/general/peajes-en-el-canal.html
47

Panama Canal: A Question of Funding
Copyright © 2005, Global Insight
Table 6.3: Costs associated with Traveling via Panama vs. Traveling via Suez58
via Suez
Raw Per TEU Cost $54 $51
Additional Steaming Time Required (days) 0.00 3.00
Steaming Time Inclusive TEU Cost (at $35,000 per day) $49 $89
Possible % Increases in Panama Tolls New Cost Differential5% $56.70 $31.8010% $59.40 $29.1015% $62.10 $26.4020% $64.80 $23.7025% $67.50 $21.0030% $70.20 $18.30
via Panama
The Panama Canal’s new containership toll structure has further implications for the cost of container shipping beyond the simple toll per TEU fee. Under the new toll structure, containerships are only charged a ballast rate if the entire ship is empty. However, as containerships usually travel with some cargo (albeit at less than capacity), near empty ships are still charged at the laden rate. Thus, a 4,200 TEU ship (less an allowance for “line of sight” which we assume to be 10 percent) charged at the 2007 rate of $54 per TEU toll will have to pay $205,200 each way through the canal, for a total of $410,400 (not including tug fees, booking fees, etc). Compared to the cost of transiting in 2005 with a TEU charge of $42, for a total of $176,400 each way, the increase in the toll is nearly 29% over the two intervening years. Other alternatives to the Panama Canal do exist, although they are less popular than the U.S. landbridge and Suez Canal options. These options include Mexico multi-modal and Cape Horn. The Mexico option, which has been gaining popularity as of late, involves shipping goods into Mexican ports and transporting them by rail to the United States. While the Mexico option still needs some improvements, investments are being considered to improve the efficiency of this option.59 Cape Horn, also known as “Cape Horn the Terrible,” should speak for itself. Not only does poor weather plague Carriers, but the narrow Strait of Magellan forces large ships to sail south of the Cape through the Drake Passage in order to round the tip of South America. Extra distance and high risk make this option quite unappealing to shipping lines. Ultimately, given the competitiveness of transit via the U.S. landbridge and Suez Canal, as well as growth in trade from East Asia, Panama can no longer assume it carries an absolute competitive advantage in the seaborne shipping industry. As the U.S.
58 The $42 per TEU toll in Panama is the rate that was implemented on May 1, 2005. This rate will increase to $49 in 2006 and $54 in 2007. 59 Nelson, Rainbow. “Box lines weigh up impact of higher Panama fees on their bottom line.” Lloyd’s List. May 26, 2005.
48

Panama Canal: A Question of Funding
Copyright © 2005, Global Insight
landbridge and Mexico options improve their efficiency, Panama will be increasingly challenged to keep its costs in check and its quality of service high.
49

Panama Canal: A Question of Funding
Copyright © 2005, Global Insight
50

Panama Canal: A Question of Funding
Copyright © 2005, Global Insight
Chapter 7 - Potential Project Costs
The final cost of the Panama Canal expansion project will ultimately be determined by the project tasks that the Panama Canal Authority (ACP) decides to undertake and the extent to which implementation of those tasks goes according to plan. The former is nearly impossible to estimate accurately. The only information past precedent of similar large-scale transportation infrastructure projects tells us is that various unforeseen events frequently result in a final price tag that is higher than originally expected. Despite the fact that the ACP has yet to determine and release the exact expansion project tasks that will be included in its final proposal,60 the main task in the expansion effort will be the construction of a third set of locks that will enable the Canal to accommodate vessels of up to 10,500 TEU.61 The preliminary dimensions of the canal with the proposed expansion are: 61 meters wide by 427 meters long by 18.3 meters of clearance, but dimensions may be adjusted as the specifics of canal expansion are finalized.62 According to deputy canal administrator Manuel Benitez Hawkins, the third lock system will cost somewhere between $3 and $6 billion. Benitez’ cost estimate includes 18 to 24 months for various feasibility studies and an additional six to seven years for actual construction. However, some engineers view these estimates as too conservative and place a $10 billion price tag on expansion efforts. Such higher priced estimates include the costs of potential project elements such as a water recycling system that will allow the locks to operate with less water.63 Given the wide variety in the potential project costs, Global Insight considers three separate cost scenarios: a Base case scenario of $6 billion; a Pessimistic case of $8 billion; and an Optimistic case equal to $4.5 billion. Our base case incorporates industry opinions, canal statements, and mild cost overruns. All assumptions incorporate estimates from a diverse group of parties and capture estimated project costs.
60 The final ACP expansion proposal will have to go through a four-part approval process. First, the ACP Board of Directors must review and approve the proposal. (Part 1 is expected to occur at any time in the near future). Second, the proposal must be approved by the Panamanian Cabinet Council, followed by the Panamanian Legislative Assembly. Finally, Panama’s national public must vote to approve the proposal in a national referendum. Given the current priorities of the Panamanian Government, a referendum is not expected to occur until November 2005, but could be as late as the first quarter of 2006. Seaport. 61 Nelson, Rainbow. Lloyd’s List. May 26, 2005. 62 Hummer, Charles. "The Panama Canal: A Look Back, A Look Forward." Terra et Aqua. March 18, 2003. 63 Seaport, Fairplay International Shipping Weekly, and APEDE Conferencia Annual de Ejecutivos 2005.
51

Panama Canal: A Question of Funding
Copyright © 2005, Global Insight
52

Panama Canal: A Question of Funding
Copyright © 2005, Global Insight
Chapter 8 - Financial Markets: Interest Rates and Forecasts
Available financing for the Panama Canal expansion is likely to be priced at some basis point total over an interest rate index such as LIBOR (London Inter Bank Offer Rate). LIBOR historically has moved in similar patterns as the U.S. federal funds rate, though in recent history LIBOR is generally 1-2% lower than the 30-year U.S. treasury rate with the exception of the large difference in 2003.
64Figure 8.1: 30-Year U.S. Treasury vs. LIBOR
0.0
1.0
2.0
3.0
4.0
5.0
6.0
7.0
8.0
9.0
10.0
1999 2000 2001 2002 2003 2004 2005
Perc
ent p
er A
nnum
30-Year Treasury
0.8%
3.7%
Average 1-Year LIBOR
As is evident in the interest rate sensitivity analysis (Appendix 3) long-term interest rates will have a significant impact on the overall total that the ACP must repay over the life of its loan. The ACP will not only be affected by interest rates at the time of its initial borrowing, but may also be impacted by interest rates 10+ years after its initial borrowing to the extent that it needs to refinance its debt. This is particularly likely in Scenarios 2 and 3 where the repayment horizon is only 15 and 10 years respectively, and the required annual payments get larger, faster (Appendix 4). Therefore, consideration of current and future interest rates is warranted. Short-Term, United States- The U.S. Federal Reserve will raise interest rates through November 2005, but is likely to hold them constant through 2006. Due to the Fed’s concern over inflation, a pause in interest rates is not likely to come sooner. The global expansion has sent commodity prices sharply higher, and productivity growth has slackened, raising unit labor costs.
64 Global Insight and Fannie Mae. June 2005.
53

Panama Canal: A Question of Funding
Copyright © 2005, Global Insight
Although there are now signs that commodity prices are stabilizing, companies have become bolder in passing on some of their higher costs. This is evidenced by the fact that the core CPI showed troubling increases of 0.3% in February and 0.4% in March and indicated no signs of decline until May. While hiring has not improved sufficiently to boost wage pressures yet, the Fed is nervous about the possibility of a resurgence of "inflation psychology." Global Insight expects core CPI inflation of near 2.5% to prompt further, gradual Fed tightening. While the inflation evidence is not bad enough to warrant an acceleration of rate hikes, softer evidence of economic growth will lead the Fed to hold rates steady in 2006 after increasing rates through November of this year. The Fed is less sanguine than the bond market about inflation—after all, worrying about inflation is the job of central banks. Thus, even in the face of slowing growth, the Federal Open Market Committee is unlikely to waver from its commitment to get the federal funds rate into the "neutral zone" of between 4% and 5%. Thus, Global Insight believes that the Fed will want to move toward a funds rate of 4.0% by the end of 2005 and 4.5% by early 2008. An interest rate pause in 2006 is anticipated, as previous hikes take effect and economic growth slows. Long-Term, United States- Assuming that current trends persist in the future, Global Insight expects the federal funds rate to be 5.3% after 2010. The 30-year Treasury is expected to reach 6.7% in 2010 and 6.8% in 2028. The 30-year Treasury will reach its peak of 6.9% in 2021.
65Figure 8.2: Key Interest Rates
0.0
1.0
2.0
3.0
4.0
5.0
6.0
7.0
8.0
9.0
10.0
1999 2002 2005 2008 2011 2014 2017 2020 2023 2026
Perc
ent p
er A
nnum
U.S. Federal Funds Rate Prime Rate 30-Year Treasury
65 Global Insight. June 2005.
54

Panama Canal: A Question of Funding
Copyright © 2005, Global Insight
Assuming that the ACP receives funding at 550 basis points over the U.S. 30-year Treasury rate,66 and the Global Insight financial model is based on a current 30-year Treasury of 5.2%, the additional 1.6% could mean additional interest expense of anywhere between $500mn and $2bn, depending on the scenario. Europe- In the Eurozone, while the early evidence on 2005 growth was better than for the fourth quarter 2004, the latest evidence points to a renewed deterioration in sentiment and growth. The European Central Bank (ECB) is no longer talking of raising interest rates anytime soon, but has dismissed the notion of a rate cut. Europe’s weak growth and political turmoil have driven the dollar up against the euro and have pulled European bond yields down near 3%. Global Insight expects the dollar to reach $1.20/euro within a few weeks.67 Treasury Rates- Due to the size of financing that the ACP will have to obtain for completion of its expansion goals, the issuance of project debt in addition to a project finance loan may be a viable option. The following discussion of U.S. Treasury rates is meant to serve as a benchmark for a Panama Canal Expansion bond discussion. In reality, an ACP bond will most likely be priced at some fixed number of basis points over treasuries or LIBOR. Bond yields will generally move parallel to the funds rate over the forecast interval, but run somewhat higher. The yield on ten-year treasuries will remain below 6.0% through 2009. It hovers between 6.0% and 6.5% afterward. Global Insight forecasts a federal funds rate of 4.0% in 2006, reaching 5.25% by 2011.
66 Assuming that LIBOR is 1.5% (150 basis points) less than the 30-year Treasury rate and the ACP receives financing of 400 basis points over LIBOR. 67 Global Insight, June 2005.
55

Panama Canal: A Question of Funding
Copyright © 2005, Global Insight
68Figure 8.3: U.S. Treasury Rates
0
5
10
15
20
25
30
35
1999 2002 2005 2008 2011 2014 2017 2020 2023 2026
Perc
ent p
er A
nnum
1-Year Bill/Note Yield 2-Year Note Yield 5-Year Note Yield 10-Year Note Yield 30-Year Bond Yield
Note: The 10- and 30-Year Bond Yields are of most relevance to the ACP, although the shorter bills and notes may be used for various bridge financing or other short-term financing requirements that may arise over the duration of the project.
68 Global Insight. June 2005.
56

Panama Canal: A Question of Funding
Copyright © 2005, Global Insight
Chapter 9: Re-Defining the Panamax Vessel Size with Canal Expansion The total global container fleet, excluding the multi purpose vessels69 and the Roll On/ Roll Off vessels, numbered some 7,162 ships at the end of 2004 and is projected to rise to 8,034 ships with the delivery of newly constructed vessels this year. By 2006 this number is expected to rise to 9,300 vessels. However these numbers are composed of a mixture of small to medium feeder vessels, handy sized ships, Panamax as well as Post- Panamax vessels. The full containership fleet equaled 2 million TEU in 1990, growing by 175% to reach 5.5 million by 2000. By the end of 2004 the global fleet witnessed an additional 50% increase, resulting in 7.8 million TEU. With the surge in the newbuilding orderbook, Howe Robinson estimates that by 2008 the fleet size will have reached 12.5 million TEU, yet another 60% increase.
70Figure 9.1: The Future of the Containership Fleet
0
2
4
6
8
10
12
14
1980 1985 1990 1995 2000 2001 2002 2003 2004 2005 2006 2007 2008
TEU
Mill
ion
+50%
+175%
12.5 million TEU
+60%
69 Can also handle break bulk general cargo. 70 “Vessel Capacity and Growth Expectations.” Howe Robinson. 2005.
57

Panama Canal: A Question of Funding
Copyright © 2005, Global Insight
Figure 9.2: Size Distribution of the Full Container Fleet in TEU Terms in 200471
Panamax, 18%
2000-4000, 29%
Post Panamax,
25%
<2000, 28%
The probable deployment of the fleet in 2005 suggests that the main East–West trade routes will likely see the return of excess supply, whereas the growing North–South trades, which require smaller ships, will face a potential lack of capacity as the orderbook is slanted towards the larger ships. The probable deployment of nearly 1 million TEU on the East–West trades will further create over capacity as this influx of capacity requires trade growth of 25% to match the new capacity, something which is not projected. By 2007, a further 875,000 TEU capacity comes on stream on the East–West routes72 requiring a further 22% increase in demand to meet capacity. The size distribution of the fleet will change by 2008, but nevertheless, 66% of the world container fleet will be Panamax in its current definition, or smaller.
Figure 9.3: Size Distribution of the Full Container Fleet in TEU Terms in 200873
2000-4000,
25%
Panamax, 19%
<2000, 22%
Post Panamax,
34%
71 “Vessel Capacity and Growth Expectations.” Howe Robinson. 2005. 72 “Vessel Capacity and Growth Expectations.” Howe Robinson. 2005. 73 “Vessel Capacity and Growth Expectations.” Howe Robinson. 2005.
58

Panama Canal: A Question of Funding
Copyright © 2005, Global Insight
The Post-Panamax Fleet
59
Post-Panamax ships are defined as those ships too large to transit the canal due to either draft, length or breadth restrictions of the current locks. By May of this year, the Post-Panamax fleet totaled some 348 ships, of which 234 were four years old or less. The average characteristics of this existing fleet of Post- Panamax ships according to Clarkson’s Research Studies are:
Nominal TEU 5,974 Deadweight (DWT) 75,745 DWT per TEU 12.7 Speed in knots 24.7 Length (LOA) 292.4 meters Beam 40.4 meters Draft 13.8 meters
The current (end May 2005) containership orderbook for new Post-Panamax ships stands at a further 286 ships to be delivered over the period to 2011 but with the majority of the deliveries due before 2009. The average DWT of the current orderbook is 91,952, a 21% increase over the existing fleet. The average TEU size increases by 28% to 7,661. A recently delivered sample vessel, the Colombo Express, owned and operated by Hapag Lloyd, has the following characteristics:
TEU Capacity 8,600 DWT 102,000 DWT per TEU 11.9 Length (LOA) 330 meters Beam 43 meters Draft 14.5 meters
There are currently 30 vessels that are similar to the Colombo Express based on these characteristics, with a TEU range between 7,740 and 9,460, of which 19 are owned by the top three Operators. Of the 286 Post-Panamax currently on order, 51 are over 9,000 TEU in size, with a further 123 between 8,000 and 9,000 TEU, and 84 between 6,000 and 8,000 TEU. In other words, 90 percent of the orderbook is over 6,000 TEU. Combined with the existing Post-Panamax fleet, there will be 634 Post-Panamax ships in service, assuming no further orders. In terms of TEU capacity this implies an increase of 2.2 million on top of the existing 2.1 million capacity – effectively a doubling of the fleet. According to various publications of the Panama Canal Authority (ACP), the ACP is developing a “Canal Master Plan” that is aimed at meeting shipping demand and the current boom in the building of Post-Panamax container vessels.

Panama Canal: A Question of Funding
Copyright © 2005, Global Insight
60
This study has taken as its reference point a number of public presentations by senior ACP staff as well as from information readily available on the ACP web site. Based on these sources of information the new Panamax vessel may well have the following maximum dimensions:
Table 9.1: Panamax Dimensions based on Proposed Lock Increases
Meters Feet Meters FeetLength of Locks 305 1,000 427 1,400Vessel Length 294 965 386 1,265Width of Locks 33.5 110 61 200Vessel Width 32.3 106 54.9 180Depths of Locks 12.6 41.5 18.2 60Vessel Draft 12 39.5 15.2 50
Current Locks Proposed Locks
If these dimensions are indeed the proposed plans of the ACP for its canal expansion, then the expanded Panama Canal will be sufficient to accommodate all the Post-Panamax vessels currently on the orderbook. It is not envisaged that the next generation of containerships exceeding 12,000 TEU in capacity will be ordered for some time to come due to handling implications for ports that have not been thought through to date. Handling implications are likely to arise from a probable shift from a single engine operation (under 12,000 TEU) to a dual engine configuration (12,000+ TEU), which would have serious repercussions for the vessel width. Until the last two to three years, profitability for liner operators of containerships has been relatively low. It has only been the surging export boom from China to North America and Europe that has driven profitability to levels not seen for decades. But this has brought its own problems and risks. The price of newbuildings for the very large containerships has risen to over US$100 million per vessel. Given that service patterns are based on strings of vessels ranging from 12 to 17 there is a heavy financial burden on the Carriers leading to vessel sharing and joint services, all requiring fairly high utilization rates on the ships if they are to achieve their economies of scale and provide a solid return on investment. The option to charter ships is also both prohibitive and difficult, although the surge of newbuildings may well change this. Table 9.2 from Howe Robinson is indicative of the financial pressures in the market for vessel operators of the smaller Panamax sized ships. Data for Post-Panamax is not available due to lack of vessels on the charter market.

Panama Canal: A Question of Funding
Copyright © 2005, Global Insight
61
Table 9.2: Costs to Panamax Operators74
Jan. 2002 $ per day
Apr. 2005 $ per day Annual Cost
1000 TEU Grd 5,400 19,250 + 5.0 mn1700 TEU Grd 5,650 32,250 +9.7 mn2500 TEU Grd 7,200 38,750 +11.5 mn4500 TEU Grd 10,400 48,000 +13.7 mn
Assessment of the Containership fleet transiting the Panama Canal The size and capacity range of the current containerships using the Panama Canal has grown over time to what we estimate as an average TEU size of 3,100. The range of the ships, based on information from Lloyd’s for 2002 is indicated below:
Table 9.3: Range of Ships75
No. of Transits Total DWT Total TEU Avg. TEU per Transit % of TransitsCellular <1 73 765,471 49,971 686 4%Cellular 100 642 18,584,619 1,242,947 1,936 31%Cellular 250 866 40,594,906 2,930,409 3,385 42%Cellular 400 495 30,307,412 2,160,599 4,369 24%Total 2,075 90,252,408 6,383,926 3,076 100%
000 TEU0-2499 TEU0-3999 TEU0-5999 TEU
Based on these figures, less than 25 percent of the transits are at the top end of the Panamax range. The number of full containership transits increased to 2,536 in FY2004, which would result in an estimated 634 transits of the largest size vessels. The question is; will expanding the Panama Canal to cater for the Post-Panamax fleet induce these vessels to transit the Canal? That will depend entirely on the trade demand of the U.S. East Coast market and whether or not it can sustain a shift to larger vessels. The route choices are either: a) via Los Angeles/Long Beach to the East Coast via Panama; or b) direct all water service by passing the U.S. West Coast. If the choice is the former, then the probability of the vessel being light loaded going to the East Coast is very high after a discharge on the West Coast. The return trip will certainly be made up mostly of empty containers as the ratio of full to empty exports out of New York is virtually 50/50 and probably higher in empties on Asian trades. If the route choice is the direct all water service then it raises the question as to what the ideal vessel size is and to what extent will larger vessels play any significant role. On the return journey the same pattern will hold, i.e. the ship will be more than half full with empty containers generating no revenue, but incurring a Panama Canal toll fee.
74 “Vessel Capacity and Growth Expectations.” Howe Robinson. 2005. 75 Lloyd’s 2002.

Panama Canal: A Question of Funding
Copyright © 2005, Global Insight
62
The Round the World Services are not significant and the pattern of trade is such that these vessels will likely remain in the 2,500 to 3,999 TEU range. The number of annual transits for this type of service will remain low. The risks are obvious. To build a string or strings of new Post-Panamax vessels to service the U.S. East Coast trade is very expensive at over $1 billion per string, and competition from the West Coast ports together with the railroads will be fierce. It is therefore not at all clear that the re-definition of a Panamax vessel will be based on a “build it and they will come” basis. Nevertheless, should the expansion of the Panama Canal go ahead based on the above dimensions, then the new Panamax definition for containerships will be broadly along the lines of the Colombo Express.

Panama Canal: A Question of Funding
Copyright © 2005, Global Insight
Chapter 10 - Financial Model and Scenarios
Key Assumptions The government of Panama cannot issue sovereign debt to back any loan to the Canal.76 Thus, the Panama Canal Authority will have to seek financing for the canal expansion as an entity independent from the government. Based on this stipulation, Global Insight has developed its financial model as though the expansion were financed through a project finance structure, whereby the future cash flows of the canal will go to service its debt. Project financing deals have historically varied greatly in terms of the number of parties involved and the structure created. Global Insight assumes a fairly simplistic project financing structure whereby there is one source of finance and one interest rate over multiple tranches. The following scenarios are then used to estimate the impact on Panama Canal tolls. Interest Rate- Global Insight’s interest rate assumption for a potential project financing deal for the Panama Canal Expansion loan is partially based on borrowing rates received on other infrastructure project finance deals. It is important to note that the Panama Canal Expansion project is unique and there have been no projects in the last 10 years that accurately capture all characteristics present in the Panama Canal expansion project. Again, Global Insight makes no assumption regarding the details of a project financing deal; only that financing will be priced at a certain fixed interest rate over a designated time period. For the base case scenario, Global Insight assumed that the ACP will receive LIBOR +400 basis points, or roughly 8%. Interest rate sensitivity analysis (discussed later) covers 5 interest rate scenarios ranging from LIBOR77 to LIBOR +800 basis points. Disbursement- Because the ACP has been accumulating resources to use toward funding the expansion of the Panama Canal, it will not have to obtain all financing all at once and will be able to initiate construction without obtaining any external financing. Therefore, Global Insight assumes that the ACP will borrow funds in tranches beginning in 2009 (with construction beginning in 2007). Additionally, since the range of estimated project expenses range from $4-10bn, Global Insight conducts scenario analysis using varying borrowing amounts. All scenarios assume that the ACP will have $1 billion to apply to the cost of 76 Even if the government found legal exceptions to its inability to back Canal debt, Panama’s poor credit quality would prevent the government from contributing much to a canal expansion financing deal. 77 Where LIBOR is assumed to be fixed at 4%.
63

Panama Canal: A Question of Funding
Copyright © 2005, Global Insight
financing and therefore, will borrow $1 billion less than the estimated project costs. For example, in the base case Scenario 1, estimated costs of expansion are $6 billion so the disbursement amount is $5 billion. Disbursement amounts (project costs) of $3.5bn ($4.5bn), $5bn ($6bn), and $7bn ($8bn) are considered. Maturity- Global Insight considered three different repayment horizons in its financial model: 30, 15, and 10 years. In reality, project financing carries with it a wide variety of maturity lengths. 30-, 15-, and 10-year scenarios were chosen based on estimated length of construction time for the expansion project, as well as past project financing deal structures.78
Model Discussion Annual Payments- Table 10.1 illustrates the financing arrangement of the base case scenario. Costs are assumed to be $6bn with $5bn actually borrowed. The funds are borrowed in seven separate tranches which are each repaid over 15 years at a cost of 8%. The first tranche is not borrowed until 2009 (two years after the assumed construction start date). Figure 10.1 illustrates the ballooning nature of payments that the ACP will face.
Table 10.1: Financial Structure and Repayment of the Base Case Scenario Scenario 1 - BaseDisbursement Amount: $5,000,000,000Interest Rate: 8%Years: 15
2007 2008 2009 2010 2011Disbursement Schedule $0 $0 $800,000,000 $800,000,000 $1,000,000,000Interest Payment $0 $0 $65,075,933 $65,075,933 $65,075,933Principal Payment $26,666,667 $53,333,333 $86,666,667Repayment Amount $91,742,600 $118,409,267 $151,742,600
2012 2013 2014 2015 2016Disbursement Schedule $800,000,000 $700,000,000 $500,000,000 $400,000,000 $0Interest Payment $65,075,933 $65,075,933 $65,075,933 $65,075,933 $65,075,933Principal Payment $113,333,333 $136,666,667 $153,333,333 $166,666,667 $166,666,667Repayment Amount $178,409,267 $201,742,600 $218,409,267 $231,742,600 $231,742,600
78 A project finance deal may likely have a combination of bank loans and bonds. As bank loans typically have shorter terms (less than 10 years) and bonds provide much longer term maturities, these scenarios cover a wide range of plausible financing maturities the ACP may face.
64

Panama Canal: A Question of Funding
Copyright © 2005, Global Insight
Total Amount Due (over life of loan): $8,600,868,759 Figure 10.1 illustrates how borrowing funds in tranches will lead to a bell-shaped ballooning of loan repayments over time.
Figure 10.1: Annual Loan Repayment Schedule for the Base Case Scenario Total = $8,600,868,759
$0
$50,000,000
$100,000,000
$150,000,000
$200,000,000
$250,000,000
2007 2011 2015 2019 2023 2027
Table 10.2: Scenarios 1-6
Disbursement Amount Maturity Interest Rate Total Amount DueScenario 1 - Base $5.0 bn 15 8% $8,600,868,759Scenario 2 $3.5 bn 30 8% $9,245,433,631Scenario 3 $3.5 bn 15 8% $6,020,608,131Scenario 4 $3.5 bn 10 8% $5,095,758,963Scenario 5 $5.0 bn 30 8% $13,207,762,330Scenario 6 $7.0 bn 30 8% $18,490,867,262
Toll Increases- To obtain necessary toll increases, Global Insight used the revenue forecast generated by Transit Scenario 1-Base. From revenue, Global Insight derived Net Income for each year.79 In years where retained earnings are not enough to cover the necessary annual loan payment, necessary toll increases were calculated such that the toll increase would enable the canal to break even in the given year. Table 10.3 displays the necessary toll increases for Scenario 1 – Base. Toll increases for each scenario are tested based on 5
79 Net Income is projected forward at the same rate as revenue. 10% of Net Income was removed in each year to account for the various programs that the ACP must fund each year, as well as government detainments of funds.
65

Panama Canal: A Question of Funding
Copyright © 2005, Global Insight
different financing rates. Financing rates begin at LIBOR and increase by 200 basis points until LIBOR +800 is reached.80
Table 10.3: Necessary Annual Toll Increases at various Financing Rates
Financing Rate Necessary Toll Increase (Break even)
2009 2010 2011 2012 2013 2014 2015 2016 20174.0% 0.0% 0.0% 0.0% 0.0% 0.0% 0.0% 0.0% 0.0% 0.0%6.0% 0.0% 0.0% 0.0% 0.0% 0.0% 0.0% 0.0% 0.0% 0.0%8.0% 0.0% 0.0% 0.0% 0.0% 0.0% 0.0% 2.1% 19.8% 16.1%10.0% 0.0% 0.0% 0.0% 0.0% 0.0% 7.0% 26.7% 21.5% 21.0%12.0% 0.0% 0.0% 0.0% 0.0% 3.2% 30.4% 27.9% 26.1% 25.5%
Financing Rate 2017 2018 2019 2020 2021 2022 2023 2024 20254.0% 0.0% 0.0% 0.0% 0.0% 0.0% 0.0% 0.0% 0.0% 0.0%6.0% 0.0% 9.0% 10.2% 9.3% 8.8% 8.2% 7.6% 0.1% 0.0%8.0% 16.1% 15.6% 15.0% 14.4% 13.8% 13.3% 12.7% 4.7% 0.0%10.0% 21.0% 20.4% 19.8% 19.3% 18.7% 18.1% 17.5% 9.0% 0.7%12.0% 25.5% 24.9% 24.4% 23.8% 23.2% 22.6% 22.1% 13.1% 4.7%
Table 10.3 indicates the toll increases that will be necessary under the 5 financing rates. Note the similar bell-shaped ballooning nature of toll increases that correspond with the ballooning nature of loan repayments. Under LIBOR +200 basis points tolls would have to increase by 53% between 2009 and 2025. Under a more realistic LIBOR +400 basis points, tolls would have to increase 128% and under a highly pessimistic LIBOR +800 basis points, tolls would have to increase 272%. However, it is not likely that the ACP will levy these tolls as late as 2013 (the first year of a necessary increase). In order to make toll increases more palatable with the shipping community, the ACP is more likely to phase the toll increases in over time such that the 128% increase would begin in 2008 and continue at 5.8% per year through the year 2029. What Global Insight’s toll sensitivity analysis (Appendix 3) indicates is that the cost of financing the ACP is able to receive will greatly influence the necessary toll increases required. In Scenario 1 for example, should the ACP be lucky enough to receive a fixed 4%, with projected revenue levels, the canal would not have to increase tolls at all. Likewise, consider the most pessimistic Scenario 6, where the costs of expansion reach $8bn and the canal finances on a 30-year horizon.81 Again, a fixed 4% cost of financing results in zero toll increases, whereas a 10 or 12% financing cost will result in total toll increases of 533% and 765%, respectively. While both of these results are unlikely, it does illustrate the interrelationship between costs of financing and future toll increases. (See Appendix 3 for full break out of toll increases under each scenario). While there is risk of heavy toll increases, Appendix 3 clearly illustrates that expansion can occur with low financial impact on the shipping industry if a favorable financing arrangement can be achieved and if costs can be controlled. 80 LIBOR is assumed to be 4%. 81 30 years was deemed the most likely financing horizon should the Canal be forced to borrow $7bn.
66

Panama Canal: A Question of Funding
Copyright © 2005, Global Insight
Issues in Project Financing Bank loans play a major role in project finance, although deal structures vary widely and often include the issuance of project-backed bonds. Because infrastructure projects require substantial investments, a project-financed deal is likely to involve a syndicate of lenders from banks, specialized lending institutions and bond markets. In some cases, project managers prefer to avoid the bond issuances because they are more costly than bank loans and are more difficult to refinance.82 Most bank loans tend to max out at 10-12 years in maturity, whereas bonds can be issued over much longer time horizons. With longer maturities often comes higher risk, and thus a higher coupon rate is required. However, the issuance of bonds as part of a project finance structure can add unique benefits. For instance, since bonds can fulfill long financing requirements, they are often used to replace bank debt after the project becomes operational. Since project cash flows are somewhat more predictable after the project is complete and operational, a bond issuance at this point is less expensive than an issuance at the beginning of construction.83 Relevant Financing Deals- The following deals all influenced the base case assumptions in the finance scenarios: The Channel Tunnel – This famous tunnel raised an initial 6bn pounds to cover the planned cost of ₤4.7 billion as well as unexpected costs. The first phase of fundraising generated ₤46 million from 10 construction companies and five banks who in turn received equity shares in the Tunnel. After construction began, an additional ₤206 million was raised from a private placing of shares with international investors. A well-publicized placement on stock exchanges raised 770 million pounds and 50 underwriting banks provided ₤5 billion in loans. The loans carried 18-year maturities and were priced at 125 basis points over LIBOR during construction and 100 basis points over LIBOR once the Tunnel became operational.84
Companhia Vale do Rio Doce (CVRD) – In 2004, this Brazilian company and the world's largest producer of iron ore and pellets issued a US$500 million 30-year corporate bond with a yield to maturity of 8.35% and a spread of 336 basis points over 30-year U.S. Treasuries.85 82 The large number of investors that can get involved in a bond issuance make refinancing negotiations incredibly difficult. However, this problem can be somewhat mitigated by issuing a bond under a Rule 144a, which restricts ownership to a few institutional investors. 83 Brealey, Richard A, Ian A. Cooper and Michel A. Habib. “Using Project Finance to Fund Infrastructure Investments.” The Revolution in Corporate Finance. Eds. Joel M. Stern and Donald H. Chew Jr. Fourth Edition. Blackwell Publishing. 2003. pg. 321-323. 84 Smith, Mike. “The Channel Tunnel.” Mining Magazine. April, 1988. 85 Westlund, Richard. “Latin American Securities Review: The biggest deals of 2004.” Institutional Investor. December 1, 2004. Unlike the other project financing deals listed, CVRD used the funds to roll over existing corporate debt.
67

Panama Canal: A Question of Funding
Copyright © 2005, Global Insight
Astoria Energy - $700 million in funds were obtained for the construction of a 500 MW facility in New York City. $500 million was priced at 525 basis points over LIBOR; $200 million was priced at 875 basis points over LIBOR.86 Al-Ezzel Independent Power Project- This project included a $379 million loan and $112.7 million equity bridge loan. The main loan was originally structured at a 20-year maturity.87
Autostrade – The Italian toll road operator issued a 10-year E2.75 billion note at 5%; a 20-year E1 billion note at 5.875% and an 18-year note at 6.25%. One additional 7-year E2 billion note was issued at a fixed coupon as part of this four-tranche, bond offering. Perpignan-Figueras – This high-speed rail project between France and Spain involves $703 million in commercial debt from five major European banks. The debt is priced at 135 basis points over Euribor during construction and 150 basis points once the rail line is operable in 2009. The initial deal has a 10-year maturity, but carries an option to refinance in 2015 to extend the maturity to 35 years.88
86 “PFR’s fourth annual power project finance awards: the nominations; Power, Finance and Risk.” Euromoney Institutional Investor PLC. Power Finance and Risk. April 4, 2005. 87 “TGP: sidestepped; Latin American Oil & Gas Deal of the Year 2004.” Euromoney Institutional Investor PLC. Project Finance. March 1, 2005. 88 “Perpignan-Figueras: return ticket; Deal Analysis.” Euromoney Institutional Investor PLC. Project Finance. March 1, 2005.
68

Panama Canal: A Question of Funding
Copyright © 2005, Global Insight
Chapter 11 - Risks The biggest risks the ACP will face are default risk and interest rate risk. The broadest and most significant of the two is default risk. For the Panama Canal Expansion project the following key factors can increase the ACP’s default risk. 89
Cost overruns Resulting toll increases force Carriers to other routes Estimated demand of Post-Panamax containerships is less than expected Deforestation threatens the Canal water supply
Cost overruns- Cost overruns are a frequent occurrence with large scale infrastructure projects such as the Panama Canal expansion project. Consider the case of the Channel Tunnel construction. After years of negotiations, feasibility studies and research, initial cost estimates for construction of the Channel Tunnel was estimated at ₤5 billion (including interest payments). According to investors, project risks were relatively small and were primarily restricted to the logistics surrounding construction.90 However, like most large infrastructure projects, the unexpected is exactly what happened. Despite the engineering studies conducted, no provision was made for the friction and resulting heat that would be generated from trains speeding through the tunnel at 100mph. This, as well as other problems led to a 50% jump in the project’s cost and a final estimated cost of ₤7.2 billion.91 As can be seen in Appendix 3, larger costs of borrowing, among other things, translate into higher necessary toll increases. If the market is unwilling to bear additional toll increases, the ACP would face the risk of restructuring or default. Resulting toll increases force Carriers on to other routes- Global Insight makes an “ACP-friendly” assumption when assuming that the canal will continue to get volume and revenue growth despite toll increases. Should Carriers be deterred to alternate routes, the ACP will see its revenues fall and find making its loan repayments difficult.
89 Debt restructuring and default arrangements will be dependent on the structure of the financial deal the ACP is able to attain from investors, and as such, are not discussed here. 90 As evidenced by the low cost of debt – 125 basis points over LIBOR during construction and 100 basis points over LIBOR upon completion. Smith, Mike. “The Channel Tunnel.” Mining Magazine. April, 1988. 91 Beresford, Philip and Andrew Lorenz. “Light at the end of the tunnel?” The Sunday Times. February 25, 1990.
69

Panama Canal: A Question of Funding
Copyright © 2005, Global Insight
Estimated demand of Post- Panamax containerships is less than expected- As containerships will finance the majority of the expansion project, fewer than expected containership transits through the Panama Canal could devastate ACP repayment efforts. A reduction in Post-Panamax transits through the Panama Canal could result from ships choosing alternate routes due to high tolls, or a reduction in global trade. Deforestation threatens the Canal water supply- While it is unclear how critical the situation is, deforestation does pose a risk to the water supply of the canal. The Panama Canal, in its pre-expansion state, uses approximately 52 million gallons of water for each ship that passes through the Gatun and Miraflores locks on a trip through the canal.92 The canal relies on the Gatun Lake, fed by the Chagres River, for its water supply. The Lake receives much of its water from the rains that fall during Panama’s rainy season.93 While some water falls into the lake immediately, much of the water soaks into the forested slopes of the tropical jungle (known as the watershed forest) surrounding the Chagres and gradually streams into the Gatun Lake. However, deforested slopes cannot absorb the heavy rains. Thus, if current rates of deforestation continue, much of the water eventually bound for the Gatun Lake will instead overflow the Gatun Dam and flow out to sea. As of 2000, a study conducted by the Smithsonian Tropical Research Institute in Panama found that 53% of the original watershed forest had been destroyed. Since the United States ceded control of the canal to Panama in 1999, the Panamanian government has acted to expand the protected watershed areas, and now only small amounts of watershed are lost to deforestation each year. However, protecting the watershed is essential to the future water supply of the canal and efforts to protect it are costly.94 The shipping community has already felt the impact of a limited water supply. In the drought winter of 1990-91, lack of water forced the canal to limit trips through both sets of locks to less than 30 a day. Should deforestation of the watershed continue and the water supply falls below required levels, a temporary limitation in transits through the canal is possible. With respect to investors, a limitation in transit activity would likely result in a decline in ACP revenue and with it, a hampered ability to repay debt. It is important to note that the ACP has established a fund titled the “Social and Environmental Program of the Canal Watershed” aimed at preventing such problems from occurring. However, after the Board of Directors approved a measure to allow the ACP to maintain a balance of 10,000 balboa in the fund, the ACP has only maintained the balance at 5,000B.
92 After expansion, the Canal will likely use more water. However, the discussed water recycling system will satiate some, if not all, of the additional water requirements. It is unclear water the exact water requirement will be after expansion. 93 May to December. 94 Dean, Cornelia. “To Save Its Canal, Panama Fights for its Forests.” The New York Times. May 24, 2005.
70

Panama Canal: A Question of Funding
Copyright © 2005, Global Insight
Default Risk: Eurotunnel’s Distress- Eurotunnel provides a pessimistic, but plausible example of what could happen to Panama Canal expansion investors. It has already been mentioned that the Channel Tunnel struggled with cost overruns during construction. Now that the Tunnel is operational, Eurotunnel, the operator of the Channel Tunnel, is currently struggling to meet its interest payments. What’s more, Eurotunnel could face bankruptcy within two years if creditors can’t reach a refinancing deal of Eurotunnel’s $15 billion in debt. Under the original financing deal, creditors have the right to declare Eurotunnel in default and seize control of the Channel Tunnel. This solution will only benefit the senior debt-holders and is certainly not in the best interest of all involved creditors, but remains a possibility nonetheless. This is not the first time that the Tunnel has had problems satisfying its credit requirements. In 1998, Eurotunnel also faced bankruptcy and was forced to negotiate with creditors for 19 months.95 What drove Eurotunnel back into risk of default is a 7% decline in revenue in 2004 due in part, to a fall in income from its car and truck shuttles.96 What could further complicate matters for Eurotunnel is the maintenance investment that will soon be required for the 15 year-old Channel Tunnel. Interest Rate Risk- Appendices 3 and 4 illustrate the dramatic swings that occur in the total amount of debt the ACP will have to repay when the interest rate changes. Even small 25 and 50 basis point changes in LIBOR can mean changes in the total amount due of $130,394,461 and $2,611,787,262, respectively in the base case scenario. Should interest rates change significantly over the course of the loan, the ACP could feel itself further constrained by interest payments and be forced to increase tolls further.
95 Ashworth, Jon. “Runaway debt set to derail Eurotunnel.” The Australian. April 28, 2005. 96 “Eurotunnel ‘could go bust in two years.’” Western Morning News. April 28, 2005.
71

Panama Canal: A Question of Funding
Copyright © 2005, Global Insight
Appendix 1: Revenue Calculation Because of different toll structures for containerships vs. non-containerships, revenue in our Transit Scenarios Model must be calculated based on revenue from containerships and revenue from non-containerships. Revenue from containerships is a fairly straightforward calculation. For years in which the toll is explicitly known (2005-2007), revenue is calculated based on the projected number of containership transits, multiplied by the average estimated size of containership, and multiplied by the per TEU toll. Because nearly all containerships will be charged at the laden rate (under the new toll structure), there is no need to break out laden from ballast in the revenue calculation. Beginning in 2008, revenue from containerships is projected to grow by 2% annually. Because a significant amount of non-containerships are charged at the ballast rate, revenue from non-containerships must reflect ballast and laden tolls and thus, becomes somewhat less straightforward. To calculate revenue from non-containerships, Global Insight calculated an average split between laden and ballast vessels, then calculated weighted average laden and ballast toll rates.97 From there, the projected number of non-containership transits is multiplied by the projected number of PC/UMS per transit. The product is multiplied by the ratio of laden to ballast vessels and their respective tolls.
97 Whereas containerships have one per-TEU toll rate, non-containerships are charged a different toll rate for each weight class. For example, the first 10,000 tons are charged $2.96 laden and $2.35 ballast, the second 10,000 tons are charged $2.90 laden and $2.30 ballast, and the remaining tons are charged $2.85 laden and $2.26 ballast. http://www.pancanal.com/eng/maritime/tolls.html
72

Panama Canal: A Question of Funding
Copyright © 2005, Global Insight
Appendix 2: Transit Scenarios Market Potential
2000 2001 2002 2003 2004 2005 2006
TOTAL No. of Commercial Transits 12,280 12,185 11,860 11,725 12,518 12,806 13,100Full Containerships 1,704 1,780 2,012 2,369 2,536 2,561 2,587
Cargo, Long Tons (millions) 194 193 188 188 200 211 220PC/UMS Millions (non-containerships) 182 185
PCUMS per Transit (non-containership) 17,076 16,848 17,313 17,507 17,992 17,794 17,599Cargo tons per transit 18,315 18,558 19,070 20,126 15,977 16,479 17,392
Revenue from Container Ships $301 $355Revenue from Other $502 $509Toll Revenue Millions $ $573 $578 $589 $666 $699 $803 $864
2007 2008 2009 2010 2011 2012 2013
TOTAL No. of Commercial Transits 13,402 13,710 14,025 14,348 14,678 15,016 15,361Full Containerships 2,613 2,639 2,665 2,692 2,719 2,746 2,774
Cargo, Long Tons (millions) 229 237 247 256 266 276 288PC/UMS Millions (non-containerships) 188 191 193 196 199 202 205
PCUMS per Transit (non-containership) 17,407 17,218 17,032 16,848 16,668 16,490 16,314Cargo tons per transit 18,355 19,371 20,444 21,577 22,772 24,033 25,364
Revenue from Container Ships $395 $419 $444 $471 $499 $529 $560Revenue from Other $517 $511 $506 $500 $495 $490 $484Toll Revenue Millions $ $912 $930 $950 $971 $994 $1,018 $1,045
2014 2015 2016 2017 2018 2019 2020
TOTAL No. of Commercial Transits 15,714 16,076 16,445 16,824 17,211 17,606 18,011Full Containerships 2,801 2,829 2,858 2,886 2,915 2,944 2,974
Cargo, Long Tons (millions) 301 314 327 340 354 369 385PC/UMS Millions (non-containerships) 208 212 215 218 221 225 228
PCUMS per Transit (non-containership) 16,142 15,971 15,803 15,638 15,475 15,314 15,156Cargo tons per transit 26,769 28,252 29,817 31,468 33,211 35,051 36,992
Revenue from Container Ships $594 $630 $667 $707 $750 $795 $843Revenue from Other $479 $474 $469 $464 $459 $455 $450Toll Revenue Millions $ $1,073 $1,104 $1,137 $1,172 $1,209 $1,250 $1,293
73

Panama Canal: A Question of Funding
Copyright © 2005, Global Insight
Scenario 1: Base2000 2001 2002 2003 2004 2005 2006
Total No. of Commercial Transits 12,280 12,185 11,860 11,725 12,518 12,500 12,000Full Containerships 1,704 1,780 2,012 2,369 2,536 2,587 2,638
Cargo, Long Tons (millions) 194 193 188 188 200 205 209PC/UMS Millions (non-containerships) 181 175 171 164 180 181 182
PCUMS per Transit (non-containership) 17,076 16,848 17,313 17,507 17,992 18,262 18,505Cargo tons per transit 15,774 15,847 15,835 16,060 15,977 16,368 17,442
Revenue from Container Ships $304 $362Revenue from Other $498 $477Toll Revenue Millions $ $573 $578 $589 $666 $756 $802 $839
2007 2008 2009 2010 2011 2012 2013
Total No. of Commercial Transits 11,500 11,500 11,500 11,500 11,500 11,500 11,500Full Containerships 2,691 2,691 2,691 2,691 2,691 2,691 2,691
Cargo, Long Tons (millions) 214 219 224 229 235 240 245PC/UMS Millions (non-containerships) 184 185 187 188 190 191 193
PCUMS per Transit (non-containership) 18,753 18,903 19,054 19,207 19,360 19,515 19,671Cargo tons per transit 18,619 19,047 19,485 19,934 20,392 20,861 21,341
Revenue from Container Ships $407 $415 $423 $432 $440 $449 $458Revenue from Other $455 $458 $462 $466 $469 $473 $477Toll Revenue Millions $ $862 $873 $885 $897 $910 $922 $935
2014 2015 2016 2017 2018 2019 2020
Total No. of Commercial Transits 11,500 11,500 11,500 11,500 11,500 11,500 11,500Full Containerships 2,691 2,691 2,691 2,691 2,691 2,691 2,691
Cargo, Long Tons (millions) 251 257 263 269 275 281 288PC/UMS Millions (non-containerships) 194 196 198 199 201 202 204
PCUMS per Transit (non-containership) 19,829 19,987 20,147 20,309 20,471 20,635 20,800Cargo tons per transit 21,832 22,334 22,848 23,373 23,911 24,461 25,023
Revenue from Container Ships $467 $477 $486 $496 $506 $516 $526Revenue from Other $481 $485 $488 $492 $496 $500 $504Toll Revenue Millions $ $948 $961 $975 $988 $1,002 $1,016 $1,031
74

Panama Canal: A Question of Funding
Copyright © 2005, Global Insight
Scenario 2: 2000 2001 2002 2003 2004 2005 2006
Total No. of Commercial Transits 12,280 12,185 11,860 11,725 12,518 12,500 12,500Full Containerships 1,704 1,780 2,012 2,369 2,536 2,587 2,638
Cargo, Long Tons (millions) 194 193 188 188 200 205 209PC/UMS Millions (non-containerships) 181 175 171 164 180 181 182
PCUMS per Transit (non-containership) 17,076 16,848 17,313 17,507 17,992 18,262 18,505Cargo tons per transit 15,774 15,847 15,835 16,060 15,977 16,368 16,744
Revenue from Container Ships $309 $362Revenue from Other $498 $502Toll Revenue Millions $ $573 $578 $589 $666 $756 $807 $864
2007 2008 2009 2010 2011 2012 2013
Total No. of Commercial Transits 12,500 12,500 12,500 12,500 12,500 12,500 12,500Full Containerships 2,691 2,691 2,691 2,691 2,691 2,691 2,691
Cargo, Long Tons (millions) 214 219 224 229 235 240 245PC/UMS Millions (non-containerships) 184 185 187 188 190 191 193
PCUMS per Transit (non-containership) 18,753 18,903 19,054 19,207 19,360 19,515 19,671Cargo tons per transit 17,130 17,524 17,927 18,339 18,761 19,192 19,634
Revenue from Container Ships $407 $415 $423 $432 $440 $449 $458Revenue from Other $506 $510 $514 $518 $523 $527 $531Toll Revenue Millions $ $913 $925 $938 $950 $963 $976 $989
2014 2015 2016 2017 2018 2019 2020
Total No. of Commercial Transits 12,500 12,500 12,500 12,500 12,500 12,500 12,500Full Containerships 2,691 2,691 2,691 2,691 2,691 2,691 2,691
Cargo, Long Tons (millions) 251 257 263 269 275 281 288PC/UMS Millions (non-containerships) 194 196 198 199 201 202 204
PCUMS per Transit (non-containership) 19,829 19,987 20,147 20,309 20,471 20,635 20,800Cargo tons per transit 20,085 20,547 21,020 21,503 21,998 22,504 23,021
Revenue from Container Ships $467 $477 $486 $496 $506 $516 $526Revenue from Other $535 $540 $544 $548 $553 $557 $561Toll Revenue Millions $ $1,003 $1,016 $1,030 $1,044 $1,059 $1,073 $1,088
75

Panama Canal: A Question of Funding
Copyright © 2005, Global Insight
Scenario 3:2000 2001 2002 2003 2004 2005 2006
Total No. of Commercial Transits 12,280 12,185 11,860 11,725 12518 12806 13100Full Containerships 1,704 1,780 2,012 2,369 2,536 2,587 2,638
Cargo, Long Tons (millions) 194 193 188 188 193 197 202PC/UMS Millions (non-containerships) 181 175 171 164 180 182 185
PCUMS per Transit (non-containership) 14,707 14,387 14,376 17,507 17,992 17,838 17,686Cargo tons per transit 15,774 15,847 15,835 20,126 15,388 15,388 15,388
Revenue from Container Ships $304 $362Revenue from Other $502 $509Toll Revenue Millions $ $573 $578 $589 $666 $684 $806 $871
2007 2008 2009 2010 2011 2012 2013
Total No. of Commercial Transits 13402 13500 13500 13500 13500 13500 13500Full Containerships 2,691 2,745 2,800 2,856 2,856 2,856 2,856
Cargo, Long Tons (millions) 206 211 216 221 226 231 236PC/UMS Millions (non-containerships) 188 191 193 196 199 202 205
PCUMS per Transit (non-containership) 17,534 17,724 18,082 18,450 18,727 19,008 19,293Cargo tons per transit 15,388 15,628 15,987 16,355 16,731 17,116 17,509
Revenue from Container Ships $407 $415 $423 $432 $440 $449 $458Revenue from Other $517 $522 $533 $544 $552 $560 $569Toll Revenue Millions $ $924 $937 $956 $976 $992 $1,010 $1,027
2014 2015 2016 2017 2018 2019 2020
Total No. of Commercial Transits 13500 13500 13500 13500 13500 13500 13500Full Containerships 2,856 2,856 2,856 2,856 2,856 2,856 2,856
Cargo, Long Tons (millions) 242 247 253 259 265 271 277PC/UMS Millions (non-containerships) 208 212 215 218 221 225 228
PCUMS per Transit (non-containership) 19,582 19,876 20,174 20,477 20,784 21,096 21,412Cargo tons per transit 17,912 18,324 18,746 19,177 19,618 20,069 20,531
Revenue from Container Ships $467 $477 $486 $496 $506 $516 $526Revenue from Other $577 $586 $595 $604 $613 $622 $631Toll Revenue Millions $ $1,045 $1,063 $1,081 $1,100 $1,119 $1,138 $1,158
76

Panama Canal: A Question of Funding
Copyright © 2005, Global Insight
Appendix 3: Toll Increase Sensitivity Analysis
Scenario 1 - Base (15 Years, 6bn Cost of Expansion)
Necessary Toll Increase (Break even)Financing Rate Total Amount Due 2009 2010 2011 2012 2013 2014 2015 20164.0% $6,657,191,330 0.0% 0.0% 0.0% 0.0% 0.0% 0.0% 0.0% 0.0%6.0% $7,594,711,452 0.0% 0.0% 0.0% 0.0% 0.0% 0.0% 0.0% 0.0%8.0% $8,600,868,759 0.0% 0.0% 0.0% 0.0% 0.0% 0.0% 2.1% 19.8%10.0% $9,671,446,059 0.0% 0.0% 0.0% 0.0% 0.0% 7.0% 26.7% 21.5%12.0% $10,801,512,559 0.0% 0.0% 0.0% 0.0% 3.2% 30.4% 27.9% 26.1%
Financing Rate 2017 2018 2019 2020 2021 2022 2023 20244.0% 0.0% 0.0% 0.0% 0.0% 0.0% 0.0% 0.0% 0.0%6.0% 0.0% 9.0% 10.2% 9.3% 8.8% 8.2% 7.6% 0.1%8.0% 16.1% 15.6% 15.0% 14.4% 13.8% 13.3% 12.7% 4.7%10.0% 21.0% 20.4% 19.8% 19.3% 18.7% 18.1% 17.5% 9.0%12.0% 25.5% 24.9% 24.4% 23.8% 23.2% 22.6% 22.1% 13.1%
Financing Rate 2025 2026 2027 2028 20294.0% 0.0% 0.0% 0.0% 0.0% 0.0%6.0% 0.0% 0.0% 0.0% 0.0% 0.0%8.0% 0.0% 0.0% 0.0% 0.0% 0.0%10.0% 0.7% 0.0% 0.0% 0.0% 0.0%12.0% 4.7% 0.0% 0.0% 0.0% 0.0%
Scenario 2 (30 Years, 4.5bn)Financing Rate 2009 2010 2011 2012 2013 2014 2015 20164.0% $6,015,432,723 0.0% 0.0% 0.0% 0.0% 0.0% 0.0% 0.0% 0.0%6.0% $7,554,336,617 0.0% 0.0% 0.0% 0.0% 0.0% 0.0% 0.0% 0.0%8.0% $9,245,433,631 0.0% 0.0% 0.0% 0.0% 0.0% 0.0% 0.0% 0.0%10.0% $11,057,401,783 0.0% 0.0% 0.0% 0.0% 0.0% 0.0% 0.0% 0.0%12.0% $12,960,518,721 0.0% 0.0% 0.0% 0.0% 0.0% 0.0% 0.0% 0.0%
Toll increases are 0.0% through the entire repayment period
77

Panama Canal: A Question of Funding
Copyright © 2005, Global Insight
Scenario 3 (15 Years, 4.5bn)Financing Rate 2009 2010 2011 2012 2013 2014 2015 20164.0% $4,660,033,931 0.0% 0.0% 0.0% 0.0% 0.0% 0.0% 0.0% 0.0%6.0% $5,316,298,017 0.0% 0.0% 0.0% 0.0% 0.0% 0.0% 0.0% 0.0%8.0% $6,020,608,131 0.0% 0.0% 0.0% 0.0% 0.0% 0.0% 0.0% 0.0%10.0% $6,770,012,242 0.0% 0.0% 0.0% 0.0% 0.0% 0.0% 0.0% 0.0%12.0% $7,561,058,791 0.0% 0.0% 0.0% 0.0% 0.0% 0.0% 0.0% 0.0%
2017 2018 2019 2020 2021 2022 2023 20244.0% 0.0% 0.0% 0.0% 0.0% 0.0% 0.0% 0.0% 0.0%6.0% 0.0% 0.0% 0.0% 0.0% 0.0% 0.0% 0.0% 0.0%8.0% 0.0% 0.0% 0.0% 0.0% 0.0% 0.0% 0.0% 0.0%10.0% 0.0% 0.0% 0.0% 0.0% 0.0% 0.0% 0.6% 0.4%12.0% 7.6% 10.7% 9.7% 9.2% 8.6% 8.0% 7.4% 4.7%
2025 2026 2027 2028 20294.0% 0.0% 0.0% 0.0% 0.0% 0.0%6.0% 0.0% 0.0% 0.0% 0.0% 0.0%8.0% 0.0% 0.0% 0.0% 0.0% 0.0%10.0% 0.0% 0.0% 0.0% 0.0% 0.0%12.0% 0.0% 0.0% 0.0% 0.0% 0.0%
Scenario 4 (10 Years, 4.5)Financing Rate 2009 2010 2011 2012 2013 2014 2015 20164.0% $4,172,909,759 0.0% 0.0% 0.0% 0.0% 0.0% 0.0% 0.0% 0.0%6.0% $4,578,942,999 0.0% 0.0% 0.0% 0.0% 0.0% 0.0% 0.0% 0.0%8.0% $5,007,422,266 0.0% 0.0% 0.0% 0.0% 0.0% 0.0% 3.6% 13.1%10.0% $5,457,719,051 0.0% 0.0% 0.0% 0.0% 0.0% 8.6% 17.6% 15.4%12.0% $5,929,062,316 0.0% 0.0% 0.0% 0.0% 4.0% 24.0% 19.3% 18.8%
2017 2018 2019 2020 2021 20224.0% 0.0% 0.0% 0.0% 0.0% 0.0% 0.0%6.0% 0.0% 6.3% 4.5% 0.0% 0.0% 0.0%8.0% 11.3% 10.7% 7.9% 0.0% 0.0% 0.0%10.0% 14.8% 14.2% 11.3% 0.0% 0.0% 0.0%12.0% 18.2% 17.6% 14.6% 0.0% 0.0% 0.0%
78

Panama Canal: A Question of Funding
Copyright © 2005, Global Insight
Scenario 5 (30 Years, 6)Financing Rate Total Amount Due 2009 2010 2011 2012 2013 2014 2015 20164.0% $8,183,616,304 0.0% 0.0% 0.0% 0.0% 0.0% 0.0% 0.0% 0.0%6.0% $10,333,421,652 0.0% 0.0% 0.0% 0.0% 0.0% 0.0% 0.0% 0.0%8.0% $12,709,345,288 0.0% 0.0% 0.0% 0.0% 0.0% 0.0% 0.0% 0.0%10.0% $15,266,879,469 0.0% 0.0% 0.0% 0.0% 0.0% 0.0% 0.0% 0.0%12.0% $17,962,710,702 0.0% 0.0% 0.0% 0.0% 0.0% 0.0% 22.5% 20.2%
2017 2018 2019 2020 2021 2022 2023 20244.0% 0.0% 0.0% 0.0% 0.0% 0.0% 0.0% 0.0% 0.0%6.0% 0.0% 0.0% 0.0% 0.0% 0.0% 0.0% 0.0% 0.0%8.0% 0.0% 0.0% 0.0% 0.0% 0.0% 0.0% 0.0% 0.0%10.0% 10.5% 12.5% 11.5% 10.9% 10.4% 9.8% 9.2% 8.6%12.0% 19.2% 18.6% 18.0% 17.5% 16.9% 16.3% 15.7% 15.1%
2025 2026 2027 2028 2029 2030 2031 20324.0% 0.0% 0.0% 0.0% 0.0% 0.0% 0.0% 0.0% 0.0%6.0% 0.0% 0.0% 0.0% 0.0% 0.0% 0.0% 0.0% 0.0%8.0% 0.0% 0.0% 0.0% 0.0% 0.0% 0.0% 0.0% 0.0%10.0% 8.1% 7.5% 6.9% 6.3% 5.8% 5.2% 4.6% 4.0%12.0% 14.6% 14.0% 13.4% 12.8% 12.2% 11.6% 11.0% 10.4%
2033 2034 2035 2036 2037 2038 2039 20404.0% 0.0% 0.0% 0.0% 0.0% 0.0% 0.0% 0.0% 0.0%6.0% 0.0% 0.0% 0.0% 0.0% 0.0% 0.0% 0.0% 0.0%8.0% 0.0% 0.0% 0.0% 0.0% 0.0% 0.0% 0.0% 0.0%10.0% 3.4% 2.9% 2.3% 1.7% 1.1% 0.6% 0.0% 0.0%12.0% 9.9% 9.3% 8.7% 8.1% 7.5% 6.9% 0.0% 0.0% Toll Increases are 0.0% through the remaining repayment period
79

Panama Canal: A Question of Funding
Copyright © 2005, Global Insight
Scenario 6 (30 Years, 8)Financing Rate Total Amount Due 2009 2010 2011 2012 2013 2014 2015 20164.0% $11,457,062,826 0.0% 0.0% 0.0% 0.0% 0.0% 0.0% 0.0% 0.0%6.0% $14,466,790,312 0.0% 0.0% 0.0% 0.0% 0.0% 0.0% 0.0% 0.0%8.0% $17,793,083,403 0.0% 0.0% 0.0% 0.0% 0.0% 0.0% 1.4% 24.3%10.0% $21,373,631,257 0.0% 0.0% 0.0% 0.0% 0.0% 15.5% 33.2% 27.0%12.0% $25,147,794,982 0.0% 0.0% 0.0% 0.0% 22.4% 37.2% 36.9% 34.1%
2017 2018 2019 2020 2021 2022 2023 20244.0% 0.0% 0.0% 0.0% 0.0% 0.0% 0.0% 0.0% 0.0%6.0% 0.0% 0.0% 1.5% 9.9% 8.5% 8.0% 7.4% 6.8%8.0% 19.1% 18.5% 18.0% 17.4% 16.8% 16.2% 15.7% 15.1%10.0% 26.5% 25.9% 25.3% 24.7% 24.2% 23.6% 23.0% 22.4%12.0% 33.6% 33.1% 32.5% 32.0% 31.4% 30.9% 30.3% 29.8%
2025 2026 2027 2028 2029 2030 2031 20324.0% 0.0% 0.0% 0.0% 0.0% 0.0% 0.0% 0.0% 0.0%6.0% 6.3% 5.7% 5.1% 4.5% 4.0% 3.4% 2.8% 2.2%8.0% 14.5% 13.9% 13.3% 12.7% 12.2% 11.6% 11.0% 10.4%10.0% 21.9% 21.3% 20.7% 20.1% 19.5% 18.9% 18.3% 17.7%12.0% 29.2% 28.6% 28.1% 27.5% 26.9% 26.4% 25.8% 25.2%
2033 2034 2035 2036 2037 2038 2039 20404.0% 0.0% 0.0% 0.0% 0.0% 0.0% 0.0% 0.0% 0.0%6.0% 1.7% 1.1% 0.5% 0.0% 0.0% 0.0% 0.0% 0.0%8.0% 9.8% 9.2% 8.6% 8.0% 7.4% 6.8% 1.3% 0.0%10.0% 17.1% 16.6% 16.0% 15.4% 14.8% 14.2% 8.1% 1.6%12.0% 24.7% 24.1% 23.5% 22.9% 22.3% 21.8% 15.4% 8.8% 0.0% Through the remaining repayment period
80

Panama Canal: A Question of Funding
Copyright © 2005, Global Insight
Appendix 4: Loan Repayments
Scenario 1 - BaseDisbursement Amount: $5,000,000,000Interest Rate: 8%Years: 15
Total Amount Due (over life of loan): $8,600,868,759
2007 2008 2009 2010 2011
Disbursement Schedule $0 $0 $800,000,000 $800,000,000 $1,000,000,000Interest Payment $0 $0 $65,075,933 $130,151,867 $211,496,784Principal Payment $26,666,667 $53,333,333 $86,666,667Repayment Amount $91,742,600 $183,485,200 $298,163,450
2013 2014 2015 2016 2017Disbursement Schedule $700,000,000 $500,000,000 $400,000,000 $0 $0Interest Payment $333,514,159 $374,186,617 $406,724,584 $406,724,584 $406,724,584Principal Payment $136,666,667 $153,333,333 $166,666,667 $166,666,667 $166,666,667Repayment Amount $470,180,825 $527,519,951 $573,391,251 $573,391,251 $573,391,251
2019 2020 2021 2022 2023Disbursement Schedule $0 $0 $0 $0 $0Interest Payment $406,724,584 $406,724,584 $406,724,584 $406,724,584 $406,724,584Principal Payment $166,666,667 $166,666,667 $166,666,667 $166,666,667 $166,666,667Repayment Amount $573,391,251 $573,391,251 $573,391,251 $573,391,251 $573,391,251
2025 2026 2027 2028 2029Disbursement Schedule $0 $0 $0 $0 $0Interest Payment $276,572,717 $195,227,800 $130,151,867 $73,210,425 $32,537,967Principal Payment $113,333,333 $80,000,000 $53,333,333 $30,000,000 $13,333,333Repayment Amount $389,906,050 $275,227,800 $183,485,200 $103,210,425 $45,871,300
81

Panama Canal: A Question of Funding
Copyright © 2005, Global Insight
Scenario 2Disbursement Amount: $3,500,000,000Interest Rate: 8%Years: 30
Total Amount Due (over life of loan): $9,245,433,631
2007 2008 2009 2010 2011 2012
Disbursement Schedule $0 $0 $700,000,000 $700,000,000 $1,050,000,000 $525,000,000Interest Payment $0 $0 $38,302,891 $76,605,782 $134,060,118 $162,787,286Principal Payment $23,333,333 $46,666,667 $81,666,667 $99,166,667Repayment Amount $61,636,224 $123,272,448 $215,726,785 $261,953,953
2013 2014 2015 2016 2017 2018Disbursement Schedule $350,000,000 $175,000,000 $0 $0 $0 $0Interest Payment $181,938,732 $191,514,454 $191,514,454 $191,514,454 $191,514,454 $191,514,454Principal Payment $110,833,333 $116,666,667 $116,666,667 $116,666,667 $116,666,667 $116,666,667Repayment Amount $292,772,065 $308,181,121 $308,181,121 $308,181,121 $308,181,121 $308,181,121
2019 2020 2021 2022 2023 2024Disbursement Schedule $0 $0 $0 $0 $0 $0Interest Payment $191,514,454 $191,514,454 $191,514,454 $191,514,454 $191,514,454 $191,514,454Principal Payment $116,666,667 $116,666,667 $116,666,667 $116,666,667 $116,666,667 $116,666,667Repayment Amount $308,181,121 $308,181,121 $308,181,121 $308,181,121 $308,181,121 $308,181,121
2025 2026 2027 2028 2029 2030Disbursement Schedule $0 $0 $0 $0 $0 $0Interest Payment $191,514,454 $191,514,454 $191,514,454 $191,514,454 $191,514,454 $191,514,454Principal Payment $116,666,667 $116,666,667 $116,666,667 $116,666,667 $116,666,667 $116,666,667Repayment Amount $308,181,121 $308,181,121 $308,181,121 $308,181,121 $308,181,121 $308,181,121
2031 2032 2033 2034 2035 2036Disbursement Schedule $0 $0 $0 $0 $0 $0Interest Payment $191,514,454 $191,514,454 $191,514,454 $191,514,454 $191,514,454 $191,514,454Principal Payment $116,666,667 $116,666,667 $116,666,667 $116,666,667 $116,666,667 $116,666,667Repayment Amount $308,181,121 $308,181,121 $308,181,121 $308,181,121 $308,181,121 $308,181,121
2037 2038 2039 2040 2041 2042Disbursement Schedule $0 $0 $0 $0 $0 $0Interest Payment $191,514,454 $191,514,454 $153,211,563 $114,908,673 $57,454,336 $28,727,168Principal Payment $116,666,667 $116,666,667 $93,333,333 $70,000,000 $35,000,000 $17,500,000Repayment Amount $308,181,121 $308,181,121 $246,544,897 $184,908,673 $92,454,336 $46,227,168
2043Disbursement Schedule $0Interest Payment $9,575,723Principal Payment $5,833,333Repayment Amount $15,409,056
82

Panama Canal: A Question of Funding
Copyright © 2005, Global Insight
Scenario 3Disbursement Amount: $3,500,000,000Interest Rate: 8%Years: 15
Total Amount Due (over life of loan): $6,020,608,131
2007 2008 2009 2010 2011 2012
Disbursement Schedule $0 $0 $175,000,000 $700,000,000 $1,400,000,000 $700,000,000Interest Payment $0 $0 $8,402,027 $42,010,136 $109,226,352 $142,834,461Principal Payment $11,666,667 $58,333,333 $151,666,667 $198,333,333Repayment Amount $20,068,694 $100,343,469 $260,893,019 $341,167,794
2013 2014 2015 2016 2017 2018Disbursement Schedule $175,000,000 $175,000,000 $175,000,000 $0 $0 $0Interest Payment $151,236,488 $159,638,515 $168,040,542 $168,040,542 $168,040,542 $168,040,542Principal Payment $210,000,000 $221,666,667 $233,333,333 $233,333,333 $233,333,333 $233,333,333Repayment Amount $361,236,488 $381,305,182 $401,373,875 $401,373,875 $401,373,875 $401,373,875
2019 2020 2021 2022 2023 2024Disbursement Schedule $0 $0 $0 $0 $0 $0Interest Payment $168,040,542 $168,040,542 $168,040,542 $168,040,542 $168,040,542 $159,638,515Principal Payment $233,333,333 $233,333,333 $233,333,333 $233,333,333 $233,333,333 $221,666,667Repayment Amount $401,373,875 $401,373,875 $401,373,875 $401,373,875 $401,373,875 $381,305,182
2025 2026 2027 2028 2029Disbursement Schedule $0 $0 $0 $0 $0Interest Payment $126,030,407 $58,814,190 $25,206,081 $16,804,054 $8,402,027Principal Payment $175,000,000 $81,666,667 $35,000,000 $23,333,333 $11,666,667Repayment Amount $301,030,407 $140,480,856 $60,206,081 $40,137,388 $20,068,694 Scenario 4Disbursement Amount: $3,500,000,000Interest Rate: 8%Years: 10
Total Amount Due (over life of loan): $5,095,758,963
2007 2008 2009 2010 2011 2012
Disbursement Schedule $0 $0 $175,000,000 $875,000,000 $1,400,000,000 $875,000,000Interest Payment $0 $0 $13,812,128 $94,539,436 $205,036,461 $285,763,768Principal Payment $11,666,667 $58,333,333 $151,666,667 $198,333,333Repayment Amount $25,478,795 $152,872,769 $356,703,127 $484,097,101
2013 2014 2015 2016 2017 2018Disbursement Schedule $175,000,000 $0 $0 $0 $0 $0Interest Payment $299,575,896 $299,575,896 $299,575,896 $299,575,896 $299,575,896 $299,575,896Principal Payment $210,000,000 $210,000,000 $210,000,000 $210,000,000 $210,000,000 $210,000,000Repayment Amount $509,575,896 $509,575,896 $509,575,896 $509,575,896 $509,575,896 $509,575,896
2019 2020 2021 2022Disbursement Schedule $0 $0 $0 $0Interest Payment $285,763,768 $205,036,461 $94,539,436 $13,812,128Principal Payment $198,333,333 $151,666,667 $58,333,333 $11,666,667Repayment Amount $484,097,101 $356,703,127 $152,872,769 $25,478,795
83

Panama Canal: A Question of Funding
Copyright © 2005, Global Insight
Scenario 5Disbursement Amount: $5,000,000,000Interest Rate: 8%Years: 30
Total Amount Due (over life of loan): $13,207,762,330
2007 2008 2009 2010 2011 2012
Disbursement Schedule $0 $0 $800,000,000 $800,000,000 $1,000,000,000 $800,000,000Interest Payment $0 $0 $43,774,732 $87,549,465 $142,267,880 $186,042,613Principal Payment $26,666,667 $53,333,333 $86,666,667 $113,333,333Repayment Amount $70,441,399 $140,882,798 $228,934,547 $299,375,946
2013 2014 2015 2016 2017 2018Disbursement Schedule $700,000,000 $500,000,000 $400,000,000 $0 $0 $0Interest Payment $224,345,504 $251,704,711 $273,592,078 $273,592,078 $273,592,078 $273,592,078Principal Payment $136,666,667 $153,333,333 $166,666,667 $166,666,667 $166,666,667 $166,666,667
Repayment Amount $361,012,170 $405,038,045 $440,258,744 $440,258,744 $440,258,744 $440,258,744
2019 2020 2021 2022 2023 2024Disbursement Schedule $0 $0 $0 $0 $0 $0Interest Payment $273,592,078 $273,592,078 $273,592,078 $273,592,078 $273,592,078 $273,592,078Principal Payment $166,666,667 $166,666,667 $166,666,667 $166,666,667 $166,666,667 $166,666,667
Repayment Amount $440,258,744 $440,258,744 $440,258,744 $440,258,744 $440,258,744 $440,258,744
2025 2026 2027 2028 2029 2030Disbursement Schedule $0 $0 $0 $0 $0 $0Interest Payment $273,592,078 $273,592,078 $273,592,078 $273,592,078 $273,592,078 $273,592,078Principal Payment $166,666,667 $166,666,667 $166,666,667 $166,666,667 $166,666,667 $166,666,667
Repayment Amount $440,258,744 $440,258,744 $440,258,744 $440,258,744 $440,258,744 $440,258,744
2031 2032 2033 2034 2035 2036Disbursement Schedule $0 $0 $0 $0 $0 $0Interest Payment $273,592,078 $273,592,078 $273,592,078 $273,592,078 $273,592,078 $273,592,078Principal Payment $166,666,667 $166,666,667 $166,666,667 $166,666,667 $166,666,667 $166,666,667
Repayment Amount $440,258,744 $440,258,744 $440,258,744 $440,258,744 $440,258,744 $440,258,744
2037 2038 2039 2040 2041 2042Disbursement Schedule $0 $0 $0 $0 $0 $0Interest Payment $273,592,078 $273,592,078 $229,817,345 $186,042,613 $131,324,197 $87,549,465Principal Payment $166,666,667 $166,666,667 $140,000,000 $113,333,333 $80,000,000 $53,333,333
Repayment Amount $440,258,744 $440,258,744 $369,817,345 $299,375,946 $211,324,197 $140,882,798
2043 2044Disbursement Schedule $0 $0Interest Payment $49,246,574 $21,887,366Principal Payment $30,000,000 $13,333,333
Repayment Amount $79,246,574 $35,220,700
84

Panama Canal: A Question of Funding
Copyright © 2005, Global Insight
Scenario 6Disbursement Amount: $7,000,000,000Interest Rate: 8%Years: 30
Total Amount Due (over life of loan): $18,490,867,262
2007 2008 2009 2010 2011 2012
Disbursement Schedule $0 $0 $800,000,000 $900,000,000 $1,400,000,000 $1,300,000,000Interest Payment $0 $0 $43,774,732 $96,354,640 $186,293,755 $274,094,362Principal Payment $26,666,667 $53,333,333 $86,666,667 $113,333,333Repayment Amount $70,441,399 $149,687,973 $272,960,421 $387,427,695
2013 2014 2015 2016 2017 2018Disbursement Schedule $1,000,000,000 $900,000,000 $700,000,000 $0 $0 $0Interest Payment $338,812,777 $401,392,685 $449,695,575 $449,695,575 $449,695,575 $449,695,575Principal Payment $136,666,667 $153,333,333 $166,666,667 $166,666,667 $166,666,667 $166,666,667Repayment Amount $475,479,444 $554,726,018 $616,362,242 $616,362,242 $616,362,242 $616,362,242
2019 2020 2021 2022 2023 2024Disbursement Schedule $0 $0 $0 $0 $0 $0Interest Payment $449,695,575 $449,695,575 $449,695,575 $449,695,575 $449,695,575 $449,695,575Principal Payment $166,666,667 $166,666,667 $166,666,667 $166,666,667 $166,666,667 $166,666,667Repayment Amount $616,362,242 $616,362,242 $616,362,242 $616,362,242 $616,362,242 $616,362,242
2025 2026 2027 2028 2029 2030Disbursement Schedule $0 $0 $0 $0 $0 $0Interest Payment $449,695,575 $449,695,575 $449,695,575 $449,695,575 $449,695,575 $449,695,575Principal Payment $166,666,667 $166,666,667 $166,666,667 $166,666,667 $166,666,667 $166,666,667Repayment Amount $616,362,242 $616,362,242 $616,362,242 $616,362,242 $616,362,242 $616,362,242
2031 2032 2033 2034 2035 2036Disbursement Schedule $0 $0 $0 $0 $0 $0Interest Payment $449,695,575 $449,695,575 $449,695,575 $449,695,575 $449,695,575 $449,695,575Principal Payment $166,666,667 $166,666,667 $166,666,667 $166,666,667 $166,666,667 $166,666,667Repayment Amount $616,362,242 $616,362,242 $616,362,242 $616,362,242 $616,362,242 $616,362,242
2037 2038 2039 2040 2041 2042Disbursement Schedule $0 $0 $0 $0 $0 $0Interest Payment $449,695,575 $449,695,575 $405,920,843 $353,340,936 $263,401,821 $175,601,214Principal Payment $166,666,667 $166,666,667 $140,000,000 $113,333,333 $80,000,000 $53,333,333Repayment Amount $616,362,242 $616,362,242 $545,920,843 $466,674,269 $343,401,821 $228,934,547
2043 2044Disbursement Schedule $0 $0Interest Payment $110,882,798 $48,302,891Principal Payment $30,000,000 $13,333,333Repayment Amount $140,882,798 $61,636,224
85

Panama Canal: A Question of Funding
Copyright © 2005, Global Insight
86