pakistan urban forum karachi january 10 12, 2014 pakistan...
TRANSCRIPT
Pakistan Urban Forum ‐ Karachi January 10‐12, 2014
______________________________________________________________________________
PAKISTAN WATER SUPPLY AND SANITATIONSECTOR STUDYSECTOR STUDY
PAKISTAN URBAN FORUM
STUDY OVERVIEW
Masroor AhmadSr. Water and Sanitation Specialist, WSP, WB, Islamabad

Pakistan Urban Forum ‐ Karachi January 10‐12, 2014
______________________________________________________________________________
Study Objectives & Scopey j p•To assess the provision of services disaggregated by province & region•To provide a framework for governments to take informed decisions onTo provide a framework for governments to take informed decisions on improving service delivery•To identify the priority areas for reform and investment•Takes stock of the sector across a range of technical, financial, environmental, g , , ,and institutional dimensions•Identifies the key issues of the sector and draws on international experiences •It is the first comprehensive study that captures both water and sanitation in both urban and rural areas across the entire country

Pakistan Urban Forum ‐ Karachi January 10‐12, 2014
______________________________________________________________________________
Process & PartnersProcess & Partners•National Launch of Concept – April 2012•Planning Commission – Coordination•Planning Commission – Coordination •Consultative sessions with PHEDs, LGDs, PnDs, DoF, WASAs, KWSB, (selected)TMAs and CSOs in four provinces and three regionsR lit h k h i l fi di ith i & i•Reality check ‐ sharing early findings with provinces & regions
•Soft launch of National Sector Study – April 2013•Brainstorming on What Next….
Pakistan Urban Forum ‐ Karachi January 10‐12, 2014
______________________________________________________________________________
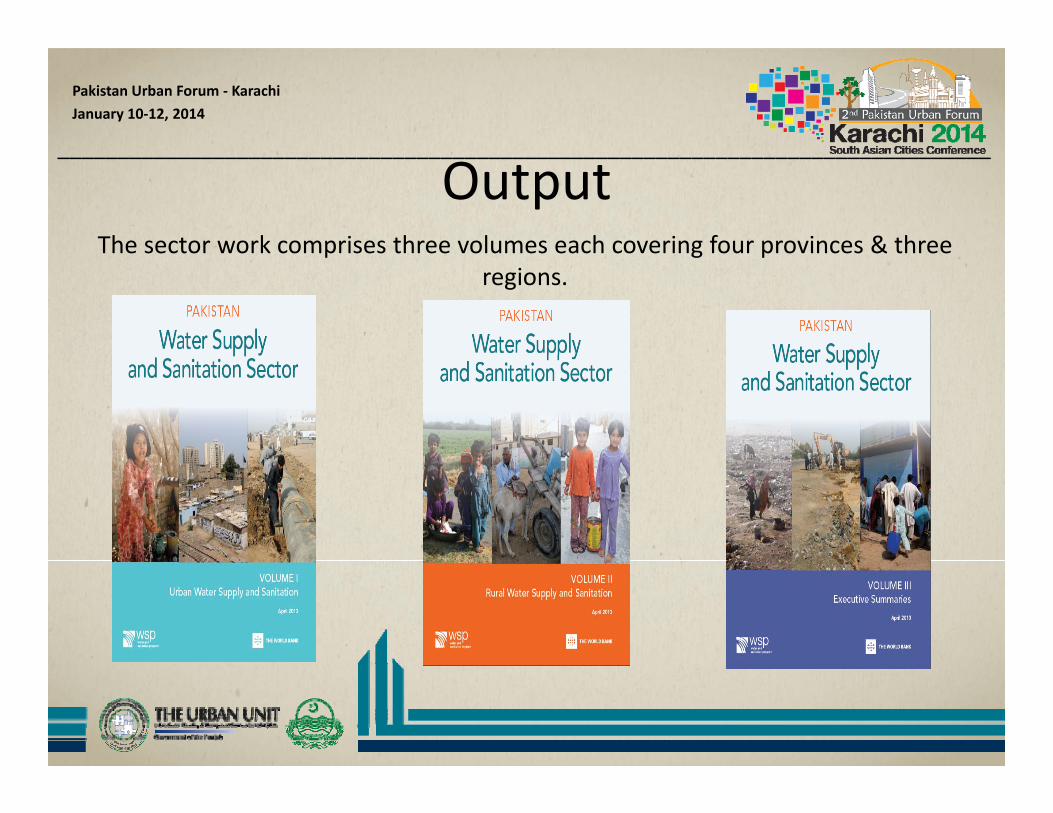
OutputThe sector work comprises three volumes each covering four provinces & threeThe sector work comprises three volumes each covering four provinces & three
regions.

Pakistan Urban Forum ‐ Karachi January 10‐12, 2014
______________________________________________________________________________
Water Sanitation
Access to Water and Sanitation in the South Asia Region
Urban Rural National Urban Rural National
Improved Improved Improved Improved Improved Improved Unimproved
Country YearTotal Improved
(%)Piped on
Premises (%)Total Improved
(%)Total Improved
(%)Improved (%) Improved (%) Improved (%)
Open Defecation (%)
Bangladesh1990 87 26 75 77 58 34 39 33
2010 85 20 80 81 57 55 56 4
India1990 88 49 63 69 51 7 18 75
2010 97 48 90 92 58 23 34 51
Nepal1990 96 43 74 76 37 7 10 80
2010 93 53 88 89 48 27 31 49
Pakistan1990 95 56 81 85 72 7 27 52
2010 96 58 89 92 72 34 48 23
Sri Lanka1990 91 37 62 67 85 67 70 14
Sri Lanka2010 99 67 90 91 88 93 92 0
Pakistan Summary:• Above average for water supply• Middling for sanitation

Pakistan Urban Forum ‐ Karachi January 10‐12, 2014
______________________________________________________________________________
South Asia International ComparisonsWater SanitationWater Sanitation
Urban Rural National Urban Rural National
Improved Improved Improved Improved Improved Improved Unimproved
Total Piped on Total Piped on Total Total Total Total OpenCountry Year
Total Improved
(%)
Piped on Premises
(%)
Total Improved
(%)
Piped on Premises
(%)
Total Improved
(%)
Total Improved
(%)
Total Improved
(%)
Total Improved
(%)
Open Defecation
(%)
Total for SAR1990 90 53 66 8 72 57 12 24 67
2010 96 51 88 13 90 64 30 41 41
Total for LAC1990 95 87 64 37 85 80 38 68 18
2010 98 92 81 61 94 84 60 80 4
Total for World1990 95 81 62 18 76 76 29 49 25
2010 96 80 81 29 89 79 47 63 15
Summary for South Asia:• Comparable or better in access to improved water supplies• Below international comparators for quality of service –
piped water supplyp p pp y• Below international comparators for sanitation
Pakistan Urban Forum ‐ Karachi January 10‐12, 2014
______________________________________________________________________________

Pakistan Urban Forum ‐ Karachi January 10‐12, 2014
______________________________________________________________________________
Countries with the Largest Numbers of People Practicing Open Defecation
• The quality of service in the rural sanitation sub sector is best considered in terms of the level of open defecation. Overall the rate of Open Defecation (OD) is 40 million people, 34% of the rural population which places Pakistan as the third largest OD country after India (626 million, 78% of rural population) and Indonesia (63 million and 55% of rural population)
1509.7 8.6 7.77.2 Rest to the World
150
40
38
34 1915 14 12
9.5India
Indonesia
Pakistan
Ethiopia
Nigeria
63
Nigeria
Sudan
Nepal
China
Niger
Burkina Faso
626
Burkina Faso
Mozambique
Cambodia
Madagascar
Brazil

Pakistan Urban Forum ‐ Karachi January 10‐12, 2014
______________________________________________________________________________
Investment Requirements •Rs 163 Bn is estimated investment required for the three years 2013‐15 to achieving the Pakistan’s MDG for 2015 of 100% access to water supply and 67% access to improved sanitation
•Estimated rural water investment was at Rs 54.09 billion and rural sanitation at Rs 92.21 billion giving a total rural requirement of Rs 146.3 billion.
•This is equivalent to about 0.31% of annual GDP over the three year period with rural accounting for about 90% of the totalg

Pakistan Urban Forum ‐ Karachi January 10‐12, 2014
______________________________________________________________________________
8%
Drinking Water and Sanitation Allocations as Proportion to Provincial ADP 2011-12
6%
7%
3%
4%
5%
1%
2%
3%
0%
AJK Balochistan FATA GB KPK Punjab Sindh
Pakistan Urban Forum ‐ Karachi January 10‐12, 2014
______________________________________________________________________________
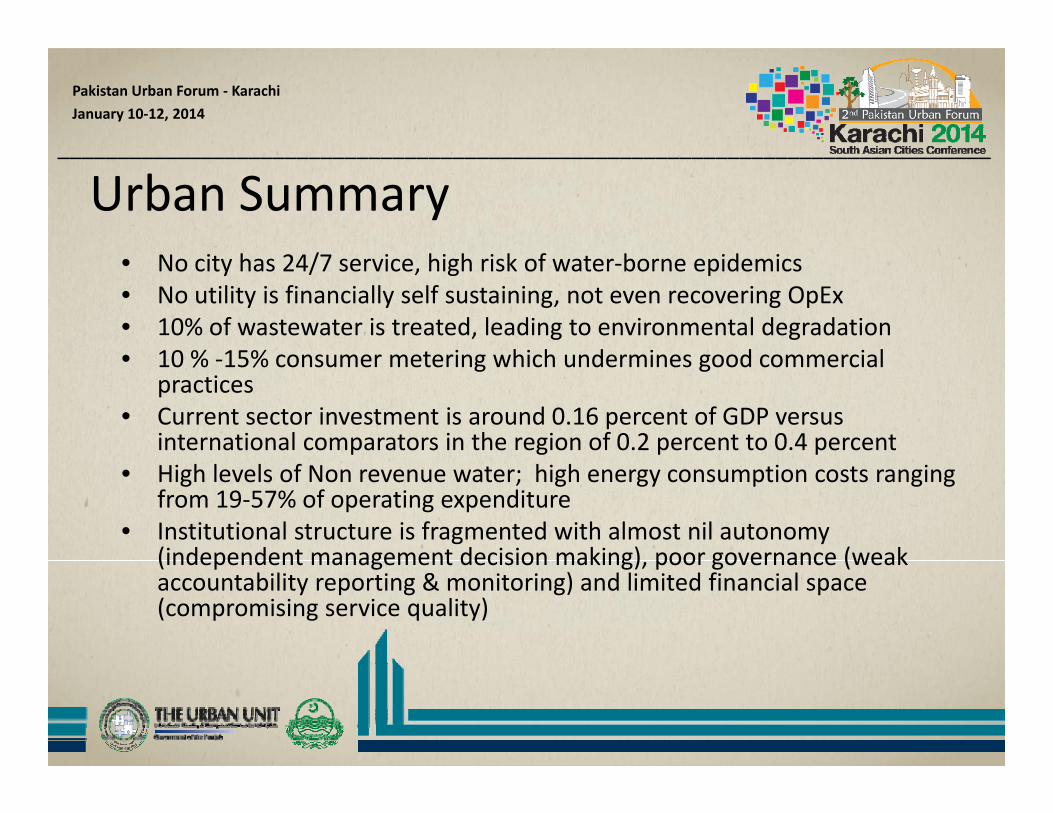
Urban Summary/• No city has 24/7 service, high risk of water‐borne epidemics
• No utility is financially self sustaining, not even recovering OpEx• 10% of wastewater is treated, leading to environmental degradation • 10 % 15% consumer metering which undermines good commercial• 10 % ‐15% consumer metering which undermines good commercial
practices • Current sector investment is around 0.16 percent of GDP versus
international comparators in the region of 0.2 percent to 0.4 percent • High levels of Non revenue water; high energy consumption costs ranging
from 19‐57% of operating expenditure• Institutional structure is fragmented with almost nil autonomy
(independent management decision making) poor governance (weak(independent management decision making), poor governance (weak accountability reporting & monitoring) and limited financial space (compromising service quality)
Pakistan Urban Forum ‐ Karachi January 10‐12, 2014
______________________________________________________________________________
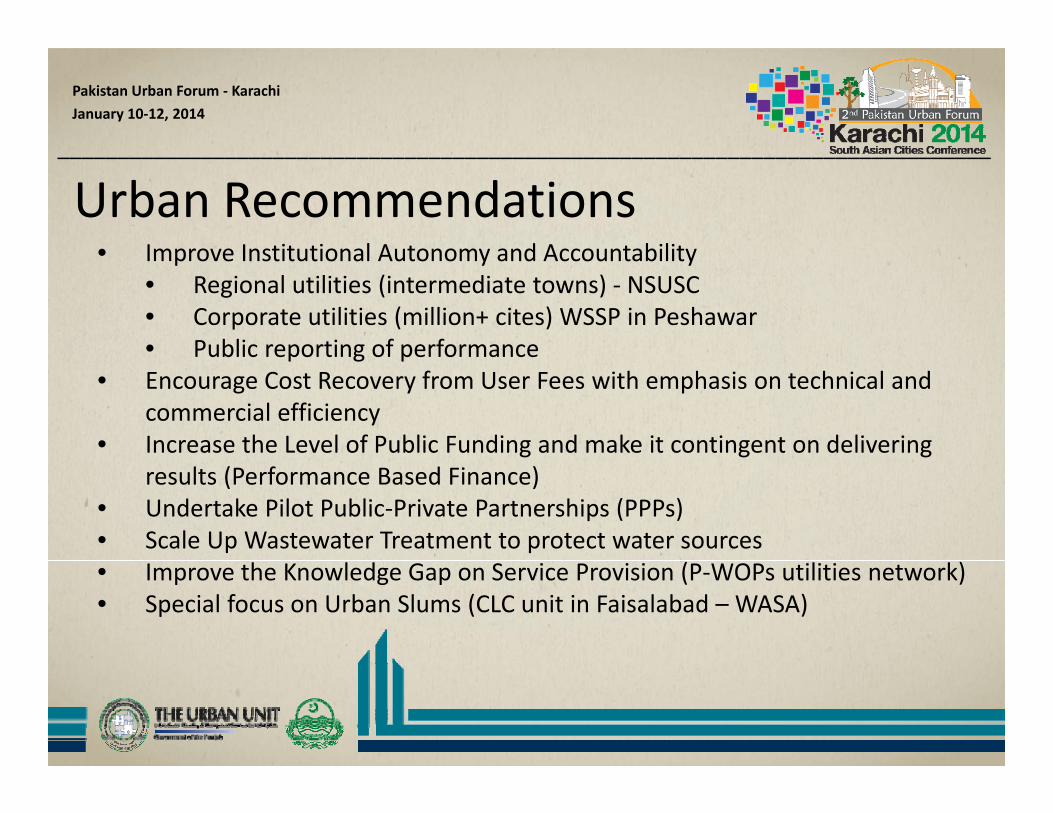
Urban Recommendations• Improve Institutional Autonomy and Accountability• Improve Institutional Autonomy and Accountability
• Regional utilities (intermediate towns) ‐ NSUSC• Corporate utilities (million+ cites) WSSP in Peshawar• Public reporting of performancePublic reporting of performance
• Encourage Cost Recovery from User Fees with emphasis on technical and commercial efficiency
• Increase the Level of Public Funding and make it contingent on delivering results (Performance Based Finance)
• Undertake Pilot Public‐Private Partnerships (PPPs)• Scale Up Wastewater Treatment to protect water sources• Improve the Knowledge Gap on Service Provision (P‐WOPs utilities network)• Special focus on Urban Slums (CLC unit in Faisalabad – WASA)

Pakistan Urban Forum ‐ Karachi January 10‐12, 2014
______________________________________________________________________________
Rural WaterThe two main models for rural water service delivery that currently exist are the following:
1. Provincial or regional level institutions such as PHEDs in Khyber g yPakhtunkhwa, Balochistan, and Sindh develop the schemes and subsequently operate them.
2. In Punjab, AJK, and FATA, provincial‐ or regional‐level institutions such as PHEDs develop the schemes, and they are subsequently operated and maintained by community based organizationscommunity‐based organizations
Punjab, AJK and GB have shown very good financial sustainability with high levels of cost recovery (and in a number of cases revenues exceed operating costs). PCRWR however found that up to 50% of schemes are not operationalPCRWR, however, found that up to 50% of schemes are not operationalDomestic Private Entrepreneurs models ?
Pakistan Urban Forum ‐ Karachi January 10‐12, 2014
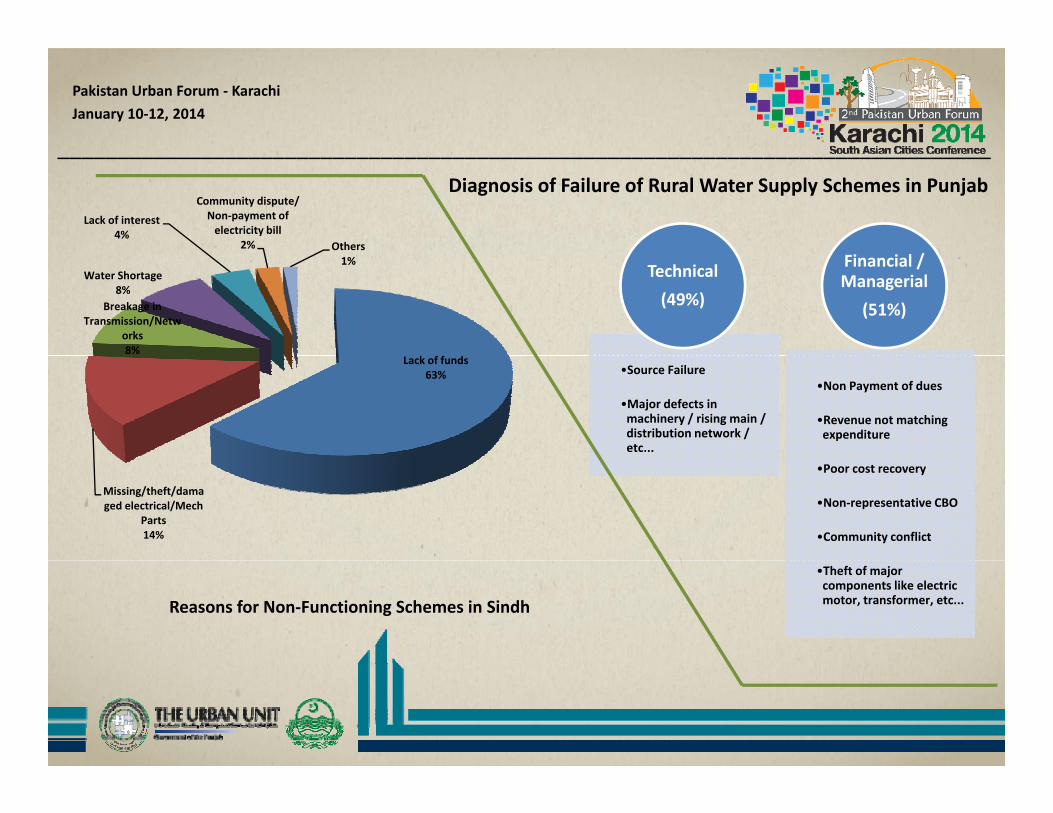
______________________________________________________________________________Diagnosis of Failure of Rural Water Supply Schemes in Punjab
Lack of interest4%
Community dispute/ Non‐payment of electricity bill
2% Others
Technical(49%)
Financial / Managerial
(51%)Breakage in Transmission/Netw
orks8%
Water Shortage8%
1%
•Source Failure
•Major defects in machinery / rising main / distribution network / etc...
•Non Payment of dues
•Revenue not matching expenditure
Lack of funds63%
•Poor cost recovery
•Non‐representative CBO
•Community conflict
Missing/theft/damaged electrical/Mech
Parts14%
•Theft of major components like electric motor, transformer, etc...Reasons for Non‐Functioning Schemes in Sindh
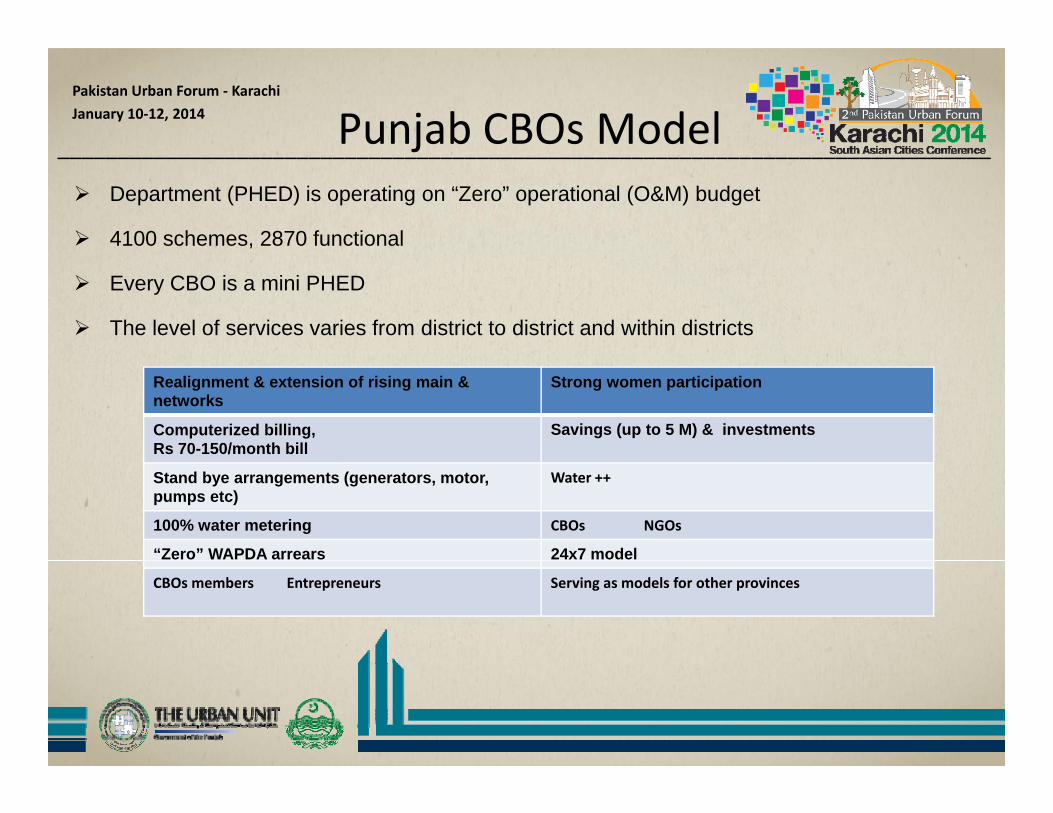
Pakistan Urban Forum ‐ Karachi January 10‐12, 2014 Punjab CBOs Model ______________________________________________________________________________
Department (PHED) is operating on “Zero” operational (O&M) budget
4100 schemes, 2870 functional
j
Every CBO is a mini PHED
The level of services varies from district to district and within districts
Realignment & extension of rising main & networks
Strong women participation
Computerized billing, Rs 70-150/month bill
Savings (up to 5 M) & investments
Stand bye arrangements (generators, motor, pumps etc)
Water ++
100% water metering CBOs NGOs
“Zero” WAPDA arrears 24x7 model
CBOs members Entrepreneurs Serving as models for other provinces

Pakistan Urban Forum ‐ Karachi January 10‐12, 2014
______________________________________________________________________________Demand Responsive Approach to Rural Water Supplies in South Asia
Communitiescontributing to CAPEX
Communities involved in entire Scheme Cycle
Communities Managing O&M
OversightMechanisms
Communities willing to PAY for WSSServices
India Upfront contribution ranging from Rs 300 to Rs 1,000per HH
Planning,Designing, Implementing, Managing Schemes
Small Schemes: O&M managed by Village Level CommitteesLarge Schemes: O&M contracted out
Social Audits by Communities
50% to 100% O&M CostRecovery through User Chargesper HH Schemes Charges
Bangladesh 5,000 Tk per HH (Max 10% of CAPEX)
Planning and Designing
Water points –Community managed; Small Schemes‐Operator managed
Local Government (Union Parishad)
100% O&M cost recovery from users
Sri Lanka Max of 10% of CAPEX
Like India Multi village – Local govt. Single Village ‐Communities
NWSDB and local govt.
100% from user charges
Nepal Cash contribution All Community level Dept of Water 100%Nepal Cash contribution is 2.5% and total (with in‐kind ) is 20%)
All Community levelschemes – managed by WSUCs (user committee)
Dept of Water Supply and Sewerage (mandated)
100%

Pakistan Urban Forum ‐ Karachi January 10‐12, 2014
______________________________________________________________________________
H i R 100 t?
DATA FROM COST EFFECTIVENESS STUDY
How is Rs 100 spent?
Demand driven
Supply driven
0 20 40 60 80 100RsInstitutional ExpIEC, HRD, NGO Etc.Loss due to overprovisionLoss due to overprovisionLoss due to defunct schemesResources used for O&M (net of recovery)Actually provides infrastructure services

Pakistan Urban Forum ‐ Karachi January 10‐12, 2014
______________________________________________________________________________
Rural Recommendations•Roles and Responsibilities of Key Agencies must be clarified and CBOs given aRoles and Responsibilities of Key Agencies must be clarified and CBOs given a Central Role•Long term backstopping needed for sustainability•Investment support programs from (Federal and Provincial Levels) should be•Investment support programs from (Federal and Provincial Levels) should be expanded and focused on the delivery of outcomes•Reinforce Policies of O&M Cost Recovery from User Fees•Introduce Training and Capacity Building to Support Transitions to New Roles•Introduce Training and Capacity Building to Support Transitions to New Roles•Begin to Address Knowledge Gaps – particularly the high level of non‐functionality•Target Outcome achievements in Sanitation Sector through PATS •Develop sector‐wide M&E system
Pakistan Urban Forum ‐ Karachi January 10‐12, 2014
______________________________________________________________________________
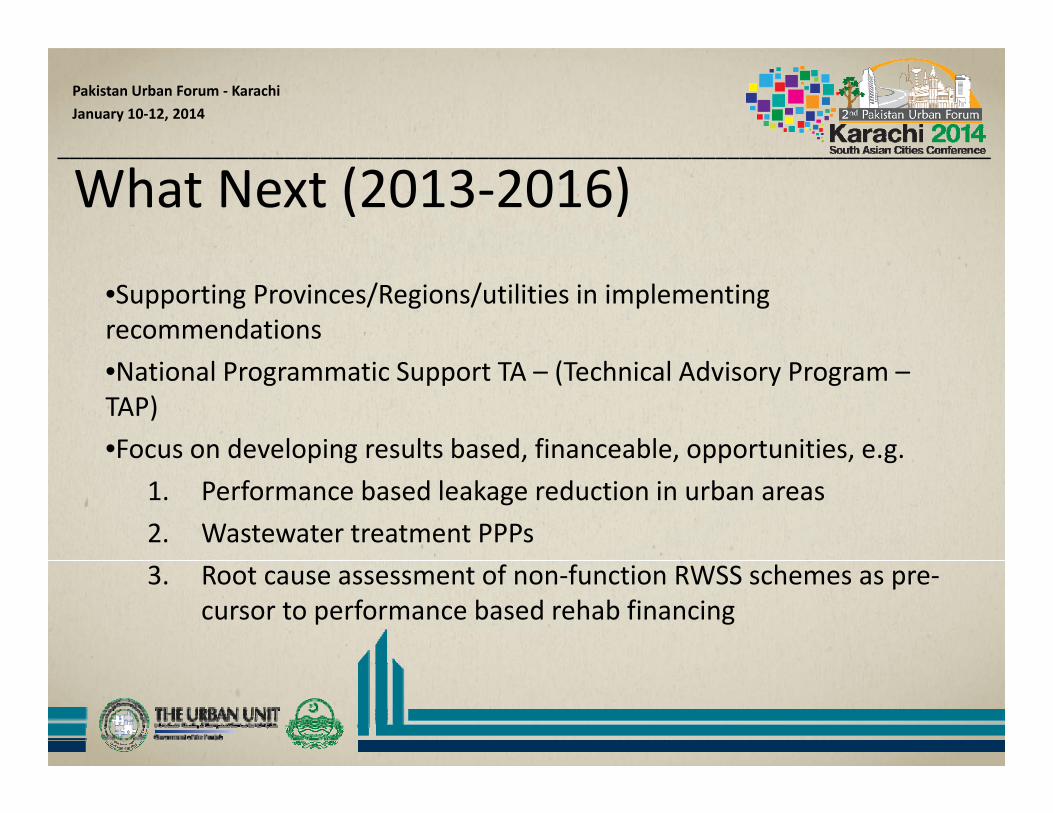
What Next (2013‐2016)
•Supporting Provinces/Regions/utilities in implementing recommendations•National Programmatic Support TA – (Technical Advisory Program –TAP)•Focus on developing results based, financeable, opportunities, e.g.Focus on developing results based, financeable, opportunities, e.g.
1. Performance based leakage reduction in urban areas2. Wastewater treatment PPPs3. Root cause assessment of non‐function RWSS schemes as pre‐
cursor to performance based rehab financing

Pakistan Urban Forum ‐ Karachi January 10‐12, 2014
______________________________________________________________________________
THANK YOUTHANK YOU
Pakistan Urban Forum ‐ Karachi January 10‐12, 2014
______________________________________________________________________________
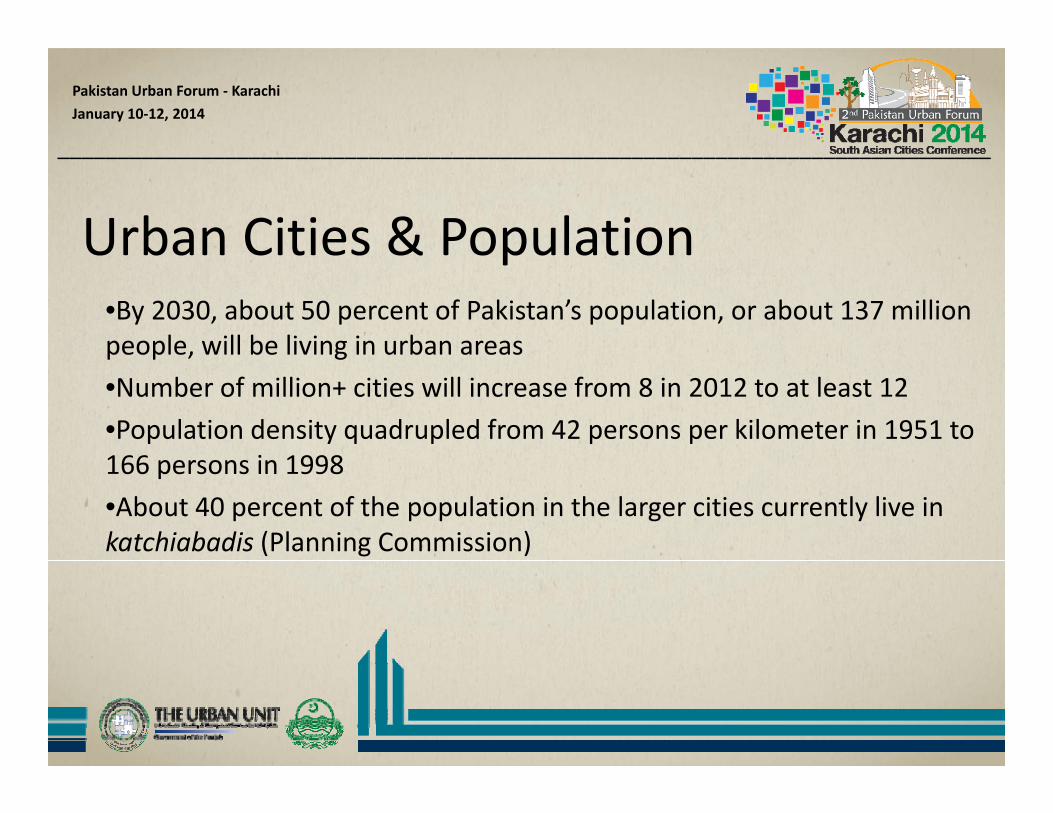
Urban Cities & PopulationUrban Cities & Population •By 2030, about 50 percent of Pakistan’s population, or about 137 million people, will be living in urban areasp p , g•Number of million+ cities will increase from 8 in 2012 to at least 12 •Population density quadrupled from 42 persons per kilometer in 1951 to 166 i 1998166 persons in 1998 •About 40 percent of the population in the larger cities currently live in katchiabadis (Planning Commission)

Pakistan Urban Forum ‐ Karachi January 10‐12, 2014
______________________________________________________________________________
Characteristics of Well Performing Utility•Well run water service providers tend to have:
•Autonomy—financial and managerial—to operate the provider without undue interference on a day‐to‐day basis and in the long‐term interests of the
itcommunity•Accountability—to a range of stakeholders to demonstrate that they provide the services and performance expected of them, whether that performance be technical or financialtechnical or financial•Customer orientation—to ensure that the provision of service to customers is the focus of management and staff•Market orientation—to ensure that the service is provided as efficiently asMarket orientation to ensure that the service is provided as efficiently as possible and thus minimizes costs to both customers and government (as a sector financier).
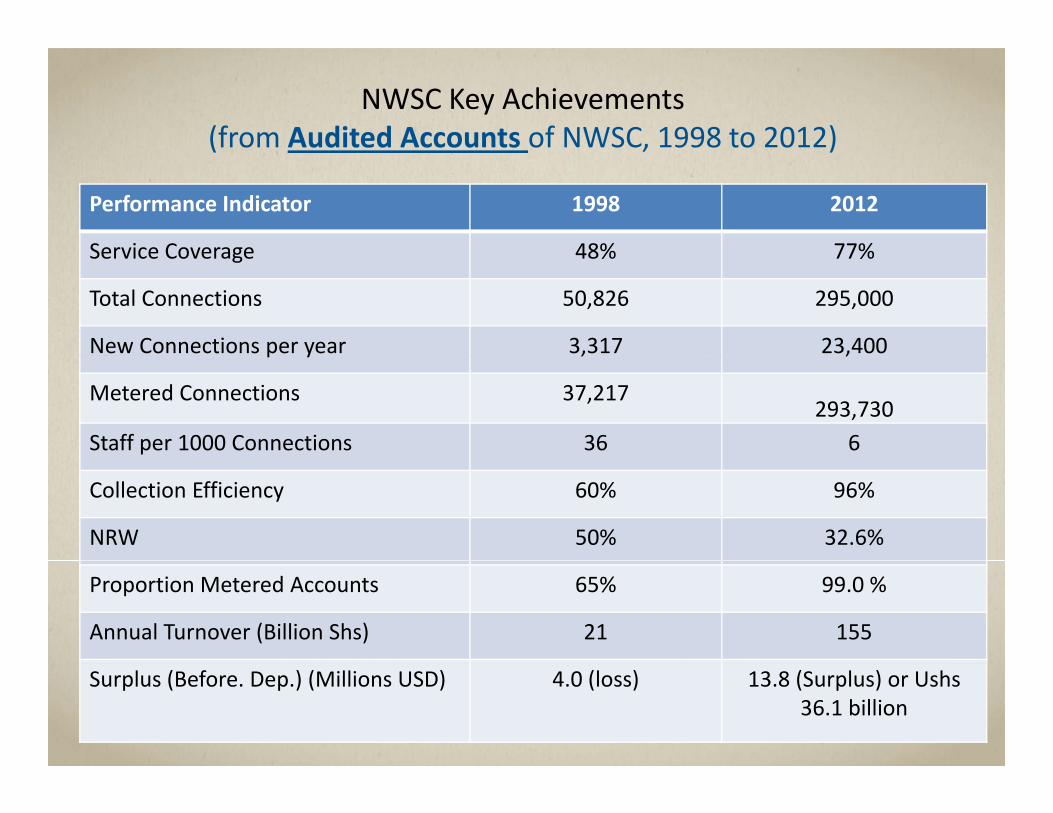
NWSC Key Achievements(from Audited Accounts of NWSC, 1998 to 2012)( , )
Performance Indicator 1998 2012
Service Coverage 48% 77%Service Coverage 48% 77%
Total Connections 50,826 295,000
New Connections per year 3,317 23,400p y , ,
Metered Connections 37,217293,730
Staff per 1000 Connections 36 6
Collection Efficiency 60% 96%
NRW 50% 32.6%
Proportion Metered Accounts 65% 99.0 %
Annual Turnover (Billion Shs) 21 155
Surplus (Before. Dep.) (Millions USD) 4.0 (loss) 13.8 (Surplus) or Ushs 36.1 billion

Pakistan Urban Forum ‐ Karachi January 10‐12, 2014
______________________________________________________________________________
JMP 2012 update (Population in 2010
Level of Water Service in Province/Region
PSLM 2010-11 (Population in 2012 = 183.5M) JMP 2012 update (Population in 2010173.5)
Province/Region Punjab% (Million)
KP% (Million)
Sindh% (Million)
Baluchistan% (Million)
AJK% (Million)
FATA% (Million)
w/o access to improved water (Urban )
9% (4.1M) 8% (0.3M) 4% (1M) 4% (0.1M) 15% (1M) NA 4% (6M)
60
70
80
90
100
20
30
40
50
60
0
10
20
AJK Balochistan Khyber Pakhtunkhwa Punjab Sindh

Pakistan Urban Forum ‐ Karachi January 10‐12, 2014
U b i 2010 i j b l h 2015 f 97% d b
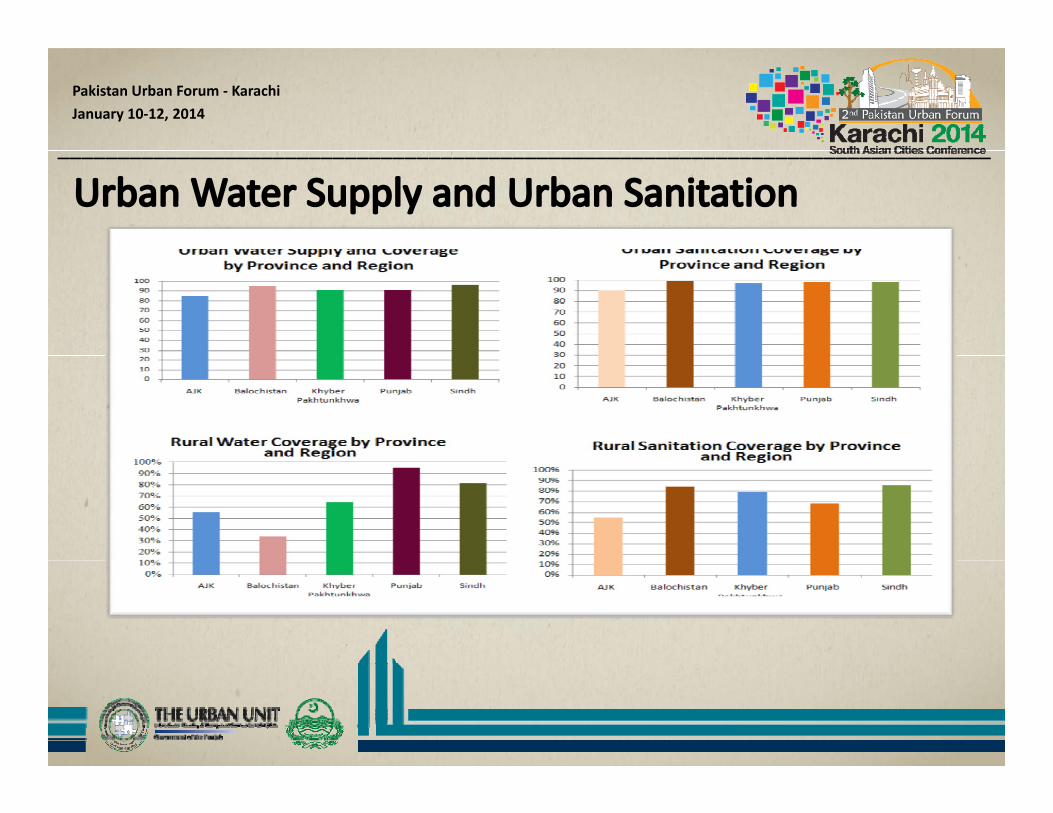
National CoverageUrban water coverage in 2010 is just below the 2015 target of 97%, and urban sanitation is well below with 2010 coverage at 72% versus a 2015 target of 86%
Water Supply Coverage Estimates
Pakistan Urban (%) Rural (%) Total (%)
1990 2008 2010 1990 2008 2010 1990 2008 2010
Improved Water 95 96 96 81 88 89 85 91 9296Piped on premises 56 57 58 8 21 23 23 34 36
Other unimproved 39 39 38 73 67 66 63 57 56
Unimproved 5 4 4 8 7 6 6 6 5
PakistanSanitation Coverage Estimates
Urban (%) Rural (%) Total (%)1990 2008 2010 1990 2008 2010 1990 2008 2010
Improvedfacilities
72 72 72 7 31 34 27 45 48
Shared 6 6 6 1 5 6 3 5 6facilitiesOtherunimproved
14 18 18 20 26 26 18 24 23
Opendefecation
8 4 4 72 38 34 52 26 23

Pakistan Urban Forum ‐ Karachi January 10‐12, 2014
______________________________________________________________________________Cost inefficiencies higher in Supply driven Schemes (Piped Water)
SSupply driven
Demand driven
0 5 10 15 20 25 30 35 40
Rs / KLCapital cost O&M costSupplementary source cost Coping costSupplementary source cost Coping costInstitutional cost SO/NGO costIndirect power subsidy
Pakistan Urban Forum ‐ Karachi January 10‐12, 2014
______________________________________________________________________________
Institutional Arrangement & Sector Actors/Institutions
• The 1973 Constitution assigns policy, planning, and financing responsibility to provinces and service provision to LGs
• The 18th amendment has resulted in fiscal, administrative and functional decentralization of several sectors to provinces
Currently, five actors are providing services across the country:
• Households (self provision). According to the PSLM 2010‐11, at least 46% in urban areas and 84% of households ( p ) g ,in rural areas receive water through hand‐pumps, motor‐pumps, and dug wells in urban areas. According to the MICS 42% of households in urban areas and 95% in rural areas are not connected to a public sewer in urban areas
• Communities operate and maintain (O&M) of smaller rural water supply and sanitation systems
• PHED is responsible for construction and major O&M of rural water supply and sanitation, and construction and major O&M of urban water supply and sanitation. PHEDs are responsible for all engineering works for rural and b f h llurban areas except for the million+ cities
• WASAs/KWSB Million+ cities of Lahore, Faisalabad, Gujranwala, Rawalpindi, Multan & Quetta have WASAs and Karachi has KW&SB as service providers

Pakistan Urban Forum ‐ Karachi January 10‐12, 2014
______________________________________________________________________________
‐ Slide 5 on institutional arrangements should come after Slide 6 Access to W & S in the South Asia area. Best to bring g gin the regional context up front. Island of success & achievements like UU Punjab to Sindh to KP, OPP in Karachi, Corporate Urban utility in Peshawar no mention on OPP?