paint industry- self-monitoring manual - industrial unit
TRANSCRIPT


Paint Industry- Self-Monitoring Manual
List of Acronyms BOD Biological Oxygen Demand
COD Chemical Oxygen Demand
O&G Oil and Grease
CO Carbon Monoxide
CO2 Carbon Dioxide
VOCs Volatile Organic Compounds
MEK Methyl ethyl Ketone
MIBK Methyl Iso Butyl Ketone
SOx Sulfur Oxides
NOx Nitrogen Oxides
TDS Total Dissolved Solids
EMS Environmental Management System
EoP Treatment End-of-Pipe Treatment
CP Cleaner Production
P2 Pollution Prevention
SIC Standard Industrial Classification
SM Self-Monitoring
SMS Self-Monitoring System
WWTP Wastewater Treatment Plant
µm Micro meter 10-6 m
MHUUC Ministry of Housing, utilities and urban Communities
September 2002
Paint Industry- Self-Monitoring Manual
September 2002
HACCP Hazardous Analysis& Critical Control Point
CIP Clean in Place
SM Self-Monitoring
SMS Self-Monitoring System

Paints Industry- Self-Monitoring Manual i
Table of Contents
Page 1. Introduction 1 1.1 Preface 1 1.1.1 Project Objectives 1 1.1.2 Organization of the Manual 2 2. Description of the Industry 3 2.1 Raw Materials and Utilities 3 2.1.1 Main Raw Materials 3 2.1.2 Other raw Materials 6 2.1.3 Utilities 6 2.1.4 Equipment used in paint industry 6 2.2 Production Lines 14 2.2.1 Solvent-based Paint (household/ industrial) Production
Line 17
2.2.2 Water-based Paint Production Line 20 2.2.3 Printing Inks Production Line 22 2.2.4 Varnishes Production Line 24 2.2.5 Alkyd Resin Production Line 26 2.3 Service Units: Description and Potential Pollution Sources 29 2.3.1 Boilers 29 2.3.2 Water Treatment Units 29 2.3.3 Cooling Towers 30 2.3.4 Laboratories 30 2.3.5 Workshops and Garage 31 2.3.6 Storage Facilities 31 2.3.7 Wastewater Treatment Plants 31 2.3.8 Dow-therm Oil Heater 31 2.3.9 Solvent Recovery Unit 31 2.3.10 Restaurant and Housing Complex 32 2.4 Emissions, Effluents and Solid Wastes 34 2.4.1 Air Emissions 34 2.4.2 Effluents 34 2.4.3 Solid Wastes 38 2.4.4 Work Environment 38 2.5 Characteristics Specific to the Paint Industry 38 3. Environmental and Health Impacts of Pollutants 39 3.1 Impact of Air Emissions 39 3.2 Impact of Effluents 45 3.3 Environmental Impact of Solid Wastes 46 4. Egyptian Laws and Regulations 47 4.1 Concerning Air Emissions 47 4.2 Concerning Effluents 48 4.3 Concerning Solid Wastes 48 4.4 Concerning Work Environment 49
September 2002

Paints Industry- Self-Monitoring Manual ii
4.5 Concerning Hazardous Materials and Wastes 53 4.6 The Environmental Register 54 5. Pollution Abatement Measures 56 5.1 Air Pollution 57 5.2 Work Environment 57 5.3 Water Pollution Abatement Measures 58 5.4 Abatement Measures for Solid Wastes Pollution 62 5.5 Water and Energy Conservation 63
September 2002

Paints Industry- Self-Monitoring Manual
iii
6. Self-Monitoring, Definition and Link to EMS 65 6.1
Benefits of SM 65
6.2
Scope and Objectives of SM 65
6.3
SM and Environmental Management System (EMS) 66
6.3.1 The Environmental Management System (EMS) 66 6.3.2 Link Between Self-Monitoring and EMS 68 6.3.3 SM Link to Pollution Prevention and Cleaner Production 70
6.4
Regulatory Aspects 70
6.4.1 SM and Environmental Register 70 6.4.2 SM and Inspection 71
7. Planning of SM 73 7.1
Assessment of existing monitoring capacity 75
7.2
Identification of key parameters 75
7.3
General data required 76
7.4
Data collection, manipulation and reporting 76
7.5
Criteria for selecting monitoring method 77
7.5.1 Direct or indirect measurement 78 7.5.2 Mass balance 80 7.5.3 Emission factor 81 7.5.4 Engineering calculations 81 8. Monitoring of Raw Materials, Utilities and Products 82
8.1
Raw materials and chemicals 82
8.2
Utilities 84
8.3
Products 85
9. Operation Control 86
9.1 Monitoring process parameters 86 9.2 Planned maintenance 98
September 2002

Paints Industry- Self-Monitoring Manual
September 2002
iv
10. Environmental Monitoring 100 10.1 Emission to air 100 10.2 Effluents (wastewater) 101 10.3 Monitoring of solid waste 103 10.4 Monitoring of hazardous waste management 103
11. Data Collection, Processing and Usage 109
11.1 Data collection and processing 109 11.2 Using SM outputs 109
11.2.1 Techniques for summarizing and illustrating data 111 11.2.2 Environmental register 111
11.2.3 Reporting 111 11.2.4 Internal auditing and conclusions on results 112 11.2.5 Feedback and decision making 112 11.2.6 Using outputs in public relations 112
References
Annex A Data collection and processing Annex B Register for environmental conditions

Paints Industry- Self-Monitoring Manual 1
1. Introduction The Egyptian Pollution Abatement Project (EPAP) sponsored by FINIDA has assigned Finish and Egyptian consultants for the task of developing sector-specific inspection and monitoring guidelines.
A General Inspection Manual, GIM, has been developed covering inspection aspects common to all sectors. The manual : Discusses the strategy, objectives and tasks of the
inspectorate management. Identifies the team leader responsibilities and tasks. Presents a methodology for performing all types of
inspection. Tasks during the various phases of planning, performing field inspection, report preparation and follow-up are discussed. Several checklists are included.
Sector specific inspection manuals have been developed for the following industries: Textile industry Pulp and paper industry Food industry
- Grain milling industry - Dairy industry - Carbonated beverages industry - Confectionery industry - Fruits and vegetables industry
Metallurgical industry Fabricated metal industry Motor vehicle assembly
The developed manuals were tested through a number of training programs that targeted RBOs and EMUs. The inspectors involved in the training used these manuals to inspect a number of industrial facilities. Feedback from the concerned parties led to the improvement of these manuals and their continuous update.
1.1 Preface As a continuation of the previous effort, the following Inspection and self-monitoring manuals are being developed as part of this project. Inspection manuals: Paint industry Detergent oil and soap industries Cement and ceramic industry Fertilizer industry
Self-monitoring manuals: Paint industry
September 2002

Paints Industry- Self-Monitoring Manual
September 2002
2
1.1.1 Project Objectives The project aims at the development of sector-specific guidelines for inspection and self-monitoring to be used by inspectors and pant personnel respectively. These manuals are meant to be simplified but without abstention of any information necessary to the targeted users. Flowcharts, tables and highlighted notes are used for easy representation of information.
1.1.2 Organization of the Self-Monitoring Manual The self-monitoring manual for the paints industry includes eleven chapters. The first chapter represents an introduction to the whole project and to the specific sub-sector of the industry. Chapters two to five deal with the paints industry and its environmental impacts.
The description of the industry in chapter 2 includes the inputs and outputs, a description of the different production lines with their specific inputs and outputs, a brief description of the service and auxiliary units that could be present at the industrial establishment with their potential sources of pollution and the various emissions, effluents and solid wastes generated from the different processes.
Chapter three describes the environmental and health impacts of the various pollutants whereas chapter four gives a summary of the articles in the Egyptian environmental laws relevant to the paints industry. Chapter five gives examples of pollution abatement techniques and measures applicable to the paints industry.
Chapters 6 to 11 describe self monitoring activities and start with defining self- monitoring (SM) and its link to environmental management systems (EMS). The stages of the EMS are described and their relation to the corresponding stages of the SMS defined. The link between pollution prevention and SM is explained in the context of the Egyptian regulations. Inspection of SM results by competent inspection authorities is considered with respect to the benefits that can be achieved for the inspection process as well as the role of the inspectors in checking the results.
Planning for SM is described in chapter 7 and includes the assessment of existing monitoring capacity, the identification of key parameters, the collection of basic information and data, the organization and reporting of results and the criteria for selecting monitoring method.
Chapter 8 is concerned with monitoring of inputs and outputs whereas chapters 9 and 10 are devoted to the process monitoring and compliance monitoring respectively. Using SM outputs is described in chapter 11.

Paints Industry- Self-Monitoring Manual 3
2. Description of the Industry Products of the surface-coating (paints) are essential for the preservation of all types of architectural structures, including factories, from ordinary attacks of weather. Uncoated wood and metal are particularly susceptible to deterioration, especially in cities where soot and sulfur dioxide accelerate such action. Aside from their purely protective action, paints, varnishes, and lacquers increase the attractiveness of manufactured goods, as well as the aesthetic appeal of a community of homes and their interiors. Coatings that are used to cover building, furniture, and the like are referred to as trade sales or architecture coatings in contrast to industrial coatings which are used on materials being manufactured. Industrial finishes are applied to a wide variety of materials, such as metal, textiles, rubber, paper, and plastics, as well as wood. Architectural coatings are usually applied to wood, gypsum wall-board, or plaster surfaces. The paints industry is a branch of the chemical industries sector. Surface coating (paints) have been divided into: • • • • •
•
Solvent-based paints Water-based paints Varnishes; clear coatings. Printing inks. Resins (for paints and varnishes manufacture).
Therefore, there are different production lines, plants can have as few as one or two production lines or all of them. Service units (utilities) provide water and energy requirements as well as maintenance, storage, packaging, testing, and analysis needs. The batch process is common in paints industry, old plants use open equipment, while modern plants use the closed one. Equipment cleaning is necessary, and required between batches.
2.1 Raw Materials and Utilities
2.1.1 Main Raw Materials Liquid paints is a composite of a finely divided pigment dispersed in a liquid composed of a resin or binder and a volatile solvent. Therefore, paints are manufactured from three main constituents; pigments, binders, and solvents (thinners), in addition to many other additives to give the paints specific properties for specific purposes or applications. The liquid portion of the paints is known as the vehicle. Vehicles are composed of nonvolatile and volatile parts:
Nonvolatile; - Solvent-based paints: oils and/ or resins plus driers and additives. - Lacquers: celluloses, resins, plasticizers, and additives.
September 2002

Paints Industry- Self-Monitoring Manual 4
- Water-based paints: styrene-butadiene, polyvinyl acetate, acrylic, other polymers and emulsions, copolymers plus additives.
Volatile • Ketones, esters, alcohol, aromatics, and aliphatics.
The pigment is one of the main and important constituent of the paint. In general, pigments should be opaque to ensure good covering power and chemically inert to secure stability, hence long life. Pigments should be nontoxic, or at least of very low toxicity, to both the painter and the inhabitants. Finally, pigments must be wet by the film-forming constituents and be of low cost. Different pigments possess different covering power per unit weight. Table (1) shows the different paints constituents.
Table (1) Paints Constituents
Constituent Function Main constituents Pigments are usually: •
•
•
An inorganic substance, such as titanium dioxide, chrome pigment, earths, lead pigments, zinc pigments. A pure, insoluble organic dye known as a toner. An organic dye precipitated on an inorganic carrier such as aluminum hydroxide, barium sulfate or clay.
The function of pigments and fillers is to provide simply a colored surface, pleasing for its aesthetic appeal. The solid particles in paint reflect light rays, and thus help to prolong the life of the paints, and protect metals from corrosion.
Binders or vehicles. Those are resins or oils.
Its function is binding the pigment to the substrate.
Thinners and solvents; such as petroleum ether, toluene, xylene.
It is the volatile part of the vehicle. Its function is to dissolve the binders, adjust the paint viscosity, and give homogeneous, regular, and uniform thickness on the coated surface.
Fillers; such as clay, talc, gypsum, and calcium carbonate.
Pigment extender, or fillers, reduce the paint cost and control the rheorological properties (viscosity) of paints.
September 2002

Paints Industry- Self-Monitoring Manual 5
Table (1) Paints Constituents (continue) Constituent Function
Other additives Driers, as cobalt, lead, zinc, zirconium, manganese, calcium, barium.
To accelerate the drying of the paints.
Anti-skinning agents It is added to the paints (unsaturated), to prevent the solidification of paints surface during storage.
Anti-settling agents To improve the dispersion efficiency of the pigments into the vehicle, to prevent the settling of pigments during storage.
Plasticizers; These materials are special types of oils, phthalate esters or chlorinated paraffins.
To improve the elasticity of paint films, and to minimize the paint films tendency for cracking.
Dispersants, wetting agents, fire retarding, anti-floating, anti-foaming,…etc.
To give the paint specific property for specific purpose or application.
Paint Formulations Proper paint formulations depend upon raw materials selection and accurate calculation of the amounts of its constituents. Generally, paint is a blend, in which pigments and fillers are suspended in a liquid. The paint formulations are related to their applications. Generally paints are used to hide the original surface, providing a certain color, resisting the weathering conditions, washability, gloss, and protecting surface from corrosion. The selection of pigments, fillers, and carrying liquids (vehicles) is necessary for a proper paint. In general, pigments should be opaque to ensure good covering power, and chemically inert to secure stability, and non toxicity. To predict some properties of paints such as ease of painting, gloss, washability for a certain formulation, the pigment volume concentration (PVC) in paint is used as indicator. volume of pigment in paint
Pigment volume concentration (PVC) = (Volume of pigment in paint + volume of
nonvolatile vehicle constituents in paint)
Indicator values for pigment volume concentration in paints, is shown in table (2).
Table (2) Pigments Volume Concentration (PVC) Paints Type Indicator Values
Matt paints 50-75% Semigloss paints 35-45% Gloss paints 25-35% Exterior household paints 27-36% Metal primers 25-40% Wood primers 35-40%
September 2002

Paints Industry- Self-Monitoring Manual 6
2.1.2 Other Raw Materials Chemicals; are consumed at the facility for different purposes: • Chemicals used are organic solvents (ether, chloroform, ketones, esters,
xylene, toluene, hexane, ethyl and methyl alcohol’s), acids (acetic, boric, oxalic, benzoic, hydrochloric, sulfuric), alkalis (sodium, potassium and ammonium hydroxides), potassium chloride, sodium sulfate, sodium thiosulphate potassium iodide. These chemicals are used in the production processes, and in the quality control laboratories for raw materials and products.
• Biocides and antifouling agents are used in the manufacture of the antifouling and wood preservatives paints, and they are also used in the manufacture of water-based paints to prolong their life time.
• Water-alkali solutions, and solvents for equipment cleaning and washing, between batches.
• Detergents and antiseptics for floor cleaning. Lube oil; is used in the garage and workshops. Packaging materials; different types of packaging materials are used (aluminum foil, metallic and plastic containers, tin sheets, and cartons).
2.1.3 Utilities
Steam; is generated in boilers that use either Mazot (fuel oil), solar (gas oil) or natural gas as fuel. Steam is used for providing heat requirements and in some large facilities for electric power generations. Water; is used as process water, as rinse water for equipment and floor, as boiler feed water, as cooling water and for domestic purposes. Boiler feed water is pretreated in softeners to prevent scale formation. Water may be supplied from public water lines, wells or canals. The type of water supply will dictate the type of pretreatment.
Note: Defining the inputs and outputs helps to predict the expected pollutants.
2.1.4 Equipment Used in Paints Industry
1. Mixers Mixers are used to achieve homogeneity between different components, especially in the production of varnishes or water-based paints. Mixers are used in the following operations:
Mixing oils or resins. • • • • •
•
Mixing pigments and fillers with coating materials. Decreasing the viscosity of resins, and varnishes. Mixing additives with paints or varnishes. Adding solvents or diluting agents (thinner) to paints, to adjust the
viscosity. Preparing emulsion (water-based) paints.
September 2002

Paints Industry- Self-Monitoring Manual 7
There are many types of mixers used in paint industry, they differ in their suitability for different applications. Choice of mixer type depends on the following:
Viscosity: mixers types used in preparing pastes differ from those used in the production of low viscosity paints.
•
Density difference between components: achieving the desired homogeneity depends on the type of impeller, blades design, mixing speed, and inclination of impeller axis with respect to mixing tank axis.
•
Solid particle size: Some components, such as pigments agglomerates, have relatively large particle size compared to other components. Also volatility of solvents affects the design of mixers and the need for cooling.
•
The following are different types of mixers:
Manual mixers. • • • • • •
Automatic mixers. Kneaders. Colloid mills. Rotary churns. Mixing by air streams.
Figures (1-14) shows the types of impellers or mixers used in paints industry.
The mixers usually consists of mixing tank, usually vertical, and one or more impeller(s) driven by electrical motor, the mixing tank may also have vertical baffles. The impeller consists of a shaft assembled with one or more mixing blades propellers. Propellers can be divided into two main types, axial and radial flow propellers. Figures (1-6) show axial flow propellers, the type shown in Figure (1) is considered the most common type in paints industry. The impeller in figure (4) is fixed in the wall of mixing tank with suitable inclination, it can be also fixed vertically at the axis of mixing tank using vertical baffles. Such impellers rotate at speeds between 1150-1750 rpm. The vertical type shown in Figure (5) usually rotate at speeds between 350-420 rpm via gearbox and it is used in preparing colloids. The inclined high-speed type is used for the preparation of emulsions. The type shown in Figure (6), which fixed in the side of mixing tank, is used in mixing solid particles free liquids.
Figures (7- 10) show radial flow propellers, which have blades parallel to propeller shaft axis. Turbine propellers in figures (7, 8) rotate the mixing tank contents in circular motion in both vertical and axial directions. The diameter of paddle propellers shown in Figure (9), reaches 60% of mixing tank diameter and rotates with relatively low speeds. Figures (11 and 12) show paddle stirrers, which are used in mixing high viscosity liquids or pastes, whereas Figure (13) shows anchor stirrers which
September 2002

Paints Industry- Self-Monitoring Manual 8
are used for very high viscosity liquids or pastes. This type has a small clearance between the mixing propeller and mixing tank walls. Figure (14) shows the multiple vane stirrer, and figures (15 and 16) the motion of the inclined propellers.
Figures (17) shows kneaders used in the production of putties. The kneader consists of a separate tank which can be fixed in the mixer or transferred with its contents to the packing unit. This system helps in weighing the tank content before mixing and to clean the mixing vessel in the cleaning unit. In this system the mixers can be elevated vertically or laterally as shown in Figure (18).
Figure (19) shows a horizontal kneader consisting of a U-shaped vessel in which two mixers with special shape rotate in different directions with small clearance between them. There are other types of kneaders which can be heated by steam or cooled by water in order to control the viscosity of the mixture.
2. Mills
Paints industry uses different types of mills such as roller mills or ball mills, etc.. Figure (20) shows three-roller mills in which each roller rotates in the opposite direction of the others and with different speeds with ratio 1:3:9. The clearance between each two rollers must be controlled accurately to maintain the desired finesse of dyes. This type of mills leads to the desired homogeneity as the dye is dispersed into its particles. This type of mills is open and therefore cannot be used in grinding of paints which contain high volatility solvents as solvent emissions to the atmosphere could occur.
Another type of mills is the ball mills. This type consists of a cylinder rotating about its horizontal axis and containing the grinding balls which may be made of steel or pebbles. If steel balls are used the cylinder lining will be also made of steel and is used only with dark color paints. But if the balls are made of pebbles or ceramics the cylinder lining will be made of ceramic or silica and can be used with white or light color. The grinding efficiency and fineness of particle depend on the dimensions of the cylinder, speed of rotation, balls size and balls density. In some mills the length of the cylinder is equal to its diameter, but to maintain higher degree of fineness mills with a length larger than diameter are used. There are other types in which the grinding operation is made in steps inside the mill, as the cylinder is separated into sections with screens with suitable sizes separating the sections. The initial grinding is done in the first section and the final grinding is done in the final section. In some types of theses mills bars are used instead of balls in order to obtain particles with slightly different sizes. This type of mills is suitable for dry grinding or grinding of colloidal particles. The roller mill and ball mill are used in small factories. Presently, the most common used mills, in large modern factories, are sand mills (vertical or horizontal) and dyno mills.
September 2002

Paints Industry- Self-Monitoring Manual 9
The relations between the internal diameter of ball mills and the diameter of balls are shown in table (3).
Table (3) Relations between the internal diameter of ball mills and the
ball diameter Internal diameter
Ball diameter (cm) & their percentage
30 – 60
1.5 (70%), 2.5 (30%)
90 – 120
1.5 (30%), 2.5 - 4 (60%), 4 - 5 (10%)
120 – 150
2 – 2.5 (85%), 5 – 6.5 (15%)
3. Filters
During the manufacturing steps in paints or varnishes industry or during the oil heating process the liquids are contaminated by foreign matters that fall into them. Moreover the paint may contain particles that were not ground to the required size or some polymers that didn’t dissolve. Some surface hardness may also exist. For all the previous reasons, paints and varnished liquids must be purified by one of the following methods:
Single cylinder mill: It can work as a screen as all large pigments particles and foreign particles will be separated in the mill hopper.
•
• • • •
Fine screens. Filter press. Centrifugal separator for varnishes purification. Settling for varnishes purification.
4. Packing machines
The packing may be manual, semi-automatic, or automatic according to the size of production. There is a number of packing machines differing in speed and packs handling.
September 2002

Paints Industry- Self-Monitoring Manual 10
Fig. (2) Fig. (1)
Fig. (3) Fig. (4)
September 2002

Paints Industry- Self-Monitoring Manual 11
Fig. (5) Fig. (6)
Fig. (7) Fig. (8)
Fig. (9) Fig. (10)
September 2002

Paints Industry- Self-Monitoring Manual 12
Fig. (11) Fig. (12)
Fig. (14) Fig. (13)
Fig. (15) Fig. (16)
September 2002

Paints Industry- Self-Monitoring Manual 13
Fig. (18)Fig. (17)
Input
Output Low speed
Knife
Medium speed
High speed
Fig. (20)Fig. (19)
September 2002

Paints Industry- Self-Monitoring Manual 14
2.2 Production Lines Table (4) presents the various production lines and service units that could be present in a facility.
Note: Knowledge of the processes involved in each production line and service unit allows the prediction of pollution hazards and expected violations and helps determine possibilities for implementing cleaner technology.
Table (4) Production lines and service units in paints industry
Service Units Production Lines Heating furnaces (Dow-therm oil heater) Cooling towers Solvent recovery unit Compressors Boilers Generators Laboratories Mechanical & electrical workshops Garage Storage facilities Wastewater Treatment Plant Restaurant and Housing complex
Water-based paints Solvent-based (household) paints Solvent-based (industrial) paints Printing inks production line Varnishes production line Resins production line
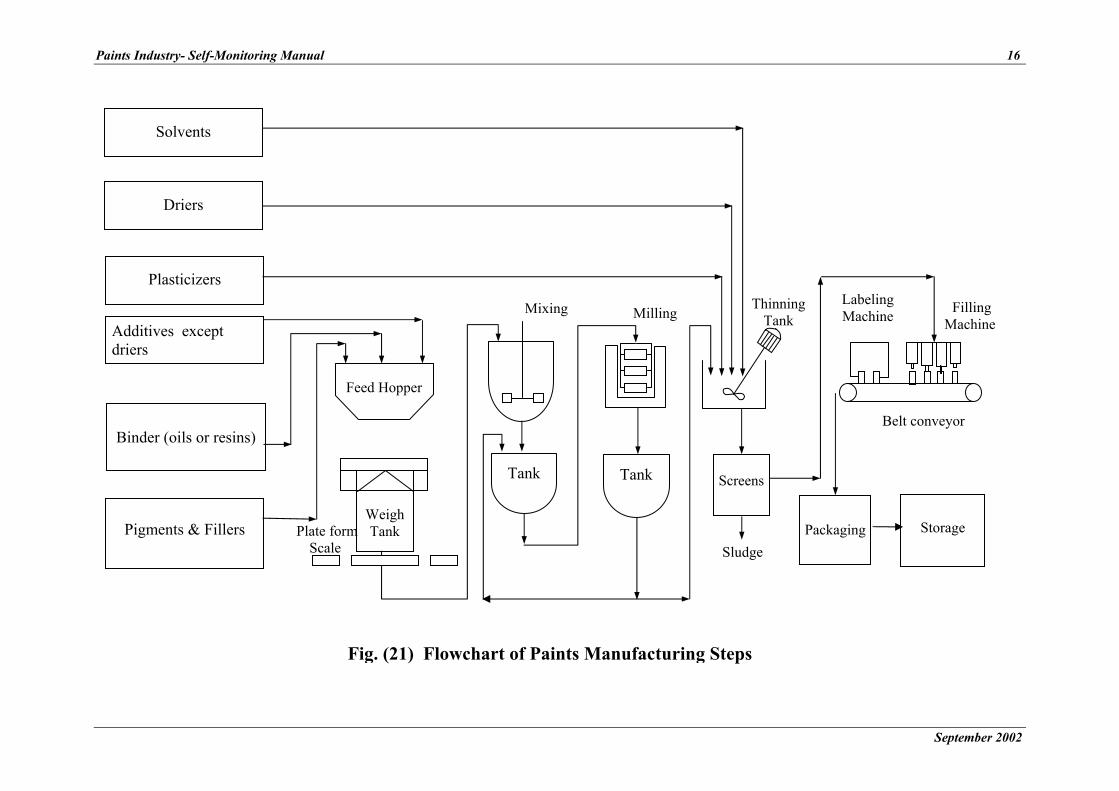
Large plants use huge number of raw materials and chemicals, and produce a multitude products for different applications. Paints industry is characterized by batch processing, which helps adjust the color and properties of paints. The unit operations used for paints manufacture are shown in Figure (21). These unit operations are mainly physical (mixing, grinding, filtration and packaging). Chemical conversions are involved in the manufacture of the constituents of paints as well as in the drying of the film on the substrate. These constituents are either exported or purchased from another chemicals production plant, therefore, the chemical processes involved in the production of these constituents will not be addressed in this manual. The manufacture procedures illustrated in Fig. (21) are for a mass-production of paints. The weighing, assembling, and mixing of the pigments and vehicles take place on the top floor. The mixer may be similar to a large dough kneader with sigma blades. The batch masses are conveyed to the next operation, where grinding and further mixing take place. A variety of grinding mills may be used. One of the oldest methods is grinding, or dispersion, between two buhrstones; however, ball-and-pebble mills and steel roller mills were the principal grinding mills used until recently. Sand mills, high-speed agitators, and high-speed stone mills are being used increasingly to grind paints and enamels.
September 2002
Paints Industry- Self-Monitoring Manual 15
The types of pigments and vehicles are dominant factors in the choice of the equipment used. The mixing and grinding of pigments in oil require skill and experience to secure a smooth product. After mixing, the paint is transferred to the next operation, where it is thinned and tinted in agitated tanks, which may hold batches of several thousand liters. The liquid paint is strained into a transfer tank or directly into the hopper of the filling machine. Centrifuges, screens, or pressure filters are used to remove nondispersed pigments. The paint is poured into cans or drums, labeled, packed, and moved to storage, each step being completely automatic
September 2002
Paints Industry- Self-Monitoring M
Solvents
Additives except driers
Plasticizers
Driers
Binder (oils or resins)
Pigments & Fillers
anual 16
Feed Hopper
Screens Tank
Packaging Storage
Weigh Tank
Mixing
Tank
Milling Thinning Tank
Belt conveyor
Labeling Machine Filling
Machine
Sludge Plate form
Scale
Fig. (21) Flowchart of Paints Manufacturing Steps
September 2002

Paints Industry- Self-Monitoring Manual 17
2.2.1 Production of solvent-based (household/ industrial) Paints The solvent-based paints differ according to their applications and therefore the raw materials and additives (adhesives, driers, heat resisting agents, …) used in their production. They include industrial and household paints. The industrial paints are used for industrial purposes such as motor vehicle, washing machine, and pipelines painting operations. The household paints are used to cover buildings and furniture. Figures (22, 23) present the main operations in the solvent-based household/ industrial paints production lines, the input to the units and the pollution sources.
Mixing
Alkyd resins or vegetable oils (boiled linseed oil), fatty acids, pigments (titanium dioxide), fillers (talc, and calcium carbonate), and plasticizers are weighed, and fed automatically to the mechanical mixers.
Grinding After mixing, the mixture (batch) is transferred to the mills for further mixing, grinding, and homogenizing. The type of used mill is related to the type of pigments, vehicles, and fillers.
Intermediate storage
In some plants, after grinding, the batch is transferred to an intermediate storage tank, because the batch may need further grinding to obtain the required degree of homogeneity.
Thinning/ dilution
The batch is then transferred from the intermediate storage tank to a mixer for thinning and dilution, where solvents, and other additives are added.
Filtration and finishing
After thinning, the batch is filtered in a filter, to remove nondispersed pigments and any entrained solids. Metal salts are added to enhance drying (cobalt, lead, zirconium).
Packaging and storage
The paint is poured into cans or drums, labeled, packed, and moved to storage, each step being completely automatic.
September 2002

Paints Industry- Self-Monitoring Manual 18
Figure (22) Solvent-based (household) Paints Production Line
Mixing
Inputs Processing Steps Pollution Sources
Pigments
Titanium dioxide (TiO2) Raw Materials Spills or leaks Filler (Talc, Calcium Carbonate)
Linseed Oil
Alkyd resin
Solvent (Turpentine)
Grinding Rollers Cooling Water
Spent Cooling Water (closed or open circuit) Spent Solvent (mills washing & cleaning)
Finishing Cobalt drier Spent solvent (vessels &
tanks washing or cleaning)Lead drier Zirconium drier
Filtration Solid waste
(sludge from filter press)
Packaging & Storage
Solvent – based paints (building)
Packages Leaks or spills
Spent solvent (Mixers washing & cleaning)
* Work place pollution parameters are VOCs, particulates, and noise. ** Spills or leaks could occur through the whole process, and may contaminate the water if
discharged to the sewer. *** Chemicals empty containers are generated, and considered hazardous. Those hazardous
solid waste should be safely disposed into a landfill.
September 2002

Paints Industry- Self-Monitoring Manual 19
Figure (23) Solvent-based (Industrial) Paints Production Line
Mixing
Inputs Processing Steps Pollution Sources
Styrenated alkyd resin Raw Materials Spills or
leaks
Filler (Talc, Calcium Carbonate)
Ti O2
Acrilamide Resin Epoxy Resin Phenolic Resin Iron Oxide pigment Vinyl Resin
Grinding Rollers Cooling Water Spent Solvent (mills washing & cleaning)
Spent Cooling Water (closed or open circuit)
Finishing Toluene Spent solvent (vessels &
tanks washing or cleaning)Xylene
Filtration Solid waste
(sludge from filter press)
Industrial Paints
Packaging & Storage
Packages
Spent solvent (Mixers washing & cleaning)
Leaks or spills
* Work place pollution parameters are VOCS, particulates, and noise. ** Spills or leaks could occur through the whole process, and may contaminate the water if
discharged to the sewer. *** Chemicals empty containers are generated, and considered hazardous. Those hazardous
solid waste should be safely disposed into a landfill.
September 2002

Paints Industry- Self-Monitoring Manual 20
2.2.2 Production of Water-based Paints Figure (24) presents the main operations in the water-based production line, the input to the units and the pollution sources. The water-based paints manufacturing steps are similar to those of the solvent-based paints production, except that the raw materials are added to the mixture in different order, and water is used instead of solvent as thinner.
Mixing and thinning/ dilution
Mixing in water-based occurs in two steps. In the first step (very high speed mixing) all inorganic materials dispersing agents, and wetting agents are mixed thoroughly. In the second one, polymer, glycol, freeze thaw agent, etc… are added and mixed at low speed. The pigments, acrylic resins, and extenders most used are water-dispersible grades of titanium dioxide, zinc sulfide, lithophone, and regular grades of barium sulfate, mica, diatomaceous silica, clay, and magnesium silicate.
Grinding After mixing, the batch is transferred to the mills for further mixing, grinding, and homogenizing. The type of used mill is related to the type of pigments, vehicles, and fillers.
Mixing of additives
The batch is then transferred to a mixer, where ammonia and dispersants are added to water, followed by pigments (premixed and ground in a mill). plastisizers, anti-foaming agents, preservative solution (usually chlorinated phenols) and polyvinyl acetate to give the required characteristics. Other additives are needed for specific purposes.
Intermediate storage
In some plants, after that, the batch is transferred to an intermediate storage tank, because the batch may need further grinding to obtain the required degree of homogeneity.
Filtration and finishing
The batch is then filtered in a filter to remove nondispersed pigments and any entrained solids.
Packaging and storage
The paint is poured into cans or drums, labeled, packed, and moved to storage, each step being completely automatic.
September 2002

Paints Industry- Self-Monitoring Manual 21
Figure (24) Water-based Paints Production Line
Mixing
Inputs Processing Steps Pollution Sources
Raw Materials Spills or leaks
Water
Titanium dioxide (TiO2)
Talc
Calcium Carbonate/ other fillers
Grinding Rollers Cooling Water
Spent Cooling Water (closed or open circuit)
Mills Washing & Cleaning Wastewater
Finishing Emulsion polymer
Water + Ammonia Vessels or tanks washing &
cleaning wastewater
Filtration
Coalescents & other additives
Mixers Washing & Cleaning Wastewater
Defoamer
Silica
Solid waste (sludge of filter press)
Water – based paints
Packaging & Storage
Packages Spills or leaks
* Work place pollution parameters are ammonia, particulates, and noise. ** Spills or leaks could occur through the whole process, and may contaminate the water if
discharged to the sewer. *** Chemicals empty containers are generated, and considered hazardous. Those hazardous
solid waste should be safely disposed into a landfill.
September 2002
Paints Industry- Self-Monitoring Manual 22
2.2.3 Production of Printing Inks Figure (25) presents the main operations in the printing inks production line, the input to the units and the pollution sources. The printing inks manufacturing steps are similar to those of the paints production. Printing inks consist of a fine dispersion of pigments or dyes in a vehicle which may be a drying oil with or without natural or synthetic resins. Drying oils or petroleum oils and resins are used, although the newer synthetic resin systems are finding great favor because they are quick-drying and their working properties are excellent. There are three main types of printing inks; black inks, paste inks, and liquid inks. The paste inks are used in manufacturing of pens, and the black inks in newspaper print, and the liquid inks for printing on metals, plastics, carton.
Mixing
Binder (resins/ oils), pigments (in paste, and liquid inks) or carbon black (in black inks), and solvent or water are used according to the type of ink manufactured. These raw materials are fed automatically to the mechanical mixers.
Grinding After mixing, the batch is transferred to the mills for further mixing, grinding, and homogenizing. The type of used mill is related to the type of pigments, vehicles, and fillers.
Intermediate storage
In some plants, after grinding, the batch is transferred to an intermediate storage tank, because the batch may need further grinding to obtain the required degree of fineness.
Filtration and finishing
After thinning, the batch is filtered in a filter (usually filter press) to remove nondispersed pigments and any entrained solids. Other additives are added to the batch for special purposes.
Packaging and storage
The paint is poured into cans or drums, labeled, packed, and moved to storage, each step being completely automatic.
September 2002

Paints Industry- Self-Monitoring Manual 23
Figure (25) Printing Inks Production Line Inputs Processing Steps Pollution Sources
Paste inks
Black Inks
Liquid Inks
Filtration & Packaging
Packages
Spent Cooling (Open or Closed Circuit) Cooling Water
Grinding Intermediate storage
Paste inks
Binder (oil/ resin)
Spent Solvent (Mixers Cleaning)
Pigments
Mixing
Mixing
Filtration& Packaging
Packages
Spent Cooling Water Grinding
Cooling Water
Intermediate storage
Plasticizer
Black inks
Carbon Black Binder (oil/ resin)
Spent Solvent (Mixers Cleaning)
Mixing Carbon Black Spent Solvent(Mixers Cleaning) Binder (oil/ resin)
Filtration& Packaging
Packages
Grinding Cooling Water Spent Cooling Water
Plasticizer
Finishing (ve
Intermediate storage
Carbon black particulates (work place)
Additives (adhesives, heat resistant)
Liquid inks
* Work place pollution parameters are VOCS, particulates, and nois** Spills or leaks could occur through the whole process, and may
discharged to the sewer. *** Chemicals empty containers are generated, and considered haz
solid waste should be safely disposed into a special landfill.
Spent Solvent ssels Cleaning)
e. contaminate the water if
ardous. Those hazardous
September 2002

Paints Industry- Self-Monitoring Manual 24
2.2.4 Production of Varnishes Figure (26) presents the main operations in the varnishes production line, the input to the units and the pollution sources. A varnish is an unpigmented colloidal dispersion or solution of synthetic and/or natural resins in oils or urethenated oils dissolved in true solvents. These are used as protective or decorative coating for various surfaces specially wood.
Mixing
Only one production step occurs, in which the binders (natural resin + oil, nitro cellulose + short alkyd resin, urethenated oil, synthetic resins,…etc.) are thoroughly mixed with true solvents. After thorough mixing, the required additives are added. These raw materials are fed automatically to a mixing container.
Filtration and finishing
After mixing has been finished, the batch is filtered in a filter, to remove any entrained solids.
Packaging and storage
The varnish is poured into cans or drums, labeled, packed, and moved to storage, each step being completely automatic.
September 2002

Paints Industry- Self-Monitoring Manual 25
Figure (26) Varnishes Production Line
Inputs Processing Steps Pollution Sources
Additives Aromatic & aliphatic Solvents
Filtration Sludge
(Solid Waste)
Packages Packaging & Storage
Caustic Wash wastewater from reactor cleaning
Binder (oil/ resin)
Mixing
Spills or leaks
Varnishes * Work place pollution parameters are VOCS, and particulate. ** Spills or leaks could occur through the whole process, and may contaminate the water if
discharged to the sewer. *** Chemicals empty containers are generated, and considered hazardous. Those hazardous
solid waste should be safely disposed into a landfill.
September 2002
Paints Industry- Self-Monitoring Manual 26
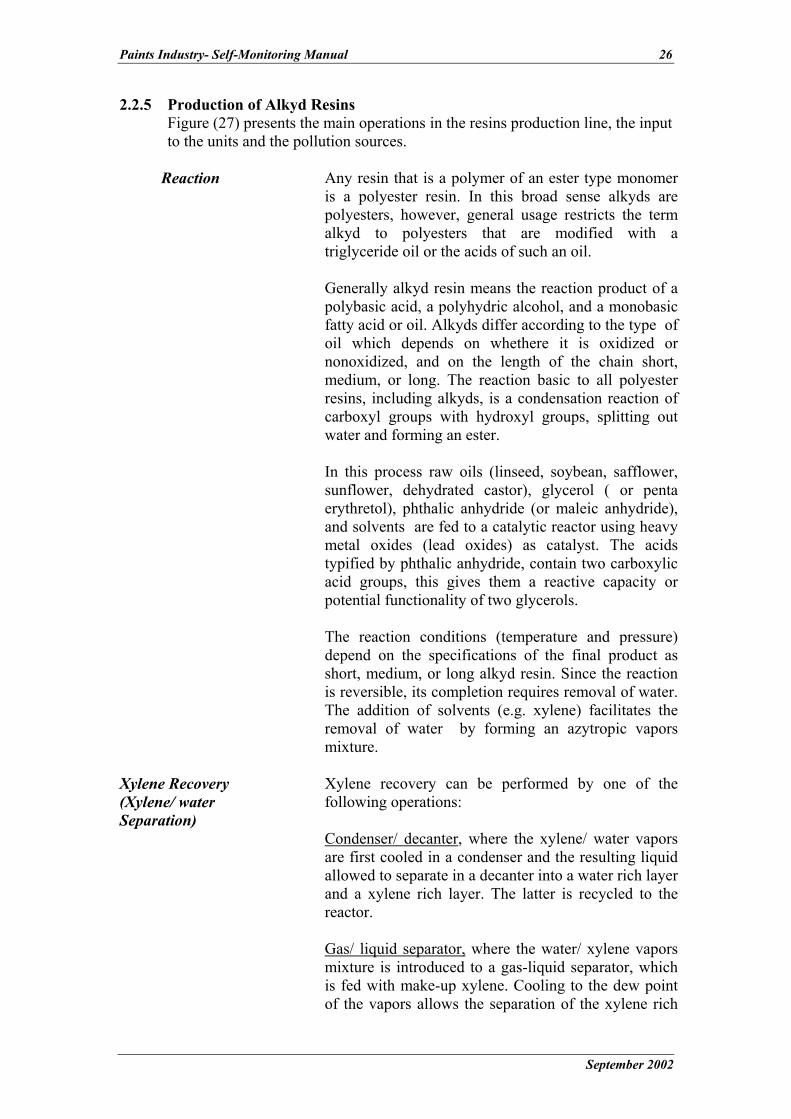
2.2.5 Production of Alkyd Resins Figure (27) presents the main operations in the resins production line, the input to the units and the pollution sources.
Reaction
Any resin that is a polymer of an ester type monomer is a polyester resin. In this broad sense alkyds are polyesters, however, general usage restricts the term alkyd to polyesters that are modified with a triglyceride oil or the acids of such an oil. Generally alkyd resin means the reaction product of a polybasic acid, a polyhydric alcohol, and a monobasic fatty acid or oil. Alkyds differ according to the type of oil which depends on whethere it is oxidized or nonoxidized, and on the length of the chain short, medium, or long. The reaction basic to all polyester resins, including alkyds, is a condensation reaction of carboxyl groups with hydroxyl groups, splitting out water and forming an ester. In this process raw oils (linseed, soybean, safflower, sunflower, dehydrated castor), glycerol ( or penta erythretol), phthalic anhydride (or maleic anhydride), and solvents are fed to a catalytic reactor using heavy metal oxides (lead oxides) as catalyst. The acids typified by phthalic anhydride, contain two carboxylic acid groups, this gives them a reactive capacity or potential functionality of two glycerols. The reaction conditions (temperature and pressure) depend on the specifications of the final product as short, medium, or long alkyd resin. Since the reaction is reversible, its completion requires removal of water. The addition of solvents (e.g. xylene) facilitates the removal of water by forming an azytropic vapors mixture.
Xylene Recovery (Xylene/ water Separation)
Xylene recovery can be performed by one of the following operations: Condenser/ decanter, where the xylene/ water vapors are first cooled in a condenser and the resulting liquid allowed to separate in a decanter into a water rich layer and a xylene rich layer. The latter is recycled to the reactor. Gas/ liquid separator, where the water/ xylene vapors mixture is introduced to a gas-liquid separator, which is fed with make-up xylene. Cooling to the dew point of the vapors allows the separation of the xylene rich
September 2002

Paints Industry- Self-Monitoring Manual 27
vapor from the water solution. The Xylene rich vapor is recycled to the reactor, and the contaminated water is discharged to the internal sewer system of the plant.
Cooling The produced resin is cooled to about 200oC, by cooling water circuit.
Dilution The batch is transferred to tanks, where it is diluted with suitable solvent.
Filtration After dilution, the batch is filtered in a filter (usually plate and frame filter press), to remove any entrained solids.
Properties adjustment
After filtration, additives are added to adjust the properties of the resin.
Packaging and storage
The produced resin is then stored in barrels (for sale) or in tanks to be used in the solvent-based paints manufacturing.
September 2002
Paints Industry- Self-Monitoring Manual 28
Figure (27) Alkyd Resins Production Line
Reactor 250-300ºC
(Heating by Dowtherm oi1
Heater)
Inputs Processing Steps Pollution Sources
Humidity & heat stress (work place)
Oil or fatty acids
Alcohols (Penta earithritol, or glycerol)
Phathatic anhydride or maleic anhydride
Solvents (e.g. xylene)
Lead Oxide (catalyst) Additives (driers; Mg, Co, pb, Ba)
Caustic wash wastewater from reactor cleaning
Xyl
ene
Rec
ycle
d
Water/ Xylene vapors
Separation G/L Separator
Wastewater contains traces of Xylene
Cooling, Dilution,
Adjustment
Spent solvent from tanks cleaning Solvent (Turpentine)
Xylene (make-up)
Resin
Filtration
Intermediate Storage
Sludge (Solid waste)
S
* Work place pollution parameters ar** Spills or leaks could occur thro
water if discharged to the sewer.*** Chemicals empty containers are g
solid waste should be safely dispose
Alkyd Resin to olvent-based paints,inks and varnishes production lines
September 2002
e VOCS, and particulates. ugh the whole process, and may contaminate the
enerated, and considered hazardous. Those hazardous d into a landfill.

Paints Industry- Self-Monitoring Manual 29
2.3 Service Units, Description and Potential Pollution Sources
Medium and large size plants will have some/all of the following service and auxiliary units. These units can be pollution sources and therefore should be inspected and monitored. Figure (28) shows the various service units with their corresponding raw materials and potential pollution sources.
2.3.1 Boilers
Boilers are used to produce steam which is used to supply heat to the processes. Although, processes in the production lines do not require steam, some paints facilities have boilers to supply heat to the solvent recovery unit.
The gaseous emissions, due to fuel (Mazot or solar) burning, contain primarily particulates (including heavy metals if they are present in significant concentrations in the fuel), sulfur and nitrogen oxides (SOx, and NOx), carbon oxides (CO, and CO2), and volatile organic compounds (VOCs). The concentration of these pollutants in the exhaust gases depends on firing configuration (nozzle design, chimney height), operating practices and fuel composition.
Wastewater is generated as blow-down purged from boilers to keep the concentration of dissolved salts at a level that prevents salt precipitation and consequently scale formation. The blow-down will be high in (TDS)
Also large quantities of water is used for cooling the turbines, therefore, spent cooling water is generated. Also steam condensate is generated as wastewater. The amount of wastewater generated depends on whether cooling is performed in open or closed cycle, and on the recycling of steam condensate (may return to the boiler). Wastewater contamination may arise from lubricating and fuel oil.
The heat stress may be high, in work place, in case of absence of thermal insulation for boilers and steam pipelines.
2.3.2 Water Treatment Units
There are different treatment processes, depending on the water source and the application in the industry. i) Water softening for medium hardness water
calcium and magnesium ions are removed from hard water by using cation exchange resin (sodium form). When the exchange resin has been loaded with Ca and Mg ions, it is regenerated to the sodium form by using a salt solution (sodium chloride) in the pH range of 6-8. This is performed by backwashing with the salt solution. The treated water has a hardness level of less than 1 ppm expressed as calcium carbonate.
ii) Water softening for very high bicarbonate hardness Water from wells and canals is pre-treated before softening. Water is treated first by the lime process, then by cation exchange resin. The lime process reduces dissolved solids by precipitating calcium carbonate and magnesium hydroxide from the water. It can reduce calcium hardness to
September 2002

Paints Industry- Self-Monitoring Manual 30
35 ppm if proper opportunity is given for precipitation. A coagulant such as aluminum sulfate (alum) or ferric sulfate is added to aid magnesium hydroxide precipitation. Calcium hypochlorite is added in some cases. Currently the use of organic polyelectrolytes is replacing many of the traditional inorganic coagulant aid. Sludge precipitates and is discharged to disposal sites whereas the overflowing water is fed to a sand filter followed by an activated carbon filter that removes any substances causing odor and taste. A micro filter can then be used to remove remaining traces. A successful method to accelerate precipitation is contacting previously precipitated sludge with the raw water and chemicals. The sludge particles act as seeds for further precipitation. The result is a more rapid and more complete reaction with larger and more easily settled particles.
iii) Desalination (Reverse Osmosis/ Electro-dialysis)
Desalination can also be performed by reverse osmosis. In this process water is forced through a semi-permeable membrane by applying pressure.
2.3.3 Cooling Towers
Moderate quantities of cooling water is used for cooling furnaces and the formation equipment in this industry. Cooling towers provide the means for recycling water and thus minimizing its consumption. The cooling effect is performed through partial evaporation. This causes an increase in the concentration of dissolved salts which is controlled by purifying some water (blow-down). The blow-down will be high in TDS and will represent a source of pollution to the wastewater to which it is discharged.
2.3.4 Laboratories
Laboratories, in paint industry, are responsible for: • Testing raw materials for compliance with required standards. • Quality control of products to check agreement with standard
specifications. • Check the physical, chemical, and mechanical properties of final products. Chemicals, including hazardous materials, are used in laboratories. Storage and handling should be checked by the inspectors, in addition to the disposal of chemicals empty containers, which is considered as hazardous waste.
2.3.5 Workshops and Garage
Workshops are very important in the paint industry, where they are divided into mechanical and electrical workshops. They are responsible for repairing and maintenance of the equipment. Environmental violation could be due to: • Noise • Rinse water contaminated with solvents and lube oil Pollution in the garage will depend upon the services offered. The presence of a gasoline or diesel station implies fuel storage in underground or over the
September 2002

Paints Industry- Self-Monitoring Manual 31
ground tanks that require leak and spill control plans. Replacing lube oil implies discharge of spent oil to the sewer system or selling it to recycling facility.
2.3.6 Storage Facilities
The specifications for the storage facilities depend on the nature and properties of the stored material: • Environmental laws stipulate that special system should be applied for
handling and storing hazardous chemicals. • Fuel is kept in under/or above ground tanks. Storage requires proper
preventive plans for spills and leaks. 2.3.7 Wastewater Treatment Plants
Although a WWTP is a pollution abatement measure, it has to be inspected and monitored for potential pollution. Pollution may be due to malfunctioning or improper management. A paints production facility discharges wastewater, high in organic load. From time to time, due to batch processing, peak load will be discharged. They may be due to internal processes, to seasonal fluctuations, to lack of control or a “force majeur” situation such as power collapse. The potential pollution sources are: • Sludge which represents a solid waste problem. • Treated water could represent a water pollution problem if not
complying with relevant environmental laws.
2.3.8 Dow-therm Oil Heater
Heating oil is heated in a furnace, where fuel is burned to produce the necessary energy. The pollution is expected to be generated from oil leaks or spills, which may contaminate the wastewater, if discharged to the sewer system. The gaseous emissions generated from stacks, due to fuel (Mazot or solar) burning in the heater.
2.3.9 Solvent Recovery Unit The spent solvent generated from equipment cleaning, in the solvent-based production line, could be recovered by vacuum distillation of the spent solvent, then condensation of solvent vapors. Spent solvent could be recovered through distillation process, with about 90% solvent yield achievable from the still, and 10% sludge (removed paints). The solvent can be recycled for reuse in dilution or cleaning. The sludge (precipitates) generated from the solvent recovery process could be dried and safely disposed into a landfill, or used in the production of a new paint product (a primer).
2.3.10 Restaurants, Washrooms and Housing Complex
These facilities will generate domestic wastewater as well as domestic solid waste.
September 2002

Paints Industry- Self-Monitoring Manual 32
Figure (28) Service Units and their Related Pollution Sources Inputs Service Units Pollution
Water Lime + chemicals
Fuel
Sludge Back- wash w.w
Boiler Blow Down (TDS)
Flue Gases
Hot Water
Cooling Tower Blow-down (TDS)
Chemicals
Wastewater Hazardous
Materials (handling)
Lube Oil
Floor and equipment rinse water
Cleaning Chemicals
Oily Rinse Water
Solid Wastes
Fuel Oil Rinse Water
Oily rinse water
Solid wastes
Raw materials
Fuel
Chemicals
Products
Spills
Raw material
Hazardous Material
Wastewater
Treated wastewater Sludge WWTP
Softening Units
Boilers
Steam
Cooling Towers
Laboratory
Electrical & Mechanical workshops
Storage
Garage
Treatment
September 2002
Paints Industry- Self-Monitoring Manual 33
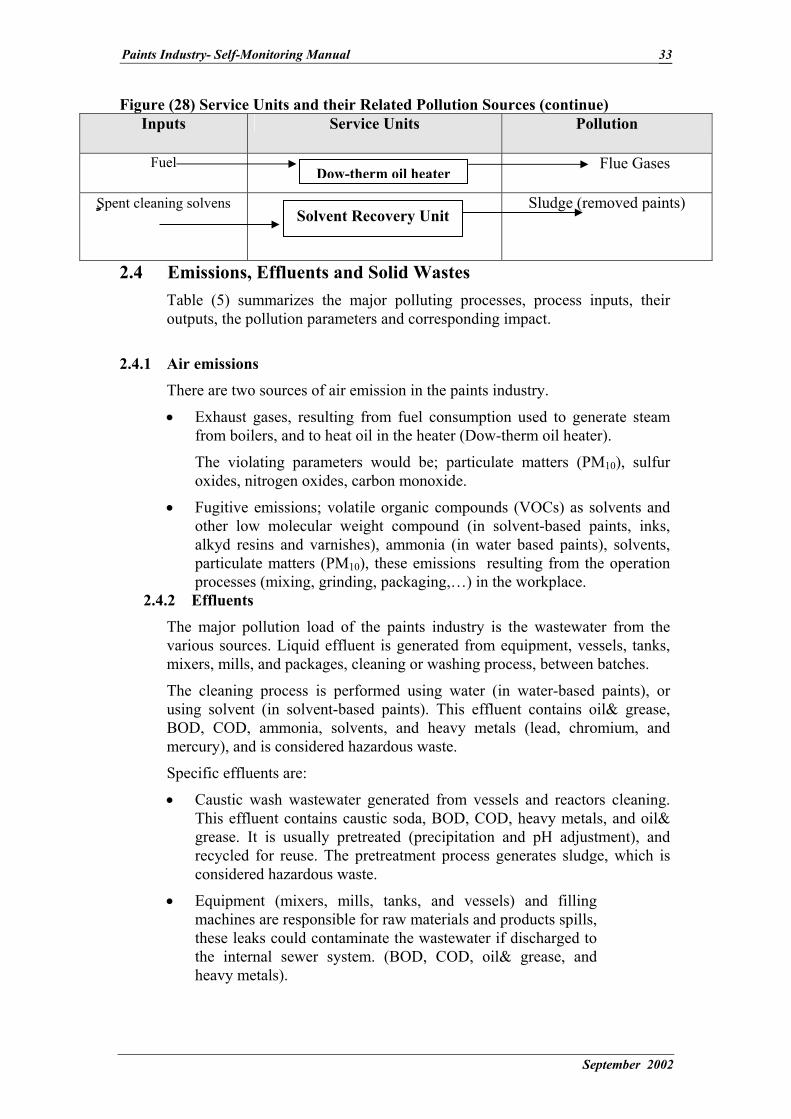
Figure (28) Service Units and their Related Pollution Sources (continue) Inputs Service Units Pollution
Fuel Flue Gases
Spent cleaning solvens Solvent R
Dow-t
2.4 Emissions, Effluents anTable (5) summarizes the moutputs, the pollution parame
2.4.1 Air emissions
There are two sources of air e
Exhaust gases, resultingfrom boilers, and to heat
•
•
•
•
The violating parameteroxides, nitrogen oxides, c
Fugitive emissions; volaother low molecular wealkyd resins and varnishparticulate matters (PM1processes (mixing, grindi
2.4.2 Effluents
The major pollution load ofvarious sources. Liquid efflumixers, mills, and packages, c
The cleaning process is perusing solvent (in solvent-baBOD, COD, ammonia, solvmercury), and is considered h
Specific effluents are:
Caustic wash wastewateThis effluent contains cagrease. It is usually prerecycled for reuse. The considered hazardous wa
Equipment (mixers, mimachines are responsiblethese leaks could contamthe internal sewer systeheavy metals).
herm oil heater
Sludge (removed paints) ecovery Unit
d Solid Wastes ajor polluting processes, process inputs, their
ters and corresponding impact.
mission in the paints industry.
from fuel consumption used to generate steam oil in the heater (Dow-therm oil heater).
s would be; particulate matters (PM10), sulfur arbon monoxide.
tile organic compounds (VOCs) as solvents and ight compound (in solvent-based paints, inks, es), ammonia (in water based paints), solvents, 0), these emissions resulting from the operation ng, packaging,…) in the workplace.
the paints industry is the wastewater from the ent is generated from equipment, vessels, tanks, leaning or washing process, between batches.
formed using water (in water-based paints), or sed paints). This effluent contains oil& grease, ents, and heavy metals (lead, chromium, and azardous waste.
r generated from vessels and reactors cleaning. ustic soda, BOD, COD, heavy metals, and oil& treated (precipitation and pH adjustment), and pretreatment process generates sludge, which is ste.
lls, tanks, and vessels) and filling for raw materials and products spills, inate the wastewater if discharged to m. (BOD, COD, oil& grease, and
September 2002

Paints Industry- Self-Monitoring Manual 34
Spent solvents used for equipment cleaning in the solvent-based paints production line. The solvent is recovered by distillation and recycled back. The nonvolatile materials, sludge (containing paints, solvents, and heavy metals) is disposed as solid waste, and considered hazardous.
•
•
•
•
•
Blow-downs from the cooling tower and boilers as well as back-wash of softeners are high in TDS and TSS.
Spent lube oil from garage and workshops if discharged to sewer will give oily wastewater (O&G).
Floor washing and sanitation produces a wastewater containing organic matter, oil and grease, and traces of the chemicals used for sanitation.
Out-dated, off-spec, and refused or rejected products.
Typical effluent characteristics of the Egyptian paints industry are shown in table (6) Typical pollution loads per ton of production are given in table (7).
Table (5) Pollutants Per Process
MAJOR POLLUTING
PROCESS
PROCESS INPUTS
PROCESS OUTPUTS
POLLUTION PARAMETERS
IMPACT
Accepted product
Fugitive emissions
VOCs, particulates Work Environment
Solid waste Chemicals empty containers, paints filters
sludge
Land
Spent cooling water
Contaminated with traces of chemicals ( O&G,
BOD, COD, TDS, TSS, S.S, color, pH, heavy
metals )
Water
Spent solvent from equipment
cleaning
Contaminated with paints
Water, if discharged to sewer
Solvent-based paints Pigments Resins Fillers
Binding agents Solvents Additives
Losses or leaks to Sewer
O&G, BOD, COD, TDS, TSS, S.S, color, pH,
heavy metals
Water
Accepted product
Fugitive emissions
particulates, ammonia Work Environment
Solid waste Chemicals empty containers, paints filters
sludge
Land
water-based paints Pigments Fillers
Binders (resins/ oils)
Water Ammonia
Spent cooling water
Contaminated with traces of chemicals ( O&G,
BOD, COD, TDS, TSS, S.S, color, pH, heavy
metals )
Water
September 2002

Paints Industry- Self-Monitoring Manual 35
Wastewater from equipment wash
O&G, BOD, COD, TDS, TSS, S.S, color, pH,
heavy metals
Water
Losses or leaks to Sewer
O&G, BOD, COD, color, pH, TDS, TSS, S.S,
heavy metals
Water
Accepted product
Fugitive emissions
VOCs, particulates Work Environment
Spent cooling water
Contaminated with traces of chemicals ( O&G,
BOD, COD, TDS, TSS, S.S, color, pH, heavy
metals )
Water
Spent solvent from equipment
cleaning
Contaminated with paints
Water, if discharged to sewer
Losses or leaks to Sewer
O&G, BOD, COD, color, pH, TDS, TSS, S.S,
heavy metals
Water
Printing inks Pigments Binder (resins/ oils)
Solvents
Solid waste Chemicals empty containers, paints filters
sludge
Land
Accepted product
Fugitive emissions
VOCs, particulates Work Environment
Spent cooling water
Contaminated with traces of chemicals ( O&G,
BOD, COD, TDS, TSS, S.S, color, pH, heavy
metals )
Water
Spent solvent from equipment
cleaning
Contaminated with paints
Water, if discharged to sewer
Losses or leaks to Sewer
O&G, BOD, COD, color, pH, TDS, TSS, S.S,
heavy metals
Water
Resins Vegetable oils Binders (resins/
oils) Solvents
Solid waste Chemicals empty containers, filters sludge
Land
Accepted product
Fugitive emissions
VOCs, particulates, acids vapor
Work Environment
Wastewater from the reaction
Contaminated with xylene
Water, if discharged to sewer
Vegetable oils
Oil free Fatty acids Alcohols/ Glycero
Penta erythrito Solvents (Xylene) Phthalic anhydride Maleic anhydride
Metal oxides
Caustic wash wastewater from
equipment cleaning
O&G, BOD, COD, color, pH, TDS, TSS, S.S,
heavy metals
Water
September 2002

Paints Industry- Self-Monitoring Manual 36
Losses or leaks to Sewer
O&G, BOD, COD, color, pH, TDS, TSS, S.S,
heavy metals
Water
Spent cooling water
Contaminated with traces of chemicals ( O&G,
BOD, COD, TDS, TSS, S.S, color, pH, heavy
metals )
Water
Solid waste Chemicals empty containers, filters sludge
Land
Packaging Paints products Losses in wastewater
O&G, BOD, COD, color, pH, heavy metals
Water
Treated Water Softeners Raw Water
Back-wash TDS, TSS Water
Treated Water + Condensate recycle
Blow-down TDS, TSS Water Boilers
Fuel Flue Gasses PM10, CO2, CO, NOx, SOx
Air
Cooling Towers Water Blow-down TDS, TSS Water
Dow-therm oil heater
Fuel Flue Gasses PM10, CO2, CO, NOx, SOx
Air
Sludge Solvents and heavy metals
Land Solvent Recovery Unit
Spent solvents
Air emissions (VOCS)
solvents Air
Treated effluent O&G, BOD, COD, TDS, TSS, S.S, color, pH,
heavy metals
Water WWTP Process W.W
Sludge O&G, heavy metals, TSS Soil
Table (6) Typical chemical analysis of paints factory waste effluents
Parameter pH
BOD mg/1
COD mg/1
TSS mg/1
TDS mg/1
S.S mg/1
Color Pt/CO
Oil& Greasemg/1
Solvent-based paints line
7.7 66 221 39 353 - 15 28
Water-based paints line
7.7 3000 5930 1485 1659 - Out-of-range
402
Printing inks 7.1 220 680 123 403 0.5 40 168 Resins 7.4 615 1344 218 790 3 55 89
September 2002

Paints Industry- Self-Monitoring Manual 37
Table (7) Typical organic pollution loads in Egyptian paints industry per ton of production
Plants
Effluent flow rate
m3/d
BOD kg/d
COD kg/d
TSS Kg/d
TDS Kg/d
S.S Kg/d
Oil& Grease Kg/d
Solvent-based paints line
150 9.9 33.15 5.85 53 - 4.2
Water-based paints line
2.5 7.5 14.83 3.7 4.15 - 1
Printing inks 2 0.44 1.4 0.25 0.81 0.001 0.34 Resins 90 55.4 121 19.6 71 0.27 8
2.4.3 Solid and Hazardous Wastes
The main sources of hazardous and solid wastes are:
Empty containers of raw materials and chemicals, contaminated with traces of chemicals, are considered as hazardous waste.
•
•
•
•
•
•
•
•
Spent bags of the Bag-Filters, contain pigments particulates. This solid waste is considered as hazardous waste.
Sludge generated from the solvent recovery unit, and filter press, containing paints, solvents, and heavy metals, are considered as hazardous waste.
Outdated, rejected, and off-spec. products. These solid wastes are considered hazardous wastes.
Sludge generated from the biological wastewater treatment plant, may contain heavy metals, and could be considered hazardous.
Oil separators could be used as a pretreatment before the WWTP or in the garage, workshops, and storage area. Sludge is generated from the oil separators and considered hazardous waste.
Scrap metals generated from workshops and garage.
Packaging wastes, paper, plastic,…
2.4.4 Work Environment
There are many sources of air emission in the paints industry. These emissions resulting from the operation processes (mixing, grinding, packaging,…) in the workplace.
Fugitive emissions; volatile organic compounds (VOC) as solvents and other low molecular weight compound (in solvent-based paints), ammonia (in water based paints), particulate matters (PM10) of pigments during unpacking and mixing.
Noise could occur during grinding (near mills).
September 2002

Paints Industry- Self-Monitoring Manual
September 2002
38
2.5 Characteristics Specific to the Paints Industry
Proper inspection and monitoring of the paints industry should take into consideration the following aspects:
•
•
•
•
Production lines operate on batch mode, therefore, equipment cleaning and washing are performed between batches.
Shock loads are expected and are caused by discharging equipment wash wastewater, in water-based paints production lines.
Paints products production rate is seasonal, it increases in summer and decreases in winter.
Pollution loads are expected to be higher during start-up and shut-down.

Paints Industry- Self-Monitoring Manual 39
3. Environmental and Health Impacts of Pollutants 3.1 Impact of Air Emissions
Particulates Particulate matters from fuel combustion and other manufacturing processes
Recent epidemiological evidence suggests that much of the health damage caused by exposure to particulates is associated with particulate matters smaller than 10µm (PM10). These particles penetrate most deeply into the lungs, causing a large spectrum of illnesses (e.g. asthma attack, cough, bronchitis).
Emissions of particulates include ash, soot and carbon compounds, which are often the result of incomplete combustion.
Lead, cadmium, Chromium, and other metals of pigments, can also be detected in the production processes.
Chromium pigments
Chromium is steel-gray, lustrous metal; body-centered cubic structure, gray crystals and blue-white hard metal. It is also an odorless element, insoluble in water. Under strongly oxidizing conditions, may be converted to hexavalent state & occur as chromate anions. Chromium is soluble in acids (except nitric) and strong alkalies.
Chromium is causing irritation to the upper respiratory tract, severe nasal irritation. Chromium (III), the naturally occurring form, has low toxicity due to poor membrane permeability and non-corrosivity, while Cr (VI), from industrial emissions, is highly toxic due to strong oxidation characteristics and ready membrane permeability.
Occupational exposure to trivalent chromium and other chromium compounds by inhalation has been studied in the chromate manufacturing and ferrochromium industries; however, exposures all include mixed exposures to both Cr (III) and Cr (VI). Cr (VI) species is the likely etiological agent in reports of excess cancer risk in chromium workers. Data addressing exposures to Cr (III) alone are not available and data are inadequate for an evaluation of human carcinogenic potential. Hexavalent chromium is known to be carcinogenic in humans by the inhalation route of exposure. Hexavalent chromium compounds are carcinogenic in animal bioassays. There is sufficient evidence for increased incidence of lung cancer among workers.
Chromium occurs in nature mostly as chrome iron ore (feo.cr 203). Chromium is present in small quantities in all soils & plants. Movement from the soil surface to a depth of 10 cm was observed for all of the seven metals; cadmium, chromium, copper, molybdenum, nickel, lead and zinc, but most of the
September 2002

Paints Industry- Self-Monitoring Manual 40
metal (60%-100%, mean 87%) remained in the upper 5 cm of soil.
Although most of the soluble chromium in surface waters may be present as Cr (VI), a small amount may be present as Cr (III) organic complexes. Hexavalent chromium is the major stable form of chromium in seawater; however, Cr (VI) may be reduced to Cr (III) by organic matter present in water, and may eventually deposit in sediments.
Nickel pigments Nickel is a silvery metal, odorless, Excellent resistance to corrosion and insoluble in water, ammonia; soluble in diluted nitric acid; slightly soluble in hydrochloric acid and sulfuric acid.
Nickel metal is well known cause of contact dermatitis in sensitized individuals. Instances of dermatitis in region of eyes has resulted from contact with nickel spectacle frames, but eye itself has not been involved. Histological changes in nasal mucosa of nickel workers were studied. Nickel is considered toxic as dust or powder. Nickel is the most frequent metal, which induces allergic contact sensitization. Nickel hypersensitivity dermatitis may be initiated by contact with nickel on the skin. Exposure to industrial nickel dust causes nickel dermatitis. Sensitivity to nickel may be exhibited from skin contact … divalent nickel ions can penetrate skin at sweat-duct & hair follicle ostia, & bind with keratin.
There is sufficient evidence in humans for the carcinogenicity of nickel sulfate, and of the combinations of nickel sulfides and oxides. There is inadequate evidence in humans for the carcinogenicity of metallic nickel and nickel alloys. There is sufficient evidence in experimental animals for the carcinogenicity of metallic nickel, nickel monoxides, nickel hydroxides and crystalline nickel sulfides.
No data was found to suggest that nickel is involved in any biological transformation in the aquatic environment.
Lead pigments Chronic exposure to lead has been found to produce infertility, germinal epitheleium damage, oligospermia and testicular degeneration, decreased sperm motility, and prostatic hyperplasia. The subjective symptoms of lead poisoning in working adults are diffuse and include weariness at the end of the day. The patient is moody and irritable and may fall asleep watching T.V. Often he loses his interest in leisure- time activities. Lead poisoning is due to inhalation of lead dust, upon inhalation, absorption takes place easily from the respiratory system tract and symptoms develop relatively quickly than oral ingestion.
September 2002

Paints Industry- Self-Monitoring Manual 41
Cadmium Cadmium and cadmium compounds are carcinogenic to humans. They are highly toxic, inhalation (dust or fumes), and cause throat dryness, cough, headache, vomiting, chest pain, extreme restlessness and irritability, penumonitis, possibly bronchopneumonia, and it is irritating to nose and throat. Inhalation of cadmium dust, fumes, or salts over a number of years result ion chronic cadmium poisoning, a disease characterized by distinctive, non-hypertrophic emphysema with or without renal tubular injury, in which urinary execration of a protein occurs. Other toxic effects include anemia, eosinophilia, anosmia, chronic rhinitis, yellow discoloration of teeth, and bone changes.
Gases
Sulfur Oxides
Air pollution by sulfur oxides is a major environmental problem. This compound is harmful to plant and animal life, as well as many building materials. Another problem of great concern is acid rain which is caused by the dissolution of sulfur oxides in atmospheric water droplets to form acidic solutions that can be very damaging when distributed in the form of rain. Acid rain is corrosive to metals, limestone, and other materials, also deteriorates the agriculture land.
Nitrogen Oxides Nitrogen oxides also dissolve in atmospheric water droplets to form acid rain.
Carbon Dioxide Combustion of fossil fuels to produce electricity and heat contribute to the green house effect caused by the formation of carbon dioxide. The greenhouse phenomenon occurs when heat radiation from earth is absorbed by the gases causing a surface temperature increase.
Water Vapor (Humidity)
Humidity in workplace is regulated by law 4/1994 due to its effect on the respiratory system especially for people suffering from asthma.
September 2002

Paints Industry- Self-Monitoring Manual 42
Vapors
Ammonia Ammonia is a corrosive and severely irritating gas with a pungent odor.
Anhydrous ammonia is irritating to the skin, eyes, nose, throat, and upper respiratory system. Ecologically, ammonia is a source of nitrogen (an essential element for aquatic plant growth), and may therefore contribute to eutrophication of standing or slow-moving surface water, particularly in nitrogen-limited waters such as the Chesapeake Bay. In addition, aqueous ammonia is moderately toxic to aquatic organisms.
There is currently no evidence to suggest that this chemical is carcinogenic.
Ammonia combines with sulfate ions in the atmosphere and is washed out by rainfall, resulting in rapid return of ammonia to the soil and surface waters. Ammonia is a central compound in the environmental cycling of nitrogen. Ammonia in lakes, rivers, and streams is converted to nitrate.
Toluene Toluene is a volatile organic chemical.
Inhalation or ingestion of toluene can cause headaches, confusion, weakness, and memory loss. Toluene may also affect the way the kidneys and liver function. Reactions of toluene in the atmosphere contribute to the formation of ozone in the lower atmosphere. Ozone can affect the respiratory system, especially in sensitive individuals such as asthma or allergy sufferers. Some studies have shown that unborn animals were harmed when high levels of toluene were inhaled by their mothers, although the same effects were not seen when the mothers were fed large quantities of toluene. Note that these results may reflect similar difficulties in humans. There is currently no evidence to suggest that this chemical is carcinogenic. A portion of releases of toluene to land and water will evaporate. Microorganisms may also degrade toluene. Once volatilized, toluene in the lower atmosphere will react with other atmospheric components contributing to the formation of ground-level ozone and other air pollutants.
Xylene Xylene are rapidly absorbed into the body after inhalation, ingestion, or skin contact. Short-term exposure of humans to high levels of xylene can cause irritation of the skin, eyes, nose, and throat, difficulty in breathing, impaired lung function, impaired memory, and possible changes in the liver and kidneys. Both short- and long-terms exposure to high concentrations can cause effects such as headaches, dizziness, confusion, and lack of muscle coordination. Reactions of
September 2002

Paints Industry- Self-Monitoring Manual 43
xylene in the atmosphere contribute to the formation of ozone in the lower atmosphere. Ozone can affect the respiratory system, especially in sensitive individuals such as asthma or allergy sufferers.
There is currently no evidence to suggest that this chemical is carcinogenic.A portion of releases to land and water will quickly evaporate, although some degradation by microorganisms will occur. Xylene are moderately mobile in soils and may leach into groundwater, where they may persist for several years. Xylenes are volatile organic chemicals. As such, xylene in the lower atmosphere will react with other atmospheric components, contributing to the formation of ground-level ozone and other air pollutants.
Methyl Ethyl Ketone (MEK)
Methyl ethyl ketone is a flammable liquid. Methyl ethyl ketone (MEK) is used as a solvent. Its extremely volatile characteristic makes fugitive emissions its primary source of releases to the environment.
Breathing moderate amounts of methyl ethyl ketone (MEK) for short periods of time can cause adverse effects on the nervous system ranging from headaches, dizziness, nausea, and numbness in the fingers and toes to unconsciousness. Its vapors are irritating to the skin, eyes, nose, and throat and can damage the eyes. Repeated exposure to moderate to high amounts may cause liver and kidney effects.
No agreement exists over the carcinogenicity of MEK. One source believes MEK is a possible carcinogen in humans based on limited animal evidence. Other sources believe that there is insufficient evidence to make any statements about possible carcinogenicity.
Most of the MEK released to the environment will end up in the atmosphere. MEK can contribute to the formation of air pollutants in the lower atmosphere. It can be degraded by microorganisms living in water and soil.
Methyl Isobutyl Ketone (MIBK)
Acute inhalation can cause nose, eye, and throat irritation, nausea headatche, vertigo, incoordination,…
Methanol Methanol is highly flammable. Methanol is readily absorbed from the gastrointestinal tract and the respiratory tract, and is toxic to humans in moderate to high doses. In the body, methanol is converted into formaldehyde and formic acid. Methanol is excreted as formic acid. Observed toxic effects at high dose levels generally include central nervous system damage and blindness. Long-term exposure to high levels of methanol via inhalation cause liver and blood damage in
September 2002

Paints Industry- Self-Monitoring Manual 44
animals. Ecologically, methanol is expected to have low toxicity to aquatic organisms. Concentrations lethal to half the organisms of a test population are expected to exceed one mg methanol per liter water. Methanol is not likely to persist in water or to bioaccumulate in aquatic organisms. There is currently no evidence to suggest that this chemical is carcinogenic. Liquid methanol is likely to evaporate when left exposed. Methanol reacts in air to produce formaldehyde which contributes to the formation of air pollutants. In the atmosphere it can react with other atmospheric chemicals or be washed out by rain. Methanol is readily degraded by microorganisms in soils and surface waters.
Ethylene Glycol Long-term inhalation exposure to low levels of ethylene glycol may cause throat irritation, mild headache and backache. Exposure to higher concentrations may lead to unconsciousness. Liquid ethylene glycol is irritating to the eyes and skin. Toxic effects from ingestion of ethylene glycol include damage to the central nervous system and kidneys, intoxication, conjunctivitis, nausea and vomiting, abdominal pain, weakness, low blood oxygen, tremors, convulsions, respiratory failure, and coma. Renal failure due to ethylene glycol poisoning can lead to death. Ethylene glycol readily biodegrades in water. No data are available that report its fate in soils; however, biodegradation is probably the dominant removal mechanism. Should ethylene glycol leach into the groundwater, biodegradation may occur. Ethylene glycol in water is not expected to bioconcentrate in aquatic organisms, adsorb to sediments or volatilize. Atmospheric ethylene glycol degrades rapidly in the presence of hydroxyl radicals.
Acetone Acetone is a volatile and flammable organic chemical. Acetone is irritating to the eyes, nose, and throat. Symptoms of exposure to large quantities of acetone may include headache, unsteadiness, confusion, lassitude, drowsiness, vomiting, and respiratory depression. Reactions of acetone (see environmental fate) in the lower atmosphere contribute to the formation of ground-level ozone. Ozone (a major component of urban smog) can affect the respiratory system, especially in sensitive individuals such as asthmatics or allergy sufferers. There is currently no evidence to suggest that this chemical is carcinogenic. If released into water, acetone will be degraded by microorganisms or will evaporate into the atmosphere. Degradation by microorganisms will be the primary removal mechanism.
September 2002

Paints Industry- Self-Monitoring Manual 45
Acetone is highly volatile, and once it reaches the troposphere (lower atmosphere), it will react with other gases, contributing to the formation of ground-level ozone and other air pollutants.
Petroleum Ether Petroleum ether is a mixture of hydrocarbons having carbon numbers in the range of C5 through C6, it is used as solvent. Petroleum ether is classified as reactive and volatile, and it participate in smog formation. Occupational exposure to petroleum ether can occur through inhalation, dermal contact, and ingestion. Petroleum ether applied to the skin may induce severe irritation, its vapor is an irritant of the mucous membranes and respiratory tract. It also affect the central nervous system, and may cause headache, fatigue, poor concentration, emotional instability, and impaired memory.
Chloroform Chloroform is an irritant, its main effect is as a central nervous system and cardiac depressant. Delayed renal and hepatic toxicity may also occurs. It can be a poison by ingestion and inhalation. General symptoms of exposure include nausea, vomiting, anorexia, salivation, a sensation of bodily warmth, headache, chest pain, fatigue, giddiness, drowsiness, and disorientation.
Butyl Acetate Butyl acetate vapors can affect central nervous system and cause headache, muscle weakness, giddiness, ataxia, confusion, delirium, coma. It also has and irritating effect to skin, eyes, throat. It causes cough and dyspnea. It may result to death by respiratory failure. Butyl acetate has moderate mobility is soil, ans its volatilization is expected from moist and dry soil, and water surfaces.
Ethyl Acetate The inhalation of ethyl acetate may be damaging to lung, liver, kidney, and heart. It is also toxic by ingestion. It may cause irritation of the eyes, nose, and throat. It is expected to have high mobility in soil and it is volatile from moist soil and water surfaces, its biodegradation in soil is also expected.
Cellosolve Cellosolve can affect the central nervous system causing headache, drowsiness, and weakness. Long term exposure may affect semen quality. Cellosolve has a very high mobility in soil, and its biodegradation may occur rapidly in water.
Butyl Cellosolve Butyl cellosolve can affect the central nervous system causing headache, drowsiness, and weakness. It penetrates skin easily and has toxic action by excessive skin exposure. It is also irritating to eyes, nose, and throat. It is expected to have high mobility in soil and to biodegrade rapidly in soil.
September 2002

Paints Industry- Self-Monitoring Manual 46
Butyl Alcohol Butyl alcohol vapors irritate and cause cough, it may cause irritation to eyes, nose, throat, and mucous membrane, headache, dizziness, and drowsiness. In high concentration it can cause central nervous system depression. It has high mobility in soil, and it is expected to volatilize from water surfaces
3.2 Impact of Effluents
The environmental impact of the wastewater depends on the receiving water body. The Ministry of Irrigation has set limits for the pollutants in the wastewater discharged into agriculture canals and drains as well as the Nile river for their detrimental effect on agriculture. The parameters of relevance to the paints industry are O&G, BOD, COD, TSS, TDS, S.S, heavy metals, temp., color, and pH.
Discharge of polluted wastewater high in BOD, O&G, and COD into lakes and sea can cause eutrofication and impact bio-diversity. Eutrofication is a natural aging process in which the water becomes organically enriched, leading to increasing domination by aquatic weeds, transformation to marsh land, and eventually to dry land. Eutrofication can be accelerated by human input of nutrients. Die-off and settling of plant growth results in sediment oxygen demand, which tend to decrease dissolved-oxygen levels. The organic material in wastewater stimulates the growth of bacteria and fungi naturally present in water which then consume dissolved oxygen. In addition heavy metals could be toxic to the plants and aquatic life because they interfere with many beneficial uses of the water..
Discharge of high O&G, BOD, and COD loads to the public sewer system will have an indirect environmental impact. Increased loads can cause malfunction of the domestic wastewater treatment plant.
Spent lube oils from garage and workshops could be a cause for concern if discharged into the sewer system because they tend to coat surfaces causing maintenance problems. Also, if they discharged to surface waters, they can interfere with the aquatic life in these surface waters and create unsightly floating matter and films. In addition, spent solvent and caustic wash wastewater generated from equipment washing and cleaning could make corrosion of the internal sewer system of the plant, if discharged.
3.3 Environmental Impact of Solid and Hazardous Wastes
Most of the generated solid waste is considered hazardous waste, and should be dumped in disposal sites for hazardous waste.
Sludges generated from the filters, solvent recovery unit, and WWTP (if exist) containing heavy metals, could contaminate the soil, surface water and underground water, if disposed.
September 2002

Paints Industry- Self-Monitoring Manual
September 2002
47
Empty containers of raw materials and chemicals, may be sold to contractor. This solid hazardous waste could affect the human health, if used domestically (food packaging,…).

Paints Industry- Self-Monitoring Manual 48
4. Egyptian Laws and Regulations There are a number of laws and regulations that address the different environmental violations. The following are the laws applicable to the paints industry.
4.1 Concerning Air Emissions Article 40 of Law 4/1994, article 42 of the executive regulations and annex 6 deal with gaseous emissions from combustion of fuel. The statutes relevant to the fuel combustion are:
• The use of solar oil and other heavy oil products, as well crude oil shall be
prohibited in dwelling zones. • The sulfur percentage in fuel used in urban zones and near the dwelling
zones shall not exceed 1.5%. • The design of the burner and fire-house shall allow for complete mixing of
fuel with the required amount of air, and for the uniform temperature distribution that ensure complete combustion and minimize gas emissions caused by incomplete combustion..
• Gases containing sulfur dioxide shall be emitted through chimneys rising sufficiently high in order that these gases become lighter before reaching the ground surface, or using fuel that contains high proportions of sulfur in power generating stations, as well as in industry and other regions lying away from inhabited urban areas, providing that atmospheric factors and adequate distances to prevent these gases from reaching the dwelling and agricultural zones and regions, as well as the water courses shall be observed.
• Chimneys from which a total emission of wastes reaches 7000 – 15000 kg/hr, shall have heights ranging between 18 – 36 meters.
• Chimneys from which a total emission of gaseous wastes reaches more than 15000 kg/hour, shall have heights exceeding at least two and a half times the height of surrounding buildings, including the building served by the chimney.
• The permissible limits of emissions from sources of fuel combustion in boilers are given in table (8) (Ministerial decree no. 495, 2001). The permissible limits of emissions from sources of other fuel combustion sources (Dow-therm oil heater) are given in table (9).
Table (8) Maximum Limits of Emissions from Sources of Fuel
Combustion in Boilers Pollution Maximum limit mg/m3 of
Exhaust
Sulfur Dioxide
3400
Carbon Monoxide
250
September 2002

Paints Industry- Self-Monitoring Manual 49
Smoke 50 Table (9) Maximum Limits of Emission from Fuel Burning Sources
Pollutant Maximum Permissible Limit, mg/ m3 SMOKE 250 DISPERED ASHES
250 (sources existing in urban regions, or close to residential areas)
500 (sources far from habitation) 500 (burning of wastes)
SULPHUR DIOXIDE Existing 4000 New 2500
ALDEHYDES Burning of waste 20
CARBON MONOXIDE Existing 4000 New 2500
4.2 Concerning Effluents Limits for pollutants in wastewater vary depending on the type of receiving water body. The parameters that should be monitored and/or inspected are Oil& grease, BOD, COD, pH, color, temperature, residual chlorine, TSS, TDS, and heavy metals. Table (10) presents the permissible limits for discharges to the different recipients (sea, Nile, canals, agricultural drains, public sewer) according to the different relevant laws. Spent lube oil has a negative impact on water and soil and therefore its disposal should be monitored/inspected. A record should be kept for this purpose.
4.3 Concerning Solid Wastes A number of laws address solid waste management. The following laws apply to scrap, garbage (paper,..), and sludge from the WWTP: • Law 38/1967 which addresses public cleanliness, regulates the collection
and disposal of solid wastes from houses, public places, commercial and industrial establishments.
• Ministry of Housing, Utilities and Urban Communities (MHUUC) decree No. 134 of 1968, which provides guidelines from domestic and industrial sources, including specifications for collection, transportation, composting, incineration and land disposal.
• Law 31/1976, which amended law 38/1967. • Law 43/1979, the Law of Local administration, which provided that city
councils are responsible for “physical and social infrastructure”, effectively delegating responsibility for infrastructure functions.
• Law 4/1994 regulates incineration of solid waste.
September 2002

Paints Industry- Self-Monitoring Manual 50
4.4 Concerning Work Environment
Violations of work environment could be encountered:
• Gas emissions (VOCs and metal particulates) generated in the production lines, are regulated by article 43 of Law 4/1994, article 45 of the executive regulations and annex (8), (table 11).
• In the boiler house: gas emissions, regulated by article 43 of Law 4/1994, article 45 of the executive regulations and annex 8. The limits for the relevant pollutants are presented in Table (11).
• Wherever heating is performed: temperature and humidity are regulated by article 44 of Law 4/1994, article 46 of the executive regulations and annex 9 of the Law (table 12).
• Near heavy machinery: noise is regulated by article 42 of Law 4/1994, article 44 of the executive regulations and table 1, annex 7 of the Law.
• Ventilation is regulated by article 45 of Law 4/1994 and article 47 of the executive regulations (tables 13, 14, 15)
• Smoking is regulated by article 46 of Law 4/1994 and article 48 of the executive regulations, and Law 52/1981.
• Work environment conditions are addressed in Law 137/1981 for Labor, Minister of Housing Decree 380/1983, Minister of Industry Decree 380/1982
September 2002

Paints Industry- Self-Monitoring Manual 51
Table (10) Egyptian Environmental Legal Requirements for Industrial Wastewater
Law 48/82: Discharge into :
Drains
Parameter (mg/1 unless
otherwise noted)
Law 4/94: Discharge
Coastal Environment
Law 93/62 Discharge to Sewer System (as modified by Decree 44/2000) Underground Reservoir &
Nile Branches/Canals
Nile (Main Stream) Municipal Industrial
BOD (5day,20 deg.)
60 <600 20 30 60 60
COD
100 <1100 30 40 80 100
pH (Grease)
6-9 6-9.5 6-9 6-9 6-9 6-9
Oil & Grease
15 <100 5 5 10 10
Temperature (deg.)
10C>avg. temp of receiving body
<43 35 35 35 35
Total Suspended Solids
60 <800 30 30 50 60
Settable Solids
__ <10 __ 20 ___ ___
Total Dissolved Solids
2000 __ 800 1200 2000 2000
Chlorine
__ <10 1 1 ___ 10
PO4 5 30 1 1
___ ___
Total phosphorus
25 ___ ___ ___ ___
Fluoride 1 <1 0.5 0.5 __
0.5
September 2002

Paints Industry- Self-Monitoring Manual
September 2002
52
Law 48/82: Discharge into :
Drains
Parameter (mg/1 unless
otherwise noted)
Law 4/94: Discharge
Coastal Environment
Law 93/62 Discharge to Sewer System (as modified by Decree 44/2000) Underground Reservoir &
Nile Branches/Canals
Nile (Main Stream) Municipal Industrial
Cadmium 0.05 0.2 0.01 0.01
Chromium 1 __ __
__
Chromium Hexavalent
__ 0.5 1 1
Copper 1.5 1.5 1
1
Iron 1.5 __ 1 1
Total concentration for theses metals should not exceed 1 for all flow streams
Lead 0.5 1 0.05 0.05 __ __
Mercury 0.005 0.2 0.001 0.001 __
__
Nickel 0.1 1 0.1 0.1 __
__
Silver 0.1 0.5 0.05 0.05 __
__
Zinc 5 <10 1 1 __
__
Cyanide 0.1 <0.1 __
__
__
0.1
Total heavy metals __
Total metals should not exceed 5 mg/l
1 1 1 1

Paints Industry- Self-Monitoring Manual 53
Table (11) Permissible limits as time average and for short periods
Threshold Time average Exposure limits for short
periods
Material
ppm mg/m3 ppm mg/m3
Ammonia 25 18 35 27
Carbon dioxide 5000 9000 15000 27000
Carbon monoxide 50 55 400 440
Sulfur dioxide 2 5 5 10
Acetone 750 1780 1000 2375
n- Butyl alcohol 50 150
Butyl acetate 150 710 200 150
Toluene 100 375 150 560
Xylene 100 435 150 655
Ethyl acetate 400 1400
Cadmium salts/ particulates
0.05 0.2
Hexa valent chromium
0.05
Total particulates 200
Table (12) Maximum Permissible Limits for Heat Stress (law 4/1994)
Type of Work Low Air Velocity High Air Velocity
Light work 30o C 32.2 o C Moderate work 27.8 o C 30.5 o C Severe work 26.1 o C 28.9 o C
September 2002
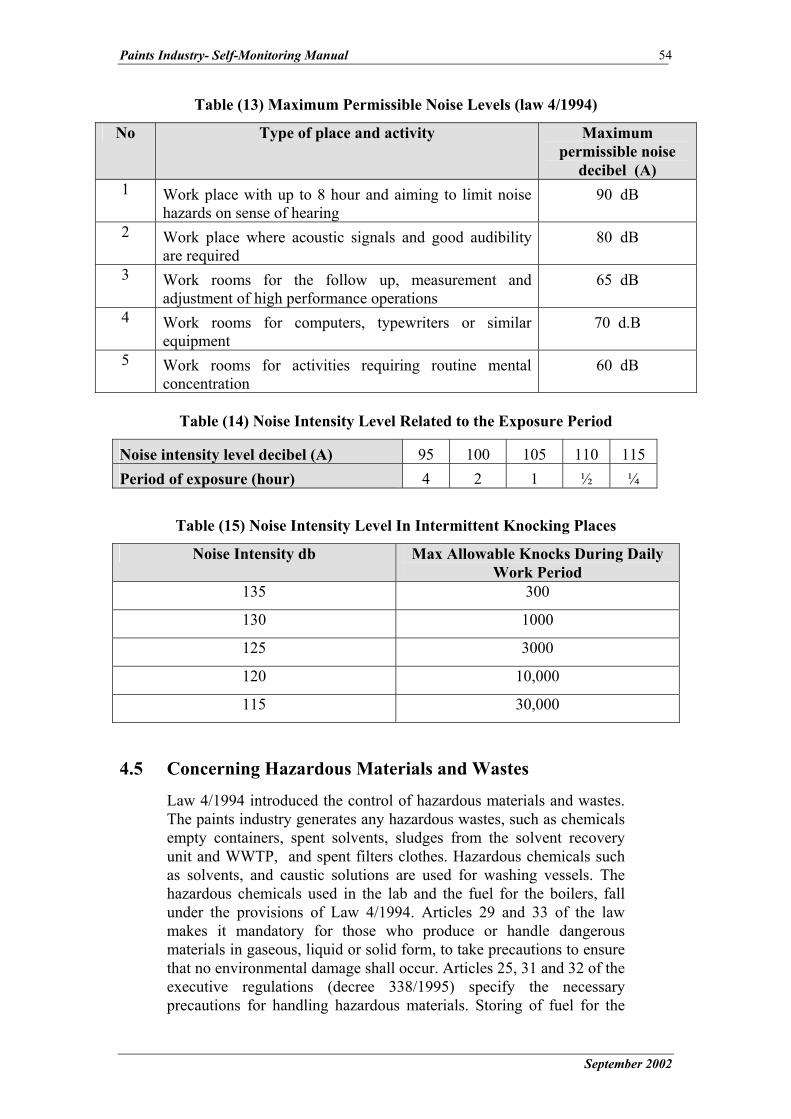
Paints Industry- Self-Monitoring Manual 54
Table (13) Maximum Permissible Noise Levels (law 4/1994)
No Type of place and activity Maximum permissible noise
decibel (A) 1 Work place with up to 8 hour and aiming to limit noise
hazards on sense of hearing 90 dB
2 Work place where acoustic signals and good audibility are required
80 dB
3 Work rooms for the follow up, measurement and adjustment of high performance operations
65 dB
4 Work rooms for computers, typewriters or similar equipment
70 d.B
5 Work rooms for activities requiring routine mental concentration
60 dB
Table (14) Noise Intensity Level Related to the Exposure Period
Noise intensity level decibel (A) 95 100 105 110 115 Period of exposure (hour) 4 2 1 ½ ¼
Table (15) Noise Intensity Level In Intermittent Knocking Places
Noise Intensity db Max Allowable Knocks During Daily Work Period
135 300
130 1000
125 3000
120 10,000
115 30,000
4.5 Concerning Hazardous Materials and Wastes
Law 4/1994 introduced the control of hazardous materials and wastes. The paints industry generates any hazardous wastes, such as chemicals empty containers, spent solvents, sludges from the solvent recovery unit and WWTP, and spent filters clothes. Hazardous chemicals such as solvents, and caustic solutions are used for washing vessels. The hazardous chemicals used in the lab and the fuel for the boilers, fall under the provisions of Law 4/1994. Articles 29 and 33 of the law makes it mandatory for those who produce or handle dangerous materials in gaseous, liquid or solid form, to take precautions to ensure that no environmental damage shall occur. Articles 25, 31 and 32 of the executive regulations (decree 338/1995) specify the necessary precautions for handling hazardous materials. Storing of fuel for the
September 2002

Paints Industry- Self-Monitoring Manual 55
boilers is covered by the Law 4 as hazardous material There is no explicit articles in Law 4/1994 or in decree 338/1995 (executive regulations), regarding holding a register for the hazardous materials; article 33 is concerned with hazardous wastes. However, keeping the register for the hazardous materials is implicit in article 25 of the executive regulations regarding the application for a license.
4.6 The Environmental Register Article 22 of Law 4/1994 states that the owner of the establishment shall keep a register showing the impact of the establishment activity on the environment. Article 17 and Annex 3 of the executive regulations specify the type of data recorded in the register. The emergency response plan and the hazardous materials register will also be part of the environmental register as stated in part 4.5.
September 2002
Paints Industry- Self-Monitoring Manual 56
5. Pollution Abatement Measures
This section deals with pollution abatement (preventions) in the three media air, water and soil. Three types of interventions will be considered: • In-plant modifications, which are changes that are performed in the plant
to reduce pollutant concentrations in streams through recovery of materials, segregation and/or integration of streams, reducing the flow rate of the wastewater streams that need further treatment to reduce the hold-up of the required WWTP.
• In-Process modifications, which are changes performed on the process such as the introduction of newer technology, substitution of a hazardous raw material, performing process optimization and control.
• End-of-pipe (EoP) measures, which involve treatment of the pollutant or its separation for further disposal. Whereas in-plant and in-process modifications usually have an economic return on investment, end-of-pipe measures will be performed for the sole purpose of compliance with the laws without economic.
Egyptian Environmental Laws do not require water and energy conservation measures. These measures have been considered in this manual since resource depletion and hence conservation is a worldwide-recognized environmental issue that could be implemented in Egypt in the near future. Water conservation measures can lead to higher concentrations of pollutants in the effluent streams. Both energy and water conservation measures will provide both financial and economic benefits. The term Cleaner Production (CP) refers to the same concepts of pollution reduction through in-process, in-plant and resource conservation, in contradistinction to end-of-pipe treatment. In many cases, the adoption of CP can eliminate the need for (EoP) treatment. The paints industry sector has a great potential for implementation of cleaner technology measures. Newly installed factories employing manpower above 100 has acquired relatively newer technologies, which need little in-process or in-plant modifications and are carrying out end-of-pipe treatment to meet the requirement of environmental laws. However, medium size enterprises as well as public sector companies badly need the 3 types of modifications. Small private enterprises are using primitive technologies. Mitigation measures in paints industry vary from in-process modification or recovery of solvents especially used in cleaning purpose. The following CP and EoP measures have been identified for the paints industry.
September 2002

Paints Industry- Self-Monitoring Manual 57
5.1 Air pollution Abatement Measures Flue gases Particulate matter in flue (exhaust) gases are due the ash
and heavy metal content of the fuel, low combustion temperature, low excess oxygen level, high flow rate of flue gases. Sulfur dioxide is due to the sulfur content of the fuel. Nitrogen oxides are formed when maximum combustion temperature and high excess oxygen. Carbon monoxide is formed when incomplete combustion occurs at low air to fuel ratio. The following measures can be adopted to minimize air pollution from flue (exhaust) gases: • Replace Mazot by solar or natural gas. Mazot is high in
sulfur content. • Regulate the fuel to air ratio for an optimum excess air
that ensures complete combustion of carbon monoxide to dioxide.
• Keep the combustion temperature at a moderate value to minimize particulate matter and nitrogen oxides formation.
5.2 Work Environment Pollution Abatement Measures VOCs emissions • Using VOCs control equipment such as; absorbents
(activated charcoal)/ biofilters on exhaust systems, water scrubbers should be implemented where necessary to achieve acceptable odor quality for nearby residents.
• During equipment cleaning process, solvents are released to air. This emissions could be minimized through closing off the immediate area around the axles, and also during operation for dissolvers and stirring equipment.
• Reduction of the use of open strainers (closed filling system).
• Covering of some containers could prevent the evaporation of solvents into air.
• Using mixing system by vibration rather than by stirring. The lake of a shaft holding a stirrer or a paddle means that the coating and solvent can be gently blended in a completely sealed vessel.
Particulates emissions • Using control equipment such as; Fabric filters should be
used to control particulates, from the process of charging pigments and fillers to the mixers, to below 50 milligrams per normal cubic meter (mg/Nm3) .
September 2002

Paints Industry- Self-Monitoring Manual 58
• Using of pigments in the form of pastes (premixed with resins) could be used instead of powdered pigments, to minimize particulate emissions during pigments charging and mixing processes.
• Using of closed equipment (mixers, vessels, mills, and tanks), to prevent the fugitive emissions (VOCs and particulates) of the raw materials in the work place.
5.3 Water Pollution Abatement Measures Equipment cleaning is considered the major source of pollution (liquid waste) in paints industry, hence reducing cleaning process is a useful way for pollution control. The following are some ways for liquid waste control:
In-plant modifications
• Elimination of unnecessary intermediate storage tanks, to minimize the amount of spent solvents generated from the cleaning of these tanks.
• Recycling from intermediate tank directly to the mill instead of using recycling tank, which lead to reducing the pollution (liquid waste) resulting from cleaning of the removed tank.
• Using high efficiency mills, which allows no need for recycling tank.
• Using centrifugal clarifier instead of filter press, to minimize losses (spills and leaks) occur during recycling of the filtrate to the intermediate tank. This will accordingly improve the quality of the wastewater.
• Using high-pressure jets for cleaning of tanks to enhance cleaning process, so reducing the amount of liquid wastes (solvents and caustic solutions) generated from cleaning process.
• Using manual skimmers for removing materials (paints) stuck to the tanks or container walls, before cleaning with solvent or caustic soda solution. This reduces the amount of liquid wastes used in cleaning, and the removed sticky materials could be recycled. Also mechanical skimmers can be used for tubes cleaning.
• Using Teflon-lined tanks to reduce materials sticking to their walls.
• Segregation of sewer systems for liquid wastes, generated from water- based paints production line and solvents-based production line, as this leads to more efficient recycling.
• In all cases, it is recommended the industrial liquid waste
September 2002

Paints Industry- Self-Monitoring Manual 59
discharged separately from domestic wastes as they differ in the pollutant nature.
• The installation of product-capture systems for filling machines can reduce product losses.
• Implementation of a quality control system such as HACCP (Hazard Analysis & Critical Control Point) is recommended to minimize waste.
In-process modifications
• In solvent-based paints production line;
- Random choice of the cleaning solvent could be replaced by an evaluation process, leading to a choice of one single solvent for all tanks and equipment cleaning.
- Schedule the production runs and modify the manufacturing procedures to minimize or eliminate the use of wash solvent.
- Reuse of cleaning solvents (spent solvents) many times, hence reducing the solvent consumption. After that, the solvent can be regenerated distilled and recycled for use in dilution or cleaning.
- Spent solvent could be recovered through distillation process, with about 90% solvent yield achievable from the still, and 10% sludge (removed paints). This sludge could be used in the production of a new paint product (a primer).
• In Water-based paints production line;
- Using washing liquids (caustic solutions), generated
from cleaning of mills and packing machines, in dilution of next batch.
- Scheduling operations to produce light color first then dark color paints to reduce the need for equipment cleaning. For white paints we can use intermediate tank to minimize the washing operations.
- In acrylic paints production line; Wash water generated from white acrylic paint manufacture could be reused in the next production run. Also the wastewater generated from the colored acrylics could also be stored for reuse in the next production run.
• In all production line;
- Appling quality assurance to reduce the possibility of
errors in paints preparation.
September 2002

Paints Industry- Self-Monitoring Manual 60
- Using counter current cleaning operations to reduce the amount of water or solvent used.
- Cleaning the tanks directly after production step to prevent materials sticking into walls. This means coordination between the production steps and cleaning operation.
- Reusing the rejected or off-spec. paints in new batches.
- Raw materials substitution; replacing the toxic pigments or dyes such as lead and chromium compounds by another non-toxic ones such as organic dyes or iron oxides.
- Controlling raw materials stock using computerized system, which facilitate the detection of any leak in the initial stages and indicate the sources of solid waste pollutants.
- Implementation of a control system involving pressure regulators on the steam lines, temperature controllers, flow controllers…
- Change from batch processes into continuous ones. - Modernize the equipment and upgrade the system. - Introduce new environmentally friendly products
(water-bases paints) to increase sales and minimize pollution.
- Improving raw materials handling, to prevent spills occur during manual unpacking of sacks and containers, and training of personnel to insure complete unpacking of containers.
- Integration (acidic and alkaline streams), and segregation of sewer lines of water and solvent based paints, to minimize treatment needs and ensure compliance with the environmental laws, can be an option for many factories. In some cases where there are several discharge points from the factory, mixing of the streams could lead to compliance. In other cases where treatment is imperative some streams could be segregated and discharged without violation. The remaining streams will require a treatment unit of small capacity.
End-of-pipe treatment
Because of the typically high content of suspended solids, TDS, TSS, O&G, COD, BOD, pH, and temp., in the paints industry waste-streams, end-of-pipe treatment frequently involves settling tanks and biological treatment. Pretreatment of effluents is required, it is normally followed by biological treatment.
1)Water-based paints
The wastewater generated from the water-based paints
September 2002

Paints Industry- Self-Monitoring Manual 61
production line is characterized by high values of BOD, COD, S.S, TSS, and TDS. Therefore, the end-of-pipe treatment could be as follows:
• Collection and flow equalization,
• Precipitation, using coagulants and flocculants (such as; lime, alum,…), in a homogenizing tank equipped with mixer, followed by a sedimentation tank to allow the time needed for reactions of chemicals to precipitate the dissolved solids.
• Decantation for removal of generated sludge, and drying of sludge using filter press.
• Filtration using activated carbon filter, to remove any entrained solids.
2) Resins production line
The wastewater generated from the resin production line, contain xylene and other organic compounds, this wastewater could be incinerated in the Dow-therm oil heaters instead of the fuel (Mazot or Solar).
3) Solvent-based paints
The spent solvent generated from equipment cleaning, in the solvent-based production line, could be recovered by vacuum distillation of the spent solvent, then condensation of solvent vapors. The solvent can be recycled for reuse in dilution or cleaning.
The sludge (precipitates) generated from the solvent recovery process could be dried and safely disposed into a landfill.
September 2002

Paints Industry- Self-Monitoring Manual 62
5.4 Abatement Measures for Solid Waste Pollution Scrap from workshops and garage
• Scrap metals are collected and sold.
Solid wastes from processes
Hazardous solid wastes sources includes chemicals sacs, packs, empty barrels, filters cartridge, materials spills, and precipitates from liquid wastes (caustic solutions and solvents) clarification by settling or distillation. The following are some ways for reducing solid waste pollution.
• Planning of packaging systems to avoid solid waste and/or to facilitate recycling of packages or packaging wastes.
• Separating hazardous solid waste from non-hazardous ones. This means separating sacs or packs containing hazardous materials such as lead or chromium compounds, from that free from such compounds.
• Gathering the empty sacs containing hazardous compounds in plastic bags, to prevent the spread of hazardous dust in the atmosphere.
• Using water-soluble sacs in making water-based paints can reduce the amount of waste sacs, as the whole sacs can be dissolved in water with their content. This could be done with pigments containing mercury compounds, or in making paints containing anti-fungi compounds, but this in turn affect the degree of shininess of paints.
• Using bag filters instead of cartridge filters, as the spent cartridge should be safely disposed into a landfill or burned, while the bag filters can be used many times. In addition, the bag filters can be washed by water or solvents, for recovery of the toxic material, and recycling of these materials with dilution liquids (solvents and thinners), then the filter bags can be dried and disposed safely.
• Using metallic screens for paints filtration process, which can be reused after cleaning with water or solvent.
• Handling of solid materials spills, by dry cleaning methods such as; vacuum cleaner, or by wet saw dust, to prevent spreading of these materials. Also the personnel should be trained to close the grills of the internal sewer system, when leaks or spills occur, to reduce the pollution load discharged to the sewer.
• Using automatic methods for unpacking of sacs, which prevent dust spreading in the workplace, also can reduce solid materials spills.
• Cleaning pollutants, from empty sacks and containers by solvent, should be done before storing or selling.
September 2002

Paints Industry- Self-Monitoring Manual 63
• Solid wastes, generated from spent solvent distillation or pretreatment of alkali solutions, used in cleaning and washing, could be safely disposed into a landfill or burned.
• Generally, recycling of incoming raw materials packaging like steel barrels, plastic barrels, nonce-use pallets, corrugated, paper bags, shrink plastic (PE) and transition to storage of raw materials in tanks. The reuse of these packages is a measure to reduce costs and amounts of waste.
Sludges from water and wastewater treatment
• Effluent treatment processes generate sludge. It can also be hazardous to health by absorbing pathogens that multiply in this favorable medium and toxins. It also contain traces of heavy metals. Raw sludge is saturated with water, should be de-watered and disposed of into landfills.
• Sludge also generated from water treatment unit due to addition of lime and chemicals to water.
5.5 Water and Energy Conservation
Water and sewer service costs have been rising, and these increases can cut into profits. Using water more efficiently can help counter these increases.
Water Conservation • Install water meters and monitor water use
• Use automatic shut-off nozzles and mark hand-operated valves so that open, close and directed-flow positions are easily identified.
• Use high-pressure, low-volume cleaning systems, such as CIP (clean in place) for washing equipment.
• Install liquid level controls with automatic pump stops where overflow is likely to occur.
• Recycle cooling water through cooling towers.
• Minimize spills on the floor minimizes floor washing.
• Repair leaks.
• Handle solid waste dry.
• Recycle steam condensate whenever economically viable.
Energy conservation measures
• Insulation of steam lines.
• Installation of steam traps.
• Repair or replace steam valves.
• Use the optimum excess air to perform efficient combustion
September 2002

Paints Industry- Self-Monitoring Manual
September 2002
64
process
• Install pressure regulators on steam lines.
• Return steam condensate.
• Improvement of power factor and electrical circuits.

Paints Industry- Self-Monitoring Manual 65
6. Self-Monitoring, Definition and Link to EMS The Self-Monitoring System (SMS) primarily relates to measurements of process inputs, releases and environmental pollution levels, as well as process conditions (operation controls) that are directly related to the monitored emissions. Self monitoring is necessary for the plant to improve its economic performance by identifying the sources of wastes in raw materials, water and energy, which represent the main source of pollution. Thus, the plant would be able to implement pollution prevention techniques that could reduce production costs and minimize compliance costs that lead to an improved economic and environmental performance of the plant.
In addition, self-monitoring may include reporting of the results to the competent authorities. Monitoring can be carried out by the industrial establishment or carried out on behalf and paid for by the industrial establishment. The information obtained from the sampling component of the monitoring system must be recorded and the results reported to the appropriate internal and external decision-makers.
6.1 Benefits of SM
In general, the benefits of self-monitoring results to the operators include: • To raise awareness about the process performance and efficiency. • To have them ready for inspection by authorities. • To provide inspectors with more reliable data to verify the single
unrepresentative samples and/or measurements. • To raise their awareness about impact of pollutants. • To implement corrective actions if non-compliance occurs. • To decide on raw materials, additives, fuels, and investment strategies. • To identify trends in plant performance and setting alarms. • To improve process efficiency.
These benefits refer to implementing an integrated environmental self-monitoring plan that comprises: • Emissions monitoring, which covers releases to air, wastewater, soil,
and solid and hazardous waste as well as regulated work conditions. • Monitoring of process parameters (operations controls) that are directly
related to the releases e.g. temperature, pressure and humidity. In addition, process conditions e.g. shutdowns, maintenance operations and spills need to be monitored, linked to emissions and reported.
6.2 Scope and Objectives of SM
As previously indicated, environmental self- monitoring comprises the monitoring of environmental releases (emissions) as well as the monitoring of process parameters (operation controls) that affect the environmental impact of the facility. The objectives of each type are separately detailed as follows:
September 2002

Paints Industry- Self-Monitoring Manual 66
a) Emissions Self-Monitoring The basic objective of self-monitoring is to provide information to ensure compliance with environmental regulations. As the inventory for hazardous materials and wastes is mandatory with procedures for handling and storage as regulated by law 4/1994, self-monitoring should assist in covering that area. The objectives of emission monitoring may go beyond monitoring compliance, to assist in improved environmental performance. In other words, monitoring of emissions at the process level is necessary to minimize emissions at the source through pollution abatement and prevention measures. While Egyptian regulations consider only concentration of the pollutants, self-monitoring may include pollution loads as well as the environmental impact on the receiving media. These data are required to assess the improvement of the environmental performance.
b) Process Self-Monitoring (Operation Control)
In most industrial facilities monitoring of process operations already exists. Some process operation controls should be monitored for improved environmental benefits. The main objectives of process self-monitoring (operation control) is:
Optimization of process operation an controlling the operating conditions
•
•
•
Maximization of profit through: - Product development and operation - Energy and water conservation - Minimization of losses Planned maintenance and repair as opposed to emergency maintenance and shutdown
6.3 SM and Environmental Management Systems (EMS)
Aside or the regulatory aspects, SM has shown to be a necessary tool for the plant to manage its releases, control its environmental impacts and improve its environmental performance. Such achievements represent the main objectives of the Environmental Management Systems (EMS), which in turn constitute a requirement for internal monitoring, checking and implementing the corrective actions. Also, EMS encourages the industrial plants to adopt Cleaner Production (CP) and Pollution Prevention measures as the main tools for continual improvement. This can be achieved by implementing a comprehensive and effective SM plan.
The following sections highlight the concept of EMS, link to SM and link between SM and cleaner production.
6.3.1 The Environmental Management System (EMS)
An Environmental Management System (EMS) is a framework that helps a company achieve its environmental goals through consistent control of its operations. The EMS itself does not dictate a level of environmental performance of the company; each company tailors its EMS to its specific business goals. Compliance with environmental laws and regulations has
September 2002

Paints Industry- Self-Monitoring Manual 67
become a major goal that has to be attained with minimum cost. This is the minimum level for environmental performance achieved through the EMS. In general, an EMS comprises five phases leading to continual improvement; commitment and policy, planning, implementation, evaluation and review. These phases will be herein explained within the context of the standard system “ISO 14000”, which is internationally recognized. With regard to Egypt, this system is being gradually implemented by the Egyptian Industry. The different stages of the EMS form a cycle (Fig. 29) that allows feedback of information and continuous improvement. This system includes the following elements:
1. Environmental policy. Top management commits to an environmental
policy that comprises, as a minimum, compliance with laws and regulations, pollution prevention and continual improvement.. The policy is the foundation of the EMS.
2. Planning: A company first identifies environmental aspects of its
activities. Environmental aspects are those items such as air pollutants or hazardous wastes that can have negative impacts on people and/or the environment. Once the relevant laws and regulations are determined, the company sets objectives and targets. An objective is an overall environmental goal (e.g. minimize use of chemical x). A target is a detailed, quantified requirement that arises from the objective (e.g. reduce use of chemical x by 25% by September 2002). The final part of the planning stage is devising an action plan for meeting the targets. This includes the schedule, and the clearly defined steps to meet the targets.
3. Implementation. This phase comprises the establishment of the
structure, assignments and responsibilities of the designated personnel. An important component is employee training and awareness for all employees. Other steps in the implementation stage include documentation, document control, implementing operation procedure, and setting up internal and external communication lines. In addition, an emergency and preparedness plan has to be developed.
4. Checking and Corrective Action. The company monitors its operations
activities to ensure that targets are being met. If not, the company takes corrective action and keeps records for the emissions and environmental performance. Internal audit is a key element to improve the system.
5. Management Review. Top management reviews the results of the
evaluation to see if the EMS is efficient and effective. Management determines whether the original environmental policy is consistent with company values. The plan is then revised to optimize the effectiveness of the EMS. The review stage creates a feedback of information necessary for continuous improvement.
September 2002
Environmental
Policy

Paints Industry- Self-Monitoring Manual 68
Planning
Management
Review Continuous
Improvement
Checking and
Corrective Action
Implementation
Fig. (29) Phases of EMS Cycle (ISO 14000) 6.3.2 Link between Self-Monitoring and (EMS)
As previously explained an EMS e.g. ISO 14000, comprises 5 stages; environmental policy, planning, implementation, checking and corrective actions. By analogy, the self-monitoring system (SMS) can be looked at using the same concept. Taking into consideration the definition, concept and principles of self-monitoring, as stated in the “Guide Book on Self Monitoring, the elements of SMS can be rearranged as follows:
Commitment: In general, an effective self-monitoring requires the management of the plant be committed to environmental compliance, as a minimum. However, this commitment will be an integrated part of the environmental policy in the EMS, if exists.
Planning: The planning of the SM is mainly based on objective (s) that have been set. For a basic SMS, the objective would be monitoring of regulated parameters to assist in achieving regulatory compliance e.g. end-of-pipe emissions and discharges. In an advanced SMS, the objectives may include monitoring of operation controls as well as emissions and wastes at the source, to help in implementing pollution prevention and cleaner production measures. In all cases, the objectives of self-monitoring should be in line with the objectives of EMS, if exists. In such case, the self-monitoring plan can be part of the EMS plan and includes:
Description of the regulatory limits for compliance • • Brief description of the actual situation of existing monitoring activities
(processes and parameters monitored): - Devices, and equipment used (type of devices, and frequency of
measurements) - Available resources.
September 2002

Paints Industry- Self-Monitoring Manual 69
Objectives and targets with time frame for implementation. • •
•
• • •
•
•
• •
Identification of parameters monitored, location of monitoring points and preparation of a self-monitoring schedule. Description of methods and procedures used for sampling, analyses, measurements, calculations, recording and data manipulation. Description of tasks and responsibilities. Training program. Information flow.
Implementation: The implementation of SM means that the tools and mechanisms for collecting the relevant data are functioning. On the other hand, the implementation phase in EMS means that the environmental performance of the plant is improved.
The implementation of SM results in large amount of data that need representation, interpretation and reporting in order to be useful as tools for decision making for corrective actions. The decision making requires knowledge about the status of:
Control and optimization of process performance (Process operating parameters) Emissions, effluents, solid waste, toxic and hazardous releases: concentration, load, handling procedures and transfers and comparison with environmental limit values (ELVs) Maintenance and repair. Percentage losses of raw materials, products and utilities.
Evaluation: Evaluation of the self-monitoring plan through regular auditing will allow its continuous improvement. Evaluation should include all aspects of the plan (training, meeting targets, reliability of data, efficiency of devices,…etc). On the other hand, the evaluation of the EMS involves checking and taking corrective actions of all system components, including the monitoring activities.
Review: On the basis of the evaluation of the monitoring plan, a review can be made of the monitoring objectives and targets. In case of EMS, the management review covers all the involved procedures, including monitoring activities. It is clear from the above explanation that self-monitoring is an integral part of any EMS. More specifically, self-monitoring is the tool for the evaluation function of an EMS. Figure (30) illustrates relationship and interaction among the main elements of EMS and SMS.
6.3.3 SM Link to Pollution Prevention and Cleaner Production With the growing understanding that escaping raw materials, chemicals and products constitute major pollution sources, industry has opted to implement
September 2002

Paints Industry- Self-Monitoring Manual 70
pollution prevention measures at the source. These measures include in-plant and in-process modifications as well as resource conservation (minimization of water and energy consumption). The implementation of these measures will decrease the end-of-pipe treatment cost. However, plant management will have to undertake a cost-benefit analysis to determine which measures are economically viable.
Self-monitoring is the tool that helps undertake these analyses by providing the necessary information about process inputs and outputs as well as the framework for performing the required tasks. The introduction of emission monitoring for the purpose of improved environmental performance through the application of cleaner technology widens the objectives of the plant EMS beyond compliance with relevant laws and should be met with economic incentives from the part of the competent authorities.
6.4 Regulatory Aspects
In developed industrial countries e.g. Europe, the competent authorities must approve the monitoring program, specify the standards and quality requirements for self-monitoring that are to be achieved by the operator, and ensure those possibilities for cheating and fraud are minimized. The competent authorities will receive self-monitoring reports periodically from the operator. These should provide summary information, following data reduction, in a format facilitating easy comparison with permit limits. Additionally, the competent authorities should inspect the operator’s self-monitoring records, including log sheets covering sampling, analysis, instrumental monitoring, and data-reduction calculations.
6.4.1 SM and Environmental Register
According to law 4/1994, industrial facilities (operators) are required to keep a record of their inputs, outputs and releases in the environmental register as stated by which implicitly requires some sort of self-monitoring. The Egyptian Environmental Affairs Agency (EEAA) is mandated to check the validity of the data in the Environmental Register. The responsibilities of the operator and the competent authority are not affected by who carries out the monitoring. It is the responsibility of the operator to comply with laws and regulations. On the other hand, the competent authorities (inspector) are responsible for assessing and ensuring the operator’s compliance. When combined with Self-monitoring, Environmental inspection competent authorities benefits from combination of inspection with SM through:
Utilizing the operator’s knowledge and experience of his process in planning and carrying out a monitoring program that can lead to improved control over releases to the environment.
•
• Self-monitoring will normally provide more information than may be obtained by periodic inspection by the competent authorities.
September 2002

Paints Industry- Self-Monitoring Manual 71
Providing a mechanism for educating the operator about the requirements for complying with relevant laws, regulations and permits and for increasing of management responsibility for compliance and the impact of process releases on the environment.
•
• • • •
6.4.2 SM and Inspection
Self-monitoring does not constitute self-regulation. SM provides additional information on which the competent authorities can judge whether an operator is complying with relevant legislation and conditions of permits. It does not change the duty of the competent authority to assess compliance by means of inspection and by performing its own monitoring or choose to rely on the operator’s monitoring data or a combination of both. The competent authority continues to be responsible for enforcement. As mentioned above, SM provides a wealth of information that can be utilized by the competent authority in reviewing standards and developing applicable environmental policies. However, the competent authority will have to check the reliability of the SM data. Thus, inspectors may be required to check the SMS plan, Quality Assurance and Quality Control (QA/QC) procedures, data handling and documentation. In this context, it is expected that inspectors may perform the following tasks:
Check the SM program. Check and verify the specified measurement standards. Check the reliability of the data (by carrying out independent monitoring). Inspect SM arrangements such as: - The positioning and serviceability of fixed instrumentation and check
representative ness of the monitoring. - Records confirming the maintenance and calibration of instrumentation
and sampling equipment. - Manual sampling and analytical procedures.
This expected interaction will help both partners i.e. the operator and the competent authority in achieving their objectives in terms of reliability of emissions data and environmental performance.
September 2002

Paints Industry- Self-Monitoring Manual 72
Fig. (30) Relationship between EMS and SMS
Review Objective & SM Plan
Evaluation of SMS
Implementation • Environmental Monitoring • Operation controls • Development of Person skills• Internal & External Reporting • Q/A & Q/C of data • Documentation
Planning • Define Scope • Identify Monitored Parameter • Establish Monitoring Program
Policy State mentSMS Policy Statement
Review of EMS: policy, objectives, program and
procedures
Evaluation of EMS
Implementation • Structure & Responsibilities • Training awareness • Documentation • Documents control • Operations control • Communications • Emergency response
Planning • Environmental Aspects • Regulatory Requirements • Objectives and Targets • Environmental program
EMS Policy Statement
September 2002

Paints Industry- Self-Monitoring Manual 73
7. Planning of SM Planning for SM starts by setting the objectives. It should be clear that a number of process control parameters needs to be monitored, along with environmental monitoring. For the purpose of this manual environmental self-monitoring will be considered in addition to monitoring of process parameters that are related to emissions (operation controls). Compliance monitoring requires measurements, analysis and data on end-of-pipe releases, whereas operation controls target the production units that offer pollution prevention opportunities. The environmental manager with the help of various sector managers should carry out the planning activities.
With reference to ”Guidebook for Industrial Self-Monitoring”, the main elements of the Self-Monitoring Plan, that describes the SMS, include:
Objectives and results required from the self-monitoring system • • • •
• • •
•
Organization and share of responsibilities and tasks Planning activities and design of an implementation schedule Definition of the parameters and relevant monitored indicators to reach the objectives Design of an appropriate measurement and sampling program Data processing and reporting procedures System for follow-up of decisions, actions and monitoring development Quality assurance and control
With reference to the Guidebook for Industrial Self-Monitoring the objective of the SMS can be limited to provide the data required for the Environmental Register which is mandated by the Environmental Law, e.g. total inputs, outputs and emissions on the plant level. This objective ”compliance with regulations” requires the ”Basic Self-Monitoring System” which comprises the minimum requirements. In these cases where self-monitoring is not mandatory, operator can build a ”basic” self-monitoring system that focuses on the regulated emissions, as a minimum. Then, the system can be gradually upgraded, ”continual improvement” through internal auditing of all system components. Other objectives, e.g. waste minimization, pollution prevention and improved environmental performance require upgraded SMS that includes monitoring of inputs, outputs and releases on the level of operations and detailed processes. In all cases, the established SMS should be gradually improved and upgraded, considering the plant financial and economic constrains. The following sections are detailing the stepwise activities that are needed to develop a viable realistic, and applicable plan for a self-monitoring system. Fig. (31) presents the various steps for the preparation and implementation of a self-monitoring plan.
September 2002

Paints Industry- Self-Monitoring Manual 74
Pre-Monitoring
Survey
Review and Modify the SM Plan
Define Monitoring Schedules
Select Monitoring Location
Identify standard Methods for Sampling, Analysis and Measuring
Continual Operation
Execute Self-Monitoring Plan
Write Self-Monitoring
Plan
Select Parameter to be
Monitored
Process and Existing
Monitoring Analysis
Consultants Laboratory
Contract Outside Assistance
Selection of In-House Responsible
Person(S)
Objectives Management Awareness and Commitment
- Measurements - Samplings - Analysis - Data collection - Data evaluation - Data reporting
Fig. (31) Steps for the Preparation and Implementation of a Self-Monitoring Plan
September 2002

Paints Industry- Self-Monitoring Manual 75
7.1 Assessment of Existing Monitoring Capacity Assessment of existing monitoring capacity includes the following aspects:
Management system: presence of an EMS, existing system for data collection and reporting.
•
• •
•
Human resources: available personnel, level of training; motivation. Technical resources: monitoring equipment and laboratory, status of equipment Financial resources: available budget for self-monitoring activities.
Table (17) presents an example of a checklist for existing self-monitoring activities.
Table (17) Example for Assessing the Status of Existing Monitoring
Activity Monitored
activity Location Parameter Associated
tasks Person in
charge Time schedule
Recording flow on flow meter
Operator X
Inspect meter Supplier Calibrate Operator Y
Wastewater Final discharge
Flow rate
Data analysis, representation
Lab staff
Daily
Grab sample Lab technician Sample preservation
Lab staff
Analysis Lab staff
BOD, COD, TDS, TSS, S.S, O&G, pH, color, heavy metals
Review results and reporting
Chief of Lab
Once a week
7.2 Identification of Key Parameters
The identification of key monitoring parameters requires an understanding of the manufacturing processes and the operation of the various units. The brief description provided in section 2 and the relevant tables can help identify some of these parameters. However, a pre-monitoring audit is necessary to determine sampling and measurement locations and schedules needed to design the self-monitoring plan. Priority should be given to parameters that determine compliance with environmental laws. A table describing the monitoring activities can be prepared for process and compliance monitoring. The exact positions of the monitoring points within the production line have to be determined on a case by case basis by production experts, according to the following criteria (SM Guidebook, EPAP 1999):
September 2002

Paints Industry- Self-Monitoring Manual 76
Representativeness of the monitoring point. • • •
Criticality of the monitoring point Accessibility of the monitoring points
The choice of the parameters is determined by the type of production, the legal requirements, the nature of the pollutant and its load, and the importance of the parameter for decision making. For each of the proposed parameters the trends and variations should be monitored in addition to the value of the parameter at a given time.
7.3 General Data Required When assessing the performance of the operation and its impacts on the environment, some basic information is needed to put the monitoring data into the context of interpretation. Such information is about: • Identification : Name, address, plant location, name of owner, manager
and head of environmental department. • Inputs name, type and amount: Raw materials, chemicals, fuels, water,
steam, electricity. • Technology: Description of process, applied technology, operating
conditions (temperature, pressure, …etc.), maximum capacity, operating capacity during monitoring.
• Outputs name, type and rate: Products, by-products. • Abatement techniques: Air pollution prevention, wastewater treatment,
solid and hazardous waste management, noise abatement. • Emissions and their sources: receiving media, pollutant type,
concentration and load, pollutant impact. • Existing EMS system, analyses and measurement results, relevant
environmental laws and allowable pollutant levels. • Assessment of legislative and regulatory requirements.
7.4 Data collection, Manipulation and Reporting Data collection and analysis should be carefully planned according to the following principles: • Base the analysis on trends over a long period to take into consideration
the shock loads that characterize the paints industry. • Determine the causes and degree of variability of a parameter. A
dramatic change of a low-variability parameter may be interpreted as a sign of anomaly of the process. This will require an investigation to find the potential source of the problem and take the right corrective action.
• Study the correlation between different parameters. The cause of variation for a highly variable parameter may be correlated to another parameter.
A considerable amount of data may be generated by the operator carrying out self-monitoring especially when continuous monitoring instrumentation are
September 2002

Paints Industry- Self-Monitoring Manual 77
used. Data reduction is necessary to calculate time-averaged means, percentile values and the like. When compliance data are recorded in the environmental register the relevant calculations for data reduction should be specified. Measured values are used to form half-hourly mean values for each successive half-hour to generate frequency distribution. For each calendar day a daily mean value, related to the daily operating time, is calculated from the half-hourly mean values and kept on file. Measurement results should be kept in the environmental register for at least 10 years (Article 22 of law 4/1994 and 17 of its executive regulations). An annual report is prepared on the outcome of the measurements including information on: • Measurement planning • The outcome of each individual measure • Measurement methods used • Operating conditions that are important for the assessment of individual
data and measurement results.
7.5 Criteria for Selecting Monitoring Method The choice of monitoring method used to determine the value of the parameter depends on the specific features of the process, the emission sources, the physical state and properties of the sample and the nature of emissions from the operation. The latter can be classified as:
End-of-pipe Normal emissions (point source)
Occur during normal operation and normal process and abatement technique conditions. These emissions are generated from point sources (e.g. flue gases from stacks (boilers, and Dow-therm oil heaters), process vents (reactors), boilers blow-down, softeners back-wash, spent solvents (equipment cleaning), …etc.
Diffuse and fugitive emissions
These are emissions from a certain process but from scattered points such as emissions from ventilation ducts, barrels, pumps, valves, compressors, scattered small storage’s. The diffuse emissions are calculated/estimated by monitoring the source periodically and assessing the long term emission from the measurement results or by mass balance calculations.
Exceptional emissions (start-up, shut-down, maintenance, malfunction)
Exceptional emissions refer to varying input or process conditions, start-ups, shut-downs, by-pass of a process for malfunctioning and accidental causes, and maintenance operations.
The emissions can differ from those of normal operation in their volume and/or concentration. These
September 2002

Paints Industry- Self-Monitoring Manual 78
emissions can be multiple compared to normal emissions. It can be impossible to measure the concentration or volume of the exceptional emissions as the measuring device is calibrated according to the normal operating conditions. Estimation techniques should then be performed.
There are four basic methods that may be used to develop estimates: • Direct or indirect measurement • Mass balance • Emission factors • Engineering calculations
7.5.1 Direct or Indirect Measurement a) Direct measurements: Using monitoring data or direct measurements is usually the best method for developing chemical release and/or other waste-management activity quality estimates. Data may have also been collected for the facility through an occupational health and safety assessment. If only a small number of direct measurement data is available or if the monitoring data are not based on a representative sample, another estimation method should be used to give a more accurate result.
Note : Treatment Efficiencies Supplier data on treatment efficiencies often represent ideal operating conditions, should be adjusted to account for downtime and process upsets during the year that would result in lower efficiencies. Efficiencies reported by supplier are often general and may not apply to specific chemicals. For example, an incinerator or flare may be 99.99% efficient in destroying organic chemicals, but will have a 0% efficiency in destroying heavy metals.
For successful measurements the following considerations should be satisfied: • The frequency of measurement and sampling must cover temporal
variations of the process and specifically the period during which harm occurs.
• Continuous monitoring is suitable for large emission sources, such as stacks and wastewater canals except in cases where high temperature or corrosive substances are involved. At smaller sites the cost of continuous monitoring is weighed against the value of the monitoring results and the possibility of obtaining representative results from periodic measurements.
• Utilization rate (percentage of continuous monitoring time to total operation time) should be known when performing continuous monitoring.
• The process conditions must be specified when monitoring takes place (e.g. start-up, shut-down, production rate, operating production lines, failure of abatement equipment).
September 2002

Paints Industry- Self-Monitoring Manual 79
b) Indirect measurements: These are performed through surrogate parameters. Surrogate parameters are variables that can be closely related to conventional direct measurements of pollutant releases or impacts and which may therefore be monitored and used instead of direct values for some practical purposes. Surrogates are commonly used in operation control as they give an early warning of possible abnormal conditions or emissions. Surrogates may provide a relative measurement rather than an absolute value and may only be valid for a restricted range of process conditions. On the other hand, surrogates can provide more continuous information than direct measurements. It is also often cost-effective as it allows more discharge positions to be monitored for the same resources. Table (18) summarizes the advantages and disadvantages of surrogate parameters. A surrogate can be used for compliance monitoring purposes if all the following conditions are met: • It is closely and consistently related to a required direct value (e.g. fuel
sulfur vs. directly measured SO2, relationship between opacity and particulate concentration, condenser temperature and VOCs emissions).
• It is regularly calibrated against the direct value. • It is cheaper or easier to monitor than the direct value, or gives more
frequent information • Its value can be related to specific limits • The process conditions where it is measured matches the conditions
where direct measurements are required. • Any extra uncertainty due to use of surrogate is not significant for
regulatory decisions or process management.
Table (18) The Advantages and Disadvantages of Surrogate Parameters
Advantages Disadvantages Cost savings. More continuous information e.g. continuous opacity vs. periodic dust sampling. Allow more positions form discharge monitoring. Sometimes more accurate e.g. fuel sulfur vs. SO2 . Give early warning of possible abnormal emissions e.g. combustion temperature warns for increase in dioxin emissions. Causes disruption to process operation. May combine information from several direct measurements e.g. temperature indicates energy efficiency, emissions and process control.
Need cost for calibration against direct values. May provide relative measurement rather than an absolute value. May not valid only for a restricted range of process conditions. May not command as much public confidence as direct values. Sometimes less accurate.
• •
•
•
•
•
•
•
•
•
•
•
Environics September 2002

Paints Industry- Self-Monitoring Manual 80
7.5.2 Mass Balance A mass balance involves determining the amount of chemical entering and leaving an operation. The mass balance is written as follows:
Input + Generation = Output + Consumption
• Input refers to the materials (chemicals) entering an operation. For
example, caustics added to equipment wash water would be considered an input to the wastewater treatment operation.
• Generation identifies those chemicals that are created during an operation.
For example, when nitrogen sources are used in biological wastewater treatment systems, additional ammonia may be produced (generated).
• Output means any stream by which the chemical leaves the operation.
Output may include on-site releases and other waste management activities to the environment, storage, or disposal ; or the amount of chemical that leaves with the final products. In paints manufacturing operations, for example, pigments in the paint may leave the operation as product losses and leakages, on the ground that could be sent to sewer, and in the cleaning solvents/ solutions (waste effleuent), or emissions in the work environment that could be collected into the filters and sent for disposal.
• Consumption refers to the amount of chemical that is converted to
another substance during the operation (i.e., reacted). For example, caustic soda would be consumed by a neutralization process during wastewater treatment.
The mass balance technique may be used for manufactured, processed, or otherwise used substances. It is typically most useful for chemical that do not become part of the final product, such as catalysts, cleaning solvents and alkalis. For large inputs and outputs, a mass balance may not be the best estimation method, because slight uncertainties in mass calculations can yield significant errors in the release and other waste management estimates. Therefore mass balance is not accurate enough method for estimating process and combustion emissions.
Material balance calculations are also used to examine the effects of emission reduction on the material balances of the plant. A material balance calculation gives an impression of the magnitude of the emission of a specific substance but can not show accurate emission amounts, nor their division between emissions into the air, water discharges, or solid wastes. Material balance calculations are often based on evaluated process flows and concentrations. Calculating a reliable average emission level for a factory means long term monitoring of the processes and statistical examination.
Environics September 2002

Paints Industry- Self-Monitoring Manual 81
7.5.3 Emission Factors An emission factor is a representative value that attempts to relate the quantity of an emission released with an associated activity. These factors are usually expressed as the weight of emission released divided by a unit weight, volume, distance, or duration of the activity (e.g. kg of emission released per kg of product). Emission factors have been developed for many different industries and activities. Emission factors depend on the technology used, raw materials , and pollution control devices. Emission factors can be obtained from industrial database e.g. DSS (available at EEAA).
Note Sources of information on emission factors should be carefully evaluated and the conditions for using the factors reviewed to determine if it is applicable to the situation at the facility. 7.5.4 Engineering Calculations
Engineering calculations are assumptions and/or judgments used to estimate quantities of listed chemicals released or managed. The quantities are estimated by using physical and chemical properties and relationships (e.g. Raoult’s law, Ideal gas law) or by modifying an emission factor to reflect the chemical properties of the toxic chemical in question. Engineering calculations rely on the process parameters; thorough knowledge of the operation is required to complete these calculations.
Engineering calculations can also include computer models. Several computer models are available for estimating emissions from landfills, wastewater treatment, water treatment and other processes.
Environics September 2002

Paints Industry- Self-Monitoring Manual 82
8. Monitoring of Raw Materials, Utilities and Products Inputs and outputs data is needed for estimating the nature and amount of the releases when assessing the reliability of the monitoring results. The input data includes the quantity and quality of raw materials, chemicals, fuel and water used.
8.1 Raw Materials and Chemicals The amount of raw materials received per day and cost/kg are important monitoring parameters. The quality of raw materials is assessed by chemical tests before acceptance. Some factories store the rejected raw materials until it sent back to the contractor (Table 19).
Table (19) Monitoring of Raw Materials and Chemicals
Parameter Monitoring Method Indication Amount of raw materials and chemicals (pigments, fillers, binders, solvents, driers, plasticizers, …etc.) necessary to produce 1 ton of product.
Weighting, measuring, calculation and material balance, book keeping and recording.
Rationality in the use of raw materials.
Quantity of rejected raw materials per unit of product.
Weighting, measuring, calculation and material balance, book keeping and recording.
- Losses. - process efficiency. - storing or handling problems.
Quality of raw material Specific criteria (Analysis): •
•
•
Pigments − Assay (metal content − Oil absorption − Fineness (grindness) − Color (full, reduced) − Moisture content − pH − Specific gravity − Coverage
Fillers (extenders) − Oil absorption − Fineness (grindness) − Color (full, reduced)
Resins/polymers/oils − Non-volatile % − Acid value − Iodine number − Viscosity − Color
- Avoiding possible production problems due to bad quality. - Maximize productivity. - Minimize the quantity of refuse products. - Identifying raw materials harmful for the environment if discharged with the wastes generated.
Environics September 2002

Paints Industry- Self-Monitoring Manual 83
Table (19) Monitoring of Raw Materials and Chemicals (continue) Parameter Monitoring Method Indication
•
•
•
•
•
Emulsions − Non-volatile % − pH − Viscosity
Solvent − Specs distillation range − Specific gravity − Boiling point − Refractive index − Color
Dryers − Metal contents − Evaluation of drying speed (non-volatile percent) − Specific gravity
Dispersing agents − Wet ability − Specific gravity − Refractive index − Evaluation of drying speed (non-volatile %)
Antifoaming agents − Specific gravity − Evaluation of drying speed (non-volatile percent)
Cost of the raw material necessary to produce 1 ton of product.
Book keeping Assess economical burden due to non rational use of raw material and possible avoidable extra costs.
Proportion of the cost of raw material in the cost of product & its variation
Book keeping Assess economical burden due to non rational use of raw material.
Environics September 2002

Paints Industry- Self-Monitoring Manual 84
8.2 Utilities Monitoring of energy consumption takes into account the different forms of energy. It is important to note that heat and electricity cannot be summed up, as they are not commensurate. The energy efficiencies of heat and electricity should therefore be dealt with separately (Table 20).
Table (20) Monitoring of Utilities
Parameters Monitoring Method Indication Consumption measurements and book keeping
Energy consumption per ton produced • Electricity • Fuel
Fuel flow (gauge accumulator)
Energy use efficiency
Repartition between the different types of energy used (steam, heating oil).
Recording and book keeping
Energy use efficiency
Water consumption per ton of product and its variability.
Flow measurements, book keeping and recording
Water use efficiency, most of the discharge related parameters are calculated
Quality of the utilities
Steam : Pressure level Degree of saturation.
Wash water : Pressure, temperature
According to the specific criteria
Impact on the smooth running and efficiency of processes
Boiler water: quality
Electric power : Voltage level
Environics September 2002

Paints Industry- Self-Monitoring Manual 85
8.3 Products The most important parameters that need monitoring are presented in table (21)
Table (21) Monitoring of Products
Parameters Monitoring Method Indication Amount produced • Final product (water-based paints, solvent-based paints, resins, varnishes, and inks)
Recording and book keeping: •
•
Paints − Viscosity − Density − Grindness − Gloss − Drying time − Coverage − Mechanical hardness − Bending − Impact on metals − Cross-cut adhesion − Film application − Color
Resins − Non-volatile % − Color − Viscosity − Acid value − Iodine value − Specific gravity − Drying time − Gloss − Hardness − Flexibility − Packaging stability
Production statistics
Rejects as a percentage of the total production, per unit of time • Final product ( out of
specification, expired date)
• In- line rejects
Recording (quality control)
Production quality, avoidable expenses
Environics September 2002

Paints Industry- Self-Monitoring Manual 86
9. Operation Control Processes should be operated at the optimum operating conditions to ensure disturbance-free operation, safety, highest yield and productivity as well as product quality. Operation control deals with the control and monitoring of key parameters that affect environmental performance. These key parameters are monitored to minimize losses and therefore pollution. Planned maintenance (regular) is important to facilitate disturbance-free operation as well as minimize pollution and improve environmental performance.
9.1 Monitoring Process Parameters
Tables (22) a and b present the major processes in each production line and utility respectively, and the parameters that should be monitored to minimize losses, maximizing productivity and predict maintenance and repair needs.
Environics September 2002

Paints Industry- Self Monitoring manual 87
Frequency/Duration
Person Responsible
Indication Method usedParameter monitored
Affected media
Cause of pollution
Major Pollution Process
Water- Based paints Production Line - Out-of-spec. product (table 21) - Pollution in work place
- Speed (rpm) meter - Quality control analysis for product
- Mixer speed - Properties of raw materials (table 19)
Work environment
Particulates and VOCs emissions
Once/ batch
- Spills or leaks - Lower productivity - End-of- pipe effluent characteristics
- Level indicator - Flowmeter
Liquid level in the mixer
Wastewater Spills
Mixing
Once/ batch - Product quality (table 21) - Pollution in work place
- Speed (rpm) meter - Quality control analysis for product
- Mill speed - Properties of raw materials (table 19)
Work environment
Particulates and VOCs emissions
Grinding (Rollers and ball mills)
- Spills or leaks - Lower productivity - End-of- pipe effluent characteristics
- level indicator Liquid level in the ball mills
Wastewater Spills (ball mill)
Paint quality - Vernier - Speed meter (rpm) - Flowmeter and thermocouple
- Spacing between rollers - Mill speed - Temperature and flow rate of cooling water
Hazardous solid waste
Reject paint
Table (22)a Operation Control for Production Lines
Environics September 2002

Paints Industry- Self Monitoring manual 88
Once/ batch - Product quality (table 21) - Pollution in work place
- Speed (rpm) meter - Quality control analysis for product
- Mixer speed - Properties of raw materials (table 19)
Work environment
VOCs emissions Finishing (Mixing)
- Spills or leaks - Lower productivity - End-of- pipe effluent characteristics
- Level indicator - Flowmeter
Liquid level in the mixer
Wastewater Spills
Once/ batch - Product flow rate (lower productivity)
Pressure gauge Pressure drop Land Filter sludgeFiltration
Once/ batch - Spills - Lower productivity - End-of- pipe effluent characteristics
Mass balance calculation Spills amount Wastewater Paints lossesPackaging
Environics September 2002

Paints Industry- Self Monitoring manual 89
Solvent- Based paints Production Line - Out-of-spec. product (table 21) - Pollution in work place
- Speed (rpm) meter - Quality control analysis for product
- Mixer speed - Properties of raw materials (table 19)
Work environment
Particulates and VOCs emissions
Once/ batch
- Spills or leaks - Lower productivity - End-of- pipe effluent characteristics
- Level indicator - Flowmeter
Liquid level in the mixer
Wastewater Spills
Mixing
Once/ batch - Product quality (table 21) - Pollution in work place
- Speed (rpm) meter - Quality control analysis for product
- Mill speed - Properties of raw materials (table 19)
Work environment
Particulates and VOCs emissions
Grinding (Rollers and ball mills)
- Spills or leaks - Lower productivity - End-of- pipe effluent characteristics
- level indicator Liquid level in the ball mills
Wastewater Spills (ball mill)
Paint quality - Vernier - Speed meter (rpm) - Flowmeter and thermocouple
- Spacing between rollers - Mill speed - Temperature and flow rate of cooling water
Hazardous solid waste
Reject paint
Once/ batch - Product quality (table 21) - Pollution in work place
- Speed (rpm) meter - Quality control analysis for product
- Mixer speed - Properties of raw materials (table 19)
Work environment
VOCs emissions Finishing (Mixing)
Environics September 2002

Paints Industry- Self Monitoring manual 90
Once/ batch - Spills or leaks - Lower productivity - End-of- pipe effluent characteristics
- Level indicator - Flowmeter
Liquid level in the mixer
Wastewater Spills Finishing (Mixing)
Once/ batch - Product flow rate (lower productivity)
Pressure gauge Pressure drop Land Filter sludgeFiltration
Once/ batch - Spills - Lower productivity - End-of- pipe effluent characteristics
Mass balance calculation Spills amount Wastewater Paints lossesPackaging
Environics September 2002

Paints Industry- Self Monitoring manual 91
Printing Inks Production Line - Out-of-spec. product (table 21) - Pollution in work place
- Speed (rpm) meter - Quality control analysis for product
- Mixer speed - Properties of raw materials (table 19)
Work environment
Particulates and VOCs emissions
Once/ batch
- Spills or leaks - Lower productivity - End-of- pipe effluent characteristics
- Level indicator - Flowmeter
Liquid level in the mixer
Wastewater Spills
Mixing
Once/ batch - Product quality (table 21) - Pollution in work place
- Speed (rpm) meter - Quality control analysis for product
- Mill speed - Properties of raw materials (table 19)
Work environment
Particulates and VOCs emissions
Grinding (Rollers and ball mills)
- Spills or leaks - Lower productivity - End-of- pipe effluent characteristics
- level indicator Liquid level in the ball mills
Wastewater Spills (ball mill)
Inks quality - Vernier - Speed meter (rpm) - Flowmeter and thermocouple
- Spacing between rollers - Mill speed - Temperature and flow rate of cooling water
Hazardous solid waste
Reject inks
Once/ batch - Product quality (table 21) - Pollution in work place
- Speed (rpm) meter - Quality control analysis for product
- Mixer speed - Properties of raw materials (table 19)
Work environment
VOCs emissions Finishing (Mixing)
Environics September 2002
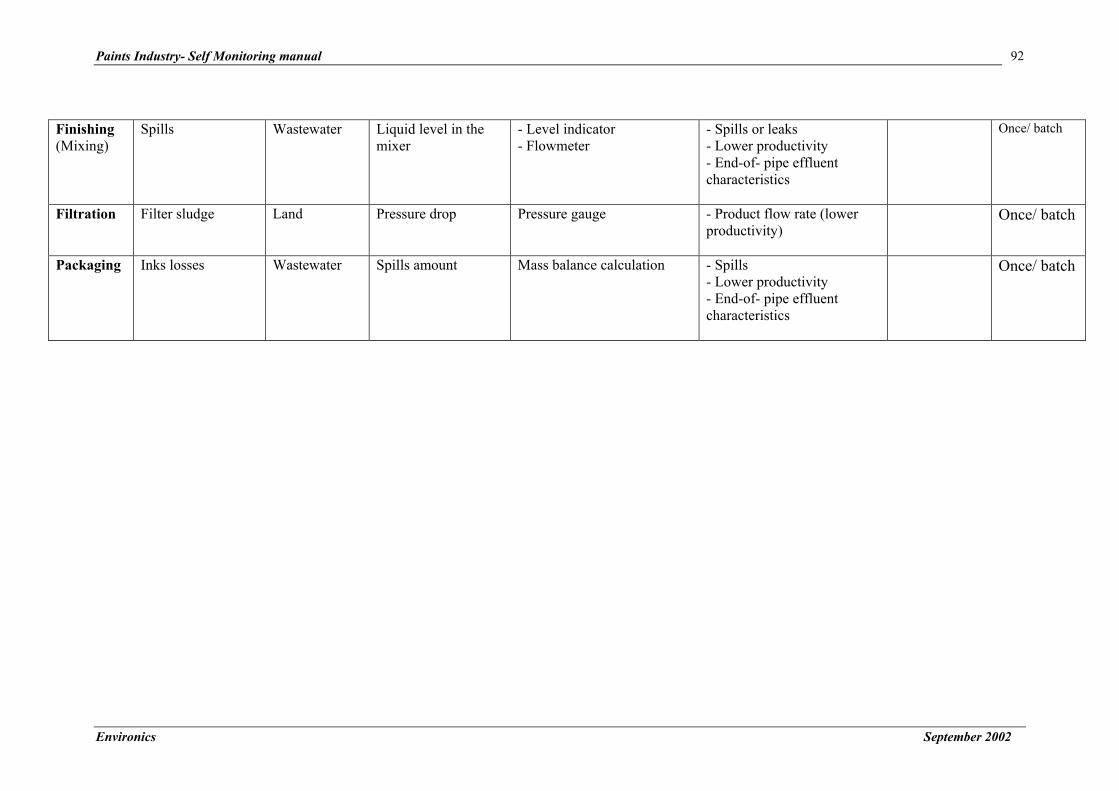
Paints Industry- Self Monitoring manual 92
Once/ batch - Spills or leaks - Lower productivity - End-of- pipe effluent characteristics
- Level indicator - Flowmeter
Liquid level in the mixer
Wastewater Spills Finishing (Mixing)
Once/ batch - Product flow rate (lower productivity)
Pressure gauge Pressure drop Land Filter sludgeFiltration
Once/ batch - Spills - Lower productivity - End-of- pipe effluent characteristics
Mass balance calculation Spills amount Wastewater Inks lossesPackaging
Environics September 2002

Paints Industry- Self Monitoring manual 93
Varnishes Production Line
- Out-of-spec. product (table 21) - Pollution in work place
- Speed (rpm) meter - Quality control analysis for product
- Mixer speed - Properties of raw materials (table 19)
Work environment
Particulates and VOCs emissions
Once/ batch
- Spills or leaks - Lower productivity - End-of- pipe effluent characteristics
- Level indicator - Flowmeter
Liquid level in the mixer
Wastewater Spills
Mixing
Once/ batch - Product quality (table 21) - Pollution in work place
- Speed (rpm) meter - Quality control analysis for product
- Mixer speed - Properties of raw materials (table 19)
Work environment
VOCs emissions Finishing (Mixing)
Once/ batch - Spills or leaks - Lower productivity - End-of- pipe effluent characteristics
- Level indicator - Flowmeter
Liquid level in the mixer
Wastewater Spills
Once/ batch - Product flow rate (lower productivity)
Pressure gauge Pressure drop Land Filter sludgeFiltration
Once/ batch - Spills - Lower productivity - End-of- pipe effluent characteristics
Mass balance calculation Spills amount Wastewater Varnishes lossesPackaging
Environics September 2002

Paints Industry- Self Monitoring manual 94
Alkyd Resin Production Line
Once/ batch - Lower productivity - Product quality (table 21)
- Thermocouple - Manometer - Clock - Amount of solvent
- Temperature- Pressure - Time of reaction - Amount of solvent needed for the removal of reaction water
Reaction completion
Reaction
Once/ batch - Xylene concentration in wastewater from gas/ liquid separator - Higher solvent consumption (lower amount of solvent recovered) - End-of-pipe effluent characteristics
- Analysis- Weight/ volume measurements
- Concentration of xylene in water/ xylene mixture- Amount of make-up solvent used
WastewaterEfficiency of separation
Xylene recovery
Environics September 2002

Paints Industry- Self Monitoring manual
Environics September 2002
95
For All Units Once/ day End-of-pipe effluent
characteristics
Calculations and book keeping
Amounts Wastewater contain hazardous materials
- Spent caustic solutions - Spent solvents
Equipment cleaning and floor washing between batches
LandEmpty containers contaminated with significant amounts of chemicals
Work envronment
Feeding of solid chemicals
Once/ day - Particulates or spills- Empty containers contaminated with significant amounts of chemicals
Mass balance calculationsEfficiency of feeding
WastewaterFeeding of liquid chemicals
Desacking and
emptying of
chemicals containers

Paints Industry- Self-Monitoring Manual 96
Table (22)b Operation Control of Utilities Service units Cause of pollution Affected
media Parameter monitored
Indication Method used Person Responsible
Frequency /Duration
Boilers Steam Air - Temperature
- Pressure level - Degree of saturation - Flow rate
Steam leaks Steam quality
- Thermocouple - Pressure gauge - Flowmeter
On-line
Boiler flue gas Air - Fuel to air ratio - Excess air - Combustion efficiency
Incomplete combustion (CO % in flue gases)
- Flowmeters - Gas analyzer - Calculations
Boiler fuel Air - Type - Flow rate - Consumption rate - Sulfur content
SOx % in flue gas - Flowmeter - Inventory - Chemical analysis
Once a month
Water treatment chemicals
Water - Type - Consumption rate
Losses Inventory Once a month
Lube oils Water - Type - Consumption rate
Losses Inventory
Boiler Feed Water Water - Flow rate - Chemical quality (TDS, oxygen content)
- Blow-down and carry over - Scale formation
- Flowmeter - Chemical analysis and conductivity meter
Softener back wash Water Flow rate Zeolite regeneration efficiency
Flowmeter on wash water
Once a day
Boiler blow-down Water Flow rate Feed water quality Flowmeter Dow-therm Oil Heater Heater flue gas Air Fuel to air ratio Incomplete combustion
(CO % in flue gases) Gas analyzer Every 6 months
September 2002

Paints Industry- Self-Monitoring Manual 97
heater fuel (mazot/ solar)
Air Sulfur content SOx in flue gas Gas analyzer
Cooling Towers Input water quality Temperature, dissolved and
suspended solid - Scale formation - Higher temperature (low efficiency)
- Thermometer - Analysis
Output water Temperature Higher temperature (low efficiency)
Thermometer
Blow-down
Water
Flow rate Scale formation (low efficiency)
- Flow rate measurement (flowmeter) - Calculation and mass balance
Twice a month
Wastewater Treatment Plant - Input flow rate
higher than design value - Pollutants concentration higher than design value
Receiving water body
- Input flow rate and characteristics - Output flow rate and characteristics
End-of-pipe effluent characteristics (low treatment efficiency)
Analysis and measurements
Once a month
Solvent Recovery Unit Efficiency of
separation Land Sludge composition
Sludge characteristics (containing higher amounts of solvents)
Analysis and measurements
Once a week
September 2002
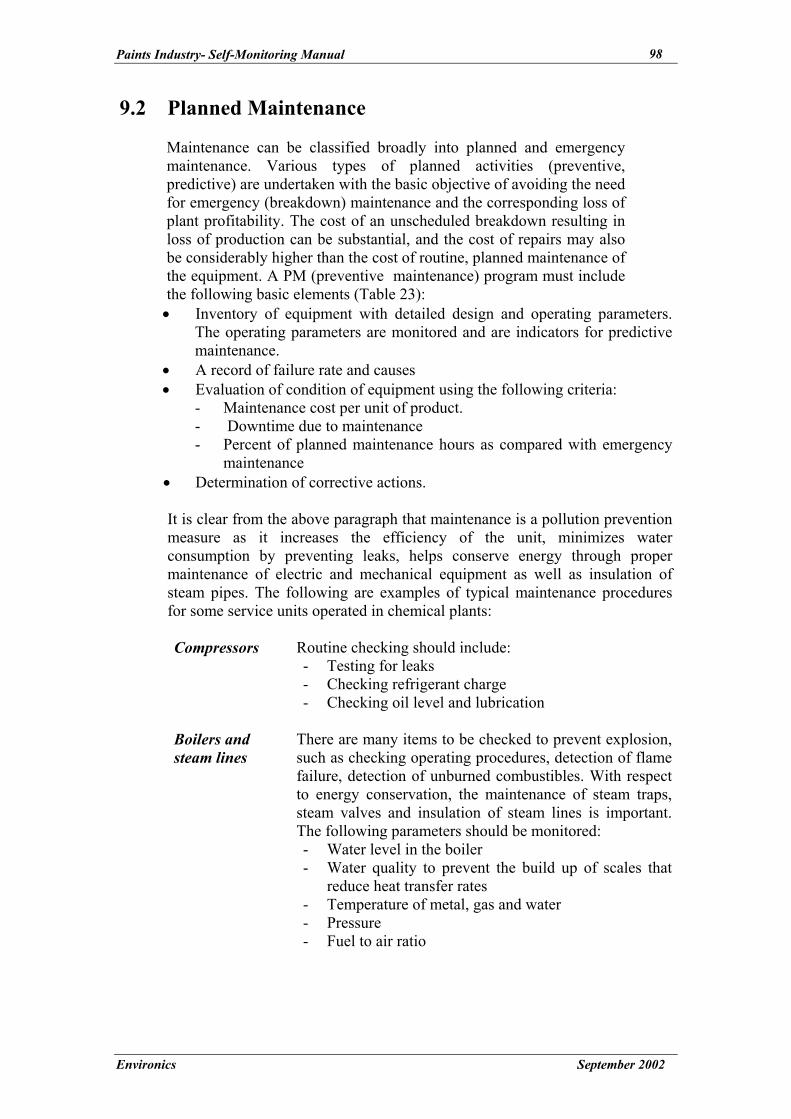
Paints Industry- Self-Monitoring Manual 98
9.2 Planned Maintenance Maintenance can be classified broadly into planned and emergency maintenance. Various types of planned activities (preventive, predictive) are undertaken with the basic objective of avoiding the need for emergency (breakdown) maintenance and the corresponding loss of plant profitability. The cost of an unscheduled breakdown resulting in loss of production can be substantial, and the cost of repairs may also be considerably higher than the cost of routine, planned maintenance of the equipment. A PM (preventive maintenance) program must include the following basic elements (Table 23): • Inventory of equipment with detailed design and operating parameters.
The operating parameters are monitored and are indicators for predictive maintenance.
• A record of failure rate and causes • Evaluation of condition of equipment using the following criteria:
- Maintenance cost per unit of product. - Downtime due to maintenance - Percent of planned maintenance hours as compared with emergency
maintenance • Determination of corrective actions. It is clear from the above paragraph that maintenance is a pollution prevention measure as it increases the efficiency of the unit, minimizes water consumption by preventing leaks, helps conserve energy through proper maintenance of electric and mechanical equipment as well as insulation of steam pipes. The following are examples of typical maintenance procedures for some service units operated in chemical plants:
Compressors Routine checking should include:
- Testing for leaks - Checking refrigerant charge - Checking oil level and lubrication
Boilers and steam lines
There are many items to be checked to prevent explosion, such as checking operating procedures, detection of flame failure, detection of unburned combustibles. With respect to energy conservation, the maintenance of steam traps, steam valves and insulation of steam lines is important. The following parameters should be monitored: - Water level in the boiler - Water quality to prevent the build up of scales that
reduce heat transfer rates - Temperature of metal, gas and water - Pressure - Fuel to air ratio
Environics September 2002

Paints Industry- Self-Monitoring Manual 99
Dow-therm oil heaters
The primary consideration in the maintenance of heaters is to avoid conditions that might result in an explosive fuel/air mixture. - Check the fuel supply for leaks - Check air supply for leaks - Check the flue gas temperature.
Table (23) Monitoring and Preventive Maintenance
Parameters Monitoring method Indication Total number of shut downs and production interruptions.
Recording number and reason for shut down.
Overall assessment of the process reliability and avoided environmental loads.
Number of equipment failures resulting in production shut down per type of process and type of equipment.
Recording number and reason for failure.
Critical equipment.
Process performance monitoring.
Methods depending on the performance criteria.
Process performance/ efficiency of equipment.
Process equipment condition monitoring.
Numerous methods, inspection, testing.
Prevention of failures.
Environics September 2002

Paints Industry- Self-Monitoring Manual 100
10. Environmental Monitoring Environmental Monitoring covers emissions to air, effluent and solid and hazardous wastes. Section 4 presents the various laws and regulations that apply to emissions, effluents and wastes from the paints industry. Expected pollutants and hazardous releases from the industry are specified in section 2.4. For each production line related pollution aspects are identified in section 2.2., Figures 22-27 The pollution aspects of service units are presented in section 2.3 and Figure 28 The output from the measurements and analysis of the parameters are recorded in the environmental register of the facility. Tables 24, 25, 26 present the compliance monitoring activities for the different aspects of pollution as per environmental laws.
Monitoring of pollutants and releases requires careful consideration of the techniques being used because of the expected effect on the interpretation and hence, the reliability of the collected data. The common techniques used in monitoring will be explained in next section.
10.1 Emission to Air Air emissions can be measured either on periodical or continuous basis, the monitored parameters for point source combustion emissions are : NOx, SO2, CO, CO2, ashes, and particulates. Parameter monitored fugitive emissions depend on the specific production process. Periodical measurements Periodical measurements give the state of emissions over the chosen sampling time. Quantities needed in every emission calculation, such as volumetric flow rate, oxygen content, and humidity of the flue gases, are determined by periodical measurements. Periodical measurement results are also used as a support for converting the continuous concentration measurement results into annual emissions. Periodical measurements are carried out as manual single measurements or as short period continuous measurements by the plant itself or by an exterior measurer. Periodical emission measurements are carried out annually for the following emission components NO x, SO2, CO, CO2 and particulates. Continuous measurements The continuous measurements describe the temporal variation of the concentrations and volume of the emission components during the operation. General requirements for continuous monitoring systems are that the sampling locations should be representative and that the monitoring equipment should be suitable for the concentrations to be monitored in the prevailing circumstances. The emission control data system should
Environics September 2002

Paints Industry- Self-Monitoring Manual 101
preferably be part of the process control system. SO2, particulates and CO are generally measured continuously.
Emission calculation Differences between the different calculation methods can cause mistakes when comparing the environmental loads of different plants. Material balance calculations are used to complete emission measurements in order to get an impression of the reliability of the measurement results as well as to create a general view of the total emission level of each component. The amount of diffuse emissions that can not be recorded by emission measurements can be substantial.
10.2 Effluents (wastewater) The regulations set the limits for the concentrations of specific pollutants in wastewater when discharged to a recipient body. For monitoring purposes, the discharge values for specific substances or parameters are mostly expressed as total amounts per unit time. In some cases these values are given as specific amounts per ton of product or as purification efficiencies. Limit values are set for a large number of parameters such as COD, BOD5, O&G, TDS, TSS, pH, color, heavy metals (iron, copper, chromium, cadmium, lead, zinc, nickel, …).
Monitored parameters Typical wastewater parameters include the following:
Wastewater flow (Q), m3/d • • • • •
• • • •
Total suspended solids (TSS), mg/l Total dissolved solids (TDS), mg/l Oil and grease (O&G), mg/l Heavy metals (iron, copper, chromium, cadmium, lead, zinc, nickel, …), mg/l Chemical oxygen demand (COD) Biological oxygen demand (BOD5) pH Color
Flow measurement Measuring of the total wastewater flow is required for the operation of the wastewater treatment plant. There have been no provisions on the procedures or the accuracy of a flow measurement, but installation of automatic composite samplers (preferable flow dependent) can be used. Wastewater flow is usually measured with a venturi measurement equipment, but also magnetic and ultrasonic methods are used. Measurement equipment is maintained several times a year and the measurement system is calibrated regularly. Regular maintenance, control and calibration are needed to obtain an acceptable measurement accuracy level. The structure of the measurement system, a possible mounting fault or a false choice for measurement area can cause errors. Other sources of error or factors disturbing the measurement are dirt deposition and temperature variations. Evaluation of the total error is extremely difficult, as it must include all these factors.
Environics September 2002
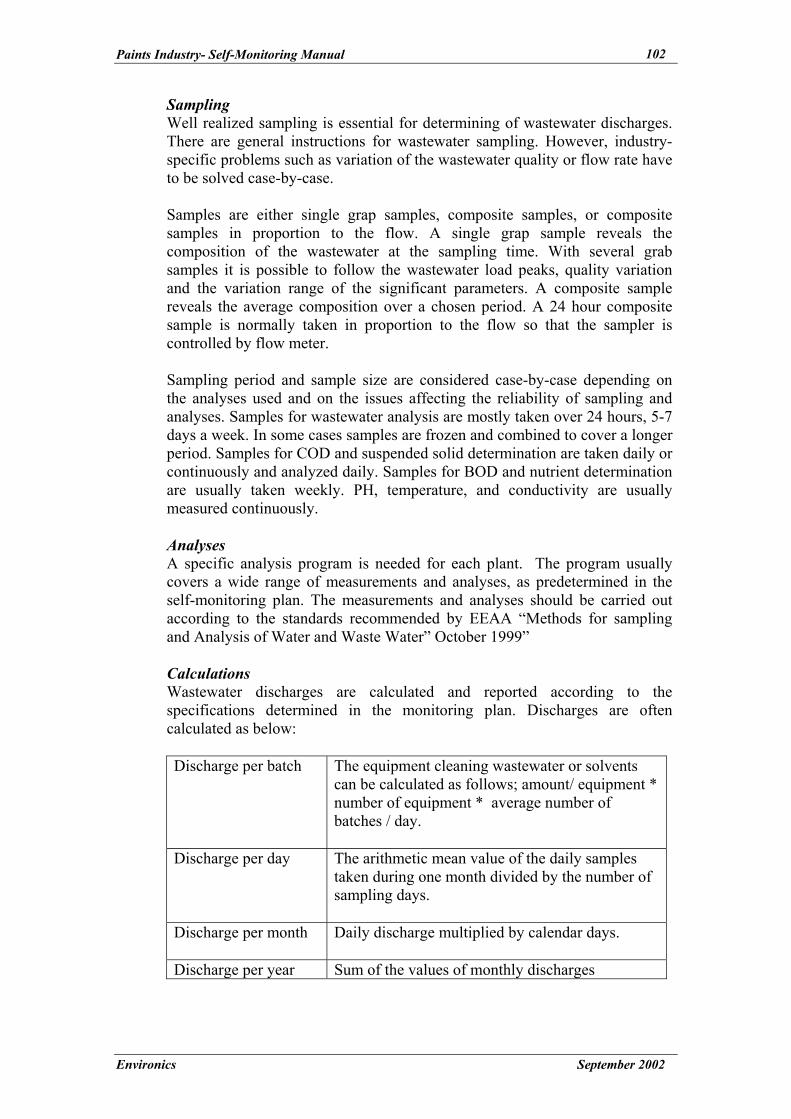
Paints Industry- Self-Monitoring Manual 102
Sampling Well realized sampling is essential for determining of wastewater discharges. There are general instructions for wastewater sampling. However, industry-specific problems such as variation of the wastewater quality or flow rate have to be solved case-by-case. Samples are either single grap samples, composite samples, or composite samples in proportion to the flow. A single grap sample reveals the composition of the wastewater at the sampling time. With several grab samples it is possible to follow the wastewater load peaks, quality variation and the variation range of the significant parameters. A composite sample reveals the average composition over a chosen period. A 24 hour composite sample is normally taken in proportion to the flow so that the sampler is controlled by flow meter.
Sampling period and sample size are considered case-by-case depending on the analyses used and on the issues affecting the reliability of sampling and analyses. Samples for wastewater analysis are mostly taken over 24 hours, 5-7 days a week. In some cases samples are frozen and combined to cover a longer period. Samples for COD and suspended solid determination are taken daily or continuously and analyzed daily. Samples for BOD and nutrient determination are usually taken weekly. PH, temperature, and conductivity are usually measured continuously.
Analyses A specific analysis program is needed for each plant. The program usually covers a wide range of measurements and analyses, as predetermined in the self-monitoring plan. The measurements and analyses should be carried out according to the standards recommended by EEAA “Methods for sampling and Analysis of Water and Waste Water” October 1999”
Calculations Wastewater discharges are calculated and reported according to the specifications determined in the monitoring plan. Discharges are often calculated as below: Discharge per batch The equipment cleaning wastewater or solvents
can be calculated as follows; amount/ equipment * number of equipment * average number of batches / day.
Discharge per day The arithmetic mean value of the daily samples taken during one month divided by the number of sampling days.
Discharge per month Daily discharge multiplied by calendar days.
Discharge per year Sum of the values of monthly discharges
Environics September 2002

Paints Industry- Self-Monitoring Manual 103
The efficiency of biological wastewater treatment is also controlled by calculating the reduction of organic matter (BOD,COD) between untreated wastewater before primary sedimentation and treated wastewater after secondary clarification.
A typical wastewater discharge monitoring report includes e.g. monthly mean values and variations for discharges at the monitoring points before and after the treatment, applicable limits values and also some production information.
10.3 Monitoring of Solid Wastes The properties of solid wastes that are generated, especially when they are utilized or taken to a landfill, have to be investigated. The general principles in landfill operation are that the composition, leachability, long term behavior and the properties of the waste have to be known. The approval for using a landfill for a specific waste is based on the origin and the properties of the waste. The evaluation of the properties of the waste is based on:
The composition of the waste. •
• • •
The organic content and degradation properties of the waste, The content and leachability of harmful compounds, and The ecotoxicological effects of the waste and the landfill waters
Table (25) presents a compliance monitoring plan for the solid wastes.
10.4 Monitoring of Hazardous Wastes Management In order to comply with the law regulations, the industrial establishments are required to take all necessary measures to properly manage their hazardous waste on site. Law 4/1994 and its Executive Regulations address the measures to be implemented at the different stages of the management process starting from the reduction of waste at source through to identification, collection, on-site storage, on-site treatment, transport for off-site disposal, as well as keeping records (Environmental Register). Following are the main requirements to be implemented by an industrial establishment generating hazardous waste. These requirements are summarized in table (26). Details for these requirements are presented in sections 4.2.2 through to 4.2.10 of the EPAP Hazardous Waste Management Manual for Industries, 2002. Figure (32) shows the hazardous waste management options for paints industry.
Environics September 2002

Paints Industry- Self-Monitoring Manual 104
Table (24) Compliance Monitoring for Air pollution, Workplace, and Wastewater Source type Operating Major
pollution sources
Impact Parametermonitored
Method used
Point Diffuse Normal Exceptional
Person responsible
Boilers Flue gases Air - Sulfur oxides
- Nitrogen oxides - Carbon oxides - Particulate matters (ash)
- Gas analyzer - Dust meter
Fans Workenvironment
Noise Noise meter
Boiler house Work environment
Heat stress (temp. and humidity)
Thermometer and hygrometer
Dow-therm Oil Heater Flue gases Air - Sulfur oxides
- Nitrogen oxides - Carbon oxides - Particulate matters (ash)
Gas analyzer- - Dust meter
Paints, Inks, and Varnishes Production lines Mixing VOCs, Particulates
(PM10)
Grinding VOCs, noise Filtration VOCsFilling and packaging
Work environment
VOCs, noise
- Ambient air analyzer - Noise meter
September 2002

Paints Industry- Self-Monitoring Manual
September 2002
105
Alkyd Resin Production Line Reaction Solvent/ water separation Cooling and dilution Filtration
Work Environment
- VOCs - Heat stress
- Ambient air analyzer - Thermometer and hygrometer
End-of-pipe Wastewater effluent
Receiving water body
BOD, COD, O&G, TDS, TSS, pH, color, heavy metals (iron, copper, chromium, cadmium, lead, zinc, nickel, …).
- Chemical analysis - Measurements: BOD tester COD tester TSS tester (Hoffman funnel) Atomic absorption (spectrophotometer)

Paints Industry- Self Monitoring manual 106
Table (25) Compliance Monitoring Plan for Solid Wastes
Internal Utilization Process Unit
Type of waste Tons/year Tons /ton production
Segregation from hazardous waste Reused Recovered
Disposal
Packaging
Plastic, paper, metals
Workshops
Scrap
Garage
Scrap
Environics September 2002

Paints Industry- Self Monitoring manual
Environics September 2002
107
Table (26) Compliance Monitoring Plan for Hazardous Wastes Management
Waste minimization Process Unit
Type of waste Tons/year
Tons /ton production
Waste segregation Source
reduction Reuse/ Recovery
Handling Storage On-site treatment
Disposal
Empty containers contaminated with chemicals
Filters sludge containing paints and solvents
Spent filter cloths, contaminated with paints (resins, pigments, fillers,…) and containing heavy metals, solvents
Spent cleaning solvents
All production lines
Out-dated, rejected, and off-spec. products
Solvent recovery unit
Sludge containing paints and solvents
Wastewater treatment unit
Sludge containing heavy metals and hydrocarbons

Paints Industry- Self-Monitoring Manual 108
Alternative 1 Alternative 2
Spent cleaning solvents
Cleaning with solvents
Ashes
Incinerator
Landfill
Sludge containing paints& solvents
Sludge generated from the wastewater treatment unit
containing paints and solvents
Solvent recovery unit
Spent filter cloths containing paints and
solvents
Chemicals empty containers
Filters sludge containing paints and solvents
Spent cleaning solvent
Figure (32) Hazardous Waste Management Options
Environics September 2002

Paints Industry- Self-Monitoring Manual 109
11. Data Collection, Processing and Usage
The general objective for the self-monitoring system is to produce data that is representative, repeatable, reliable, compatible and comparable. These characteristics are dependent on the applied measures for quality control and quality assurance throughout the data production chain i.e. volume determination, sampling, sample pretreatment, treatment and analysis, data processing and reporting.
11.1 Data Collection and Processing
The different parts of the monitoring system of a plant include diverse factors affecting the reliability and comparability of the emission data. These factors have to be taken into consideration in sampling, sample treatment and analysis as well as in processing and reporting of the data. Requirements for the whole data production chain should be set in the monitoring program. In addition, implementation of the relevant measures for quality control and quality assurance is extremely important in obtaining maximum reliability, repeatability and comparability.
The aspects and parameters that are involved in data collection and processing are explained in the Appendix A. Figure (33) shows the main aspects and parameters that affect the effectiveness of SM in terms of reliability, repeatability and comparability.
11.2 Using SM Outputs
The implementation of the self-monitoring plan will basically result in three outputs:
Data and information about the facility • • •
•
Preparing the environmental register as required by law. Reports describing results of the self-monitoring and problems faced during implementation Feed back and decision making
Environics September 2002
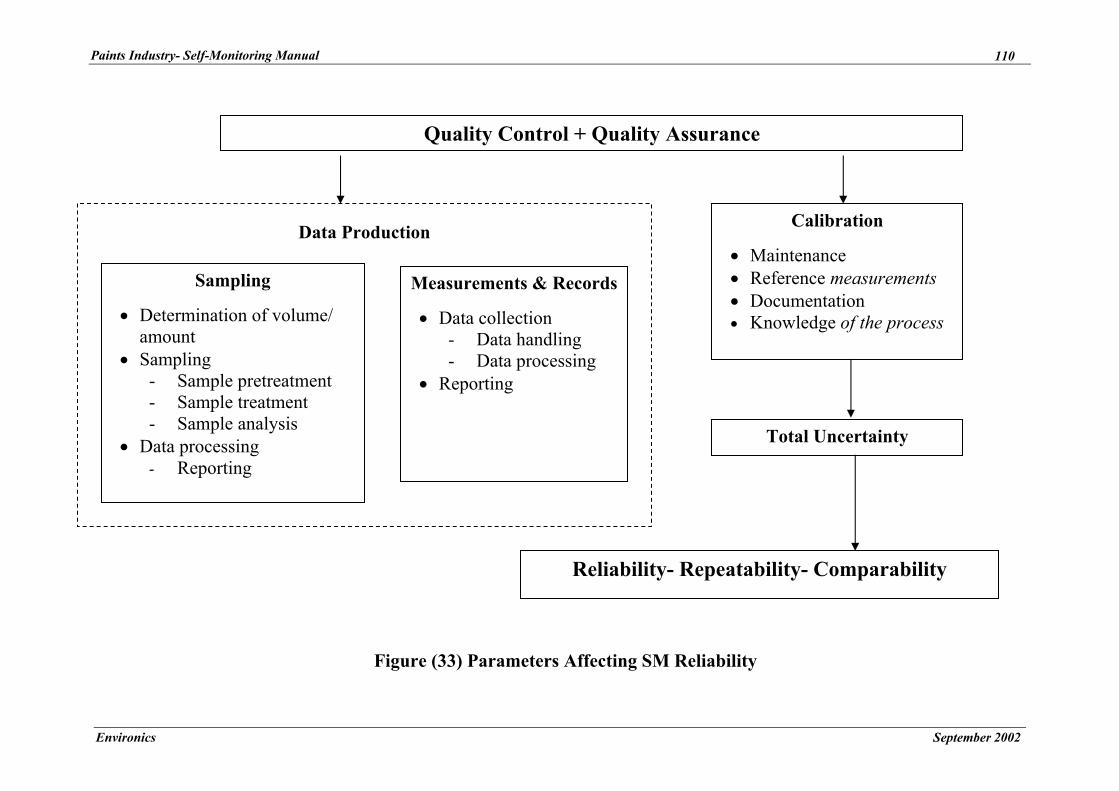
Paints Industry- Self-Monitoring Manual 110
• • • • •
•
•
•
•
Data Production
Sampling
Determination of volume/ amount Sampling
- Sample pretreatment - Sample treatment - Sample analysis
Data processing - Reporting
Measurements & Records
Data collection - Data handling - Data processing
Reporting
Reliability- Repeatability- Comparability
Total Uncertainty
Calibration
Maintenance Reference measurements Documentation Knowledge of the process
Figure (33) Parameters Affecting SM Reliability
Quality Control + Quality Assurance
Environics September 2002

Paints Industry- Self-Monitoring Manual 111
11.2.1 Techniques for Summarizing and Illustrating Data It is best practice to record process and environmental information in a detailed archive or database. It can then be related easily to the monitoring results and used to evaluate, compare and manage aspects of process performance such as:
the rate of release of pollutants compared to production • • •
•
•
the rate of generation of waste compared to production the rate of consumption of energy and/or materials compared to production the impacts on environmental receptors compared to production or to their sensitivity the overall resource efficiency of the process, i.e. production compared to inputs or raw materials and energy, and outputs of pollutants and waste
There are many techniques used in the interpretation of results (e.g. statistical analysis of the measurement results, reduction of operating conditions to normal conditions when monitoring gaseous emissions).
11.2.2 Environmental Register
Only monitoring data related to compliance will be included in the environmental register. Description of the measuring and/or analytical techniques used should be reported as well as the location of sampling and measuring. EEAA/EPAP prepared a detailed description of the environmental register, based on the requirements of law 4/1994, see Annex B. The competent authorities could request the inspection of the measuring devices to check their operability and the maintenance record for these devices. The procedures for taking samples could also be checked by the inspector. The inspectors check whether the facility has provided information that is relevant and of sufficient quality. To assess compliance, a simple numerical or statistical comparison between the measurements, their uncertainty and the limit value is performed. According to Law 4/1994, compliance self-monitoring data should be recorded and kept for a minimum of 10 years.
11.2.3 Reporting
Description of the reporting scheme, its content, recipient and purpose should be included in the self-monitoring plan. A monitoring report is a uniform presentation of data over a fixed period. An annual monitoring report that provides information of the past calendar year is always required. Shorter period reports are required for significant polluters. The conditions of the process and equipment as well as location of monitoring points should be specified. Reporting can be: • Internal to inform management and raise the environmental awareness of
the facility personnel. It should include problems met during the implementation of the SM plan to be used in decision making.
• External for the competent authority. based on the environmental register, establishments are required to report on environmental violations.
Environics September 2002

Paints Industry- Self-Monitoring Manual
Environics September 2002
112
11.2.4 Internal Auditing and Conclusions on Results
The data obtained must be compared regularly with the objectives written down in the monitoring program to check that they are being met.
11.2.5 Feedback and Decision Making
Feedback on the assessment of compliance based on the monitoring results should include all parties involved with the monitoring activities. The participants should make the necessary improvements and corrections to the next monitoring program.
In those parts of the monitoring program where compliance is met, possible reduction in frequency of monitoring can be considered and instead move resources to parts that need more accurate monitoring, e.g. borderline or non-compliance situations.
Feedback should include all parts of the monitoring program, process, product control, maintenance, environmental management and occupational safety. Detailed requirements should be set for the improvements needed and a date fixed for their implementation.
11.2.6 Using Outputs in Public Relations
The monitoring data is refined and distributed to the end users such as national and international reporting, research and statistical purposes, citizens, and the media.
The citizens have the right to present complaints about the health or environmental impacts caused by the operation these complaints are directed to the permitting and supervising authority.
Monitoring data is needed e.g. in national research and statistics, for planning and evaluation purposes, by national group organizations and the media.
Paints Industry- Self-Monitoring Manual
List of References
1) Saarinen K., Jouttijarvi T. and Forsius K. (1998) Monitoring and Control Practices of Emissions in Pulp and Paper Industry in Finland. The Finish Environment 220. 38 p.
2) Saarinen K. (1999) Data Production Chain in Monitoring of Emissions. The Finish Environment 326. 52 p.
. خطة الالتزام البيئى لشركة باكين لصناعة البويات والكيماويات (3
بدران محمد/ عالم البويات، د (4 5) Shreve’s, Chemical Process Industries by George T. Austin, fifth edition.
Published by McGraw- Hill Book. 6) Guide to Pollution Prevention, The Paints Manufacturing Industry, EPA
(June 1990).
September 2002