paccar - digitalcollections.lib.washington.edu
TRANSCRIPT
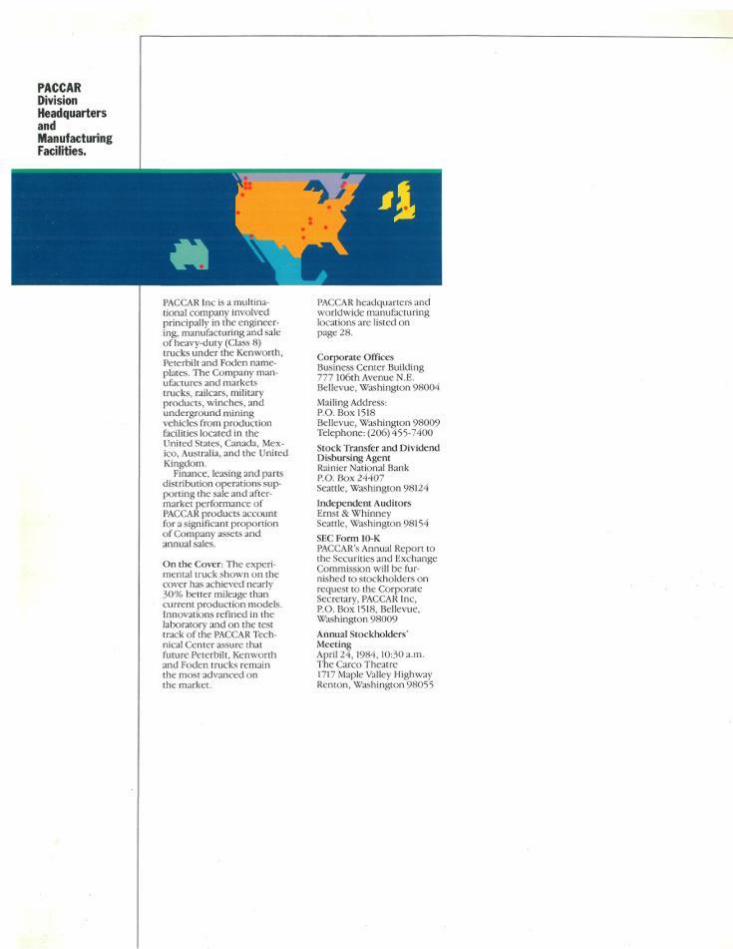
PACCAR Division Headquarters and Manufacturing Facilities.
PACX.AR Inc Ls a multinational company involved principally in the engineering, manufacturing and sale of heavy-duty (Class 8) trucks under the Kenwortli, Peterbilt and Foden name-plates. The Coinpany manufactures and markets trucks, railcars, military products, winches, and underground mining vehicles from production facilities located in the United States, Canada, Mexico, Australia, and the United Kingdom.
Finance, leasing and parts distribution operations supporting the sale and after-market performance of PACCAR products account for a significant proportion of Company assets and annual sales.
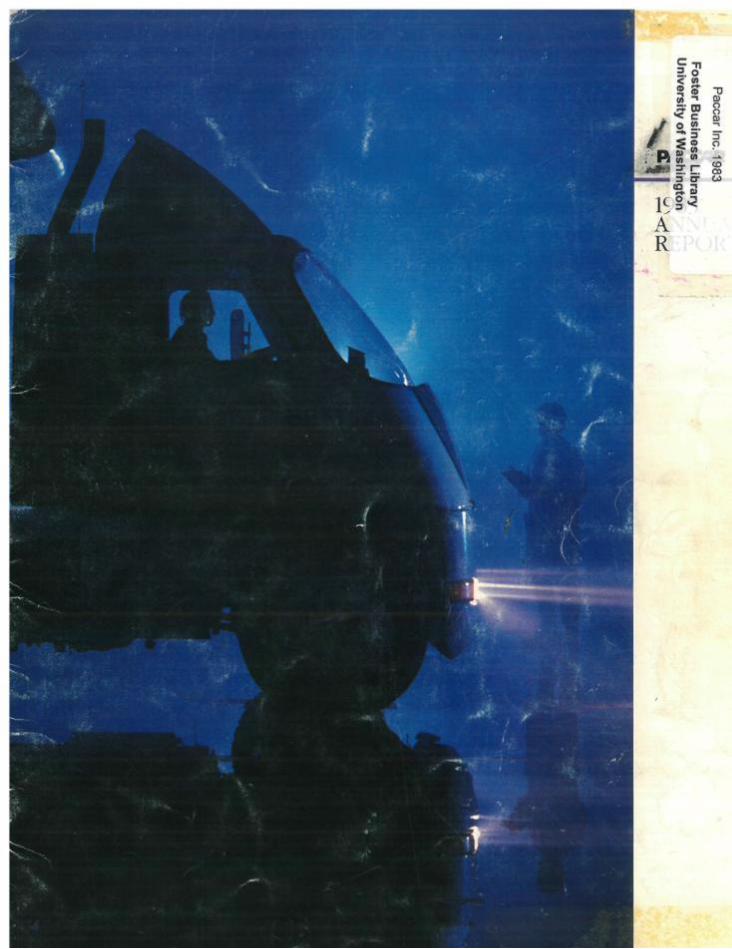
On the (;over: The experimental truck shown on the cover has achieved nearly 30% better mileage than current productk)n models. Innovations refined in the laborat<5ry and on the test track ofthe PACCAR Technical Center assure that future Peterbilt, Kenworth and Foden trucks remain the most advanced on the market.
PACCAR headquarters and worldwide manufacturing locations are listed on page 28.
Corporate Offices Business Center Building 777 106th Avenue N.E, Bellevue, Washington 98004
Mailing Address: P.O. Box 1518 Bellevue, Washington 98009 Telephone: (206) 455-7400
Stock Transfer and Dividend Disbursing Agent Rainier National Bank RO. Box 24407 Seattle, Washington 98124
Independent Auditors Ernst & Whinney Seattle, Washington 98154
SEC Form 10-K PACCAR's Annual Report to the Securities and Exchange Commission will be furnished to stockholders on request to the Corporate Secretary, PACCAR Inc, P.O. Box 1518, Bellevue, Washington 98009
Annual Stockholders' Meeting April24,1984,10:,30 a.m. The Carco Theatre 1717 Maple Valley Highway Renton, Washington 98055
/'AC'CAK Inc and Consolidated Subsidiaries (thousands of dollars except for per share data)
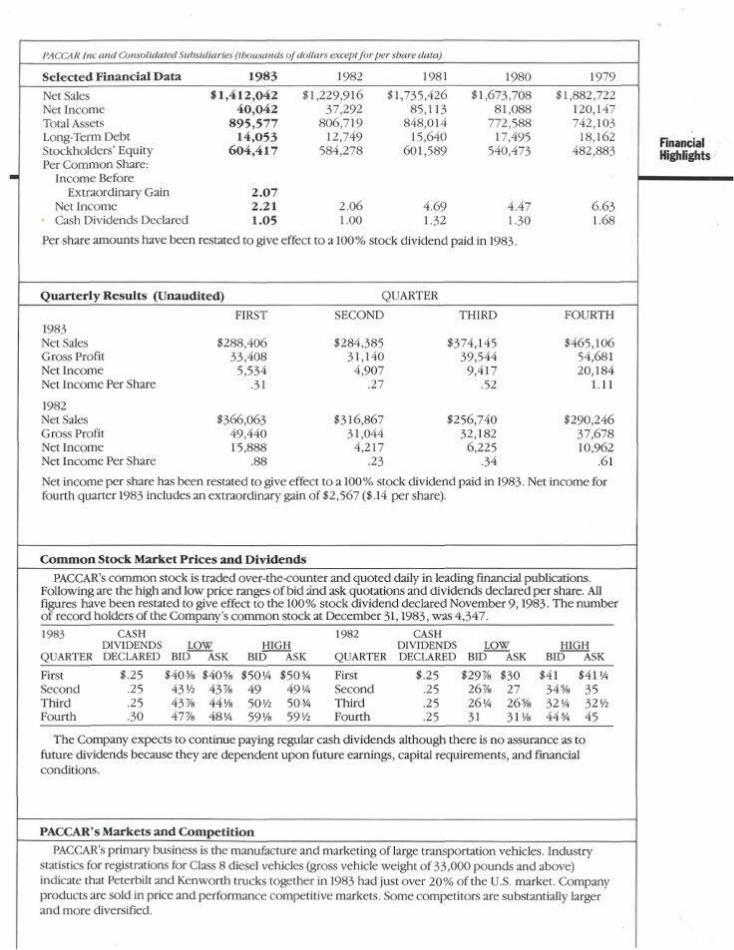
Selected Financial Data 1983 1982 1981 1980 1979
Net Sales Net Income Total Assets Long-Term Debt Stockholders' Equity Per Common Share:
Income Before Extraordinar'y' Gain
Net Income Cash Dividends Declared
Per share amounts have been restated to give effect to a 100% stock dividend paid in 1983.
$1,412,042 40 ,042
895 ,577 14,053
604 ,417
2.07 2.21 1.05
$1,229,916 37,292
806,719 12,749
584,278
2.06 1.00
$1,735,426 85,113
848,014 15,640
601,589
4.69 1.32
$1,673,708 81,088
772,588 17,495
540,473
4.47 1.30
$1,882,722 120,147 742,103
18,162 482,883
6.63 1.68
Rnancial Highlights
Quarterly Results (Unaudited) QUARTER
1983 Net Sales Gross Profit Net Income Net Income Per Share
1982 Net Sales Gross Profit Net Income Net Income Per Share
FIRST
,406 33,408
5,534 .31
$366,063 49,440 15,888
.88
SECOND
$284,385 31,140
4,907 .27
$316,867 31,044
4,217 .23
THIRD
$374,145 39,544
9,417 .52
$256,740 32,182
6,225 .34
FOURTH
$465,106 54,681 20,184
1.11
$290,246 37,678 10,962
.61
Net income per share has been restated to give effect to a 100% stock dividend paid in 1983. Net income for fourth quarter 1983 includes an extraordinary gain of $2,567 ($.14 per share).
Common Stock Market Prices and Dividends
PACCAR's common stock is traded over-the-counter and quoted daily in leading financial publications. Folio-wing are the high and low price ranges of bid and ask quotations and dividends declared per share. All figures have been restated to give effect to the 100% stock dividend declared November 9,1983. The number of record holders ofthe Company's common stock at December 31,1983, -was 4,347.
1983
QUARTER
First Second Thi rd Four th
CASH DIVIDENDS DECLARED
$.25 .25 .25 .30
LOW BID ASK
$403/8 $405/8 43'/2 4378 4378 44'/8 4778 48'/4
HIGH BID ASK
$50'A $505/4 49 49 '/4 50'/2 505/4 59'/8 59'/2
1982
QUARTER
First Second Thi rd Four th
CASH DIVIDENDS DECLARED
$.25 .25 .25 .25
LOW BID ASK
$2978 $30 267s 27 26/4 265/8 31 31 %
HIGH BID ASK
$41 $41'/4 345/8 35 32 '/4 321/2 443/4 45
The Company expects to continue paying regular cash dividends although there is no assurance as to future dividends because they are dependent upon future earnings, capital requirements, and financial conditions.
PACCAR's Markets and Competition
PACCAR's primary business is the manufacture and marketing of large transportation vehicles. Industry statistics for registrations for Class 8 diesel vehicles (gross vehicle weight of 33,000 pounds and above) indicate that Peterbilt and Kenworth trucks together in 1983 had just over 20% ofthe U.S. market. Company products are sold in price and performance competitive markets. Some competitors are substantially larger and more diversified.
Message to Shareholders
To our Shareholders: The U.S. economy improved during
1983 following a particularly long recession. The effect of this recovery on PACCAR included substantial increases in truck orders during the second half of the year. Overall results from operations for the year
were still depressed, however, with earnings of 840.0 million on sales of $1.41 billion. These figures compare to earnings of
$37.3 million in 1982 on sales of $1.23 billion. The heavy-duty truck industry, v/hich
accounted for 92 % of PACCAR's business in 1983, was characterized by intense competition and price discounting during the year. The Company's Kenworth and Peterbilt Divisions were able to meet the competition successfully, however. In 1983, PACCAR increased its market penetration to over 20% for the first time, improving upon its position, first achieved in 1982, as the second largest U.S. manufacturer of Class 8 trucks.
By the fourth quarter, price discounting had begun to abate, leading to healthier per-unit profits. Kenworth and Peterbilt ended the year with a combined backlog of orders five times greater than at year-end 1982, bringing U.S. truck production up to approximately 90% of capacity.
PACCAR achieved positive earnings in each of the three recessionary years and ended 1983 in excellent condition financially with a year-end ratio of current assets to current liabilities of 2.14:1. Long-term debt as a percent of equity remained low at 2.3%.
In recognition of this financial strength and as a mark of confidence in the future, PACCAR increased its dividend 20% in the fourth quarter. The Company also declared a split of common stock in the form of a 100% stock dividend to holders of record on November 19,1983.
PACCAR performed well during recent periods in part because of its unique position in the U.S. marketplace. Both Kenworth and Peterbilt are known for combining excellence in engineering with a willingness to build nearly any configuration of truck the buyer may specify. From a marketing standpoint, this policy enhances a reputation for building premium quality trucks. From a business standpoint, a policy of building only to order allows us to sell every truck we make, incurring lower costs for both PACCAR and its dealers when markets are slow.
PACCAR's practice of drawing upon many outside suppliers of truck components also affects results. It enables us to make early use of innovations achieved in many engineering disciplines by a network of high quality suppliers. At the same time, it avoids the high fixed overhead involved in vertical integration. Others who manufacture their own engines and drive train components have generated greater profits during good times, but found themselves unable to reduce fixed costs when business volume fell.
A third important element in recent operating results is management's willingness to take effective action to reduce costs. Task forces composed of senior managers reviewed operations of all divisions and subsidiaries to eliminate unnecessary overhead and assure that costs remain at a minimum as business increases. As a result of this review, operations are leaner at all levels. Consolidation of winch manufacturing facilities was also identified as a priority project. The three winch divisions have contributed substantially to total Company results in the past and the consolidation, begun in 1983, will improve profitability in the future.
The contribution of a strong, profit-minded management team cannot be overemphasized. To take maximum advantage of this Company asset, PACCAR is currently studying possible acquisitions consistent with managerial talents.
Another extremely important Company asset is its dealer network. PACCAR sells trucks only through dealers and takes a strong interest in their profitability and visibility in the industry. Recently this interest has taken the added form of support provided by PACCAR Leasing Corporation to dealers who offer truck rental and leasing to customers. By capitalizing on PACCAR's
network of dealers, PacLease franchises are able to offer fuel and service nationwide under a single agreement, allowing client firms to concentrate on their primary lines of business. Trucking deregulation makes this arrangement attractive to many firms and the number of trucks leased by PacLease dealer franchises more than doubled in 1983.
During 1983, PACCAR Financial Corp. also performed well, increasing its portfolio to over $500 million. This subsidiary has nearly doubled in size in the past three years and plays an increasingly important part in PACCAR's business plan. Net 1983 income contributed by PACCAR Financial Corp. was a record $11.9 million, or nearly 30% of consolidated income for the Company.
The success of PACCAR Financial and similar finance subsidiaries in Canada and Australia encouraged the Company to open a separate finance company in Great Britain in 1983 to facilitate sales of its Foden truck line.
PACCAR operated 17 manufacturing plants in five countries during 1983, including ten truck plants, and completed plans to license the assembly of trucks in Malaysia for the Asian logging industry starting early in 1984. This international capacity provides flexibility during times of currency exchange volatility and also responds to differential labor costs in world markets and local content laws increasingly encountered in Third World countries.
Another aspect of internationalization affects the U.S. domestic market, the largest in the world for heavy trucks. Many ofthe Company's traditional competitors are now subsidiaries of foreign companies with assets many times those of PACCAR. To meet this increased strength on the part of competitors, PACCAR truck divisions continued the systematic installation of advanced technologies during 1983. The use of computer aided design, robotics, computerized storage and retrieval systems and other advanced technologies described elsewhere in this report help
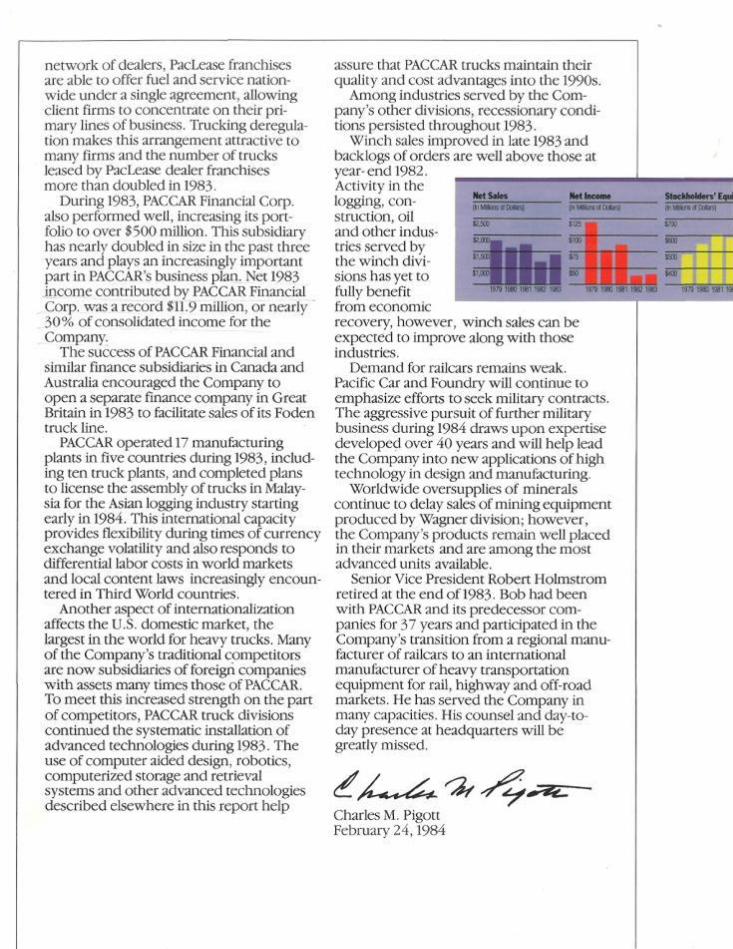
Nets ales (InMjIJonsolDollare)
K.500
$ 2 , 0 0 0 ^
$1,500
J1.000 i i i l
1 1 i 1
Netincome (In Millions of Dollars)
$t25 ; ;
S100
Hi
BSIKl S50 | | | _
1979 1980 19811982 1983
assure that PACCAR trucks maintain their quality and cost advantages into the 1990s.
Among industries served by the Company's other divisions, recessionary conditions persisted throughout 1983.
Winch sales improved in late 1983 and backlogs of orders are well above those at year- end 1982. ^^^^__________^^^ Activity in the logging, construction, oil and other industries served by the winch divisions has yet to fully benefit from economic recovery, however, winch sales can be expected to improve along with those industries.
Demand for railcars remains weak. Pacific Car and Foundry will continue to emphasize efforts to seek military contracts. The aggressive pursuit of further military business during 1984 draws upon expertise developed over 40 years and will help lead the Company into new applications of high technology in design and manufacturing.
Worldwide oversupplies of minerals continue to delay sales of mining equipment produced by Wagner division; however, the Company's products remain well placed in their markets and are among the most advanced units available.
Senior Vice President Robert Holmstrom retired at the end of 1983. Bob had been with PACCAR and its predecessor companies for 37 years and participated in the Company's transition from a regional manufacturer of railcars to an international manufacturer of heavy transportation equipment for rail, highway and off-road markets. He has served the Company in many capacities. His counsel and day-today presence at headquarters will be greatly missed.
Charles M. Pigott February 24,1984
stockholders' Eqid {In Millions 01 Dollars)
$500
WOO
1979 1980 1981 1982 1983 1979 1980 198119!
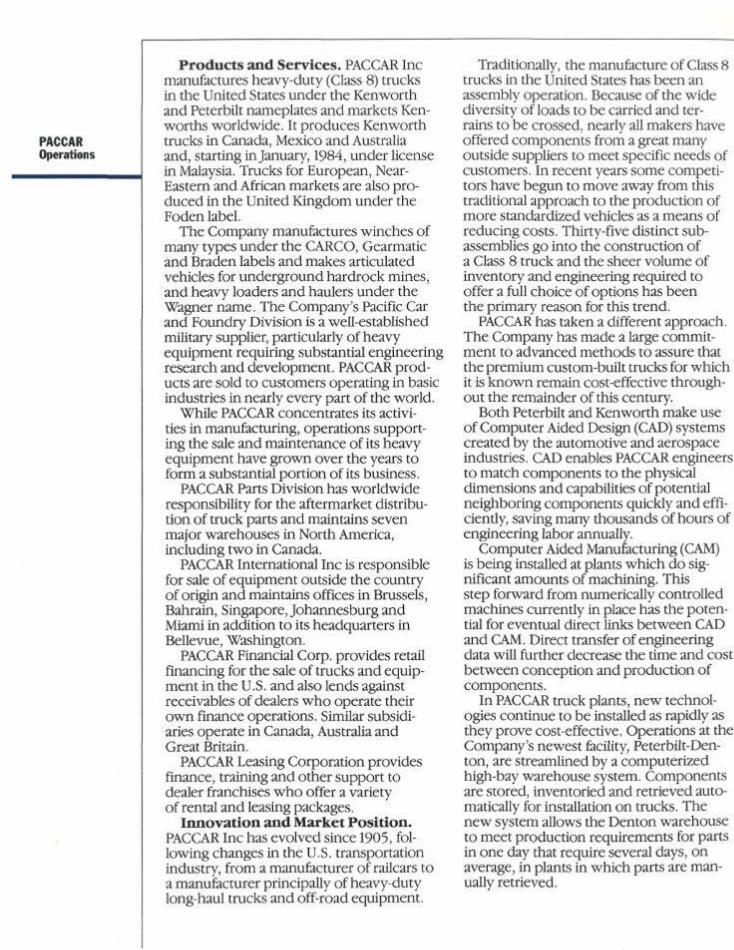
PACCAR Operations
Products and Services. PACCAR Inc manufactures heavy-duty (Class 8) trucks in the United States under the Kenworth and Peterbilt nameplates and markets Ken-worths worldwide. It produces Kenworth trucks in Canada, Mexico and Australia and, starting in January, 1984, under license in Malaysia. Trucks for European, Near-Eastern and African markets are also produced in the United Kingdom under the Foden label.
The Company manufactures winches of many types under the CARCO, Gearmatic and Braden labels and makes articulated vehicles for underground hardrock mines, and heavy loaders and haulers under the Wagner name. The Company's Pacific Car and Foundry Division is a well-established military supplier, particularly of heavy equipment requiring substantial engineering research and development. PACCAR products are sold to customers operating in basic industries in nearly every part of the world.
While PACCAR concentrates its activities in manufacturing, operations supporting the sale and maintenance of its heavy equipment have grown over the years to form a substantial portion of its business.
PACCAR Parts Division has worldwide responsibility for the aftermarket distribution of truck parts and maintains seven major warehouses in North America, including two in Canada.
PACCAR International Inc is responsible for sale of equipment outside the country of origin and maintains offices in Brussels, Bahrain, Singapore, Johannesburg and Miami in addition to its headquarters in Bellevue, Washington.
PACCAR Financial Corp. provides retail financing for the sale of trucks and equipment in the U.S. and also lends against receivables of dealers who operate their own finance operations. Similar subsidiaries operate in Canada, Australia and Great Britain.
PACCAR Leasing Corporation provides finance, training and other support to dealer franchises who offer a variety of rental and leasing packages.
Innovation and Market Position. PACCAR Inc has evolved since 1905, following changes in the U.S. transportation industry, from a manufacturer of railcars to a manufacturer principally of heavy-duty long-haul trucks and off-road equipment.
Traditionally, the manufacture of Class 8 trucks in the United States has been an assembly operation. Because ofthe wide diversity of loads to be carried and terrains to be crossed, nearly all makers have offered components from a great many outside suppliers to meet specific needs of customers. In recent years some competitors have begun to move away from this traditional approach to the production of more standardized vehicles as a means of reducing costs. Thirty-five distinct subassemblies go into the construction of a Class 8 truck and the sheer volume of inventory and engineering required to offer a full choice of options has been the primary reason for this trend.
PACCAR has taken a different approach. The Company has made a large commitment to advanced methods to assure that the premium custom-built trucks for which it is known remain cost-effective throughout the remainder of this century.
Both Peterbilt and Kenworth make use of Computer Aided Design (CAD) systems created by the automotive and aerospace industries. CAD enables PACCAR engineers to match components to the physical dimensions and capabilities of potential neighboring components quickly and efficiently, saving many thousands of hours of engineering labor annually.
Computer Aided Manufacturing (CAM) is being installed at plants which do significant amounts of machining. This step forward from numerically controlled machines currently in place has the potential for eventual direct links between CAD and CAM. Direct transfer of engineering data will further decrease the time and cost between conception and production of components.
In PACCAR truck plants, new technologies continue to be installed as rapidly as they prove cost-effective. Operations at the Company's newest facility, Peterbilt-Den-ton, are streamlined by a computerized high-bay warehouse system. Components are stored, inventoried and retrieved automatically for installation on trucks. The new system allows the Denton warehouse to meet production requirements for parts in one day that require several days, on average, in plants in which parts are manually retrieved.
'*r
I *
^ # "^
...,
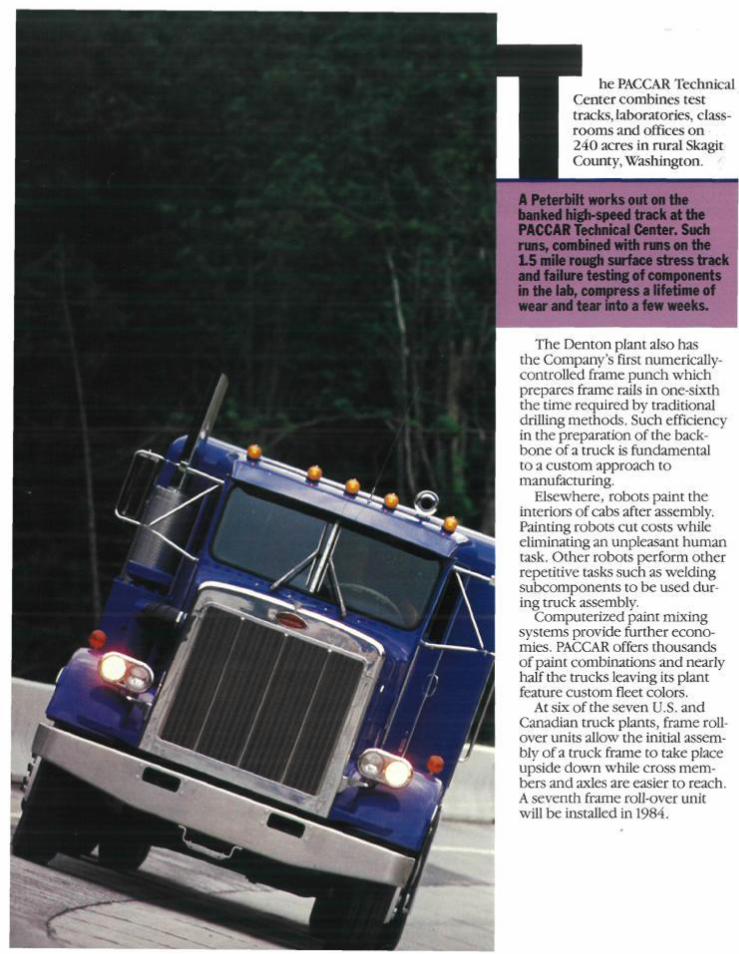
he PACCAR Technical Center combines test tracks, laboratories, classrooms and offices on 240 acres in rural Skagit County, Washington.
A Peterbilt works out on the banked high-speed track at the PACCAR Technical Center. Such runs, combined with runs on the L5 mile rough surface stress track and failure testing of components in the lab, compress a lifetime of wear and tear into a few weeks.
The Denton plant also has the Company's first numerically-controlled frame punch which prepares frame rails in one-sixth the time required by traditional drilling methods. Such efficiency in the preparation of the backbone of a truck is fundamental to a custom approach to manufacturing.
Elsewhere, robots paint the interiors of cabs after assembly. Painting robots cut costs while eliminating an unpleasant human task. Other robots perform other repetitive tasks such as welding subcomponents to be used during truck assembly.
Computerized paint mixing systems provide further economies. PACCAR offers thousands of paint combinations and nearly half the trucks leaving its plant feature custom fleet colors.
At six of the seven U.S. and Canadian truck plants, frame rollover units allow the initial assembly of a truck frame to take place upside down while cross members and axles are easier to reach. A seventh frame roll-over unit will be installed in 1984.
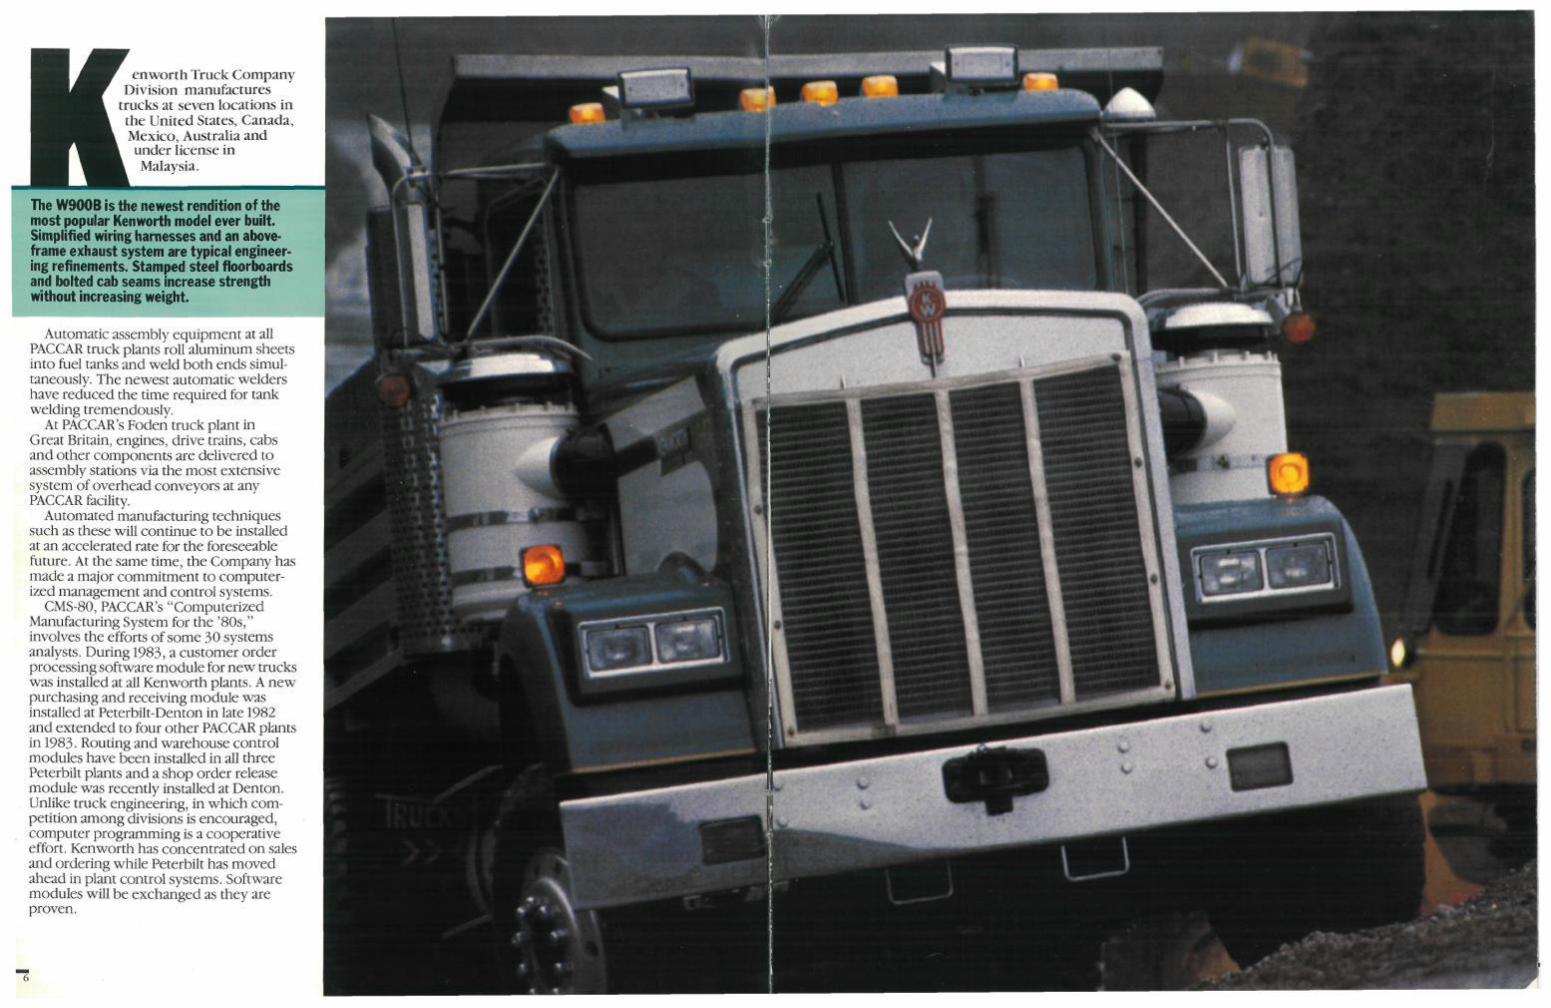
enworth Truck Company Division manufactures
trucks at seven locations in the United States, Canada, Mexico, Australia and under license in Malaysia.
The W900B is the newest rendition of the most popular Kenworth model ever built. Simplified wiring harnesses and an above-frame exhaust system are typical engineering refinements. Stamped steel floorboards and bolted cab seams increase strength without increasing weight.
Automatic assembly equipment at all PACCAR truck plants roll aluminum sheets into fuel tanks and weld both ends simultaneously. The newest automatic welders have reduced the time required for tank welding tremendously.
At PACCAR's Foden truck plant in Great Britain, engines, drive trains, cabs and other components are delivered to assembly stations via the most extensive system of overhead conveyors at any PACCAR facility.
Automated manufacturing techniques such as these will continue to be installed at an accelerated rate for the foreseeable future. At the same time, the Company has made a major commitment to computerized management and control systems.
CMS-80, PACCAR's "Computerized Manufacturing System for the '80s," involves the efforts of some 30 systems analysts. During 1983, a customer order processing software module for new trucks was installed at all Kenworth plants. A new purchasing and receiving module was installed at Peterbilt-Denton in late 1982 and extended to four other PACCAR plants in 1983. Routing and warehouse control modules have been installed in all three Peterbilt plants and a shop order release module was recently installed at Denton. Unlike truck engineering, in which competition among divisions is encouraged, computer programming is a cooperative effort. Kenworth has concentrated on sales and ordering while Peterbilt has moved ahead in plant control systems. Software modules will be exchanged as they are proven.
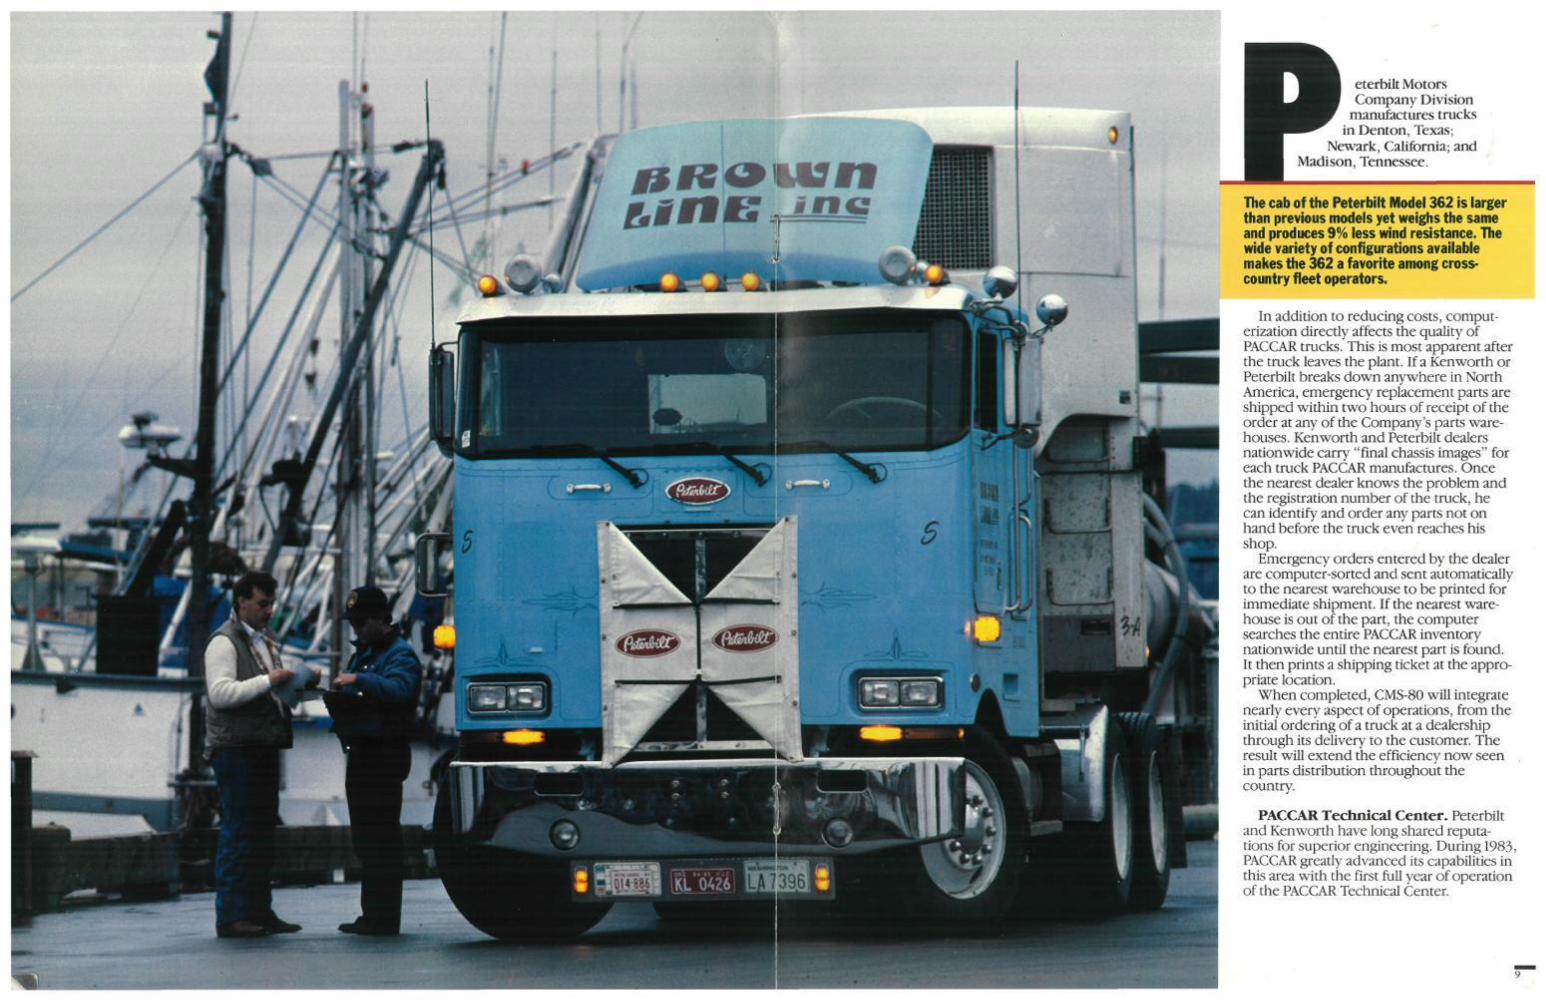
eterbilt Motors Company Division
manufactures trucks in Denton, Texas;
Newark, California; and ,' Madison, Tennessee.
The cab of the Peterbilt Model 362 is larger than previous models yet weighs the same and produces 9% less wind resistance. The wide variety of configurations available makes the 362 a favorite among crosscountry fleet operators.
In addition to reducing costs, computerization directly affects the quality of PACCAR trucks. This is most apparent after the truck leaves the plant. If a Kenworth or Peterbilt breaks down anywhere in North America, emergency replacement parts are shipped within two hours of receipt ofthe order at any of the Company's parts warehouses. Kenworth and Peterbilt dealers nationwide carry "final chassis images" for each truck PACCAR manufactures. Once the nearest dealer knows the problem and the registration number of the truck, he can identify and order any parts not on hand before the truck even reaches his shop.
Emergency orders entered by the dealer are computer-sorted and sent automatically to the nearest warehouse to be printed for immediate shipment. If the nearest warehouse is out of the part, the computer searches the entire PACCAR inventory nationwide until the nearest part is found. It then prints a shipping ticket at the appropriate location.
When completed, CMS-80 will integrate nearly every aspect of operations, from the initial ordering of a truck at a dealership through its delivery to the customer. The result will extend the efficiency now seen in parts distribution throughout the country.
PACCAR Technical Center, Peterbilt and Kenworth have long shared reputations for superior engineering. During 1983, PACCAR greatly advanced its capabilities in this area with the first full year of operation ofthe PACCAR Technical Center.
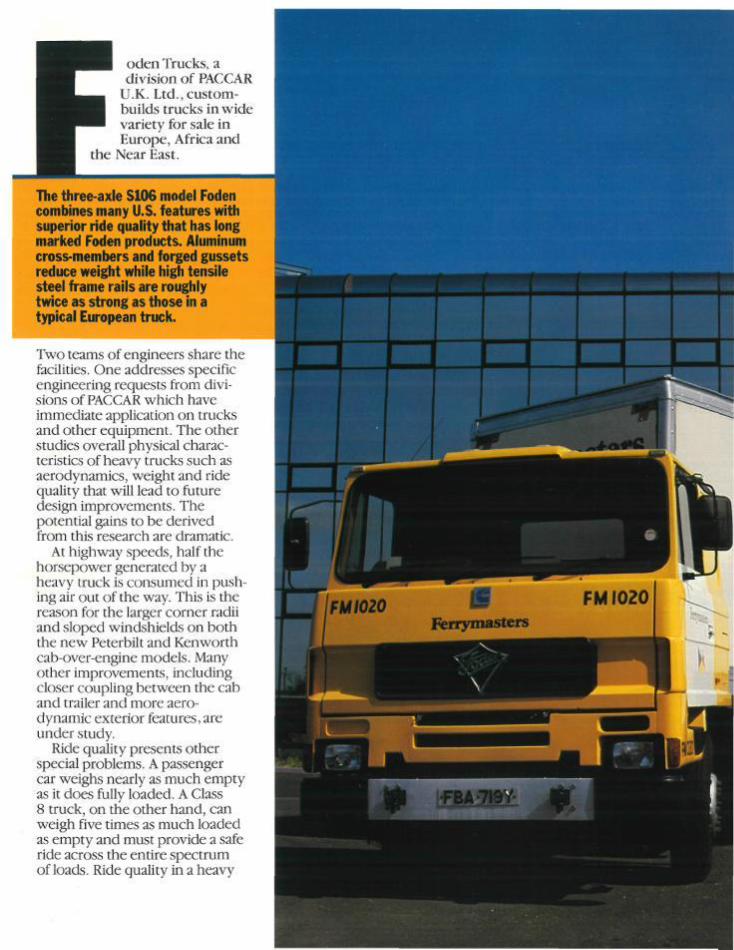
oden Trucks, a division of PACCAR
U.K. Ltd., custom-builds trucks in wide variety for sale in Europe, Africa and
the Near East.
The three-axle S106 model Foden combines many U.S. features with superior ride quality that has long marked Foden products. Aluminum cross-members and forged gussets reduce weight while high tensile steel frame rails are roughly twice as strong as those in a typical European truck.
Two teams of engineers share the facilities. One addresses specific engineering requests from divisions of PACCAR which have immediate application on trucks and other equipment. The other studies overall physical characteristics of heavy trucks such as aerodynamics, weight and ride quality that will lead to future design improvements. The potential gains to be derived from this research are dramatic.
At highway speeds, half the horsepower generated by a heavy truck is consumed in pushing air out of the way. This is the reason for the larger corner radii and sloped windshields on both the new Peterbilt and Kenworth cab-over-engine models. Many other improvements, including closer coupling between the cab and trailer and more aerodynamic exterior features,are under study.
Ride quality presents other special problems. A passenger car weighs nearly as much empty as it does fully loaded. A Class 8 truck, on the other hand, can weigh five times as much loaded as empty and must provide a safe ride across the entire spectrum of loads. Ride quality in a heavy
,.w*.f'/.'
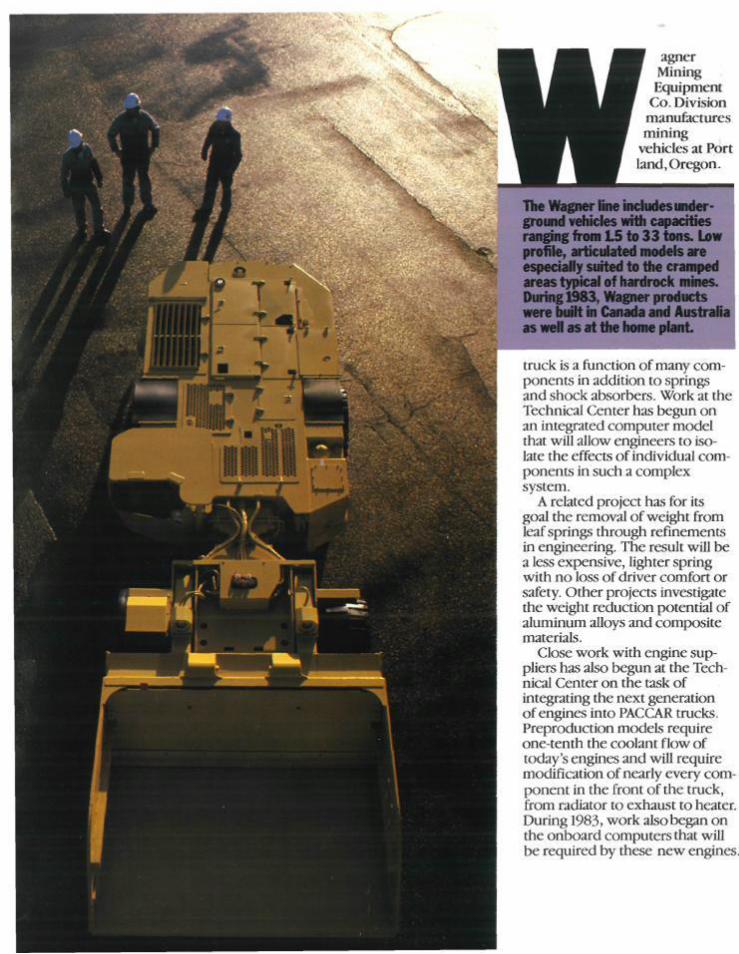
agner Mining Equipment
Co. Division manufactures mining
vehicles at Port land, Oregon.
The Wagner line includes underground vehicles with capacities ranging from LS to 33 tons. Low profile, articulated models are especially suited to the cramped areas typical of hardrock mines. During 1983, Wagner products were built in Canada and Australia as well as at the home plant.
truck is a function of many components in addition to springs and shock absorbers. Work at the Technical Center has begun on an integrated computer model that will allow engineers to isolate the effects of individual components in such a complex system.
A related project has for its goal the removal of weight from leaf springs through refinements in engineering. The result will be a less expensive, lighter spring with no loss of driver comfort or safety. Other projects investigate the weight reduction potential of aluminum alloys and composite materials.
Close work with engine suppliers has also begun at the Technical Center on the task of integrating the next generation of engines into PACCAR trucks. Preproduction models require one-tenth the coolant flow of today's engines and will require modification of nearly every component in the front of the truck, from radiator to exhaust to heater. During 1983, work also began on the onboard computers that will be required by these new engines.
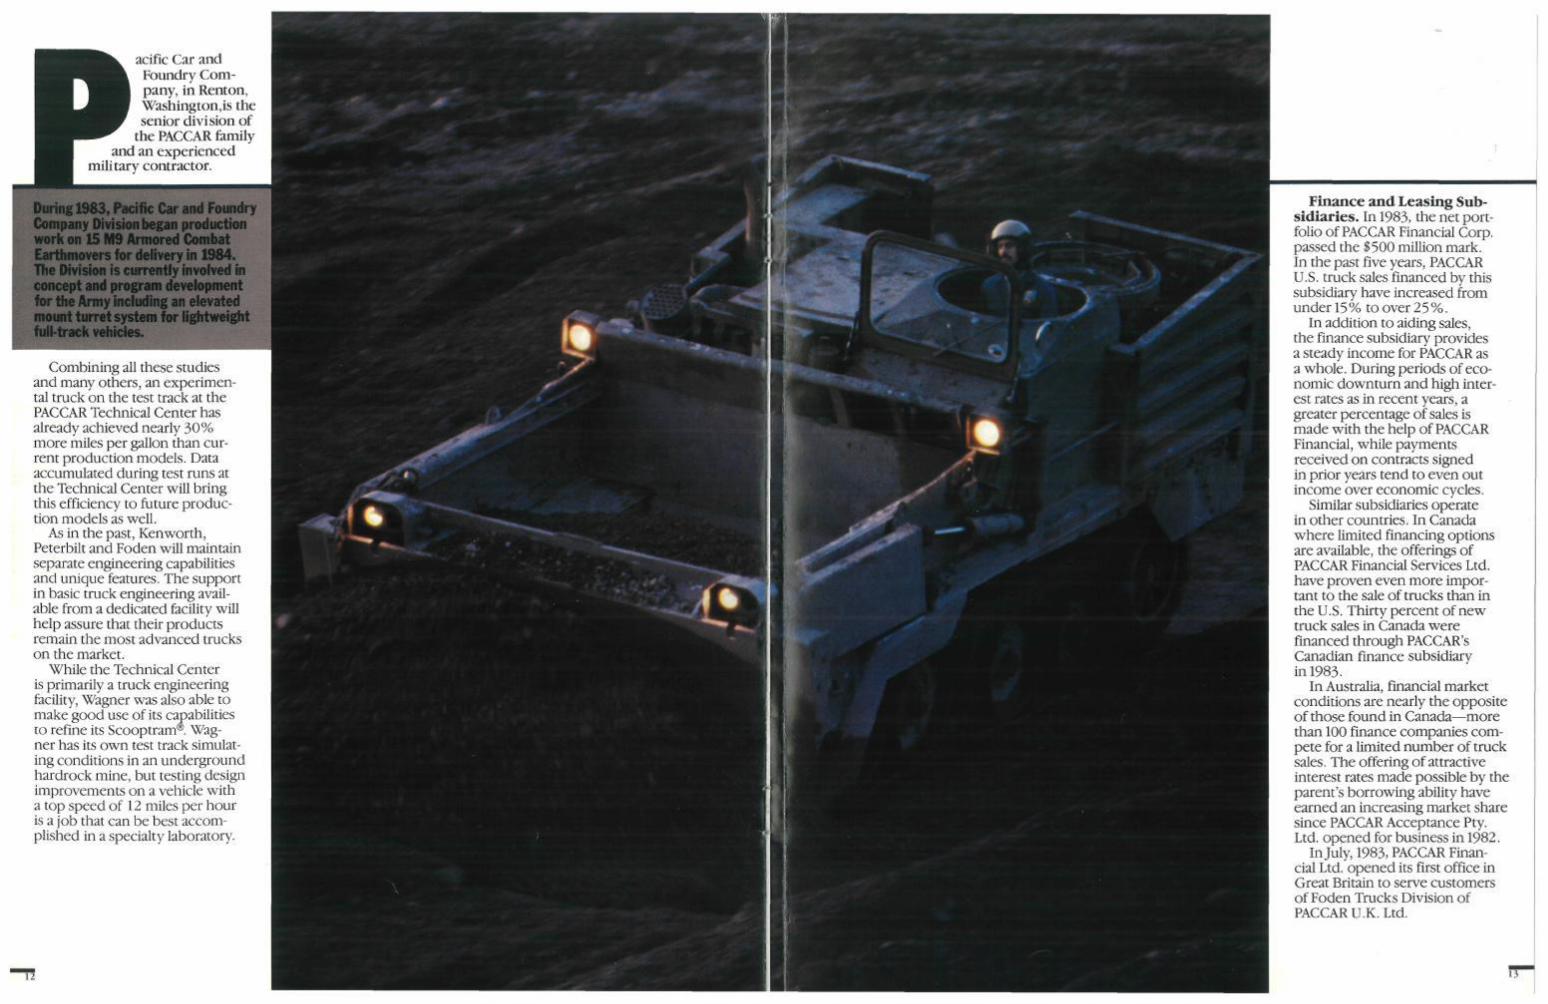
acific Car and Foundry Company, in Renton, Washington,is the senior division of
the PACCAR family and an experienced
military contractor.
During 1983, Pacific Car and Foundry Company Division began production work on 15 M9 Armored Combat Earthmovers for delivery in 1984. The Division is currently involved in concept and program development for the Army including an elevated mount turret system for lightweight full-track vehicles.
Combining all these studies and many others, an experimental truck on the test track at the PACCAR Technical Center has already achieved nearly 30% more miles per gallon than current production models. Data accumulated during test runs at the Technical Center will bring this efficiency to future production models as well.
As in the past, Kenworth, Peterbilt and Foden will maintain separate engineering capabilities and unique features. The support in basic truck engineering available from a dedicated facility will help assure that their products remain the most advanced trucks on the market.
While the Technical Center is primarily a truck engineering facility, Wagner was also able to make good use of its capabilities to refine its Scooptram®. Wagner has its own test track simulating conditions in an underground hardrock mine, but testing design improvements on a vehicle with a top speed of 12 miles per hour is a job that can be best accomplished in a specialty laboratory.
Finance and Leasing Subsidiaries. In 1983, the net portfolio of PACCAR Financial Corp. passed the $500 million mark. In the past five years, PACCAR U.S. truck sales financed by this subsidiary have increased from under 15 % to over 25%.
In addition to aiding sales, the finance subsidiary provides a steady income for PACCAR as a whole. During periods of economic downturn and high interest rates as in recent years, a greater percentage of sales is made with the help of PACCAR Financial, while payments received on contracts signed in prior years tend to even out income over economic cycles.
Similar subsidiaries operate in other countries. In Canada where limited financing options are available, the offerings of PACCAR Financial Services Ltd. have proven even more important to the sale of trucks than in the U.S. Thirty percent of new truck sales in Canada were financed through PACCAR's Canadian finance subsidiary in 1983.
In Australia, financial market condifions are nearly the opposite of those found in Canada—more than 100 finance companies compete for a limited number of truck sales. The offering of attractive interest rates made possible by the parent's borrowing ability have earned an increasing market share since PACCAR Acceptance Pty. Ltd. opened for business in 1982.
In July, 1983, PACCAR Financial Ltd. opened its first office in Great Britain to serve customers of Foden Trucks Division of PACCAR U.K. Ltd.
13
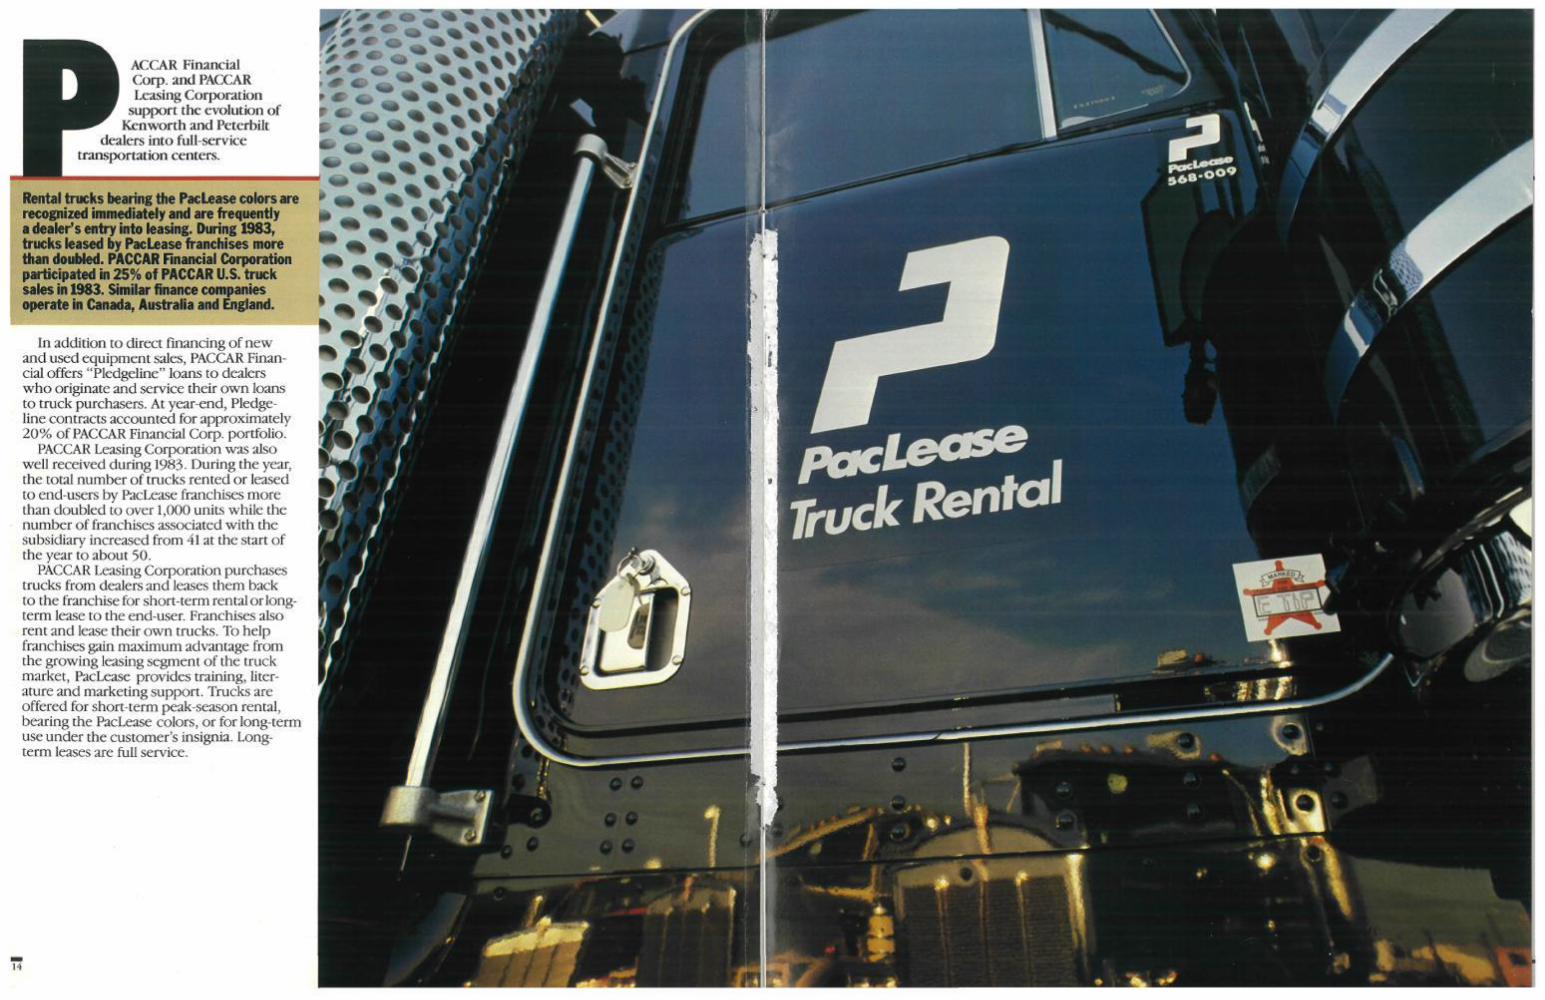
ACCAR Financial Corp. and PACCAR Leasing Corporation
support the evolution of Kenworth and Peterbilt
dealers into full-service transportation centers.
Rental trucks bearing the PacLease colors are recognized immediately and are frequently a dealer's entry Into leasing. During 1983, trucks leased by PacLease franchises more than doidUed. PACCAR Financial Corporation participated in 25% of PACCAR U.S. truck sales in 1983. Similar finance companies operate in Canada, Australia and England.
In addition to direct financing of new and used equipment sales, PACCAR Financial offers "Pledgeline" loans to dealers who originate and service their own loans to truck purchasers. At year-end. Pledge-line contracts accounted for approximately 20% of PACCAR Financial Corp. portfolio.
PACCAR Leasing Corporation was also well received during 1983. During the year, the total number of trucks rented or leased to end-users by PacLease franchises more than doubled to over 1,000 units while the number of franchises associated with the subsidiary increased from 41 at the start of the year to about 50.
PACCAR Leasing Corporation purchases trucks from dealers and leases them back to the franchise for short-term rental or long-term lease to the end-user. Franchises also rent and lease their own trucks. To help franchises gain maximum advantage from the growing leasing segment of the truck market, PacLease provides training, literature and markedng support. Trucks are offered for short-term peak-season rental, bearing the PacLease colors, or for long-term use under the customer's insignia. Long-term leases are full service.
14
"•-^•cnmrn^
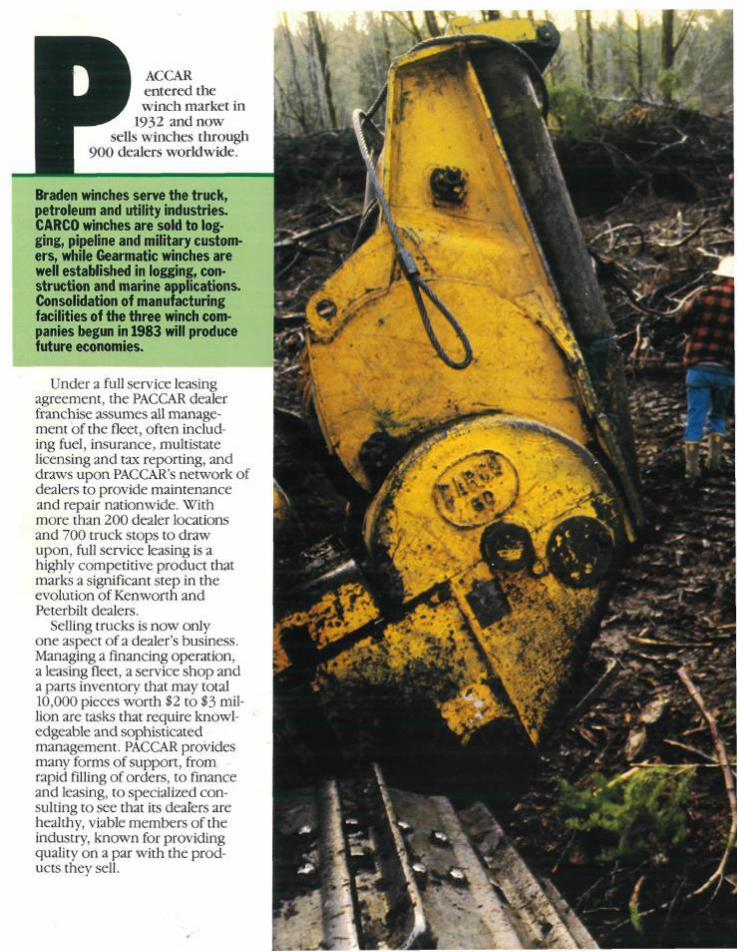
ACCAR entered the winch market in
1932 and now sells winches through
900 dealers worldwide.
Braden winches serve the truck, petroleum and utility industries. CARCO winches are sold to logging, pipeline and military customers, wrfiile Gearmatic winches are well established in logging, construction and marine applications. Consolidation of manufacturing facilities of the three winch companies begun in 1983 will produce ifuture economies.
Under a full service leasing agreement, the PACCAR dealer franchise assumes all management of the fleet, often including fuel, insurance, multistate licensing and tax reporting, and draws upon PACCAR's network of dealers to provide maintenance and repair nationwide. With more than 200 dealer locations and 700 truck stops to draw upon, full service leasing is a highly competitive product that marks a significant step in the evolution of Kenworth and Peterbilt dealers.
Selling trucks is now only one aspect of a dealer's business. Managing a financing operation, a leasing fleet, a service shop and a parts inventory that may total 10,000 pieces worth $2 to $3 million are tasks that require knowledgeable and sophisticated management. PACCAR provides many forms of support, from rapid filling of orders, to finance and leasing, to specialized consulting to see that its dealers are healthy, viable members of the industry, known for providing quality on a par with the products they sell.
p
**f«fc..
3̂-T''V r.̂ '
\V %̂ .n
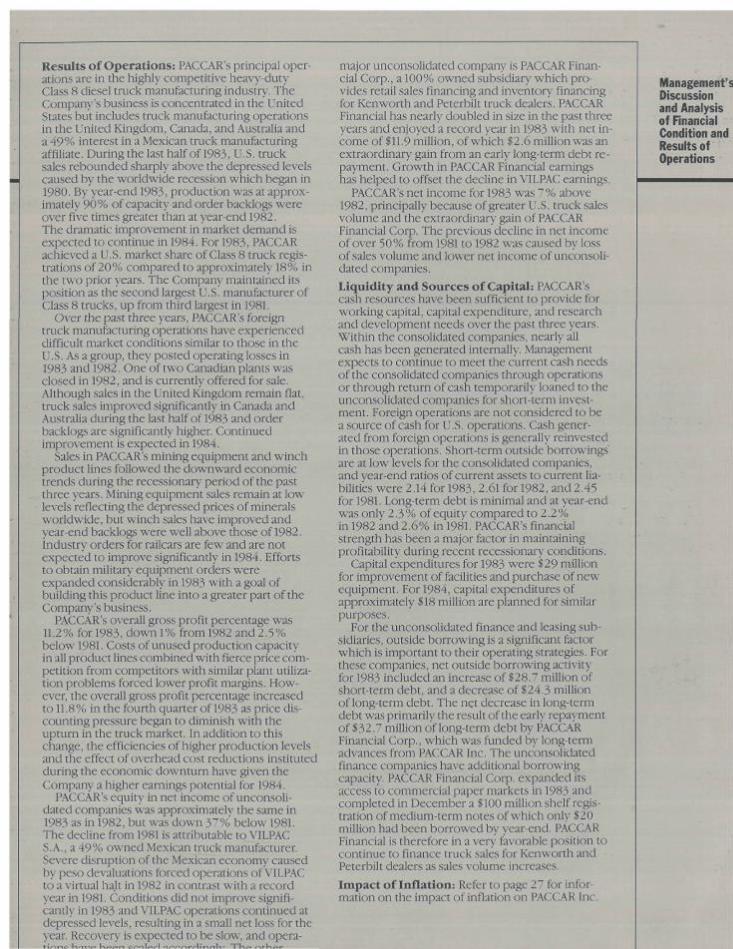
Results of Operations: PACCAR's principal operations are in the highly competitive heavy-duty Class 8 diesel truck manufacturing industry. The Company's business is concentrated in the United States but includes truck manufacturing operations in the United Kingdom, Canada, and Australia and a 49% interest in a Mexican truck manufacturing affiliate. During the last half of 1983, U.S. truck sales rebounded sharply above the depressed levels caused by the worldwide recession which began in 1980. By year-end 1983, production was at approximately 90% of capacity and order backlogs were over five times greater than at year-end 1982. The dramatic improvement in market demand is expected to continue in 1984. For 1983, PACCAR achieved a U.S. market share of Class 8 truck registrations of 20% compared to approximately 18%) in the two prior years. The Company maintained its position as the second largest U.S. manufacturer of Class 8 trucks, up from third largest in 1981.
Over the past three years, PACCAR's foreign truck manufacturing operations have experienced difficult market conditions similar to those in the U.S. As a group, they posted operating losses in 1983 and 1982. One of two Canadian plants was closed in 1982, and is currently offered for sale. Although sales in the United Kingdom remain flat, truck sales improved significantly in Canada and Australia during the last half of 1983 and order backlogs are significantly higher. Continued improvement is expected in 1984.
Sales in PACCAR's mining equipment and winch product lines followed the downward economic trends during the recessionary period of the past three years. Mining equipment sales remain at low levels reflecting the depressed prices of minerals worldwide, but winch sales have improved and year-end backlogs were well above those of 1982. Industry orders for railcars are few and are not expected to improve significantly in 1984. Efforts to obtain military equipment orders were expanded considerably in 1983 with a goal of building this product line into a greater part of the Company's business.
PACCAR's overall gross profit percentage was 11.2% for 1983, down 1% from 1982 and 2.5% below 1981. Costs of unused production capacity in all product lines combined with fierce price competition from competitors with similar pjant utilization problems forced lower profit margins. However, the overall gross profit percentage increased to 11.8% in the fourth quarter of 1983 as price discounting pressure began to diminish with the upturn in the truck market. In addition to this change, the efficiencies of higher production levels and the effect of overhead cost reductions instituted during the economic downturn have given the Company a higher earnings potential for 1984.
PACCAR's equity in net income of unconsolidated companies was approximately the same in 1983 as in 1982, but was down 37% below 1981. The decline from 1981 is attributable to VILPAC S.A., a 49% owned Mexican truck manufacturer. Severe disruption of the Mexican economy caused by peso devaluations forced operations of VILPAC to a virtual halt in 1982 in contrast with a record year in 1981. Conditions did not improve significantly in 1983 and VILPAC operations continued at depressed levels, resulting in a small net loss for the year. Recovery is expected to be slow, and opera-
major unconsolidated company is PACCAR Financial Corp., a 100% owned subsidiary which provides retail sales financing and inventory financing for Kenworth and Peterbilt truck dealers. PACCAR Financial has nearly doubled in size in the past three years and enjoyed a record year in 1983 with net income of S11.9 million, of which $2.6 million was an extraordinary gain from an early long-term debt repayment. Growth in PACCAR Financial earnings has helped to offset the decline in VILPAC earnings.
PACCAR's net income for 1983 was 7% above 1982, principally because of greater U.S. truck sales volume and the extraordinary gain of PACCAR Financial Corp. The previous decline in net income of over 50% from 1981 to 1982 was caused by loss of sales volume and lower net income of unconsolidated companies.
Liquidity and Sources of Capital: PACCAR's cash resources have been sufficient to provide for working capital, capital expenditure, and research and development needs over the past three years. Within the consolidated companies, nearly all cash has been generated internally. Management expects to continue to meet the current cash needs ofthe consolidated companies through operations or through return of cash temporarily loaned to the unconsolidated companies for short-term investment. Foreign operations are not considered to be a source of cash for U.S. operations. Cash generated from foreign operations is generally reinvested in those operations. Short-term outside borrowings are at low levels for the consolidated companies, and year-end ratios of current assets to current liabilities were 2.14 for 1983, 2.61 for 1982, and 2.45 for 1981. Long-term debt is minimal and at year-end was onlv 2.3% of equity compared to 2.2 % in 1982 and 2.6% in I98I. PACCAR's financial strength has been a major factor in maintaining profitability during recent recessionary conditions.
Capital expenditures for 1983 were $29 million for improvement of facilities and purchase of new equipment. For 1984, capital expenditures of approximately $ 18 million are planned for similar purposes.
For the unconsolidated finance and leasing subsidiaries, outside borrowing is a significant factor which is important to their operating strategies. For these companies, net outside borrowing activity for 1983 included an increase of $28.7 million of short-term debt, and a decrease of $24.3 million of long-term debt. The net decrease in long-term debt was primarily the result ofthe earlv repayment of $32.7 million of long-term debt by PACCAR Financial Corp., which was funded by long-term advances from PACCAR Inc. The unconsolidated finance companies have additional borrowing capacity. PACCAR Financial Corp. expanded its access to commercial paper markets in 1983 and completed in December a $100 million shelf registration of medium-term notes of which only $20 million had been borrowed by year-end. PACCAR Financial is therefore in a very favorable position to continue to finance truck sales for Kenworth and Peterbilt dealers as sales volume increases.
Impact of Inflation: Refer to page 27 for information on the impact of inflation on PACCAR Inc.
Management's Discussion and Analysis of Financial Condition and Results of Operations
1 K ^ ^ t - » cr'n]f^f-\ nr'r•r\rf^ir^^r^\r T'l-iiQ
Consolidated Balance Sheets
18
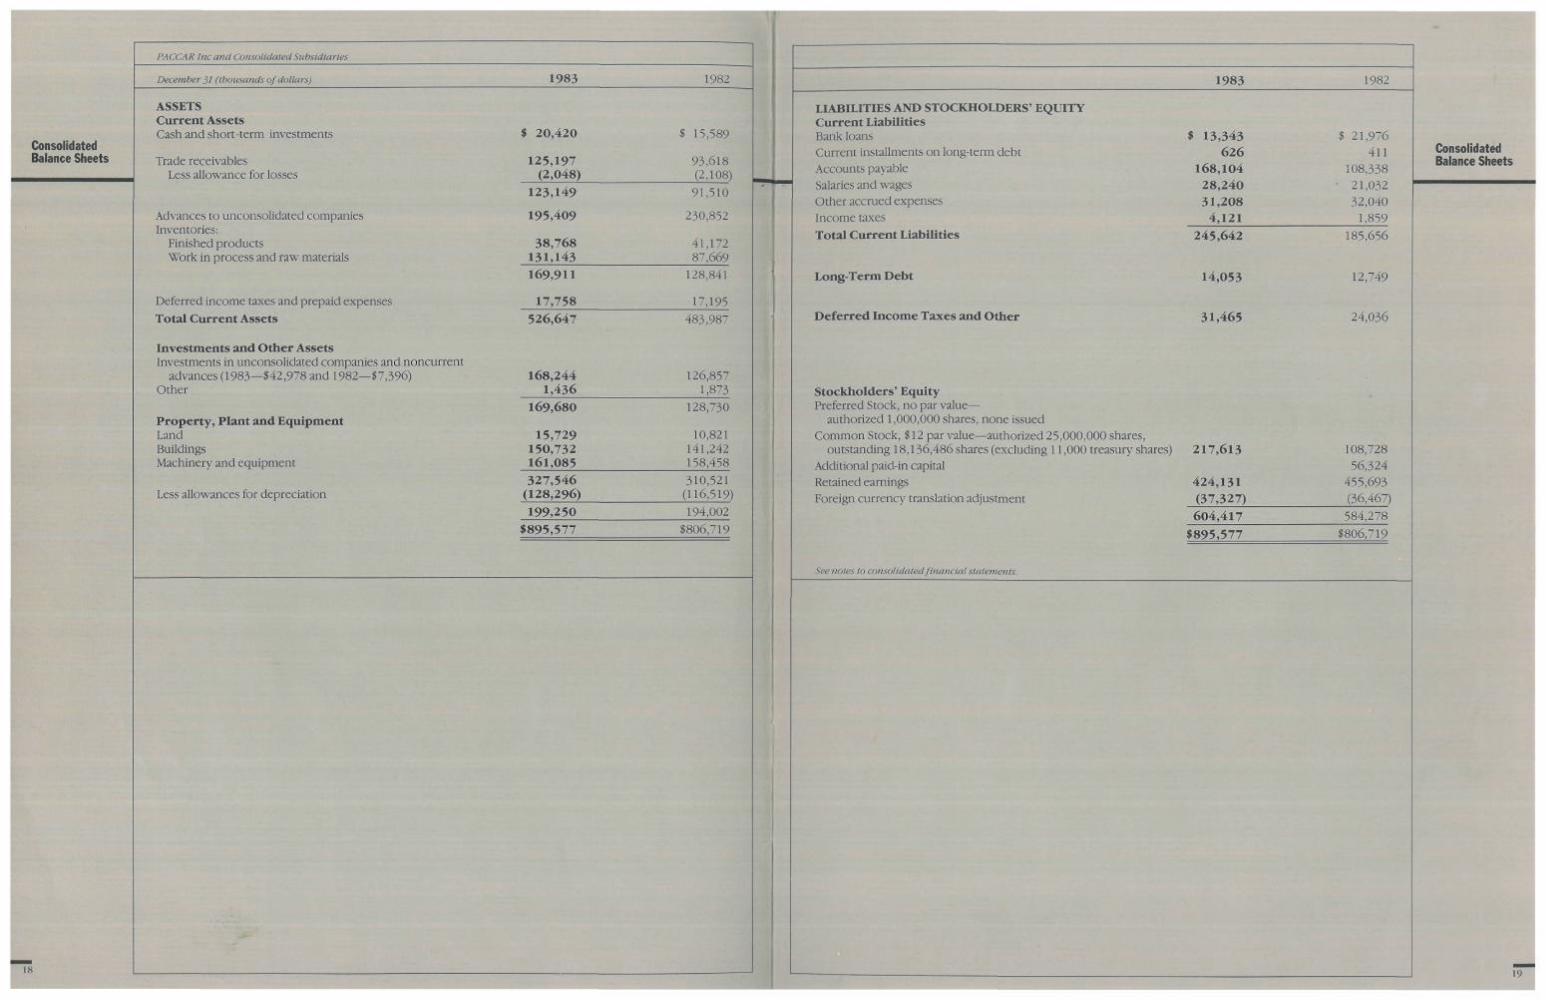
PACCAR Inc and Consolidated Subsidiaries
December 31 (thousands of dollars) 1983
ASSETS Current Assets Cash and short-term investments
Trade receivables Less allowance for losses
Advances to unconsolidated companies Inventories:
Finished products Work in process and raw materials
Deferred income taxes and prepaid expenses Total Current Assets
Investments and Other Assets Investments in unconsolidated companies and noncurrent
advances (1983—$42,978 and 1982—$7,396) Other
Property, Plant and Equipment Land Buildings Machinery and equipment
Less allowances for depreciation
$ 20,420
125,197 (2,048)
123,149
195,409
38,768 131,143 169,911
17,758 526,647
168,244 1,436
169,680
15,729 150,732 161,085
1982
$ 15,589
93,618 (2,108)
91,510
230,852
41,172 87,669
128,841
17,195 483,987
126,857 1,873
128,730
10,821 141,242 158,458
327,546 (128,296) 199,250
$895,577
310,521 (116,519) 194,002
$806,719
1983
LIABILITIES AND STOCKHOLDERS' EQUITY Current Liabilities Bank loans Current installments on long-term debt Accounts payable Salaries and wages Other accrued expenses Income taxes Total Current Liabilities
Long-Term Debt
Deferred Income Taxes and Other
Stockholders' Equity Preferred Stock, no par value—
authorized 1,000,000 shares, none issued Common Stock, $ 12 par value—authorized 25,000,000 shares,
outstanding 18,136,486 shares (excluding 11,000 treasury shares) Additional paid-in capital Retained earnings Foreign currency translation adjustment
See notes to consolidatedJinancial statements.
i 13,343 626
168,104 28,240 31,208
4,121 245,642
14,053
31,465
217,613
424,131 (37,327) 604,417
$895,577
1982
5 21,976 411
108,338 21,032 32,040
1,859 185,656
12,749
24,036
108,728 56,324
455,693 (36,467)
584,278 $806,719
Consolidated Balance Sheets
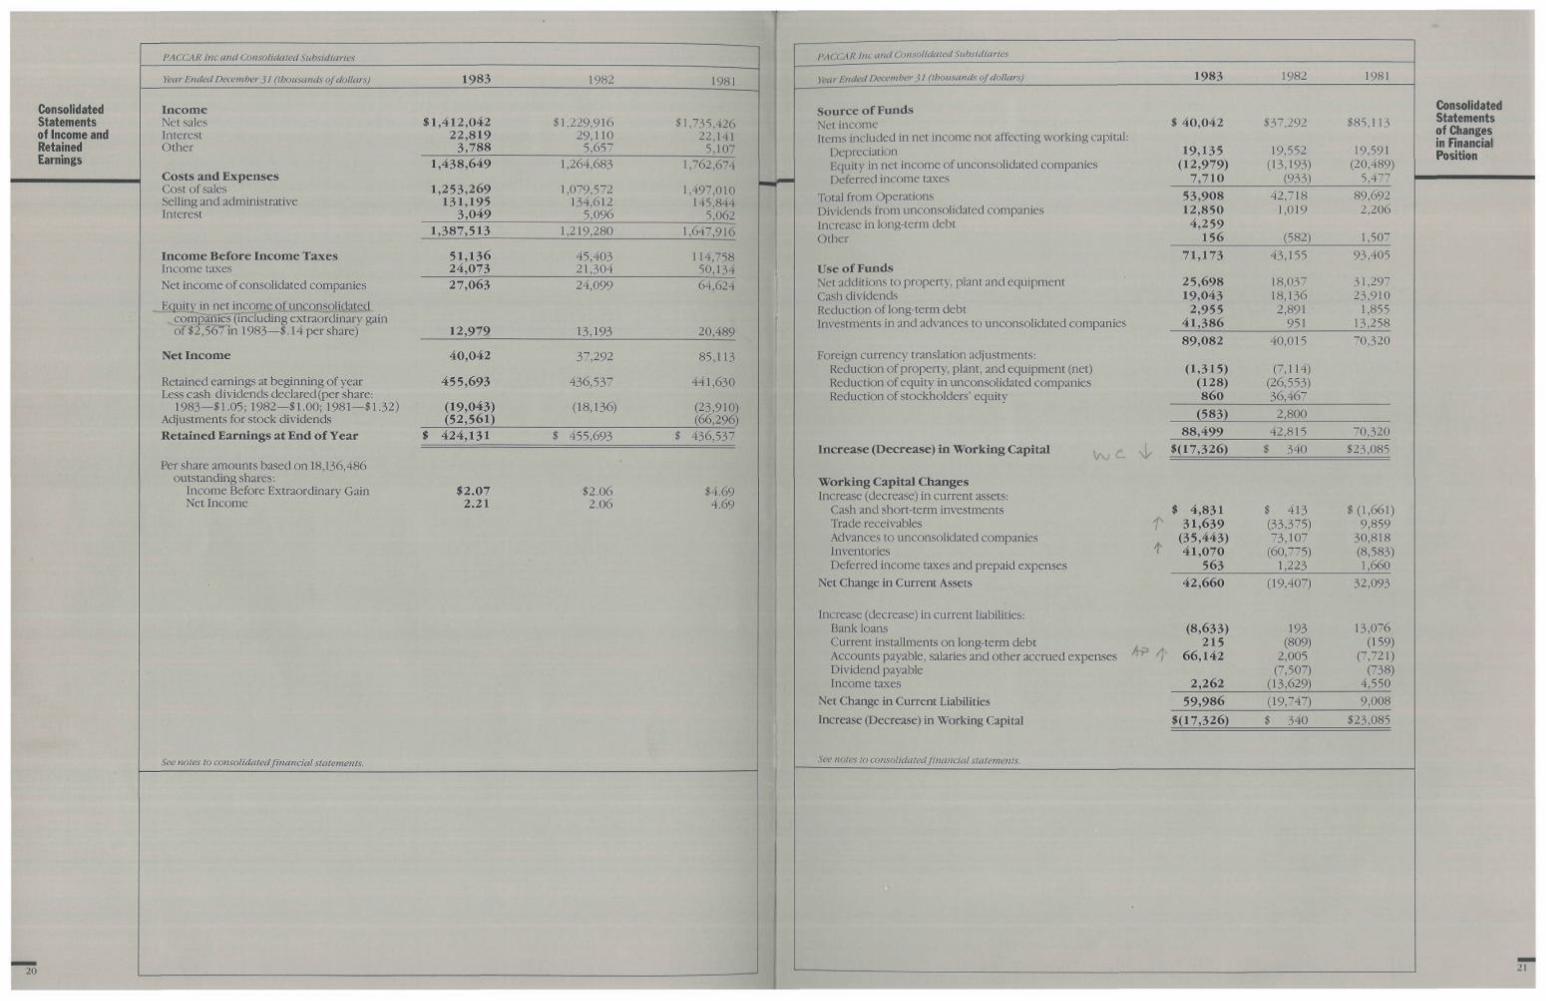
Consolidated Statements of Income and Retained Earnings
Income Net sales Interest Other
Costs and Expenses Costofsales Selling and administrative Interest
20
PA CCAR Inc and Consolidated Subsidiaries
Year Ended December 31 (thousands of dollars) 1983
Income Before Income Taxes Income taxes Net income of consolidated companies
Jlguity in net incoiiie.of unconsolidated _ companies (including extraordinarv gain
of $2,567 in 1983—$.14 per share)
27,063
12,979
See notes to consolidated financial statements.
1982
24,099
13,193
1981
11 ,412 ,042 22 ,819
3,788 1,438,649
1,253,269 131,195
3 ,049 1,387,513
51 ,136 24 ,073
$1,229,916 29,110
5,657
1,264,683
1,079,572 134,612
5,096 1,219,280
45,403 21,304
$1,735,426 22,141
5,107 1,762,674
1,497,010 145,844
5,062 1,647,916
114,758 50,134 64,624
20,489
Net Income
Retained earnings at beginning of year Less cash dividends declared (per share:
1983—$1.05; 1982—$1.00; 1981—$1.32) Adjustments for stock dividends Retained Earnings at End of Year
Per share amounts based on 18,136,486 outstanding shares;
Income Before Extraordinary Gain Net Income
40 ,042
455 ,693
(19,043) (52,561)
$ 424 ,131
$2.07 2.21
37,292
436,537
(18,136)
$ 455,693
$2.06 2.06
85,113
441,630
(23,910) (66,296)
$ 436,537
$4.69 4.69
PACCAR Inc and Consolidated Subsidiaries
Year Ended December 31 (thousands of dollars) 1983 1982
Source of Funds Net income Items included in net income not affecting working capital
Depreciation Equity in net income of unconsolidated companies Deferred income taxes
Total from Operations Dividends from unconsolidated companies Increase in long-term debt Other
Use ofFunds Net additions to property, plant and equipment Cash dividends Reduction of long-term debt Investments in and advances to unconsolidated companies
Foreign currency translation adjustments: Reduction of property, plant, and equipment (net) Reduction of equity in unconsolidated companies Reduction of stockholders' equity
Increase (Decrease) in Working Capital
Working Capital Changes Increase (decrease) in current assets:
Cash and short-term investments Trade receivables Advances to unconsolidated companies Inventories Deferred income taxes and prepaid expenses
Net Change in Current Assets
Increase (decrease) in current liabilities: Bank loans Current installments on long-term debt Accounts payable, salaries and other accrued expenses Dividend payable Income taxes
Net Change in Current Liabilities
$ 40,042
19,135 (12,979) 7,710
AT> /]<
42,660
(8,633) 215
66,142
Increase (Decrease) in Working Capital
,S'«' notes lo consolidated financial statements.
$37,292
19,552 (13,193)
(933)
(19,407)
193 (809)
2,005 (7,507)
1981
$85,113
19,591 (20,489)
5,477
53,908 12 ,850
4 ,259 156
71 ,173
25 ,698 19,043
2,955 panies 41 ,386
89 ,082
(1,315) (128) 8 6 0
(583)
88 ,499
\r.,C -i- «(17,326)
$ 4,831 f 31 ,639 ^ (35,443) T 41 ,070
563
42,718 1,019
(582)
43,155
18,037 18,136 2,891
951
40,015
(7,114) (26,553) 36,467
2,800
42,815
$ 340
$ 413 (33,375) 73,107
(60,775) 1,223
89,692 2,206
1,507
93,405
31,297 23,910
1,855 13,258
70,320
70,320
$23,085
$(1,661) 9,859
30,818 (8,583) 1,660
32,093
13,076 (159)
(7,721) (738)
2,262
59 ,986
$(17,326)
(13,629)
(19,747)
$ 340
4,550
9,008
$23,085
Consolidated Statements of Changes in Financial Position
PACCAR Inc and Consolidated Subsidiaries
December 31. 1983. 1982. and 1981 (thousands of dollars e.xcept for per share data)
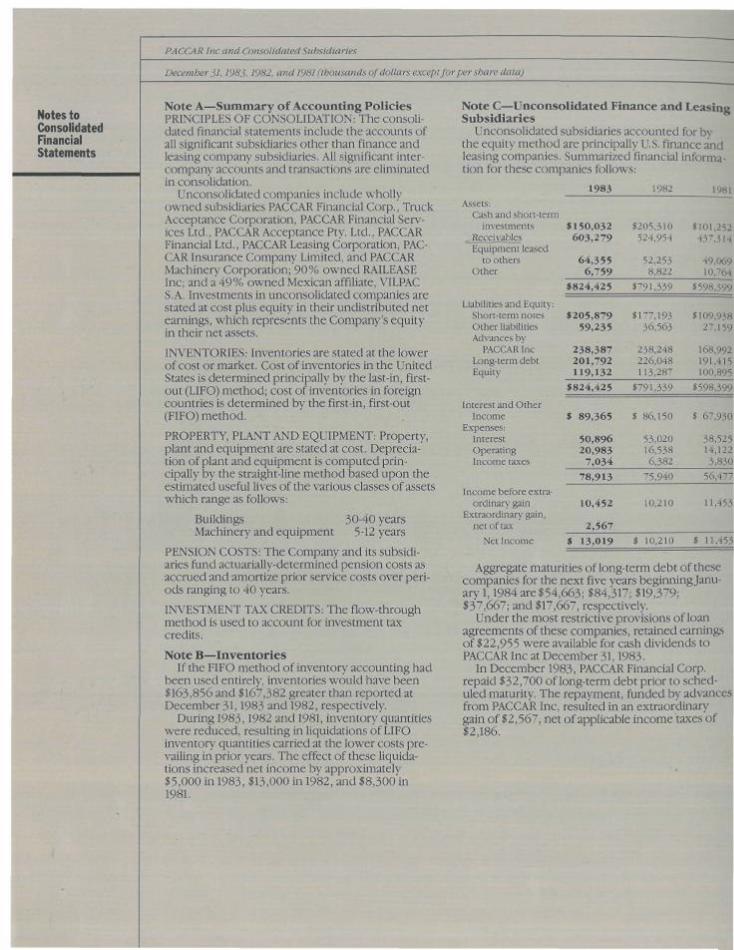
Notes to Consolidated Hnancial Statements
Note A—Summary of Accounting Policies PRINCIPLES OF CONSOLIDATION: The consolidated financial statements include the accounts of all significant subsidiaries other than finance and leasing company subsidiaries. All significant intercompany accounts and transactions are eliminated in consolidation.
Unconsolidated companies include wholly owned subsidiaries PACCAR Financial Corp., Truck Acceptance Corporation, PACCAR Financial Services Ltd., PACCAR Acceptance Pty. Ltd., PACCAR Financial Ltd., PACCAR Leasing Corporation, PACCAR Insurance Company Limited, and PACCAR Machinery Corporation; 90% owned RAILEASE Inc; and a 49% owned Mexican affiliate, VILPAC S.A. Investments in unconsolidated companies are stated at cost plus equity in their undistributed net earnings, which represents the Company's equity in their net assets.
IN'VENTORIES: Inventories are stated at the lower of cost or market. Cost of inventories in the United States is determined principally by the last-in, first-out (LIFO) method; cost of inventories in foreign countries is determined by the first-in, first-out (FIFO) method.
PROPERTY, PLANT AND EQUIPMENT: Property, plant and equipment are stated at cost. Depreciation of plant and equipment is computed principally by the straight-line method based upon the estimated useful lives of the various classes of assets which range as follows:
Buildings 30-40 years Machinery and equipment 5-12 years
PENSION COSTS: The Company and its subsidiaries fund actuarially-determined pension costs as accrued and amortize prior service costs over periods ranging to 40 years.
INVESTMENT TAX CREDITS: The flow-through method is used to account for investment tax credits.
Note B—Inventories If the FIFO method of inventory accounting had
been used entirely, inventories would have been $163,856 and $167,382 greater than reported at December 31,1983 and 1982, respectively.
During 1983,1982 and 1981, inventory quantities were reduced, resulting in liquidations of LIFO inventory quantities carried at the lower costs prevailing in prior years. The effect of these liquidations increased net income by approximately $5,000 in 1983, $13,000 in 1982, and $8,300 in 1981.
Note C—Unconsolidated Finance and Leasing Subsidiaries
Unconsolidated subsidiaries accounted for by the equity method are principally U.S. finance and leasing companies. Summarized financial information for these companies follows:
1983 1982 1981 Assets:
Cash and short-term investments
^ Receivables Equipment leased
to others Other
Liabilities and Equity: Short-term notes Other liabilities Advances by
PACCAR Inc Long-term debt Equity
Interest and Other Income
Expenses: Interest Operating Income taxes
Income before extraordinary' gain
Extraordinary gain, net of tax
Net Income
$150,032 603,279
64,355 6,759
$824,425
$205,879 59,235
238,387 201,792 119,132
$824,425
$ 89,365
50,896 20,983
7,034 78,913
10,452
2,567 $ 13,019
t205,310 524,954
52,253 8,822
S791,.1^9
8177,193 36,563
238,248 226,048 113,287
$791,339
% 86,150
53,020 16,538 6,382
75,940
10,210
$ 10,210
$101,252 437,314
49,069 10,764
8598,399
SI 09.938 27,159
168,992 191,415 100,895
$598,399
$ 67,930
38,525 14,122 3,830
56,477
11,453
$ 11,453
Aggregate maturities of long-term debt of these companies for the next five years beginning January 1,1984 are$54,663; $84,317; $19,379; $37,667; and $17,667, respectively.
Under the most restrictive provisions of loan agreements of these companies, retained earnings of $22,955 were available for cash dividends to PACCAR Inc at December 31,1983.
In December 1983, PACCAR Financial Corp. repaid $32,700 of long-term debt prior to scheduled maturity. The repayment, funded by advances from PACCAR Inc, resulted in an extraordinary gain of $2,567, net of applicable income taxes of $2,186.
PACCAR Inc and Consolidated Subsidiaries
Deceinher ^!. 1983, 1982. and 1981 (thousands of dollars except for per share data)
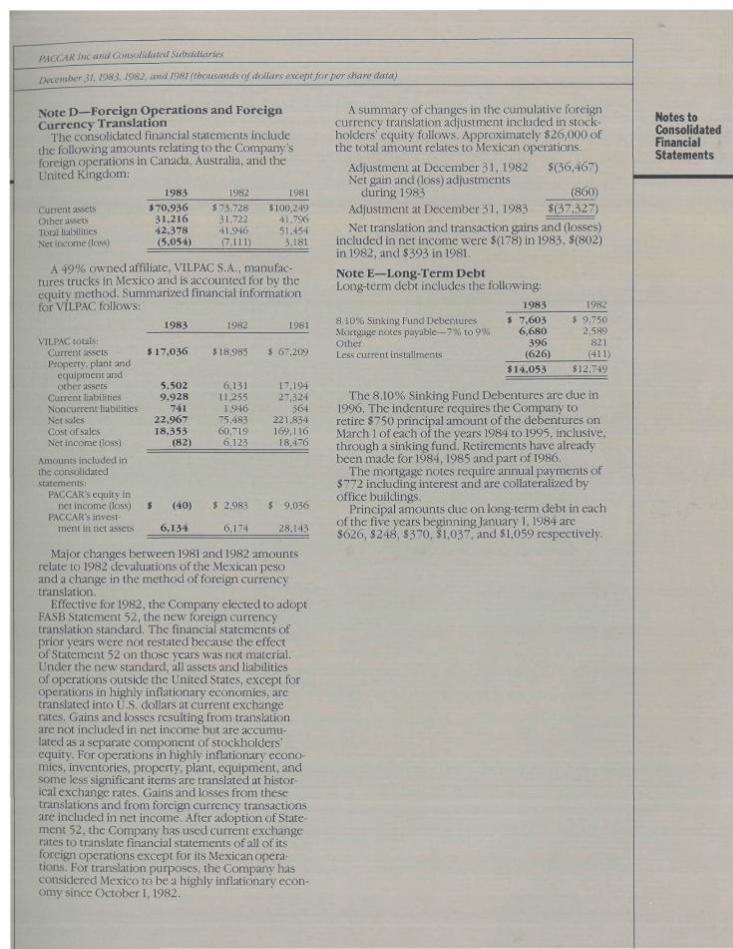
j^Qte D—Foreign Operations and Foreign Currency Translation
The consolidated financial statements include the following amounts relating to the Company's foreign operations in Canada, Australia, and the United Kingdom:
Current assets Other assets Total liabilities Net income (lo,s.s)
A 49% owned affiliate, VILPAC S.A., manufactures trucks in Mexico and is accounted for by the equity method. Summarized financial information for VILPAC follows:
1983 $70,936
31,216 42,378 (5,054)
1982 $ 73,728
31,722 41,946 (7,111)
1981
$100,249 41,796 51,454 3,181
1983 1982 1981 VILPAC totals;
Current assets Property, plant and
equipment and other assets
Current liabilities Noncurrent liabilities Net sales Cost of sales Net income (loss)
Amounts included in the consolidated statements:
PACCAR's equity in net income (loss)
PACCAR's investment in net assets
$17,036
5,502 9,928
741 22,967 18,353
(82)
* (40)
6,134
$18,985
6,131 11,255
1,946 75,483 60,719
6,123
$ 2,983
6,174
$ 67,209
17,194 27,324
364 221,834 169,116
18,476
$ 9,036
28,143
Major changes between 1981 and 1982 amounts relate to 1982 devaluations of the Mexican peso and a change in the method of foreign currency translation.
Effective for 1982, the Company elected to adopt FASB Statement 52, the new foreign currency translation standard. The flnancial statements of prior years were not restated because the effect of Statement 52 on those years was not material. Under the new standard, all assets and liabilities of operations outside the United States, except for operations in highly inflationary economies, are translated into U.S. dollars at current exchange rates. Gains and losses resulting from translation are not included in net income but are accumulated as a separate component of stockholders' equity. For operations in highly inflationary economies, inventories, property, plant, equipment, and some less significant items are translated at historical exchange rates. Gains and losses from these translations and from foreign currency transactions are included in net income. After adoption of Statement 52, the Company has used current exchange rates to translate financial statements of all of its foreign operations except for its Mexican operations. For translation purposes, the Company has considered Mexico to be a highly inflationary economy since October 1,1982.
A summary of changes in the cumulative foreign currency translation adjustment included in stockholders' equity follows. Approximately $26,000 of the total amount relates to Mexican operations.
Adjustment at December 31,1982 $(36,467) Net gain and (loss) adjustments
during 1983 (860) Adjustment at December 31,1983 $(37,327)
Net translation and transaction gains and (losses) included in net income were $(178) in 1983, $(802) in 1982, and $393 in 1981.
Note E—Long-Term Debt Long-term debt includes the following:
8.10% Sinking Fund Debentures Mortgage notes payable—7% to 9% Other Less current installments
The 8.10% Sinking Fund Debentures are due in 1996. The indenture requires the Company to retire $750 principal amount ofthe debentures on March 1 of each ofthe years 1984 to 1995, inclusive, through a sinking fund. Retirements have already been made for 1984,1985 and part of 1986.
The mortgage notes require annual payments of $772 including interest and are collateralized by office buildings.
Principal amounts due on long-term debt in each ofthe five years beginning January 1,1984 are $626, $248, $370, $1,037, and $1,059 respectively.
1983 $ 7,603
6,680 396
(626)
$14,053
1982 $ 9,750
2,589 821
(411
$12,749
Notes to Consolidated Financial Statements
Notes to Consolidated Financial Statements
PA CCAR Inc and Consolidated Subsidiaries
December 31. 1983. 1982, and 1981 (thousands of dollars except for per share data)
$17,735 127
1,597
$ 2,927
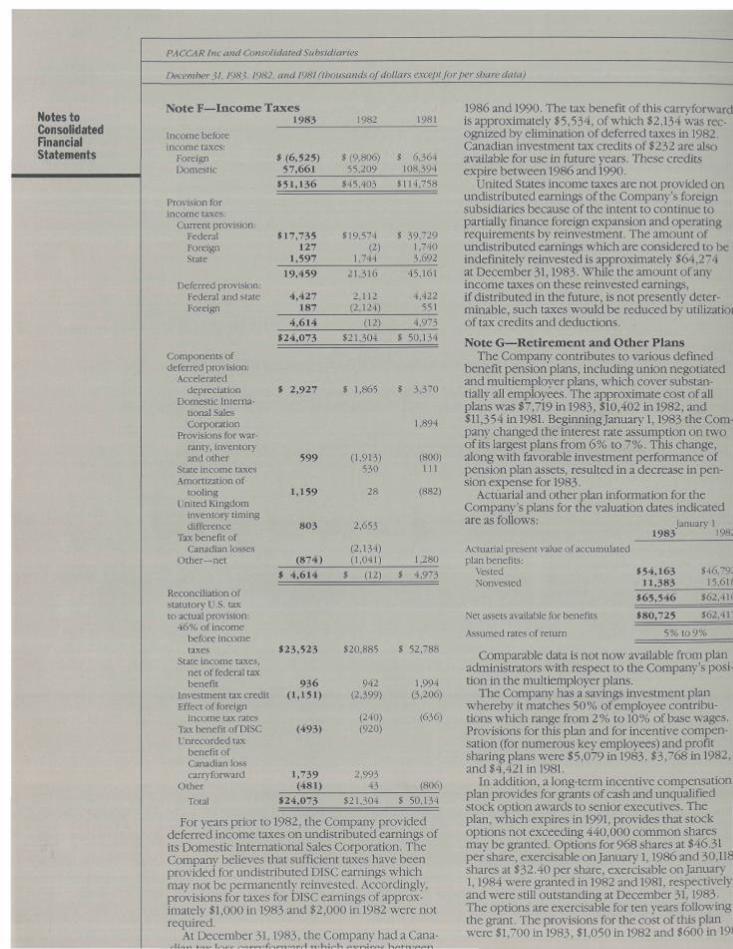
Note F—Income Taxes
Income before income taxes:
Foreign Domestic
Provision for income taxes:
Current provision: Federal Foreign State
Deferred provision: Federal and state Foreign
Components of deferred provision:
Accelerated depreciation
Domestic International Sales Corporation
Provisions for v̂ -ar-ranty, inventory and other
State income taxes Amortization of
tooling United Kingdom
inventory timing difference
Tax benefit of Canadian losses
Other—net
Reconciliation of statutory U.S. tax to actual provision:
46% of income before income taxes
State income taxes, net of federal tax benefit
Investment tax credit Effect of foreign
income tax rates Tax benefit of DISC Unrecorded tax
benefit of Canadian loss carryforward
Other
Total
1983
$ (6,525) 57,661
$51,136
1982
$ (9,806) 55,209
$45,403
1981
$ 6,364 108,394
$114,758
599
1,159
803
(874) $ 4,614
$23,523
936 (1,151)
(493)
1,739 (481)
$24,073
$19,574 $ 39,729 (2) 1,740
1,744 3,692
19,459
4,427 187
4,614
$24,073
21,316
2,112 (2,124)
(12) $21,304
45,161
4,422 551
4,973 $ 50,134
$ 1,865 $ 3,370
1,894
(1,913) (800) 530 111
28
2,653
$20,885
942 (2,399)
(240) (920)
2,993 43
(882)
(2,134) (1,041) 1,280
(12) $ 4,973
$ 52,788
1,994 (3,206)
(636)
(806)
$21,304 $ 50,134
For years prior to 1982, the Company provided deferred income taxes on undistributed earnings of its Domestic International Sales Corporation. The Company believes that sufficient taxes have been provided for undistributed DISC earnings which may not be permanently reinvested. Accordingly, provisions for taxes for DISC earnings of approximately $1,000 in 1983 and $2,000 in 1982 were not required.
At December 31,1983, the Company had a Cana-
1986 and 1990. The tax benefit of this carryforward is approximately $5,534, of which $2,134 was recognized by elimination of deferred taxes in 1982. Canadian investment tax credits of $232 are also available for use in fiature years. These credits expire between 1986 and 1990.
United States income taxes are not provided on undistributed earnings ofthe Company's foreign subsidiaries because of the intent to continue to partially finance foreign expansion and operating requirements by reinvestment. The amount of undistributed earnings which are considered to be indefinitely reinvested is approximately $64,274 at December 31,1983. While the amount of any income taxes on these reinvested earnings, if distributed in the future, is not presently determinable, such taxes would be reduced by utilizatioi of tax credits and deductions.
Note G—Retirement and Other Plans The Company contributes to various defined
benefit pension plans, including union negotiated and multiemployer plans, which cover substantially all employees. The approximate cost of all plans was $7,719 in 1983, $10,402 in 1982, and $11,354 in 1981. Beginning January 1,1983 the Company changed the interest rate assumption on two of its largest plans from 6% to 7%. This change, along with favorable investment performance of pension plan assets, resulted in a decrease in pension expense for 1983.
Actuarial and other plan information for the Company's plans for the valuation dates indicated are as follows: January 1
1983 • 198.
Actuarial present value of accumulated plan benefits:
Vested Nonvested
Net assets available for benefits
Assumed rates of return
Comparable data is not now available from plan administrators with respect to the Company's position in the multiemployer plans.
The Company has a savings investment plan whereby it matches 50% of employee contributions which range from 2% to 10% of base wages. Provisions for this plan and for incentive compensation (for numerous key employees) and profit sharing plans were $5,079 in 1983, $3,768 in 1982, and $4,421 in 1981.
In addition, a long-term incentive compensation plan provides for grants of cash and unqualified stock option awards to senior executives. The plan, which expires in 1991, provides that stock options not exceeding 440,000 common shares may be granted. Options for 968 shares at $46.31 per share, exercisable on January 1,1986 and 30,118 shares at $32.40 per share, exercisable on January 1,1984 were granted in 1982 and 1981, respectively and were still outstanding at December 31,1983-The options are exercisable for ten years following the grant. The provisions for the cost of this plan were $1,700 in 1983, $1,050 in 1982 and $600 in 19!
$54,163 11,383
$65,546
$80,725
$46,79; 15,61!
$62,41(
$62,41"
5% to 9%
it,.\CCAR Inc and Consolidated Subsidiaries
December W. 1983. 1982. and 1981 (thoitsands of dollars except for fier share data)
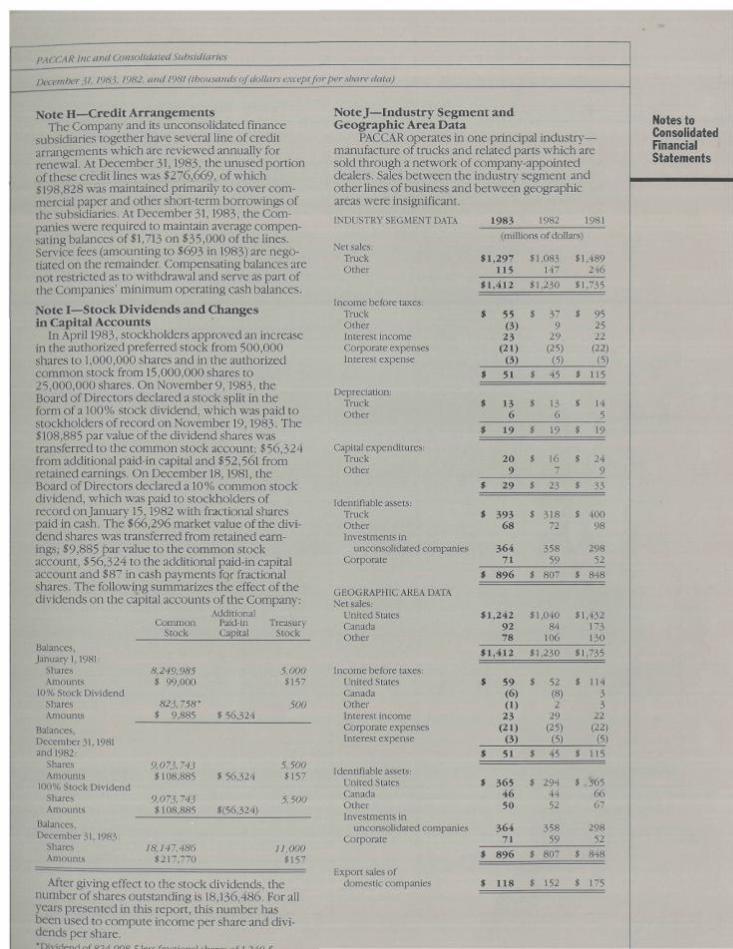
Note H—Credit Arrangements The Company and its unconsolidated finance
subsidiaries together have several line of credit arrangements which are reviewed annually for renewal. At December 31,1983, the unused portion of these credit lines was $276,669, of which $198,828 was maintained primarily to cover commercial paper and other short-term borrowings of the subsidiaries. At December 31,1983, the Companies were required to maintain average compensating balances of $1,713 on $35,000 ofthe lines. Service fees (amounting to $693 in 1983) are negotiated on the remainder. Compensating balances are not restricted as to withdrawal and serve as part of the Companies' minimum operating cash balances.
Note I—Stock Dividends and Changes in Capital Accounts
In April 1983, stockholders approved an increase in the authorized preferred stock from 500,000 shares to 1,000,000 shares and in the authorized common stock from 15,000,000 shares to 25,000,000 shares. On November 9,1983, the Board of Directors declared a stock split in the form of a 100% stock dividend, which was paid to stockholders of record on November 19,1983. The $108,885 par value ofthe dividend shares was transferred to the common stock account; $56,324 from additional paid-in capital and $52,561 from retained earnings. On December 18,1981, the Board of Directors declared a 10% common stock dividend, which was paid to stockholders of record on January 15,1982 with fractional shares paid in cash. The $66,296 market value ofthe dividend shares was transferred from retained earnings; $9,885 par value to the common stock account, $56,324 to the additional paid-in capital account and $87 in cash payments for fractional shares. The following summarizes the effect ofthe dividends on the capital accounts of the Company:
Additional Common Paid-in Treiisury
Stock Capital Stock
Balances, January 1,1981:
Shares Amounts
10% Stock Dividend Shares
Amounts
Balances, December 31,1981 and 1982:
Shares Amounts
100% Stock Dividend Shares Amounts
Balances, December 31,1983:
Shares Amounts
8,249,985 S 99,000
823,758' $ 9,885
5,000 $157
500 $ 56,324
9,073.743 $108,885
9,073,743 $ 108,885
$ 56,324
$(56,324)
5,500 $157
5.500
18,147,486 $217,770
11,000 $157
After giving effect to the stock dividends, the number of shares outstanding is 18,136,486. For all years presented in this report, this number has been used to compute income per share and dividends per share. "niviflf'nH r\f Qlyi one c l̂ r<. (,.„r.ti^^^\ ..K ^e t ^/it\ r
Note J—Industry Segment and Geographic Area Data
PACCAR operates in one principal industry— manufacture of trucks and related parts which are sold through a network of company-appointed dealers. Sales between the industry segment and other lines of business and between geographic areas were insignificant.
INDUSTRY SEGMENT DATA
Net sales: Truck Other
Income before taxes: Truck Other Interest income Corporate expenses Interest expen.se
1983 1982 1981
(millions of dollars)
$ 1 , 2 9 7 115
81,083 $1,489 147 246
$1 ,412 $1,230 $1,735
55 (3)
23 (21)
(3)
37 9
29 (25)
(5)
Depreciation: Truck Other
Capital expenditures: Truck Other
Identifiable a,ssets: Truck Other Investments in
unconsolidated companies Corporate
GEOGRAPHIC AREA DATA Net sales:
United States Canada Other
Income before taxes: United States Canada Other Interest income Corporate expenses Interest expense
Identifiable assets: United States Canada Other Investments in
unconsolidated companies Corporate
Export sales of domestic companies
3 6 4 71
358 59
59 (6) (1)
23 (21)
(3)
52 (8) 2
29 (25)
(5)
95 25 22
(22) (5)
$
$
$
$
51
13 6
19
20 9
29
$
S
s
$
$
45
6
19
16 7
23
S
$
$
$
s
115
14 5
19
24 9
33
$ 3 9 3 $ 318 $ 400 6 8 72 98
298 52
$ 8 9 6 $ 807 $ 848
$1 ,242 $1,040 $1,432 92 84 173 78 106 130
$1 ,412 $1,230 $1,735
114 3 3
22 (22)
(5)
$ 51 $ 45 $ 115
$ 365 $ 294 $ . 365 46 44 66 50 52 67
364 71
$ 896
$ 118
358 59
$ 807
$ 152
298 52
$ 848
$ 17S
Notes to Consolidated Hnancial Statements
PACCAR Inc and Consolidated .Subsidiaries
December 31. 1983. 1982, and 1981 (thimsands of dollars except for per share data)
Notes to Consolidated Financial Statements
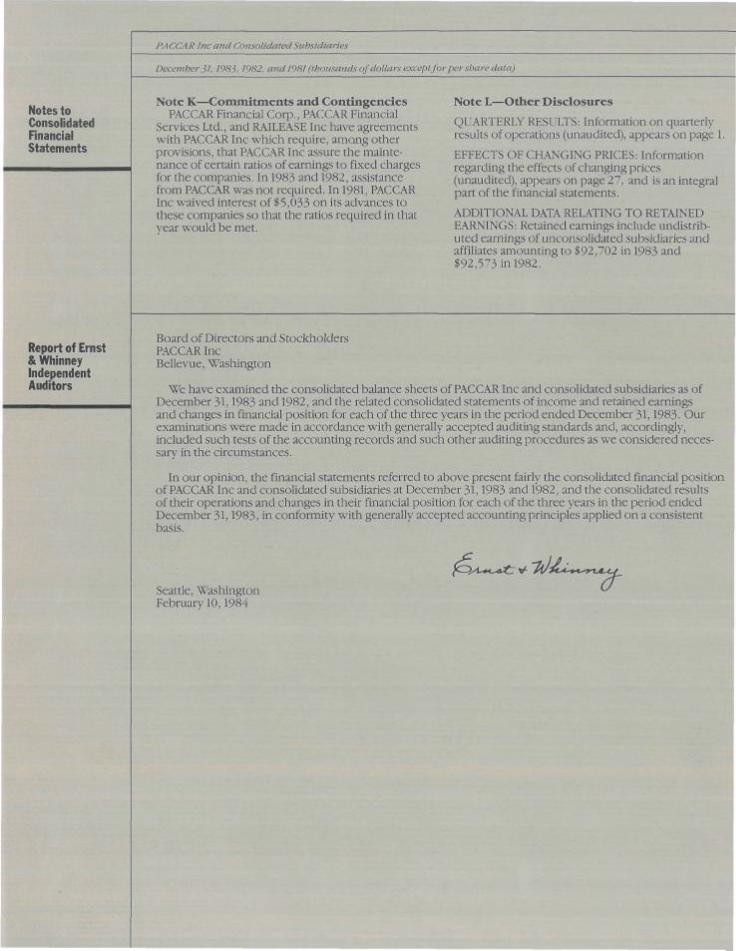
Note K—Commitments and Contingencies PACCAR Financial Corp., PACCAR Financial
Services Ltd., and RAILEASE Inc have agreements with PACCAR Inc which require, among other provisions, that PACCAR Inc assure the maintenance of certain ratios of earnings to fixed charges for the companies. In 1983 and 1982, assistance from PACCAR was not required. In 1981, PACCAR Inc waived interest of $5,033 on its advances to these companies so that the ratios required in that year would be met.
Note L—Other Disclosures QUARTERLY RESULTS: Information on quarterly results of operations (unaudited), appears on page 1.
EFFECTS OF CHANGING PRICES: Information regarding the effects of changing prices (unaudited), appears on page 27, and is an integral part ofthe flnancial statements.
ADDITIONAL DATA RELATING TO RETAINED EARNINGS: Retained earnings include undistributed earnings of unconsolidated subsidiaries and afflliates amounting to $92,702 in 1983 and $92,573 in 1982.
Report of Ernst & Whinney independent Auditors
Board of Directors and Stockholders PACCAR Inc Bellevue, Washington
We have examined the consolidated balance sheets of PACCAR Inc and consolidated subsidiaries as of December 31,1983 and 1982, and the related consolidated statements of income and retained earnings and changes in financial position for each ofthe three years in the period ended December 31,1983. Our examinations were made in accordance with generally accepted auditing standards and, accordingly, included such tests ofthe accounting records and such other auditing procedures as we considered necessary in the circumstances.
In our opinion, the financial statements referred to above present fairly the consolidated financial position of PACCAR Inc and consolidated subsidiaries at December 31,1983 and 1982, and the consolidated results of their operations and changes in their financial position for each ofthe three years in the period ended December 31,1983, in conformity with generally accepted accounting principles applied on a consistent basis.
4 >J-«-<tCrv'
Seattle, Washington February 10,1984
PACCAR Inc and Consolidated Subsidiaries
(thousands of dollars except for per share data)
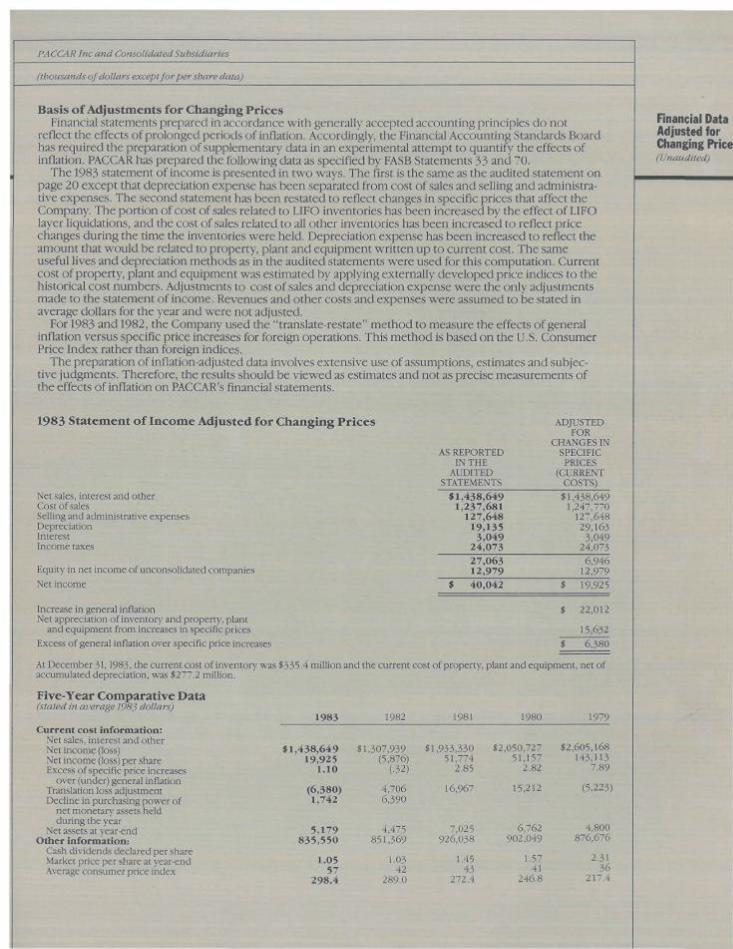
Basis of Adjustments for Clianging Prices Financial statements prepared in accordance with generally accepted accounting principles do not
reflect the effects of prolonged periods of inflation. Accordingly, the Financial Accounting Standards Board has required the preparation of supplementary data in an experimental attempt to quantify the effects of inflation. PACCAR has prepared the following data as specified by FASB Statements 33 and 70.
The 1983 statement of income is presented in two ways. The first is the same as the audited statement on page 20 except that depreciation expense has been separated from cost of sales and selling and administrative expenses. The second statement has been restated to reflect changes in specific prices that affect the Company. The portion of cost of sales related to LIFO inventories has been increased by the effect of LIFO layer liquidations, and the cost of sales related to all other inventories has been increased to reflect price changes during the time the inventories were held. Depreciation expense has been increased to reflect the amount that would be related to property, plant and equipment written up to current cost. The same useful lives and depreciation methods as in the audited statements were used for this computation. Current cost of property, plant and equipment was estimated by applying externally developed price indices to the historical cost numbers. Adjustments to cost of sales and depreciation expense were the only adjustments made to the statement of income. Revenues and other costs and expenses were assumed to be stated in average dollars for the year and were not adjusted.
For 1983 and 1982, the Company used the "translate-restate" method to measure the effects of general inflation versus specific price increases for foreign operations. This method is based on the U.S. Consumer Price Index rather than foreign indices.
The preparation of inflation-adjusted data involves extensive use of assumptions, estimates and subjective judgments. Therefore, the results should be viewed as estimates and not as precise measurements of the effects of inflation on PACCAR's financial statements.
Financial Data Adjusted for Changing Price (Unaudited)
1983 Statement of Income Adjusted for Changing Prices
Net sales, interest and other Cost of sales Selling and administrative expenses Depreciation Interest Income taxes
Equity in net income of unconsolidated companies Net income
Increase in general inflation Net appreciation of inventory and property, plant
and equipment from increases in specific prices Excess of general inflation over specific price increases
At December 31,1983, the current cost of inventory was $335.4 million and the current cost of property, plant and equipment, net of accumulated depreciation, was $277.2 million.
AS REPORTED IN THE
AUDITED STATEMENTS
$1,438,649 1,237,681
127,648 19,135
3,049 24,073 27,063 12,979
$ 40,042
ADJUSTED FOR
CHANGES IN SPECIFIC
PRICES (CURRENT
COSTS)
$1,438,649 1,247,770
127,648 29,163
3,049 24,073
6,946 12,979
$ 19,925
$ 22,012
15,632
$ 6,380
Five-Year Comparative Data (stated in average 1983 dollars)
Current cost information: Net sales, interest and other Net income (loss) Net income (loss) per share Excess of specific price increases
over (under) general inflation Translation loss adjustment Decline in purchasing power of
net monetary assets held during the year
Net assets at year-end Other information:
(;ash dividends declared per share Market price per share at year-end Average consumer price index
1983 1982 1981 1980 1979
$1,438,649 19,925
1.10
(6,380) 1,742
5,179 835,550
1.05 57
298.4
$1,.307,939 (5,876)
(•32)
4,706 6,390
4,475 851,369
1,03 42
289.0
$1,933,330 51,774
2.85
16,967
7,025 926,038
1.45 43
272.4
$2,050,727 51,157
2.82
15,212
6,762 902,049
1.57 41
246.8
$2,605,168 143,113
7.89
(5,223)
4,800 876,676
2.31 36
217.4
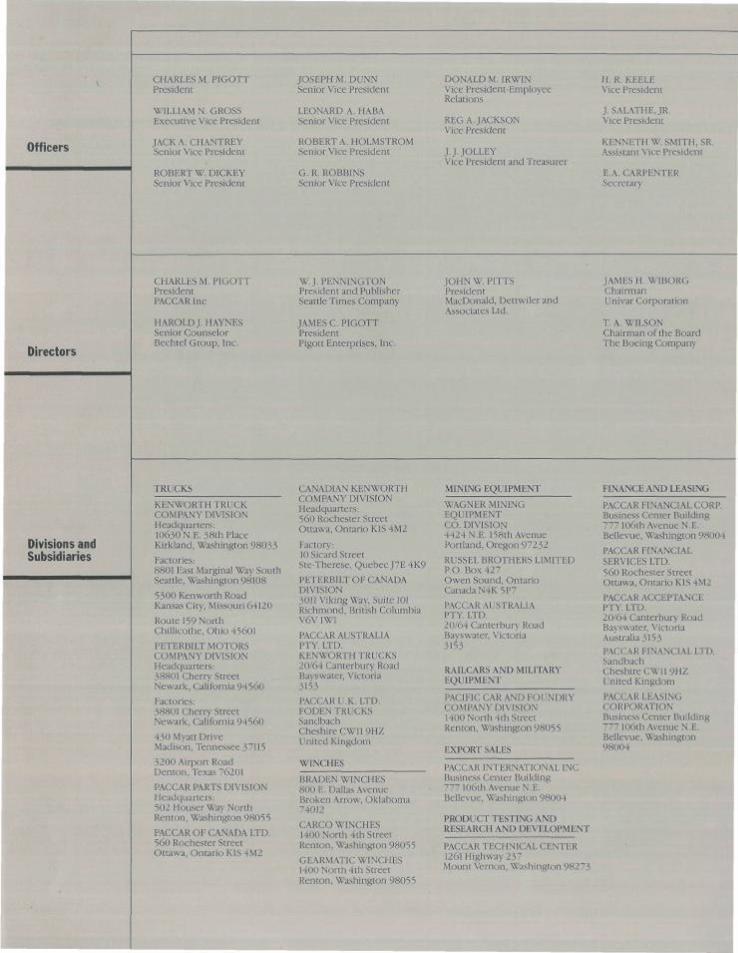
ifficers
Directors
Divisions and Subsidiaries
C;HARI.ES M. PIGOTT President
WILLIAM N. GROSS Executive Vice President
JACK A. CHANTREY Senior Vice President
ROBERT W. DICKEY Senior Vice President
JOSEPH M. DUNN Senior Vice President
LEONARD A. HABA Senior Vice President
ROBERT A. HOLMSTROM Senior Vice President
G. R. ROBBINS Senior Vice President
DONALD M.IRWIN Vice President-Employee Relations
REG A. JACKSON Vice President
J.J.JOLLEY Vice President and Treasurer
H, R, KEELE Vice President
J. SALATHE, JR. Vice President
KENNETH W. SMITH, SR. Assistant Vice President
E.A, CARPENTER Secretary
CHARLES M. PIGOTT President PACCAR Inc
HAROLD J. HAYNES Senior Counselor Bechtel Group, Inc.
W.J.PENNINGTON President and Publisher Seattle Times Company
JAMES C. PIGOTT President Pigott Enterprises, Inc.
JOHN W. PITTS President MacDonald, Dettwiler and As,sociates Ltd.
JAMES H. WIBORG Chairman Univar Corporation
T. A. WILSON Chairman of the Board The Boeing Company
TRUCKS
KENWORTH TRUC;K COMPANY DIVISION Headquarters: 10630 N.E. 38th Place Kirkland, Washington 98033
Factories: 8801 East Marginal Wav South Seattle, Washington 98108
5300 Kenworth Road Kansas City, MLsstJuri 64120
Route 159 North C:hillicothe, Ohio 45601
PETERBILT MOTORS COMPANY DIVISION Headquarters: 38801 Cherry Street Newark, California 94560
Factories: 38801 Cherry .Street Newark, California 94560
430 Myatt Drive Madison, Tennes.see 37115
3200 Airport Road Denton, Texas 76201
PACCAR PARTS DIVISION Headquarters: 502 Houser Way North Renton, Washington 98055
PACCAR OF CANADA LTD. 560 Rochester Street Ottawa, Ontario KIS 4M2
CANADIAN KENWORTH COMPANY DIVISION Headquarters: 560 Rochester Street Ottawa, Ontario KIS 4M2
Factory: 10 Sicard Street Ste-There.se, Quebec J7E 4K9
PETERBILT OF CANADA DIVISION 3011 Viking Way, Suite 101 Richmond, British Columbia V6V IWl
PACCAR AUSTIWLIA PTY. LTD. KENWORTH TRUCKS 20/64 Canterbury Road Bayswater, Victoria 3153
PACC;AR U.K. LTD. FODEN TRUCKS Sandbach Cheshire CWll 9HZ United Kingdom
WINCHES
BRADEN WINCHES 800 E. Dallas Avenue Broken Arrow, Oklahoma 74012
CARCO WINCHES 1400 North 4th Street Renton, Washington 98055
GEARMATIC WINCHES 1400 North 4th Street Renton, Washington 98055
MINING EQUIPMENT
WAGNER MINING EQUIPMENT CO. DIVISION 4424 N.E. 158th Avenue Portland, Oregon 97232
RUSSEL BROTHERS LIMITED RO. Box 427 Owen Sound, Ontario Canada N4K 5P7
PACCAR AUSTRALIA PTY. LTD. 20/64 Canterbury Road Bayswater, Victoria 3153
RAILC;ARS AND MILITARY EQUIPMENT
PACIFIC CAR AND FOUNDRY COMPANY DIVISION 1400 North 4th Street Renton, Washington 98055
EXPORT SALES
PAC;CAR INTERNATIONAL INC Business Center Building 777 106th Avenue N.E. Bellevue, Washington 98004
PRODUCT TESTING AND RESEARCH AND DEVELOPMENT
PACCAR TECHNICAL CENTER 1261 Highway 237 Mount Vernon, Washington 98273
FINANCE AND LEASING
PACCAR FINANCIAL CORP. Business Center Building 777106th Avenue N.E. Bellevue, Washington 98004
PACCAR FINANCIAL SERVICES LTD. 560 Rochester Street Ottawa, Ontark) KIS 4M2
PACCAR ACCEPTANCE PTY. LTD. 20/64 Canterbury Road Bayswater, Victoria Australia 3153 PACCAR FINANCIAL LTD. Sandbach Cheshire CWll 9HZ United Kingdom
PACCAR LEASING CORPORATION Business Center Building 777 106th Avenue N.E. Bellevue, Washington 98004