p.1a organizational environment segment business … market segment business is responsible for its...
TRANSCRIPT

2003 AS Malcolm Baldrige Application Summary
1
ORGANIZATIONAL PROFILE
P.1a Organizational Environment The Boeing Aerospace Support (AS) organization is part of the Boeing Company, the largest aerospace company in the world. Boeing employs approximately 163,500 people in 60 countries worldwide. Two major business units report to the Boeing World Headquarters: Commercial Airplanes and Integrated Defense Systems (IDS). AS is part of the IDS business unit and is collocated with IDS headquarters in St. Louis, Missouri. We support both US and international customers. Boeing is the only aircraft manufacturer with a dedicated, integrated organization focused on providing support systems and services.
Military aircraft programs are generally divided into three phases: development/design, production, and support with the duration shown in Figure P.1-1. In 1993, some support services were grouped to provide focus on the support phase of the aircraft’s life cycle, which can be 60-75 years. This organization was refined and consolidated in 1997 to align our business elements to the needs of our customers; to show our unique ability to support aircraft throughout their life cycle and thereby establish ourselves as the market leader for the full range of aircraft support, or sustainment services; and to increase efficiency and effectiveness by combining similar operations. In the support phase, aircraft have already been delivered and are in use by the customers. Our products and services include maintenance, modification, repair, training, and spare parts (Figure P.1-2).
AircraftDevelopment
5+ Years 2+ Years 60+ Years
ProductionLife CycleSupport
Figure P.1-1. Aircraft life cycle
We are a matrix organization that is divided into businesses, sites and functions. To address support needs AS is composed of six market segment businesses, two small joint ventures, and a subsidiary. The six market segment businesses are Training Systems and Services (TS&S), Spares and Technical Data (S&TD), Modifications and Upgrades (M&U), Contractor Logistics Support and Services (CLS&S), Maintenance and Modifications (M&M), and Life Cycle Customer Support (LCCS). Each market segment business is responsible for its own profit, loss, and market growth. The market segment businesses are further divided into programs, which reside on one or more sites. All the businesses have work accomplished at multiple sites.
Our sites are geographic entities, and are often collocated with our customers. Sites focus on efficient execution of plans to support the businesses. Of the nine major sites, eight are located within the continental US and one in Australia. A function is a discipline such as Engineering, Information Technology, or Human Resources (HR), which provides people, processes, and tools to businesses and sites. Businesses, sites and functions have defined responsibilities, authority, and accountability (RAA) for their respective organizations.
P.1a(1) Our main products and services are shown in Figure P.1-2, along with delivery mechanisms to the customers.
Market Segment Business Product/Service Delivery Mechanism
Aircraft flight and maintenance simulators
Installed at customer site
Aircrew and maintenance training
Performed by techni-cians at customer sites
Courseware development
Transmitted electronic-ally to customer sites
Training Systems and Services (TS&S)
Classroom/field training Performed by instructors Aircraft spare parts, repairs, and retrofit kits
Delivered to various customer sites Spares and
Technical Data (S&TD)
Technical publications (aircraft manuals and other information)
Delivered electronically or hardcopy to customer sites
Moderni-zation and Upgrades (M&U)
Aircraft modernization programs, re-engining, structural modifications, avionic systems upgrades
Performed at both AS and customer sites
Contractor Logistics Support and Services (CLS&S)
Personnel services, modification support, engineering technical services, field aircraft maintenance and technical support
Performed at both AS and customer sites
Major aircraft modifications and life extension programs
Performed at AS sites Mainte-nance and Modifica-tions (M&M)
Field maintenance and modification support
Performed at customer sites
Life Cycle Customer Support (LCCS)
Integration of multiple support elements into a single program
Delivered to various customer and AS sites
GP40023002.doc
Figure P.1-2. Our products and services
P.1a(2) Primary responsibility for the support phase of a military aircraft system has traditionally belonged to the US Government or military services (USAF, USN, USMC or US Army). As the overall DoD budget began to decrease, commercial contractors expanded their focus on this market opportunity. The result is a highly competitive market. We successfully operate in this environment by competing from a best-value position, which leverages our aircraft design, development and production capabilities with our ability to deliver an integrated support solution at a competitive price. In this context, customer satisfaction and performance to plan, or execution efficiency, are extremely important factors in our success. Our vision, mission, and values, shown in Figure P.1-3, demonstrate our commitment to provide best value solutions for supporting military aircraft. P.1a(3) Our employees have a variety of skills enabling us to offer diverse support services. The employee skill mix at each location is dependent on the operations conducted at the site. P.1a(4) We have over 13,000 employees at more than 130 locations worldwide. Each site has the facilities, tools, personnel and technologies required to execute the work performed at that

2003 AS Malcolm Baldrige Application Summary
2
Boeing Vision 2016 People working together as a global enterprise for aerospace leadership
Boeing and AS Values • Leadership • People Working Together • Integrity • A Diverse and Involved Team • Customer Satisfaction • Good Corporate Citizenship • Quality • Enhancing Shareholder Value
AS Vision People working together as the world’s number one provider of innovative sustainment solutions
AS Mission Provide world-class sustainment solutions to our aerospace customers
GP40023003.doc
Figure P.1-3. Our vision, values and mission
location. Our major technologies, equipment and facilities vary across our businesses and sites. Because of the nature of our business, our facilities include multi-acre sites with large hangar and ramp space as well as office facilities and labs. We comply with all Safety, Health and Environmental Affairs (SHEA) and Occupational Safety and Health Administration (OSHA) requirements and address safety considerations at each site appropriate to the work accomplished there. P.1a(5) We operate under a variety of regulations from multiple federal government agencies. Other regulations are site-dependent, as determined by local laws. We ensure compliance to these requirements through regular audits and corrective actions. We anticipate regulatory challenges by participating in committees that guide regulation development and by sharing knowledge and people between AS and IDS functional organizations. Issues affecting multiple sites are reviewed and discussed at our leadership meetings. P.1b Organizational Relationships P.1b(1) The Boeing Company provides the systems, procedures and processes that define how AS is governed. For example, as expressed in the Boeing values, we expect every employee to “always take the high road by practicing the highest ethical standards.” Boeing meets New York Stock Exchange recommendations and requirements of the Sarbanes-Oxley Act for publicly traded companies, including: • Independent non-employee Board of Directors • Written charters for key Board committees • Key Board committees composed of independent directors • Audit committee authority for selecting outside auditors • Right of Board members to seek outside legal advice
Additionally, Boeing’s financial disclosures exceed not only the current rules, but also the new rules being discussed. The Boeing ethics program, including a code of ethics established 25 years ago, is industry-recognized and communicates our values and standards of ethical conduct to the workforce. The ethics code is being supplemented to include specific ethical guidelines for The Boeing Company financial people. The Boeing Company provides strong guidance to IDS and to AS in many areas, including governance practices and ethics.
P.1b(2) Our customers are primarily government entities responsible for the support of military aircraft worldwide. We use a tiered approach to identify our customer groups. The Tier 1 customers are divided into two primary groups, US and international. Customers are further grouped in Tier 2 based on the US or international government agency/branch of military service, or commercial customer. In Tier 3, we further segment Tier 2 groups based on the role fulfilled in conducting business with us. AS market segments are synonymous with the AS business units as represented by the ‘ring’ around our customer segmentation cube (Figure P.1-4).
GP40023004.ai
Customer Group: Tier 2 Customer Group: Tier 1
Customer Group: Tier 3
Life CycleCustomerSupport
Maintenanceand
Modifications
TrainingSystem and
Services
Modernizationand Upgrades
Spares andTechnical Data
ContractorLogistics Support
and Services
Specific GovernmentCustomers
orCommercial Customers
Such as:- Air Force- Army- Navy- Homeland Defense- State Department
Decision-Maker
User/Influencer
Gatekeeper/
Influencer
U.S
.
Inte
rnat
ion
al
Figure P.1-4. Customer Segmentation
Five key customer requirements are common across AS business segments at Tier 1 and 2: quality, schedule, cost, availability, and capability. Priority of these requirements may vary depending on the specific customer or program. At Tier 3, the key customer requirements vary by customer group. We balance these five requirements for best-value customer solutions. Within the Integrated Business Acquisition Process (IBAP), (Figure 3.1-1) our Business Development function devotes significant resources to understanding customer expectations beyond the written requirements. Our understanding of these expectations is continually revisited and refined. P.1b(3) Suppliers participate in our value creation processes as part of our execution of the Process Management methodology (Figure 6.1-1). Further, process 5.0, Manage Suppliers, enables integration of our extensive framework of external suppliers into our enterprise.
The most important supply chain requirements for all AS suppliers are: Technical Performance (including Reliability and System Availability), Quality, On-Time Delivery, Affordability, and Cycle-time (Contract Award to Product Delivery). Clarity and communication is a key enabler to achieving these requirements. This is achieved by establishing close working relationships. Communication is also enhanced through multiple methods such as participation in supplier conferences and councils and sharing some databases.
Our supply base is managed through defined processes and procedures documented as Policies (POLs), Procedures (PROs),

2003 AS Malcolm Baldrige Application Summary
3
and Business Practices such as Supplier Management (Policy 15, SMPBP 4.0), Supplier Performance Measurement (PRO-3275), and Common Source Selection (PRO-4919). The cornerstones for continuous supplier improvement are the Preferred Supplier Certification (PSC) and the Supplier Development Program. PSC involves a series of processes that touch the entire business operation of our suppliers. PSC identifies and recognizes suppliers providing us with the highest quality products and services delivered on time and at best value. The Supplier Development Program provides resources such as Lean Training to enhance supplier performance. P.1b(4) We partner with customers and suppliers through our matrix organization structure, and through our programs and processes. P.2 ORGANIZATIONAL CHALLENGES P.2a Competitive Environment P.2a(1) We have considerable opportunity for growth in the DoD market supporting non-Boeing built products and, even more so in the global military aircraft support market. Our major competitors compete across multiple areas of the value chain. Second tier competitors are capable of providing some segment of support such as training or maintenance, but not the full life cycle spectrum support.
Our annual sales are expected to grow significantly over the next 10 years.
GP40023005.ai
Total Contractor Available DoD Aircraft Support Market (Boeing Products)
Total DoD Aircraft Support Market (All Manufacturers)
Global Military Aircraft Support Market
Boeing Market Share
9%
14%
64%
Figure P.2-1. Market Share
P.2a(2) The aerospace support market depends on DoD funding and program priorities. We examine the administration’s budget forecast and requirements and evaluate the likely funding scenario for our target markets. P.2a(3) Within the aerospace industry, competitive and comparative data are available through the Aerospace Industry Association (AIA), annual reports, Aviation Week Magazine, Jane’s Defense Magazine, and other industry publications. Customer and market comparative data are available through customer databases and publications, our customer satisfaction survey, and our annual Business Environment Assessment (BEA) as part of the Enterprise Planning Process (EPP) (Figure 2.1-1). Through our process management methodology, process owners select comparative data and information to determine areas for process improvement. We benchmark our processes against similar processes and approaches in related industries, analogous processes from outside our industry, and comparable processes in world-class organizations, such as Baldrige award recipients.
We must often look outside our industry to obtain analogous comparative data to foster continuous improvement since the companies with which we compete are hesitant to share their results data, making it difficult to obtain competitive data. P.2b Strategic Challenges P.2b(1) We have defined our 10-year strategic objective to be a recognized world-class global business, providing sustainment solutions aligned with our customers’ evolving needs. This objective is aligned with the aggressive growth goals. There are five strategic challenges that the organization must overcome to be successful (Figure P.2-2).
AS Strategic Challenges 1. Reluctance/inability of customers to commit long-term 2. Low-cost competitors 3. Legislative and regulatory market constraints 4. Diverse markets/customers and business complexity 5. Maintaining a competent and skilled workforce
GP40023006.doc
Figure P.2-2. Our strategic challenges
P.2c Performance Improvement System P.2c(1) We have committed to using the Baldrige framework as our business model. Internally, we performed our first assessment against the Baldrige criteria in 2000 and our second in 2001. In 2002, we performed our third assessment, which included a comprehensive site visit. Beginning in 2001, each of our major sites applied for its respective state or local quality award, or was reviewed by external third-party examiners using the Criteria for Performance Excellence (Figure P.2-3). These assessments have driven significant improvement by highlighting strengths and opportunities for improvement, and by creating a common framework and language for improvement at our various sites.
Bal
dri
ge
Sco
rin
g R
ang
e
0
100
300300
385
504
200
700
400
500
600
GP40023029.ai
2001 20032002
AS Baldrige-based Assessment Score
State/Local/Baldrige-based Scoring Range by Major Site
Award Recipient
Phila
delp
hia
Okl
ahom
aC
ity
BA
SC
Wic
hita
St. L
ouis
Mesa
BA
LS
o C
al
Okl
ahom
a C
ityF
t. W
alto
n B
ch
Figure P.2-3. State quality award participation by site
Using the Baldrige framework as our business model has been an effective vehicle for sharing best practices across our

2003 AS Malcolm Baldrige Application Summary
4
organization. Strengths and opportunities for improvement identified from our feedback reports have been analyzed, and improvement plans implemented to ensure continuous improvement throughout AS.
Organizational learning within AS occurs through a variety of approaches including disciplined documentation of processes, policies, and procedures; regular reviews of performance (Figure
1.1-3); and structured communication. Additionally, senior leaders participate in IDS and AS process councils in functional areas such as quality and engineering to share enterprise-wide best practices. Process councils are also chartered with horizontal communication across Boeing business units to ensure sharing of the latest processes, procedures and tools.
Category 1 LEADERSHIP
1.1 ORGANIZATIONAL LEADERSHIP Our leadership system (Figure 1.1-1) serves as the model for
how our leaders set and communicate direction, review performance, and maintain sufficient controls for effective organizational governance. It is based on the Malcolm Baldrige business model and is focused on balancing the needs of our stakeholders. 1.1a Our leader, David Spong, and his Leadership Team (LT) implement the Leadership System. They set the enterprise-wide strategic direction and lead AS in the pursuit of our Vision, Mission, and goals, in the reinforcement of our Values (Figure P.1-3), and in addressing our strategic challenges. 1.1a(1) In order for our senior leaders to set and deploy short- and longer-term directions, it is first necessary to understand and consider all stakeholder requirements and expectations Involve and Communicate, Figure 1.1-1.
In our Integrated Business Acquisition process (Figure 3.1-1), data are gathered to ensure that both current and future AS products meet and/or exceed the requirements of our customers.
Leaders gather workforce issues, identify opportunities for improvement and flow down strategy by spending time in direct contact with employees. Two-way communication includes all-hands meetings, roundtables, focus group meetings, personal e-mail, and team celebrations. Mass communication is accomplished via “Continuum,” an on-line weekly web magazine. At our Wichita facility, where union representation is highest, management meets with IAM and SPEEA representatives on a monthly basis. Leaders also gather input from our work force through two annual enterprise-wide surveys: an employee survey and a Leadership Effectiveness/Multi-viewpoint (MVP) survey that provide actionable feedback to improve individual leaders and the Leadership System.
We host supplier conferences at the program and enterprise level, encourage dialogue between AS senior executives and supplier senior executives, and sponsor a supplier advisory council to communicate and address supplier concerns. Suppliers also participate on Integrated Product Teams (IPTs). Suppliers are given the opportunity to rate us in terms of how well we perform as a customer.
Learning Vision & Values
Quality
Diversity
Sharing &
Supportive
AgilityCustomer
Satisfaction
Innovation
Teamwork
CorporateCitizen
Integrity
• Customer• Workforce• Suppliers• Community• Shareholders
StakeholderRequirements& Expectations
Perform
to PlanReward &
Recognize
Organize,
Plan, and Align
Organizational
& Employee
Learning
Set and
Communicate
Direction
2
3
45
6
1
INV
OLVE AND COMMUNICA
TE
Continuously Improve Be Role Models
Mo
tivateEm
ployees
Analyze & Compare
Em
power
Team
s
Figure 1.1-1. Leadership system

2003 AS Malcolm Baldrige Application Summary
5
Each AS operating site with over 500 employees has a community relations focal and a community relations plan that details how we will address key community requirements.
As members of Boeing company-wide teams and councils, senior leaders learn Boeing shareholder expectations and incorporate them during our annual strategic planning cycle and frequent improvement reviews. In November of 2000, our Leadership Team adopted the Boeing Company’s values and created an AS Vision and Mission aligned with Boeing’s (P.1-3). The Aerospace Support Leadership Team periodically reviews the organization’s Values, Vision and Mission for continued applicability to the business and societal environment. Based on stakeholder expectations and requirements, and our Vision, Mission and Values, senior executives then Set and Communicate Direction (Figure 1.1-1).
Our leaders then Organize, Plan, and Align. We are primarily organized by business, site and function, each with its own specific set of responsibilities. The Leadership Team sets short- and longer-term directions through the EPP (Figure 2.1-1). The Strategic Business Council (SBC), a subset of the LT, executes the EPP. They also provide the necessary tools and resources and consistent flowdown of executive direction to both run (short-term goals) and change (long-term goals) the business.
As a part of the EPP, all AS businesses and major functions develop implementation plans for both short- and long-term time horizons. These plans and corresponding performance expectations are deployed to the enterprise using our goal flowdown process, which includes our Vision Support Plan (VSP) Process. Goal flowdown is designed to balance the needs of all stakeholders with a built-in feedback loop that ensures two-way communication. Methods to ensure deployment and two-way communication on our Vision, Mission and Values include the annual employee survey, Leadership Effectiveness/MVP survey, the yearly employee Performance Evaluation (PE) process, and the Performance Development Partnership (PDP) process used to create personal development plans for employees. Other methods include leadership videos, the monthly communication briefing, all-hands meetings, roundtables, and focus group meetings on these topics. Key suppliers and partners receive information on values, short- and longer-term directions, and performance expectations through supplier conferences, the Supplier Advisory Council, IPT participation, and senior executive dialogue. Performance purchasing agreements, standard supplier communiqués, and the “Doing Business” website also facilitate two-way communication with suppliers. 1.1a(2) Senior leaders create an environment for empowerment through the execution of the leadership system.
We empower our teams by giving them the responsibility, authority, and accountability (RAA) to produce products and services, develop approaches, and manage results. We are organized into cross-functional teams. One example is Integrated Product Teams (IPTs) that combine expertise and authority from various functions to get the job done. We also have Employee Involvement (EI) teams, and other forms of cross-functional teams. Our EI approach is designed to take empowerment to the next level by providing a foundation to
implement processes, high performance organizational structures, and systems, training, and tools that give employees a voice and ownership in running our business.
An environment for Innovation is created at AS through investment and rewards. We invest heavily in independent research and development (IRAD) programs to develop technical solutions to known problems or to advance the capabilities of our products and services. These efforts are coordinated through the Technology Prioritization Process (TPP). The Technical Fellows program recognizes employees who by their technical prowess and innovative concepts have made significant contributions to the organization. Also, employees who develop patented inventions receive cash awards. We have multiple programs where employees are rewarded for developing innovative solutions to problems ranging from the Atlas Award to cash awards and stock options.
Leaders create an environment for organizational agility through our organizational structure. Our matrix of businesses, sites, and functions enables employees to develop skills and be quickly deployed from one business or site to another to meet changing business needs.
We invest heavily to create an environment for organizational and employee learning. We have access to the Boeing Leadership Center where leadership courses and training are held on an ongoing basis. Our employees also participate in continuing education through tuition assistance. The Performance Development Partnership (PDP) process aligns these expenditures with organizational and employee developmental needs.
We proactively promote legal and ethical behavior in all areas of our business. Boeing Policy 2 sets the standard of ethical business conduct. This is implemented through ten Boeing procedures (Figure 1.1-2). Integrity is one of our values and an integral part of our culture. Boeing has institutionalized ethics and proper business conduct into the organization by establishing an ethics position at the Company, IDS and AS levels. Further, 1.08AS Self-Governance and 8.06 AS Provide Ethics Guidance are designed specifically to reinforce this behavior.
PRO-3 Ethics and Business Conduct Program PRO-4 Proper Marketing Procedures PRO-5 Proper Marketing Practices PRO-6 Offering of Business Courtesies PRO-7 Conflict of Interest PRO-8 Acceptance of Business Courtesies PRO-9 Proper Relationships With Suppliers PRO-10 Proper Use of Company, Customer, and Supplier
Resources PRO-11 Former US Government Employees PRO-12 Buying and Selling Securities
GP40023009.doc
Figure 1.1-2. Boeing ethical standards procedures
Ethics training is part of new employee orientation, and mandatory annual ethics refresher training for all employees, delivered at group sessions or via the internal web, ensures that ethical standards are clearly communicated and understood. More specific training in regulatory and legal compliance is conducted based on job assignments.

2003 AS Malcolm Baldrige Application Summary
6
1.1b Our governance system begins with Boeing Policy 1, which defines decision-making authority at the highest levels. Policy 6 – Internal Control, flows oversight requirements down to all managers within the corporation, and guides reliability of financial reporting, and compliance with applicable laws and regulations. PRO-1872 further defines these responsibilities to include ethics and integrity, adherence to company values, management’s attitude toward performance reporting, and accountability. PRO-3175 defines our Compliance Assessment Process that identifies legal and regulatory compliance risk areas and names high-level officials as responsible executives tasked with overseeing the management of those risks, including audit requirements.
Fiscal accountability is also governed by the above policies and procedures. In addition, our accounting practices are in line with both Generally Accepted Accounting Principles (GAAP) and the more stringent US Government Corporate Accounting Standards (CAS). More specific requirements in our governance system for fiscal responsibility include policies and procedures for preparing financial statements, corporate accounting manuals, personal certification of all financial statements and audits of financial statements by internal auditors, external auditors, and our government customer. The independence of internal audits is maintained by having the audit function report separately to the highest levels of Boeing. The independence of our external auditors is maintained by allowing them to perform audit functions only, which requires an additional expense to hire and train separate groups for business consulting work. All of the above processes and actions are designed to protect shareholder and stakeholder interests. 1.1c(1) Through the actions of our empowered teams, we
Perform to Plan and Analyze and Compare our performance (Figure 1.1-1) with relevant benchmarks. Our senior leaders formally review business, site, and functional performance at various forums (Figure 1.1-3). Changes in organizational needs and directions are addressed in an
iterative process between these review forums and our EPP. This interaction helps us prioritize and allocate resources and develop and implement improvement plans. 1.1c(2) Key performance measures regularly reviewed are included in Figure 1.1-3, along with examples of recent findings/outcomes from those reviews. 1.1c(3) Organizational performance review findings are translated into priorities for continuous and breakthrough improvement and opportunities for innovation through the EPP. Suppliers and partners are apprised of changing priorities through appropriate communication lines.
Every person on our team plays an important role in our continuous improvement, so Reward and Recognize is a key step in our leadership system. 1.1c(4) Senior leaders are evaluated through multiple processes including PDP and Performance Evaluation (PE) processes, and through both the employee and Leadership Effectiveness/MVP survey results. In addition, the Boeing Leadership Center also evaluates leaders for essential core competencies.
Our senior leaders use performance review findings to improve their own leadership effectiveness and that of the entire leadership system by formulating their yearly PDP and PE goals and organizational goals captured through the EPP.
The Leadership Team evaluates the effectiveness of the individual elements of our Leadership System on a regular basis and reviews the total system annually. Through these methods, our leadership system, the approaches described in 1.1a(2), and through the use of the Baldrige criteria as our business model we achieve Organizational and Employee Learning. 1.2 SOCIAL RESPONSIBILITY 1.2a(1) We operate in a highly regulated environment. Many of these requirements are designed to mitigate either societal impact or risks to the users of our products. We manage these requirements through established procedures, processes, training, and audits.
Forums Frequency/Type Key Performance Measures Example Outcomes Communication Call Daily/(P, C) Current Issues/Events Ways to better support the customer in
Operation Iraqi Freedom; ability to better meet customer needs
LT Staff Meeting Weekly/(P, C, STG, O) Business Excellence Plan Status, Internal Audit Status
EPP and key process alignment
Strategic Business Council
Weekly or As Needed/(C, STG, LTG, CON, O)
Strategy, EPP, New Business, Resources, Work Placement
Realigned Vision, Mission, Values and Strategic Objectives
Communication Brief (MCB)
Monthly (P, O, CP) Financial Measures, Achievements Employee feedback on communication needs
Business Performance Review (BPR)
Monthly/(P, C, O, CP, STG, LTG, CON)
VSP (Businesses, Sites, Functions) (Figure 4.1-1)
Develop recovery plans for businesses not meeting financial plans
Senior Leadership Team (SLT)
Quarterly (min), (P, C, CON)
Culture, Organizational Issues, Leadership Issues, Communications, Relationships with Other Boeing Organizations
Changed organization to address our joint ventures
Leadership Team Offsite
Quarterly (min) (P, C, STG, LTG, CP, O, CON)
Overall Organization Performance Status, Vision, Values, Operating Principles, Overarching Issues, Leadership System
Improvements to the Leadership System (Figure 1.1-1)
Review Type – P = Performance, C = Capabilities, O = Organizational Success, CP = Competitive Performance, STG = Short-Term Goals, LTG = Long-Term Goals, CON = Changing Organizational Needs GP40023010.doc Figure 1.1-3. Organization performance review and communication forums

2003 AS Malcolm Baldrige Application Summary
7
Boeing Policy 4 provides overall guidance and commitment to protect the environment wherever we conduct business, comply with regulatory requirements, identify additional areas of concern, and take actions to manage them. Boeing PRO-910 establishes the Safety, Health and Environmental Affairs (SHEA) function, which exists at the Boeing company level, group level, and at the major site level. In accordance with this policy, each major site has designated an executive with the oversight and authority to commit the resources necessary to ensure compliance with applicable SHEA laws and regulations, as well as relevant Company policies and procedures. We meet or exceed the requirements of many other regulatory agencies through established processes. Our measures for compliance are requirement-specific, and our compliance goals are 100%. 1.2a(2) We anticipate public concerns largely through our EPP including analyses of environmental impacts and other public concerns of products, services and operations that address all stakeholder groups. Other methods include: Gate Reviews as part of our Integrated Business Acquisition Process, and the annual SHEA Strategic Management Planning and Risk Evaluation process., which we use to determine significant issues, develop plans, and allocate resources to address them. 1.2b As part of the Boeing Company, we have a comprehensive process for ensuring ethical behavior in all stakeholder transactions and interactions.
Ethical requirements are communicated to all levels of the organization during new employee orientation and at mandatory annual refresher courses. There is also a 24-hour ethics line that employees may call to anonymously report
questionable practices or to ask advice on what to do in a particular situation. A full-time ethics advisor is also available to answer difficult or complicated ethical questions. To further protect stakeholder interests, Boeing’s organizational governance process maintains a comprehensive audit program to ensure compliance with all legal requirements and ethical standards. Supplier responsibilities are communicated via contracts, through personal contact with Boeing employees, and through the “Doing Business” website.
The key processes for monitoring ethical behavior are defined and managed in 8.06AS Provide Ethics Guidance and Training and under 1.08AS Perform Self-Governance. 1.2c The Boeing Company and its employees are heavily involved in the community. In 2002, they contributed more than $88 million, 38% of which came from the Boeing Employee Community Fund (ECF), the largest employee-owned charitable organization in the world. Employee-controlled ECF charitable programs are established at 71 Boeing locations, including all AS major sites.
Our key communities are defined as those in which we live and work. Boeing Procedure PRO-2606 guides company-wide charitable contributions and community involvement activities. This procedure gives specific requirements for major operating sites and identifies four areas of emphasis: Education; Health and Human Services; Culture and Arts; and Civic and Environment.
Members of our Leadership Team play an important role in supporting both organizational excellence and their communities.
Category 2 STRATEGIC PLANNING
2.1 STRATEGY DEVELOPMENT One of Aerospace Support’s strengths is our ability to develop
a sound long-term strategy and create a competitive advantage by systematically converting our strategic intent into meaningful action. Through a defined, systematic approach to planning and goal flowdown, we have developed and executed key strategies to provide value-added products and services to our customers through our focus on performance excellence. Our strategic planning process has evolved from a simple planning framework, to a more systematic process based upon a Baldrige award recipient’s approach, to our current Enterprise Planning Process (EPP) (Figure 2.1-1). Through our EPP, we align the organization to achieve our goals and objectives. 2.1a(1) The annual EPP is comprised of four process elements (Key Data Factors, Strategies, Plans and Execution) with ten defined steps. In Guidelines and Constraints are detailed based upon input from Boeing, IDS, and AS. Through this step, we ensure AS alignment with the IDS group and the Boeing Company. These Guidelines and Constraints provide the baseline assumptions for our EPP. We collect additional key inputs during step Yearly Assessments. These assessments
include specific analyses of customers, markets, competition, and internal and external (including supplier) business elements.
Based on the key inputs collected during the first three steps of the EPP, we Review and Refine our Mission, Vision, Objectives, Gaps, and Strategies (MVOGS). Annually we review our Mission (what we do) and our Vision (what we aspire to be). We define our strategic objectives (end states over time) to reach our vision and we perform analyses at the AS, business, and functional levels to identify the differences between where we currently are and where we want to go. We also perform SWOT analyses and develop or refine strategies to close identified gaps and achieve our strategic objectives.
The planning time horizons for the EPP include short-term (1-5 years) mid-term (6-10 years) and long-term (20 years). The EPP addresses these horizons through Business Implementation Plans (BIPs) and Functional Implementation Plans (FIPs), goals, and targets (1-year, 1-5 year, 6-10 year) and through long-range 20-year business roadmaps. This lengthy planning horizon is critical in our business since we support products for decades.
We convert our strategies into measurable actions through the development and execution of Business Implementation Plans (BIPs) and Functional Implementation Plans (FIPs). These documents are critical to helping us integrate

2003 AS Malcolm Baldrige Application Summary
8
DevelopBusiness
ImplementationPlans
DevelopFunctional
ImplementationPlans
YearlyAssessments
Monitorthe Plan
Executethe Plan
GoalFlow Down
PLANS (MAY-DEC)
KEY DATA FACTORS (JAN-MAR)EXECUTION (JAN-DEC)
Guidelines/Constraints
(Boeing, IDS, AS)
1
2
9
78
• Mission• Vision• Objectives• Gaps (SWOT)• Strategies
SPC & EPT
SBC
SBC
EPT
EPT
FCs
All ASEmployees
3
Review and Refine
SBC& EPT
BIPs FIPs
VSP
VSP
AllocateResources
5SBC
SPCs
LessonsLearned and
ProcessImprovements
10
All PlanningCouncils
CreateFinancial Plan
SBC
LRBP
STRATEGIES (FEB-JUL)
4
SBC - Strategic Business CouncilSPCs - Strategic Planning CouncilsEPT - Enterprise Planning TeamFCs - Functional Councils
6
Figure 2.1-1. Enterprise Planning Process (EPP)
across the entire AS organization. BIPs and FIPs are living documents that are reviewed and updated as needed and statused quarterly in our Business Performance Reviews. We Allocate Resources against the strategies defined in the BIPs and FIPs through a systematic process. Resource needs are identified for each Business, reviewed by the EPT and our Business Management Function, and approved by the AS SBC. Financial commitments by each business are documented in the AS Long Range Business Plan (LRBP). All financial commitments flow from the BIPs. As needed, we redirect resources where they will have the most significant impact.
We align the entire organization through our Goal Flowdown Process (Figure 2.2-1). This process ensures that our overall action plan measurement system achieves organizational alignment and integration and covers all key deployment areas and stakeholders. Once goals have been flowed throughout the organization, Step Execute the Plan begins and continues throughout the year. On a monthly basis we track both the content of our BIPs and FIPs (health metrics) and strategy action plan performance (execution metrics) through step Monitor the Plan. Based on input from all key participants involved in strategic planning, data are collected on the EPP and all key outputs of this process during Lessons Learned. In this step, we review the previous year’s planning cycle and incorporate improvements in our strategic planning and execution processes.
One of our significant enhancements has been to expand our planning team from a small group of senior executives to our current planning structure that engages a wide range of participants from various levels of the organization. This inclusive approach facilitates both involvement and integration. David Spong and the SBC have overall responsibility for strategic planning and execution of the EPP. Strategic Planning
Councils (SPCs) within each Business and Functional Councils (FCs) are responsible for planning for their respective Businesses and Functions and have content responsibility for BIPs and FIPs. These groups ensure integration and alignment of the business, functions and sites to the overall AS plan. The Enterprise Planning Team, led by the Manager of Enterprise Planning, is composed of a representative from each SPC and FC and is the “working” group that executes the EPP for the SBC.
Individual Goals(Workforce Compass)
AS Level Goals (1, 5 and 10 year) Step EPP
IDS Goals
Boeing Company Vision 2016
BIP Goals Step EPP
Workforce Goals(PE, Team Goals)
FIP Goals Step EPP
Site Integration Goals
All Levels Manager Goals
Program/Group Goals
Go
als,
Mea
sure
s, a
nd
Tar
get
s
Per
form
ance
Res
ult
s &
Rev
iew
s4 4
3
Figure 2.2-1. Goal flowdown process

2003 AS Malcolm Baldrige Application Summary
9
2.1a(2) Annually, we collect and analyze a comprehensive set of key data factors to ensure that we develop and refine strategies and objectives based on both quantitative and qualitative data and information. These data are collected and analyzed during development of strategies and plans (steps through ).
The Business Environment Assessment (BEA) is an example of the type of data and information that is collected and analyzed as an input to the EPP. This assessment provides a robust market and competitor analysis. Equally robust analyses are performed around internal capabilities (overall performance, financials, Human Resources, facilities, culture, and technology) and external factors (customer satisfaction, supplier).
These Yearly Assessments are shared at the Leadership Team’s Annual Planning Meeting. This information is also reviewed and used by the SPCs and FCs who assess the relevance of the information to their business or function and refine strategies defined in their respective BIPs and FIPs. 2.1b(1) AS identifies key strategic objectives and develops goals, measures, action plans, and estimated completion dates. 2.1b(2) We ensure that our Strategic Objectives address the challenges we identified in our Organization Profile through a systematic approach. A key element of step Review and Refine our Mission, Vision, Objectives, Gaps, and Strategies of the EPP is gap analysis. As our leaders develop our gap analyses, they define the most critical challenges that must be addressed, and align our strategies accordingly in order to successfully achieve our strategic objectives.
Through the deployment of our AS Leadership System, our Leadership Team has defined our key stakeholders. Through the EPP, we systematically ensure that all stakeholders are considered. For example, in step Yearly Assessments, we perform a Customer Satisfaction Assessment (Customer), a Human Resources Assessment (Workforce), a Supplier Assessment (Supplier), a Risk Assessment (Community) that considers potential societal risks, and a Financial Assessment (Shareholder). As part of step Review and Refine our Mission, Vision, Objectives, Gaps, and Strategies of the EPP, our leaders develop key objectives and strategies to address all stakeholders. Through this systematic approach, our leaders ensure that we develop plans that will balance the needs of each stakeholder group. 2.2 STRATEGY DEPLOYMENT
To achieve our strategic objectives, we must engage the entire organization. We achieve this full engagement through our planning council structure and the systematic development, deployment and execution of step of our EPP, Develop BIPs / FIPs. Through the Goal Flowdown process, we attain alignment from the top of the organization to the individual contributor as well as integration among businesses and functions. 2.2a(1) Once AS level strategies and objectives have been defined in EPP step Review and Refine our Mission, Vision, Objectives, Gaps, and Strategies, the Business and Functional Councils develop action plans in EPP step to execute their strategies. These action plans and resource requirements become a key element in each BIP and FIP.
On a yearly basis, businesses define resource requirements to execute their strategies. These requirements include site and
functional needs. Once the resources are identified, the EPT aggregates and integrates these requirements and, depending upon the type of resource being requested, submits the requirement to the appropriate council for approval and allocation. The resource requirements and plan are then documented in the BIPs and FIPs. A key element of this process is the prioritization of requirements by our councils. The councils review the resource requirements and criteria to set priorities.
As the year progresses and we execute and monitor our implementation plans, we assess the need and allocate appropriate resources to ensure efficient operations and the greatest probability of successful achievement of our strategic objectives. Through our continuous monitoring of BIP/FIP execution metrics, we carefully evaluate the deployment of our action plans and can quickly adjust and reallocate resources as needs require.
Changes resulting from action plans are institutionalized by modifying the existing process or implementing a new process, as appropriate. We identify key needs around infrastructure, culture, and/or training that may be needed to sustain the change. Additionally, our systematic approach to performance review and evaluation helps to ensure sustainment of the key changes resulting from our action plans. In this review process we review our performance against measurable goals. If at any point we are not achieving the desired levels of performance, we take action as necessary to achieve our desired outcomes. Because the BIPs and FIPs are living documents, we can make business and process adjustments as required. Another systematic process that allows us to sustain changes is our yearly lessons learned process through which we modify our planning process, products, and associated execution. The implementation of a change is not complete until we sustain the expected performance over time. 2.2a(2) Our key short- and long-term action plans are captured in our BIPs and FIPs. Specific deliverables are identified on 1 and 10 year schedules with longer term expected markets defined as part of our 20 year roadmaps. We also have 1, 1-5, and 6-10 year targets identified against our goals. 2.2a(3) Our key human resource (HR) plans to support our businesses and functions are articulated in our Human Resources FIP. The HR FIP is built based on information collected in our HR Yearly Assessment, our business strategies and objectives, and the HR requirements defined in our BIPs. The HR FIP covers both short and longer term actions and includes 1, 1-5, and 6-10 year targets. In the near-term, our key focus is on increasing efficiency and effectiveness through technology with initiatives such as Boeing Enterprise Staffing System. Additionally, we have action plans in place to respond to concerns identified in our employee survey and to fully deploy our Employee Involvement approach. 2.2a(4) We ensure that our measurement system reinforces alignment through our systematic Goal Flowdown Process (Figure 2.2-1) that ensures linkage of goals from the AS level to the individual contributor.
AS tracks the progress of our action plans through key performance measures and indicators around our five strategic

2003 AS Malcolm Baldrige Application Summary
10
objectives. Using our goal flowdown process we identify the short- and long-term targets that we need to meet in order to achieve our strategic objectives. Within our integrated Vision Support Plans (VSP) we provide visibility to one-year goals and objectives and linkage to key strategies from front-line managers through David Spong. Our goal flowdown process (Figure 2.2-1) demonstrates how we systematically reinforce organizational alignment by flowing down plans and actions to the appropriate level while “flowing up” measures to give visibility to performance throughout the organization.
Through our systematic EPP, we ensure that action plans address key stakeholders and measure action plans, thereby
ensuring that our measurement system covers all deployment areas and all key stakeholders. 2.2b We develop short- and long-term performance projections for our performance measures/indicators, and we project our performance against our competitors through various means.
We have developed a competitive threat matrix to assess each of our competitors against each of our businesses. Along with this comparison, we’ve projected how each competitor fits our value chain core competencies that are the foundation of our strategies. This also allows us to address our strategic challenges.
Category 3 CUSTOMER AND MARKET FOCUS
Detailed Customer Knowledge and Focus is a Boeing core competency and Customer Satisfaction is an AS value. As we pursue new business, maintain existing business, and deliver products and services, our Integrated Business Acquisition Process (IBAP), Figure 3.1-1, guides our actions.
Create AcquireMaintain
& Grow
Management Oversight
GP40023013.ai Figure 3.1-1. Integrated Business Acquisition Process (IBAP)
3.1 CUSTOMER AND MARKET KNOWLEDGE 3.1a(1) Aerospace Support customer groups and market segments are determined within the Enterprise Planning Process (EPP) shown in Figure 2.1-1.
The yearly assessment phase of the EPP begins with the Business Environment Analysis (BEA) and Market Assessment, which utilizes multiple inputs to compile data on our customers, customer needs, competitors, customers of competitors, and potential customers.
Business Development creates and updates the Aerospace Support Business Development Functional Implementation Plan (FIP). The Business Development FIP is a document that articulates the plans and actions necessary to accomplish Aerospace Support’s Long Range Business Plan (LRBP). Throughout the process of creating the AS BD FIP, our understanding of customers, their needs, our markets, and our opportunities for growth are validated and/or changed as warranted.
Our current view of customer groups and market segments can be found in Figure P.1-4.
The first distinction in our customer segmentation is whether the customer is a US or international customer (Tier 1). Awareness of the cultural paradigm this represents is a critical step in successful customer interaction. Tier Two represents
different government and commercial agencies that AS deals with in business. Many times, we interact with multiple agencies on a procurement even if the product/service is bought for the use of one agency. Each government/commercial agency and military service brings differing characteristics and ethos’ critical to understanding what is important to them. At Tier Three, we further refine our customers as Users, Gatekeepers, or Decision-Makers. Users actually operate AS products/services and represent key influencers in future business decisions that relate to purchases from that customer. Gatekeepers stand between the user and the procurement authority and possess influence on the purchasing decisions that is self-evident. Decision-makers are those personnel who have actual signature authority to contract and have the final say in from whom a certain product/service will be procured.
AS has created business units that match our market segments that are defined by evolving customer needs. As our customer requirements evolve/grow, we identify markets to develop business.
Customer knowledge is used to target and execute individual opportunities with identified customers during the Create and Acquire phases of the IBAP. We also leverage high-level blind information ratings of competitors’ proposals following each source selection competition, which can be used as lessons learned on future proposals. 3.1a(2) We determine key customer requirements through a set of processes across the entire product/service life cycle. Requirements are systematically defined during the Create phase through interaction between the customer and Business Development. Requests For Estimates and Requests For Proposals during the Acquire phase formalize our understanding of customer requirements and expectations. During the Keep It Sold phase, customer requirements are validated/changed and reviewed as the program matures. We also use informal data gathered from sources including field and marketing office personnel, on-site company representatives, IPTs, consultants, Win-Strategy Steering Committees, and executive leadership to understand and refine customer expectations.
Relevant information from customers including marketing, sales, loyalty, retention, win/loss analysis, and complaints, are input into the EPP. The Enterprise Planning Team evaluates this

2003 AS Malcolm Baldrige Application Summary
11
data during the Yearly Assessment portion of the EPP to assist in developing objectives, strategies and gaps. Business Development uses additional mechanisms such as joint steering teams, data mining exercises, and technology road maps to further increase market knowledge and shape customer requirements. We identify areas for improvement to our formal requirement determination processes by following the PBM process. 3.1a(3). Our approaches for keeping listening and learning methods current with business needs include: • Annual Baldrige-based evaluations • Lessons learned steps of the EPP and IBAP • Regular reviews by the Strategic Business Council • Quarterly Customer Satisfaction Council off-sites • PBM evaluations
As a result of the above activity, the IBAP was modified to streamline the gate review process increasing our agility in winning quick response business opportunities.
An improvement to our listening and learning processes is the Customer Relationship Management System (CRMS), process, and on-line tool. CRM will allow Customer Contact Persons (CCPs) to input customer information such as meeting notes, trip reports, customer profiles, and stated expectations. This tool will assist multiple employees whom interact with the same customer in presenting ‘one Boeing voice’, and also measure health of customer relationships. 3.2 CUSTOMER RELATIONSHIPS AND SATISFACTION
Our 1.09 AS Manage Customer Satisfaction Approach and Deployment process reflects a cycle of improvement designed to ensure consistency in our customer satisfaction approaches and systems. A web-based Customer Satisfaction Management System (CSMS), has been designed to support our 1.09 AS process. CSMS is designed with three main components: a Top Issues database, a CCP database, and the CRMS. The CSMS is structured into levels of input and visibility tailored to support various organizational structures within AS. 3.2a(1) In addition to performance requirements, levels of customer satisfaction are driven by our relationships with customers. To maintain focus on both performance and relationship excellence, we use the Customer Satisfaction Model (Figure 3.2-1). This model, along with systematic customer processes that include Getting Started Process, Satisfy Customer Process (performance excellence), and our Customer
CUSTOMER SATISFACTION
Quality + Schedule + Cost + Relationship = Customer Satisfaction
Performance Excellence Relationship Excellence
GP40023014.ai
Products and Services That Delight the Customers:• Meet or Exceed Requirements• High Quality, On Time, At Cost• Competent and Professional Support• Meet Unanticipated Demands
Customers Want Suppliers That:• Sensitive to Their Point of View• Understand Their Expectations• Responsive to Their Requests• Keep Our Commitments
Building Process (relationship excellence) are taught in our CCP training class for employees who interface with external customers.
The Customer Satisfaction Council (CSC) was established to develop and deploy common customer satisfaction processes. Each major site has a representative on the CSC. The CSC uses process a defined process to evaluate and identify opportunities for improvement to our approaches. 3.2a(2) We have systematic approaches for customers to seek information, conduct business, and make complaints. These formal and informal mechanisms include scheduled assessments (i.e., CPAR) and meetings (Joint Management Council), the Request for Proposal process, on-site representation, off-site meetings, and electronic interface (ex. customer intranet access to Boeing systems).
Customer contact requirements for access are jointly determined with the customer during the Keep It Sold phase of the IBAP. This phase addresses high-level customer accessibility and complaint management. Customer contact requirements at the individual level are determined through the development of Customer Contact Plans and Customer Profiles.
We ensure contact requirements are deployed to CCPs through training and inclusion in our CSMS CCP Database. Our IPT work environment also provides program personnel a forum to enhance customer contact requirements at the team level as necessary. 3.2a(3) We resolve complaints through our Satisfy Customer process.
The Satisfy Customer process uses CSMS as the support system to ensure effective and prompt resolution of customer complaints. CSMS is a cycle of improvement to our previous approach. With CSMS, complaints are entered and tracked in the Top Issues database by date, priority, and risk level to ensure timely closure. CSMS is designed to generate automatic on-line notices, including two-week ticklers, as reminders when items are due. Resolution of customer complaints is completed when follow-up with the customer occurs per the Satisfy Customer process.
CSMS is the central repository for the aggregation of Top Issues and has reporting features that allow leadership to view and analyze issues to determine status, corrective action, help needed, and lessons learned. The system can elevate issues through multiple levels depending on the level at which the issue is input or its level of criticality. 3.2a(4) We evaluate approaches to building customer relationships through a set of processes which include internal and external Baldrige-based assessments, Customer Satisfaction yearly assessment inputs to the EPP, Readiness Assessment and Practices (RAP), and our customer satisfaction process reviews. The CSC, through benchmarking past Baldrige recipients, has identified improvements to our existing processes, systems, and measures. 3.2b(1) Our approach to customer satisfaction captures four types of customer data for measurement and analysis: • Formal – Official assessments (CPAR, Award Fee, On-time
deliveries, and Corrective Action Requests). These contractual processes are conducted annually or semi-annually.
Figure 3.2-1. Customer satisfaction model

2003 AS Malcolm Baldrige Application Summary
12
• Informal (Formal Internal Assessments) – Operational or performance metrics captured on a regular basis (Delivery and Field Service Surveys, win rate, and repeat business).
• Open-ended – External and Internal Customer Surveys or in-person data received on relationships or customer perceived value.
• Process – Customer-focused process measures of government ‘ticketed’ systems relating to our products and services (Process Assessment System). The evaluation of four types of customer feedback is designed
to balance performance indicators (CPAR, Award Fee, etc.) with relationship indicators (External Survey, Field Service Surveys, etc.) that influence satisfaction and loyalty. Understanding how feedback relates to our various levels of customer groups, customer satisfaction model elements, and our VSP, allows us to identify requirement variation, unique expectations, and high- leverage areas for improvement. To ensure measures capture actionable feedback, key areas for improvement are placed in CSMS and tracked by requiring action plans and disposition documents attached to the item during the closure process. The Satisfy Customer Process shows a commitment to meeting customer expectations by getting real time feedback during the issue closure process. 3.2b(2) We follow up with customers on products, services and transaction quality through delivery surveys, field surveys, and the external survey. The External Survey Process requires a formal response letter to be submitted to the customer following receipt of the results to validate appropriate areas for improvement have been captured. Key areas for improvement are again input into the Top Issues portion of CSMS. Next a mid-year update is distributed to the customer to formally communicate the progress of the improvement activities to the customer. Validation of the desired improvement comes during the next cycle of the survey when the customer responds to specific issues/areas that program managers identify. Informal feedback is also gathered on product/service and transaction
quality through our Field Service Representatives located on customer sites. We conduct various field service surveys and track data on response time, etc. This follow-up interaction is key in identifying top issues to be communicated back to management and senior leadership. CSMS allows documented visibility to be web-based as opposed to previous manual methods for aggregation and tracking. 3.2b(3) We obtain information on customer satisfaction levels relative to competitors and benchmarks through multiple external and internal mechanisms.
External – The CSC schedules benchmarking activities during quarterly offsites. These activities allow us to gather improvement practices and implement applicable processes and systems from other world-class companies.
We also use blind industry comparative data extracted from on-line databases for items such as CPAR and CPAR Block 18, and also gather information through our AS Comparative Mindset team.
Internal – Monthly Business Performance Reviews provide comparisons between the six AS business units for common processes and measures. Additionally, the EPP includes comprehensive competitive analysis as part of the BEA. These inputs are used in developing BIPs/FIPs and as inputs to the Create phase of the IBAP. 3.2b(4) Our Baldrige-based assessments provide feedback on our approaches to determine satisfaction by identifying actionable areas for improvement. In addition, the CSC has deployed a semi-annual on-line survey requesting feedback on the quality and level of internal support the customer satisfaction process provides. The CSC takes the feedback from the customer staisfaction survey and builds a plan for improvement in the Council’s Business Improvement Matrix. The Council also uses the Readiness Assessment and Practices to evaluate the health of each customer satisfaction competency to ensure they are current with our needs.
Category 4 MEASUREMENT, ANALYSIS, AND KNOWLEDGE MANAGEMENT
4.1 MEASUREMENT AND ANALYSIS OF ORGANIZATIONAL PERFORMANCE
Our performance measurement system drives what we measure at all levels of the organization. We select, analyze and align data and information to improve our performance using the five-step performance measurement system (Figure 4.1-1).
Our performance measurement system begins with gathering requirements and expectations from stakeholders. We facilitate the analysis of those data and information through the integration of The Leadership System and EPP. The result is a set of action plans, performance goals, and metrics.
Goals and direction are communicated through the Goal Flowdown process to our businesses, sites and functions and are shared with our customers and suppliers at each organizational level as appropriate.
Goals and performance expectations are measured through the AS Organization at organizational, operational, and
individual levels. Employee personal and professional development goals are defined and documented through the PDP process.
Our performance measurement system is supported through use of integrated Measurement, Analysis and Knowledge Management systems, which provide performance status and other information needed for organizational decision-making and innovation. Performance Review and Communication is conducted at the AS, business, site, function, program, and organization/team levels and reported through the Vision Support Plan (VSP) system. 4.1a(1) Our goal flowdown process (Figure 2.2-1) is our system for selecting, aligning, and integrating our performance goals and measures. The VSP is our system for collecting, monitoring, and reporting progress towards these goals. Key

2003 AS Malcolm Baldrige Application Summary
13
Measurement, Analysis and Knowledge Management
Businesses, Sites,Functions
Programs/Groups
Individual Employees
Performance Review
and Comm
unicationProcess
Performance
OrgPerform
ance
Org
Directio
n
Indiv
idual
Developm
entIndividual
Performance
Goal Flowdown
3
4
Leadership System andEnterprise Planning Process1
Requirem
ents/G
oals
Expectatio
ns
5
2
Figure 4.1-1. Performance measurement system
benefits of the current VSP system include web accessibility, password protection for sensitive data, and the ability to view selected strategies and metrics across multiple businesses, sites, and functions.
Our selection process for key measures balances leading and lagging indicators with stakeholder requirements and process measures. Goal flowdown is repeated through all levels of the organization, in businesses, sites and functions with each level combining items it is responsible for with organization-unique measures to create its VSP.
Data and information for tracking daily operations are selected and collected at the program/group level. These data are aligned through process metrics in our value creation processes and our PBM methodology to support decision-making.
The VSP documents our goals, monitors our progress, and provides a common format and location for performance reporting and communication across the organization. We use a common color-coding system of red (off target, will not meet goal), yellow (off target, but expected to meet goal), and green (on target, expect to meet goal). Analysis and action items concentrate on red and yellow ratings to improve performance. 4.1a(2) We select and use comparative data to drive improvement and innovation in organizational and operational processes. By participating in comparative activities such as trade shows, conferences, and internal and external benchmarking studies, we are able to introduce new ideas and innovation to the organization. In 2002, we participated in numerous state quality award processes at our major sites and conducted an overall internal AS assessment. In these assessments, the use of comparative data for operational measures and decision-making was identified as an opportunity for improvement. We have since created a Comparative Mindset Team to improve our processes for selecting and using comparative data. Knowledge components include a benchmarking process and a process for attaining comparative/competitive data.
We analyze comparative data to identify strategic opportunities for process improvement and to increase our long-term competitiveness.
4.1a(3) We keep our performance measurement system current with changing business needs and directions through several methods: • Annual internal and external assessments using the Baldrige
criteria, ISO9001, and AS9100. • Internal improvement initiatives such as Lean and Program
Management Best Practices. • Performance reviews conducted at regular intervals
throughout the organization. • PBM methodology, which requires regular review and
reporting of process health. • Alignment with Boeing and IDS parent organizations. We
ensure that our performance measurement system is sensitive to rapid organizational or external changes through the integration with our leadership system, performance reviews and EPP.
4.1b(1) We conduct a variety of analyses to support our organizational leadership reviews and strategic planning. These measures drive decision-making, action plans, and improvement throughout the organization. The data and analyses of our performance measurement system support our strategy by providing inputs to EPP Yearly Assessments such as customer, financial, and people factors. 4.1b(2) The primary methods of communicating the results of our performance are the VSP system, the monthly communication briefing, and business and program reviews. The AS-level monthly communication is provided through the Monthly Communication Briefing (MCB) that is distributed to all managers for communicating with their teams.
Effective decision-making is supported throughout the organization at all levels through the various performance reviews and communication mechanisms. We ensure that goals and measures are supported by the appropriate level of responsibility in the organization through the VSP process. Measures and analyses are performed at the lowest level in the organization so that those who have local knowledge are able to create and execute action plans to achieve the goals.

2003 AS Malcolm Baldrige Application Summary
14
4.2 INFORMATION AND KNOWLEDGE MANAGEMENT 4.2a(1) We rely on an integrated set of tools, technologies, and processes to provide reliable, pertinent, and current data and information to customers, suppliers/partners, and employees. Information availability is based on the three considerations shown in Figure 4.2-1.
The data access needs for our customers and suppliers are generally driven by contractual and relationship agreements. Employees have much broader access to data and information. Our employees are given access to the processes, systems, data, and other information to perform their job. Since much of our data and information is electronic, we have made provisions for shop areas where employees may not have a dedicated PC to access information. 4.2a(2) Our Information Technology (IT) group uses many methods to maintain reliable and secure hardware and software and to deliver user-friendly systems to end users. We use Boeing standards, processes and hardware/software configurations to achieve reliability and security, and the Software Engineering Institute/Capability Maturity Model (SEI/CMM) disciplines to manage our IT processes, products, and services throughout the organization. The IT organization conducts user surveys of its internal customers and uses the results from the annual employee survey to identify opportunities for improving systems, hardware, and software. 4.2a(3). The EPP yearly technology assessment provides a means to evaluate the strategic direction of information technology. The IT function participates in the EPP and assesses systems against changing business requirements and technology innovations such as PC upgrades and integrated systems. The AS Information Systems (AS IS) Council, which includes IT management from all major sites and businesses, identifies constraints (in resources, skills, and priorities) and develops strategies for driving improvements to meet AS business needs and direction. This ensures we set and
implement IT strategies, plans, and actions consistent with AS strategies. 4.2b(1) We manage organizational knowledge in a variety of ways to provide employees the ability to apply, acquire, and update market knowledge assets to serve customers and business partners. Figure 4.2-2 illustrates the collection, transfer, and sharing of knowledge and best practices for our employees, customers, suppliers and business partners. It shows: • Organizational knowledge assets - where the knowledge we
need to run our business resides or is stored. • Knowledge transfer vehicles - processes or other methods
used to capture knowledge assets and transfer knowledge from individual, tacit knowledge to organizational, applied knowledge and learning.
• Organization structure - the people, teams, organizations, or interactions with others that provide opportunities for sharing and transferring information knowledge.
Organizational Knowledge
Assets
KnowledgeTransferVehicles
• Employees• Suppliers• Customers• Business Partners• Policies• Intranet/Web• Procedure
Manuals• Work Systems• Databases• Tech Publications• Advanced
Technology Organization
• PBM, Lean, EI• OJT• Job Rotation• Certification• Professional
Certs. (APICS, CPM, ...)
• Leadership Training (BLC)
• Training via University Alliances
• Simulation and Virtual Realities
• Natural Work Groups
• IPTs (Internal, External)
• Cross Functional and Cross Business Teams
• HPWTs, AIWs, Kaizan Based Teams, etc.
• Process Councils (Identify and Share Best Practices)
Organizational Structure andWork Systems
Figure 4.2-2. Knowledge management approach
Fir
ewal
l
Who and What Policies and Procedures How
CUSTOMERSPerformance (Cost, Schedule,
Quality); Technical (Eng Drawings and Requirements); Quality (Test, Nonconformance);
Contractual Requirements
AS EMPLOYEESBoeing Intranet (News,
Information) Process-Specific Systems and Data (Accounting
Systems, Operations, etc.); Performance; HR; Policies
and Procedures
SUPPLIERS AND PARTNERSSchedule, Requirements,
Performance, Supplier Quality Metrics; Contractual
Requirements
• Access Requirements• Security and Citizenship• Confidentiality and Non-
Disclosure Agreements• Data Owner Permissions• Contractual and Program Requirements
• External Access Account(s) to Boeing Systems and Networks
• Software Installations to Support Restricted Access
• Establish Secure Connection with Boeing via User ID and Password
• Physical Access to Boeing Facilities Based On Identification Badge and Security Clearance
• Access Requirements• Security and Confidentiality• Processes for Access Based
On: Organization Structure, Employee Roles and Responsibilities
• User ID and Password Authentication via: Boeing Network PCs, Kiosk PCs
• Physical Access to Locations Based On Identification Badge and Security Clearance Requirements
Networks andServers
Documents andFiles
Systems
Databases
1 2 3
Figure 4.2-1. Data and information availability

2003 AS Malcolm Baldrige Application Summary
15
Additionally, information is shared by applying and using disciplined processes and daily operational procedures such as Employee Involvement and IPTs, which typically include our suppliers and customers. AS process councils are chartered with identifying best practices and organizational lessons learned in functional and program areas.
4.2b(2) Figure 4.2-3 lists our approaches for ensuring that various properties of data, information and knowledge are protected. Because the majority of our business is with government customers, security and confidentiality are especially vital.
Property Data, Information, and Organizational Knowledge How Properties are Ensured Integrity Code of ethics, Certification (employee, suppliers),
Process and Systems Audits training Audits, SEI/CMM
Accuracy Experience and skill level, Patents, training Error proofing and validation for entry, field masks, audits
Timeliness OJT, Just In Time Training, Employee Orientation, Intranet and Systems Access (employees, customers, suppliers)
Pilots of new software systems and user group testing
Reliability PBM, Metrics, Certification of financial statements, ISO, AS9100, QA
Change boards, SEI/CMM, service level agreements; backup systems
Security DoD security clearances, ITAR, Access Control, Export Control, Boeing sensitive/proprietary IP, Classified Programs, Nondisclosure agreements
Account permissions processes, firewalls, reverse proxy, anti-virus software, standard PC configurations, Computing Security Policy
Confidentiality Governed by business agreements, DoD specified, Boeing proprietary
Account permissions processes, firewalls, reverse proxy, anti-virus software
User Friendliness Training, Accessibility to references and resources via Web and Boeing contacts
Help Desk, user pilots and training labs, user surveys, SEI/CMM, ergonomics
GP40023016.doc
Figure 4.2-3. Properties of data, information, and organizational knowledge
Category 5 HUMAN RESOURCES
The Boeing Company vision begins with “People Working Together….”. Our people are the core of the business and the key contributors to achieving success. We are organized and conduct business in a manner that encourages our employees to give their best, continually learn, share ideas and knowledge, and work cooperatively at every level and across all activities of the business. 5.1a(1) Our Leadership System (Figure 1.1-1) provides the framework for the AS People System (Figure 5.1-1). In concert, these systems integrate leadership responsibilities with human resource processes to support a culture in which an empowered workforce successfully achieves business objectives.
Each element of the People System has key interrelationships with the Leadership System. Our Workforce Strategies identify the resources and approaches necessary to achieve strategic business objectives flowing from the Enterprise Planning Process. Design Work, Acquire Workforce, Set Direction, and Define Expectations ensures we successfully maintain capable employees who fully understand our priorities and expectations for their performance through our team-based work system. Through Lead Workforce and Assess Performance, empowered teams are provided with the knowledge and tools to perform to plan and assess performance against goals and objectives. Reward and recognition programs are provided to Retain Motivated High Performing Workforce and ensure that individuals and teams are recognized for their contributions to AS business objectives. Comprehensive development and training is provided to Develop Workforce.
Through the collaborative efforts of business, site, and functional leaders, our organization’s matrix structure provides a framework to organize and design work and job assignments. Business leaders focus on ensuring that customer needs are met and functional leaders provide skilled employees to perform work to meet those needs. This approach provides us with the flexibility to support both existing and new business while allowing effective redeployment of people as requirements change. 5.1a(2) Lead Workforce and Retain Motivated High-Performing Workforce are accomplished through our team-based structure, which allows us to capitalize fully on the diversity of our employees. Our matrix structure of functions providing people to programs, allows us to assign employees to capitalize on the skill, experience, knowledge and regional diversity of our employees.
We have a Diversity Blueprint that guides us to include all employees and the uniqueness each brings to the workplace. To reinforce the imperative that all employees participate and feel valued for their contributions, one of our senior business leaders champions the AS Diversity Council. This council, tasked with supporting diversity efforts across AS, has sponsored deployment of diversity training programs. Our diversity focus has also led to the creation of several affinity groups, such as Boeing Black Employees Association, Women
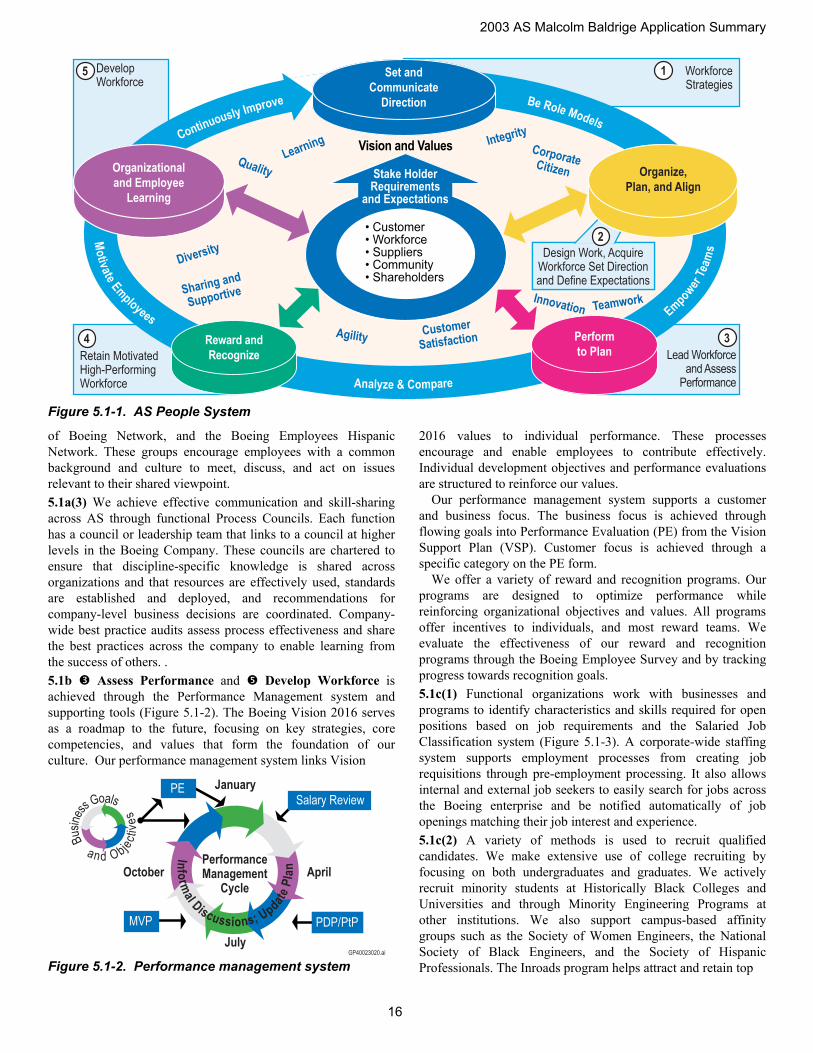
2003 AS Malcolm Baldrige Application Summary
16
Lead Workforceand Assess
Performance
Retain Motivated High-Performing Workforce
34
5
Learning Vision and ValuesQuality
Diversity
Sharing and
Supportive
AgilityCustomer
Satisfaction
Innovation Teamwork
CorporateCitizen
Integrity
Perform
to PlanReward and
Recognize
Organizational
and Employee
Learning
Set and
Communicate
Direction
• Customer• Workforce• Suppliers• Community• Shareholders
Stake HolderRequirements
and Expectations
Design Work, Acquire Workforce Set Direction and Define Expectations
WorkforceStrategies
1DevelopWorkforce
Organize,
Plan, and Align
2
Continuously Improve Be Role Models
Mo
tivateEm
ployees
Analyze & Compare
Em
power
Team
s
Figure 5.1-1. AS People System
of Boeing Network, and the Boeing Employees Hispanic Network. These groups encourage employees with a common background and culture to meet, discuss, and act on issues relevant to their shared viewpoint. 5.1a(3) We achieve effective communication and skill-sharing across AS through functional Process Councils. Each function has a council or leadership team that links to a council at higher levels in the Boeing Company. These councils are chartered to ensure that discipline-specific knowledge is shared across organizations and that resources are effectively used, standards are established and deployed, and recommendations for company-level business decisions are coordinated. Company-wide best practice audits assess process effectiveness and share the best practices across the company to enable learning from the success of others. . 5.1b Assess Performance and Develop Workforce is achieved through the Performance Management system and supporting tools (Figure 5.1-2). The Boeing Vision 2016 serves as a roadmap to the future, focusing on key strategies, core competencies, and values that form the foundation of our culture. Our performance management system links Vision
PE
GP40023020.ai
MVP PDP/PtP
Salary Review
July
October April
January
Performance Management
Cycle
Info
rmal Discussions; Updat
eP
lan
Busi
ness
Goals
and Object
ive
s
Figure 5.1-2. Performance management system
2016 values to individual performance. These processes encourage and enable employees to contribute effectively. Individual development objectives and performance evaluations are structured to reinforce our values.
Our performance management system supports a customer and business focus. The business focus is achieved through flowing goals into Performance Evaluation (PE) from the Vision Support Plan (VSP). Customer focus is achieved through a specific category on the PE form.
We offer a variety of reward and recognition programs. Our programs are designed to optimize performance while reinforcing organizational objectives and values. All programs offer incentives to individuals, and most reward teams. We evaluate the effectiveness of our reward and recognition programs through the Boeing Employee Survey and by tracking progress towards recognition goals. 5.1c(1) Functional organizations work with businesses and programs to identify characteristics and skills required for open positions based on job requirements and the Salaried Job Classification system (Figure 5.1-3). A corporate-wide staffing system supports employment processes from creating job requisitions through pre-employment processing. It also allows internal and external job seekers to easily search for jobs across the Boeing enterprise and be notified automatically of job openings matching their job interest and experience. 5.1c(2) A variety of methods is used to recruit qualified candidates. We make extensive use of college recruiting by focusing on both undergraduates and graduates. We actively recruit minority students at Historically Black Colleges and Universities and through Minority Engineering Programs at other institutions. We also support campus-based affinity groups such as the Society of Women Engineers, the National Society of Black Engineers, and the Society of Hispanic Professionals. The Inroads program helps attract and retain top

2003 AS Malcolm Baldrige Application Summary
17
• Workload• Resources• EEO Representation• Proficiency• Attrition Job Classification/
Responsibility Guides
Staffing Plan
GP40023021 ai
Program/Business Unit
Business/Technology/Culture/Initiatives
Staffing Forecast
NewEmployee
Skill Requirements Analysis
Job Task Analysis
Knowledge, Skills and Abilities
Job Tasks Competencies/Attributes
Skill Level/Quantity
Job DescriptionNew Hire Requirements Experienced/
College RecruitingExperienced + College Recruit
Boeing Enterprise Staffing System
Figure 5.1-3. New hire skills/staffing requirements model
minority students by providing summer jobs throughout their college experience. To meet our needs for touch labor and support skills, our sites partner with federal, state, and local outplacement agencies as well as with local schools to ensure adequate staffing sources. 5.1c(3) Formal succession planning is used to prepare employees to compete for executive leadership positions. Executive succession plans are used to identify ready-now and developmental candidates. In addition, high-performing employees are identified and key development actions monitored to prepare them for future leadership roles. Our Training and Leadership Development Council oversees these activities.
Effective career progression for employees is managed through functional process councils, which establish development activities and career paths for their employees. 5.2 EMPLOYEE LEARNING AND MOTIVATION
AS has created an environment of continuous personal and organizational learning through Develop Workforce. We believe highly skilled employees are critical to achieving our short- and long-term goals. Therefore we invest significantly in the education, training and development of our people. This investment includes a generous tuition assistance program, the Boeing Leadership Center, a virtual Learning Center, and a wide variety of specifically tailored training programs. These opportunities provide professional development and assist our employees in meeting professional and personal goals. 5.2a(1) The role of education and training in achieving our action plans is defined through our organization’s goal flow-down process (Figure 2.2-1). Individual short-term training requirements are identified through the PE process, and longer-term learning and skill objectives are defined in the PDP process. Additionally, functional managers and skills teams help align functional skills and training needs with organizational and business objectives through the Enterprise Planning BIP and FIP processes.
As a further enhancement to our systematic identification of training needs, we have recently deployed an Integrated Training Plan that aggregates training requirements for AS (Figure 5.2-1). This approach helps leaders plan training requirements to achieve the key goals of the organization while supporting developmental needs of employees. 5.2a(2) AS provides a comprehensive training curriculum to ensure a capable workforce. There are many ways employees
S87001
• Compliance• Program Unique• IDS Systems and Processes• Boeing policies and Initiatives• General Skills
• Symposia/Seminars• Microcomputer• College Study (LTP)• Design New Course
• PDP• Random Sampling
• BIPs• FIPs
Budget
Conduct EnvironmentalAnalysis and Determine
Organizational Training Needs
Conduct IndividualAssessments and Determine
Individual Training Needs
Integrate Businessand Individual
Training Requirements
Figure 5.2-1. Integrated training plan process
receive training, including much that is on company time and presented through a wide variety of media. 5.2a(3) The Performance Development Plan is our primary process for incorporating employee and manager perspectives on employee training and education needs. An action plan that identifies training and development needs is developed in this collaborative process. The plan also identifies the best delivery method for receiving the training and education. Thus, the plan considers learning style, application to current and future assignments, availability of budget, and time required to acquire the necessary training. An employee’s PDP is reviewed at least annually as a part of the employee development process. Training and development activities identified through this process are flowed into the Integrated Training plan. 5.2a(4) Understanding that each employee learns in different ways, we deliver education and training through a variety of methods. In addition to participation in formal training courses, employees and their managers may identify special assignments, job shadowing opportunities, or mentoring to address developmental needs. Additionally, our tuition assistance

2003 AS Malcolm Baldrige Application Summary
18
program allows employees to choose their own developmental approaches. 5.2a(5) We use various methods and tools to reinforce on-the-job use of new knowledge and skills. Course completion tests, certifications and qualifications, recognition programs, job aids, and mentoring are a few examples. Much training is delivered “just-in-time” providing the opportunity for instant application of the new knowledge and skills, thus increasing the likelihood of retention. Some training, such as compliance training, is delivered online and includes tests at the end of the course to reinforce learning. A number of jobs require certifications. These tests assess knowledge and reinforce levels of understanding. In addition, leaders use formal program and project reviews to coach job execution and provide feedback. 5.2a(6) Training effectiveness is evaluated through a variety of approaches that encompass the full spectrum of the Kirkpatrick Model. Kirkpatrick Level 1 evaluation includes the post-training evaluation focusing primarily on the student’s opinion of the training and the instruction. Some courses, such as certification and compliance training, are evaluated at Kirkpatrick Level 2, and pre- and post-tests or checklists are used to determine whether students learned the concepts/skills outlined in the course objectives. Level 3 evaluations, which assess the behavior change due to training, are the responsibility of management through the Performance Evaluation process.
Our Boeing Leadership Center is in the early stages of evaluating its training to Kirkpatrick Level 4. These evaluations have determined that the BLC training has resulted in significant cost savings or revenue generation across Boeing. 5.2b Motivation and Career Development Boeing supports lifelong learning as a part of the corporate culture. Our Chairman and CEO has stated, “Being ready for the opportunities of tomorrow is a primary reason Boeing makes available a wide range of training and educational programs for employee development. It’s a strategy that fosters ‘lifelong employability’, because no company can guarantee lifelong employment.”
Our generous tuition assistance program provides every employee the opportunity to pursue additional education. We pay the cost of tuition and books for employees to pursue degrees at accredited institutions. Upon successful completion of a degree program the employee is awarded shares of stock. Other opportunities for employees to pursue learning and development include off-shift and on-shift training. This variety of approaches, methods, and opportunities creates an environment that motivates our employees to learn. 5.3 EMPLOYEE WELL-BEING AND SATISFACTION
We are committed to providing a safe, hazard-free, and secure work environment for all employees through preventive approaches and constant feedback from our employees. 5.3a(1) Work Environment
Our commitment to a safe, secure, and healthy work place is based on the Vision 2016 value of Good Corporate Citizenship. We have a comprehensive approach to Safety, Health, and Environmental Affairs (SHEA) and industrial security that goes beyond mere compliance with government regulations. We achieve this by involving employees in these processes through participation on shop safety, office ergonomics and facility security teams.
Results of our focus on safety are demonstrated in the employee survey, with a 77% positive response rate to the questions relating to safety and health. To address the specific needs of our diverse workforce, we tailor our processes to meet employee needs based on type of work being performed as well as site or employee-specific requirements. 5.3a(2) Workplace preparedness for emergencies or disasters is supported by robust processes and procedures to ensure responsiveness and business continuity. Plans are based on site, business, and government regulations to ensure we can handle any situation and continue operations. An Emergency Procedures Guide with guidelines, procedures and phone numbers is distributed to employees. AS sites have recurring drills to ensure rapid response in an emergency situation. Our preventive approach is further evidenced through self-assessments, audits, various communication processes, and involvement of employees. Teams inspect work areas for unsafe conditions, and help investigate the root-causes of accidents. 5.3b Employee Support and Satisfaction 5.3b(1) Our Leadership Team uses multiple tools to identify factors that drive employee well-being, satisfaction and motivation. Our primary tool is our annual employee survey and the embedded Employee Satisfaction Index (ESI), complemented by our leadership assessment tools.
An example of the data is seen in Figure 5.3-1, which shows correlations between each of the ESI factors and a high performance work environment. The ESI questions in the annual employee survey that have the highest correlation with employee satisfaction relate to employee involvement. This correlation exists through each segment of employees. Our Employee Involvement (EI) initiative addresses this key motivator. The approach encourages employees to take ownership and responsibility for operations and processes. The AS EI approach provides skills training and team support. Teams are empowered to make decisions that directly improve the quality of their work, resulting in improved customer and team member satisfaction. Teams are facilitated through development process encompassing technical and team-based decision-making skills integrated with customer satisfaction and process management competencies.
0 0.25 0.35 0.45Strength of Correlation
0.55 0.65 0.75
Job Makes Good Use of Skills (0.72)
Satisfaction With Recognition Received for Doing a Good Job (0.73)
Encouraged to Come Up With New and Better Ways (0.73)
Opportunity to Improve My Skills (0.73)
Involvement in Decisions (0.78)
Hig
h P
erfo
rman
ce W
ork
Env
ironm
ent
Figure 5.3-1. AS 2002 ESI key motivators

2003 AS Malcolm Baldrige Application Summary
19
5.3b(2) We are able to attract, retain, and meet the diverse needs of our workforce by offering a variety of excellent benefits and services. Many of the benefits and services include choices that allow employees to select the benefits that meet their diverse individual and family needs. Access to many benefits and services is enabled through TotalAccess, a state-of-the-art web portal and phone access system. 5.3b(3) We use multiple formal and informal methods and tools to assess employee well-being, satisfaction, and motivation.
Our primary formal assessment tools are the annual Boeing Employee Survey and our leadership assessment tools. The employee survey is distributed to all employees annually across Boeing. Employee participation has been exceptionally high in AS, achieving nearly 97% in 2002 and 2003. The Employee Survey includes twelve key questions identified as the Employee Satisfaction Index (ESI). Factors represented by the twelve items have been shown empirically to correlate positively with improved productivity, motivation, turnover, unionization, customer satisfaction and business success. These key questions were developed from extensive research and allow us to
compare ourselves with premier companies. The employee survey and ESI results are segmented for action by business, site, program, function, manager, and department. The leadership team follows a systematic process to analyze the ESI results and define specific actions plans to address key employee issues.
Other factors considered in determining employee satisfaction include safety, attrition rates, union employee grievances, and the outcomes of alternate dispute resolution for non-union employees and EEO concerns. AS leaders monitor these data and take action to improve performance in these areas as a part of their VSP and various reviews. 5.3b(4) Our Leadership Team understands the positive correlation between employee satisfaction and superior business performance. Each senior leader reviews employee survey results, the ESI, and the results of the leadership effectiveness survey. The correlation between individual satisfiers and overall satisfaction is used by the leaders to establish action plans for their VSPs.
Category 6 PROCESS MANAGEMENT
Our strong focus on process management is reflected in our organization chart, which shows functional leaders responsible for people, processes and tools/technology, as integral members of the LT. Our senior leadership’s involvement ensures RAA for process management is at the highest levels within the organization. 6.1 VALUE CREATION PROCESSES 6.1a(1) Our over-arching process management approach, which stems from the Baldrige criteria, is Define, Measure and
Improve as shown in Figure 6.1-1. The latest cycle of improvement being used to standardize and manage our processes is PBM, a 7-step methodology for process management used by Baldrige recipient Boeing Airlift and Tanker Programs. PBM focuses on measures and improvements and requires interaction and agreement between the process owners, users, suppliers and customers. The alignment of PBM’s seven steps to the over-arching approach is shown in Figure 6.1-1.
Our Enterprise Process Model (EPM) (Figure 6.1-2) is the framework used to identify and show the interconnections of our organization’s top-level processes. The EPM consists of eight process families and several process levels within each family. The EPM provides the vital foundation for Process Management (Figure 6.1-1) for the organization. With the EPM established, our key value-creation processes were determined to be process families 1.0 thru 7.0. Value creation processes were identified as those meeting the following criteria: key to achieving the AS strategic objectives (Process family 1.0) or part of delivering a product or service to the customer (Process families 2.0 – 7.0). 6.1a(2) Process requirements (Figure 6.1-3) are identified in contract requirements, customer involvement during proposal and development effort, supplier agreements, customer performance reviews and internal/external customer inputs and agreements (PBM Step 2).
Define Process Measure Process Improve Process
Six to TenManageable Steps
STEP 1Define theProcess
Metrics fromCustomer�sPerspective
STEP 2
How You Are Doing
STEP 3Determine
Performance
Where You AreGoing and Why
STEP 5
Get There
STEP 7Set
GoalsImplement
Improvement
PredictablePerformance
STEP 4
How and Why YouWill Get There
STEP 6Develop
Improvement Plan
Return to STEP 31 2 3
EstablishMetrics
Stabilize theProcess
POL, PRO, BQMS, ProcessDefinition/Agreement Process Measures, PBM 6-Sigma, Breakthroughs, CMM/CMMI,
Customer Satisfaction, EI, Lean, PBM, PMBPHow?
Desc
.St
eps
Figure 6.1-1. Process management

2003 AS Malcolm Baldrige Application Summary
20
1.0 Manage Enterprise (Set Vision and Strategic Direction)
2.0 Manage Programs (Ensures Integration of Product/Service and Support Processes)
GP40023025.ai
8.0 Provide Enabling Infrastructure (Supports Value Creation Processes)
3.0Create, Acquire
and GrowBusiness(Converts
Opportunitiesinto Reality)
4.0Integrate
Product/ServiceDefinition(DevelopsCustomerTechnicalSolutions)
5.0Manage
Suppliers(Integrates
Suppliers intoOur Business)
6.0ProduceProduct(Creates
Products/Services )
7.0Support
Products andServices(Provides
Product Service)
Figure 6.1-2. AS enterprise process model
GP40023026.ai
StakeHolderValue added
KeyPerformance
Requirements
AssociatedPerformance
Measures
Stakeholders
6.1 - Value Creation Processes
Cus
tom
erW
orkf
orce
Sup
plie
rsC
omm
unity
S
hare
hold
ers
1.03 - Ensure quality and
mission assurance
3.02 - Acquire new
business
4.01 - Define product/
service requirements
5.04 - Manage supplier
performance
6.03 - Assemble and
deliver product
7.04 - Provide technical data
7.08 - Provide support
equipment
Major sites which are ISO
certified
Wins rate
% of competitive dollars won
Long range business plan sales
Second effort drawing releases
On-time drawing releases
Supplier on-time delivery %
% of supplier business
Defects per 1000 labor hours
Quality of significant hardware
Errors per 100 pages
Affordability savings
Support equipment on-time
delivery
Maintain 3rd party ISO
certifications
Provide a competitive
business
Grow our market share
Reduce drawing errors
Meet delivery schedule
Supplier parts/services
delivered on-time
Support small, women-
owned and disadvantaged
businesses
Reduce waste, scrap and
rework
Provide quality products
Provide quality products
Reduce costs to customer
Provide products on
schedule
Examples ofAerospace Support
Key Processes
- Enhances customer satisfaction and loyalty (our excellent past performance record)
- Provides unique product/service not available elsewhere (our resident technical expertise and platform knowledge of Boeing products)
- Provides best-value solution (our ability and willingness to invest funding to achieve long-term lower overall program cost)
- Grows market share and/or stock value (our focus on the AS strategic imperative of 'Growth through Full Service')
- Inserts new tools and technology into processes/workforce
- Enhances corporate citizenship and social responsibility
- Provides high-quality products which meet customer demands (the Boeing Company's industry-recognized quality reputation) Figure 6.1-3. Key AS value creation processes

2003 AS Malcolm Baldrige Application Summary
21
6.1a(3) We use a defined set of tools and methods (Reference Figure 6.1-4) to design our processes (PBM Step 1) and incorporate efficiency and effectiveness factors (PBM Step 2). To ensure processes continue to meet requirements, process owners periodically review process metrics with stakeholders (PBM Steps 3 and 4) and make process improvements (PBM Steps 5, 6 and 7.
New technology is inserted into processes and products through the IBAP (Figure 3.1-1). New products or technologies that meet potential customer requirements are reviewed in the IBAP and are incorporated into the BIPs and FIPs based on Return on Investment (ROI). Also in the IBAP, initial requirements are defined with the customer and then it is decided whether and how this new technology will be pursued and integrated into our businesses and functions. 6.1a(4) Day-to-day management (Figure 6.1-1 ) of processes is primarily performed by our first-level managers and their team members. As described in 4.1a, close alignment and linkage of our strategies and goals to first level managers and teams is established using goal flow down. Each manager or team is able to review performance against his or her action plans, goals, and take action as required. Action plans can be reviewed at various levels during General Manager/Site reviews, Functional Council reviews, Program reviews and staff/team reviews.
PBM Step 2 focuses on participation of process suppliers, customers, owners and users to determine in-process and result measures. Customers participate in Program Management Reviews of in-process and end-process measures and external suppliers receive monthly feedback reports. Our LT is briefed monthly with a PBM Health Report, which identifies actions to reduce negative trends or gaps. To provide real-time visibility of in-process measures, the software tool Process Based Management System (PBMS) was released in February 2003. PBMS provides a roll-up feature by site and functional health and is being integrated to link to the Corrective and Preventive Action System to identify process triggers based on performance. 6.1a(5) The DCMA, a DoD organization, resides at many of our locations to ensure compliance. Representatives report and provide monthly reports to our customers and senior management. By working with DCMA as a partner, we are able to perform joint evaluations and eliminate the need for redundant audits and inspections. Our Long Beach, St. Louis and Wichita sites have achieved a level of quality that permits Contract Self-Oversight for handling government- furnished property. Primary
methods used to assure product quality and minimize product rework and testing include Source Inspection/Audits, Receiving Inspection, In-process Inspection, Final Inspection (Component) and Final Inspection (Assembly).
Defect and rework costs are minimized through a systems engineering approach to ensure delivery of robust designs and processes. Certified Six Sigma Navigators facilitate projects to improve process capability and performance. Our Closed-Loop Corrective Action approach helps prevent costs associated with potentially recurring issues through systematic root cause identification and corrective action implementation. 6.1a(6) Figure 6.1-1 step (PBM Steps 5, 6 and 7) shows the feedback loop in our process management methodology used to continuously improve processes. Figure 6.1-4 identifies primary methods used to improve processes. To ensure we systematically integrate these tools across the organization and reduce overall costs, centers have been established at multiple sites to focus on business excellence.
Functional Councils provide process leadership across the company to ensure Best Practices, tools and processes are defined, shared and implemented; resources are used effectively; standards are established and deployed; organizational knowledge is shared so decisions are made in the best interest of the company as a whole; and recommendations for company level business decisions are coordinated. Depending upon the level of commonality across the organization, Policies (POLs), Procedures (PROs), Business Process Instructions (BPIs), and PBM are used to provide direction to employees regarding which processes to implement and use.
Using the FIPs produced by the EPP (Figure 2.1-1), Functional Councils align their process initiatives and plans with business needs and directions. With representatives from each major site on the council (as applicable), processes and process improvements are shared across the organization. VSP is used to measure process performance against the FIP goals and strategies. BPRs are held monthly to review process performance with the LT. Leadership off-sites and council telephone conferences are used to disseminate improvement information. We conduct reviews of our processes to standards and process models such as ISO, AS, Federal Aviation Administration (FAA) and Capability Maturity Model (CMM) criteria.
Significant improvements are recognized via the Atlas Award and Chairman’s Initiative programs.
Methods Purpose Six-Sigma Statistical approach to measure, analyze and improve processes Re-engineering/Breakthrough Provides a process for radical/rapid improvements Capability Maturity Models (CMM/CMMI) Provides a structured framework for systems and software development Employee Involvement (EI) Empowers teams to achieve high performance Lean Eliminates waste and variance and streamlines process flows Process Based Management (PBM) Standardizes process management with a focus on customers and suppliers Program Management Best Practices (PMBP) Shares proven program management processes
S85918
Figure 6.1-4. Process improvement methods

2003 AS Malcolm Baldrige Application Summary
22
6.2 SUPPORT PROCESSES As shown in the EPM, we treat all business functions as
processes and hold them to the same standards of discipline.
Therefore, management of our support processes is analogous to management of our value-creation processes as described in item 6.1.
Category 7 BUSINESS RESULTS
7.1 CUSTOMER-FOCUSED RESULTS We collect and analyze customer-focused data that indicates
Customers’ satisfaction, perceived value, loyalty, retention, and positive referral to understand our level of performance and relationship excellence (3.2a1). 7.1a(1) CPARs (Figure 7.1-1) are formal evaluations completed by government customers to measure defense contractor performance against pre-established criteria (management, engineering, schedule, etc.) on US Air Force and Navy government contracts in excess of $5M in value (most AS contracts fall in this category). Performance margin has increased approximately 3% annually. AS is currently outperforming industry averages by a margin of 9% year to date 2003. Award Fee performance (Figure 7.1-2) is measured as the percent captured of available dollars. Trend data shows consistent performance above increasing targets. We increased implementation of our 3rd Party External Survey to nine additional programs across our six businesses in 2002 (Figure 7.1-3). AS averages have consistently performed above the comparative best practice control range threshold of 60% positive responses. Satisfaction indicators include responses to surveys tailored to specific products and services that are conducted by individual businesses and functions. Representative sample results from our Delivery and Field Service surveys such as Boeing programs as part of our Maintenance and Modification business (Figure 7.1-4) and Product Support function (Figure 7.1-5) are depicted.
Per
cen
tag
e
19991998 20000
25
50
100
75
Aerospace Support Exceptional Very Good Satisfactory
Marginal Unsatisfactory
Comparative Industry % Very Good + Exceptional
2001 2002 2003 YTDS8593710/2003
Aerospace Support % Very Good + Exceptional
19% Improvement since 1998
Figure 7.1-1. Contractor Performance Assessment Report (CPAR)
g
% C
aptu
red
of
Ava
ilab
le
200075
80
85
90
95
100
GoalComparative Data
Consistent Performance Above Annual Targets2001 2002 2003 Proj
GP40023030.ai= Better Figure 7.1-2. Award fee
External Best Practice Lower Control Limit 60%World-class Benchmark
% V
ery
Po
siti
ve
and
Po
ssit
ive
2000 2001 20021999
GP40023028.ai Figure 7.1-3. External customer survey – top two boxes
% P
ositi
ve
19991998 20000
25
50
100
75
2001 2002
S85931Goal
2003Proj
= Better Figure 7.1-4. Sample Boeing post modification delivery survey (San Antonio)

2003 AS Malcolm Baldrige Application Summary
23
% P
ositi
ve
19991998 20000
25
50
100
75
2001 2002S85935Goal = Better
Figure 7.1-5. Sample Boeing field services survey (Southern California)
7.1a(2) A key indicator of customer loyalty (Figure 7.1-6) is the response to the CPAR block 18 narrative, which requires US customers (Air Force and Navy) to rate their willingness to award business based on current performance and relationships (reference 3.2b1).
Ave
rag
es
60
70
80
100
90
19991998 2000 2001 2002 2003 YTD
% Definitely Would + Probably Would for AS
* Year End Projection Comparative Industry Average= Better
*
10/2003 Figure 7.1-6. Loyalty indicator – CPAR block 18
Figure 7.1-7 depicts percent of Sole Source dollars captured against maximum available customer funding.
Perc
ent F
ollo
w-on
Capt
ure (
Sole
Sour
ce)
0
50
25
100
75
2001 2002 2003 ProjS85930= BetterGoal
Figure 7.1-7. Repeat business
7.2 PRODUCT AND SERVICE RESULTS 7.2a 1). Each AS business unit provides markedly different products and services. Measures of product and service performance serve as indicators of customers’ satisfaction and decisions relative to future purchases and relationships.
The quality rating for Flexible Sustainment depot maintenance (Figure 7.2-1) is a measure of overall depot quality and shows consistent performance of between 99.1% to 100%.
= Better
% M
odifi
catio
n Qu
ality
S86059
7075
95100
8580
90
2000 2001 2002 2003YTD
Goal Competitor BCompetitor A Figure 7.2-1. LCCS sample program depot maintenance quality rating
We constantly strive for defect-free delivery of products and services. Figure 7.2-2 shows how our efforts have resulted in significantly reduced defect levels for an example program. PAS (Figure 7.2-3) is a customer-reported measure of overall process performance across five key areas: define, produce, quality system, support, and business resources. Figure 7.2-4 represents customer-provided quality feedback on our field service performance.
Goal - 0 Defects Over 95% Improvement
Ave
rag
e D
efec
tsp
er A
ircr
aft
2000 20010
0.2
0.1
0.3
0.5
0.4
2002 2003proj.
GP40023031.ai= BetterCompetitor
Figure 7.2-2. M&M sample program defects per aircraft
Perc
enta
ge
1999 20000
25
50
100
75
2001 2002 2003YTD
S86060= BetterSatisfactory Marginal UnsatisfactoryAnnual Goal 95% Satisfactory
Figure 7.2-3. M&U Process Assessment System (PAS)

2003 AS Malcolm Baldrige Application Summary
24
% S
atisf
actio
n
1999 20000
25
50
100
75
2001 2002 2003YTD
S86061= BetterGoal Figure 7.2-4. Product support field service quality
Damage identified and reported by the customer for an example program has decreased significantly over the past three years. (Figure 7.2-5).
Cust
omer
Rep
orte
dDa
mag
es p
er 10
00 F
light
Hrs
.00
.02
.08
.06
.04
.10
S85979
1999 2000 20022001= Better
Figure 7.2-5. Example M&U Program – reportable damage
Figures 7.2-6 and 7.2-7 are representative measures of our performance in meeting contractual schedule requirements for customer deliveries.
Availability measures represent our ability to provide products and services to our customer quickly, thus limiting the amount of downtime our customers experience. An example is shown in Figure 7.2-8. g y
% O
n-Ti
me
19990
20
40
60
80
100
2000 2001 2002S86062= Better
Figure 7.2-6. M&M aircraft on-time delivery
% O
n-Ti
me
96
97
99
98
100
S85957
2001 20022000
Goal = Better Figure 7.2-7. S&TD technical data on-time delivery (timeliness)
% o
f Tim
e Ava
ilabl
e50
60
70
90
80
100
S85972
2001 20022000Goal = Better
Figure 7.2-8. TS&S maintenance trainer availability
Figure 7.2-9 shows a decreasing response time of field service representatives to customer service requests. Field service representatives provide technical and other assistance with product features to maintain product and service performance.
Cum
Ave
rage
Hou
rs/
Resp
onse
0
1
2
3
4
S86055
200119991998 2002 2003YTD
2000
Goal = Better Figure 7.2-9. Product support field service external response time
Figure 7.2-10 provides results on mission capability rates, or the ability of products to successfully complete mission objectives based on the features or functionality being evaluated.

2003 AS Malcolm Baldrige Application Summary
25
MCR
%
0
20
40
60
80
100
S86103
20011998 1999 200320022000Goal = Better
Figure 7.2-10. Mission Capability Rate (MCR)
7.3 FINANCIAL AND MARKET RESULTS 7.3a(1) New orders, shown in Figure 7.3-1, have increased steadily since 1999, with 2002 orders in excess of $4B. For the five years ending in 2004, our average annual growth in orders is projected to be significantly higher than our top competitors.
Ord
ers
1999 2004Proj.
2003Proj.
2000 2001 2002
GP40006001.ai
Competitor Cumulative Growth= BetterPlan AS Cumulative Growth
Figure 7.3-1. Orders
Figure 7.3-2 shows Annual Revenue over the past three years. This growth has been realized in a flat market, resulting in a loss of market share by our competitors.
GP40006002.ai
Competitor Cumulative Growth= BetterPlan AS Cumulative Growth
Rev
enu
e
2004Proj.
2003Proj.
2000 2001 20021999
Figure 7.3-2. Annual revenue
Our annual Earnings, in Figure 7.3-3, have increased steadily since 1999. For the five years ending in 2004, our average annual earnings growth is projected to exceed that of our competitors.
GP40006003.ai
Competitor Cumulative Growth= BetterPlan AS Cumulative Growth
2004Proj.
2003Proj.
2000 2001 20021999
Ear
nin
gs
Figure 7.3-3. Earnings
A large portion of our existing business involves Boeing-built products that are owned and operated by various branches of the US armed forces. We also pursue contracts for the non-Boeing-built products operated by the US armed forces, as well as contracts for both Boeing and non-Boeing products operated by foreign governments. Figures 7.3-4 and 7.3-5 show orders and sales for Non-Boeing Platforms and International markets, respectively.
1999 2001 2002 2007 Proj.
GP40006004.ai
2000
Orders Sales
2003Proj.
2004Proj.
2005Proj.
2006Proj.
= Better Figure 7.3-4. Non-Boeing orders and sales
1999 2001 2002 2007 Proj.
GP40006005.ai
2000
Orders Sales
2003Proj.
2004Proj.
2005Proj.
2006Proj.
= Better Figure 7.3-5. International orders and sales
7.4 HUMAN RESOURCE RESULTS We have created a team-based organization that depends on
the skills and involvement of our employees to achieve our objectives. To ensure we are creating our desired culture, we collect, review, analyze and act on a set of key human resource measures. 7.4a(1) We adopted the Baldrige framework as our business model in 2000. Since that time, we have increased our focus on

2003 AS Malcolm Baldrige Application Summary
26
Employee Involvement (EI), process management, and alignment and integration through our matrix work system. As a result, our performance has significantly increased.
Figure 7.4-1 demonstrates improved performance in orders, revenue, earnings, economic profit, and backlog.
S86120
Cum
ulat
ive G
rowt
h Fr
om 19
99 B
aseli
ne
050
150100
200250300350400450500
Orders
2004proj.
2003proj.
2002200120001999
Revenues EarningsBacklogEconomic Profit Better
Figure 7.4-1. AS work system performance
Our employee survey measures levels of satisfaction with key areas critical to achieving our desired culture. The value of our long-term commitment to teamwork is demonstrated in Figure 7.4-2, which shows the high level of employee satisfaction with their involvement in decision-making and process improvement. We are currently achieving performance near that of Premier companies, and we continue to expand our focus on full involvement through the deployment of white-collar EI initiatives. This team culture has created an environment where all employees are invited to find innovative ways to perform their job. Our research shows that frequent and varied recognition plays a key role in motivating employees. We provide a comprehensive set of reward and recognition opportunities as shown in Figures 7.4-3, and 7.4-4.
Per
cen
t P
osi
tive
19990
10
20
40
30
60
50
70
80
Premier Industry Boeing IDS
2000 2001 2002 2003S8583910/2003= Better
Figure 7.4-2. Satisfaction with involvement
Better Stock Shares Distributed
Dolla
rs S
pent
(Tho
usan
ds)
0
100
200
300
400
2000 2001 2002S86067
3,130 4,600 5,125
Figure 7.4-3. Cash awards and special incentives
Perc
ent P
ositi
ve
19990
10
20
40
30
60
50
Premier Industry Boeing IDS2000 2001 2002
S85840= Better Figure 7.4-4. Satisfaction with recognition 7.4a(2) Figure 7.4-5 shows the significant investment made in our employees through the Learning Together tuition assistance program.
Better
Dolla
rs S
pent
per
Stu
dent
0
1000
2000
3000
2000 2001 2002S85846
Figure 7.4-5. Learning together program

2003 AS Malcolm Baldrige Application Summary
27
Figure 7.4-6 shows an effectiveness measure of the training and preparation provided at the Boeing Leadership Center (BLC).
=Better2000 2001 2002
Perc
ent E
ffect
ivene
ss
0
20
40
60
80
100
Awareness
Follow-on Interviews: Overall Learning Transfer�(6-12 months after program completion)
Learning Behavior Performance S86069 Figure 7.4-6. BLC effectiveness
Our investment in developing our leaders is resulting in increased levels of employee satisfaction, as shown in Figure 7.4-7.
= BetterESI BLC Attendance by Management
ES
I Per
cen
t P
osi
tive
BL
C M
anag
emen
t Particip
ation
Rate-C
um
ulative
0
20
40
60
50
30
70
10
0
20
40
60
50
30
70
10
2000 2001 2002
S86071
Correlation of 0.90, Very Strong
Figure 7.4-7. ESI and BLC correlation
7.4a(3) Figure 7.4-8 reflects a significant improvement since 2000 in employee satisfaction with training and development opportunities.
Perc
ent P
ositi
ve
199901020
4030
6050
708090
100
Premier Industry Boeing IDS2000 2001 2002
S85844= Better Figure 7.4-8. Opportunity for improving skills
A safe, hazardous-free, and secure work environment is an essential commitment that we make to all our employees. Figure 7.4-9 demonstrates the effectiveness of preventive approaches and employee participation in our safety and health programs. In
addition, our employee survey shows that our employees have a very favorable perception of the workplace environment, with 77% responding positively.
The annual Boeing employee survey contains Employee satisfaction questions that compare with premier companies.
= Better
Cas
e R
ate
per
100
Em
plo
yees
0
1
2
4
3
5
2002 2003proj.
2005proj.
2007proj.
GP40006006.aiIDSBCABoeing Goal Figure 7.4-9. Lost workday case rate per 100 employees
Figure 7.4-10 compares all AS employees with both internal and external benchmarks.. Figure 7.4-11 segments the data by employee group.
Better
Perc
ent P
ositi
ve
01020
4030
6050
7080
1999 2000 2001 2002Premier IDSIndustry Boeing S85848
Figure 7.4-10. Employee satisfaction index
2001 2002
ESI
0
20
40
60
80
100
Salaried Exempt
Hourly
ExecutivesEngineers
First Level ManagersSalaried Non-exemptMiddle Managers S86070
= Better
Figure 7.4-11. ESI segmented by classification

2003 AS Malcolm Baldrige Application Summary
28
Figures 7.4-12, 7.4-13 and 7.4-14 give further evidence from the employee survey and other HR measures of the high degree of employee satisfaction with Boeing as a place to work and a desirable place to continue working.
Perc
ent P
ositi
ve
01020
4030
6050
7080
Premier Industry Boeing IDS2000 2001 2002
S85842= Better Figure 7.4-12. Boeing as a company to work for
Perc
ent P
ositi
ve
01020
4030
6050
708090
100
Boeing IDS2000 2001 2002
S85843= Better Figure 7.4-13. Employee loyalty
Volu
ntar
y Ter
min
atio
nsas
a %
of W
orkf
orce
2000Premier Industry Boeing
2001 2002S85847
012
43
65
789
10
= Better Figure 7.4-14. Voluntary terminations (overall)
7.5 ORGANIZATIONAL EFFECTIVENESS RESULTS 7.5a(1) Training effectiveness is measured to determine how well training served in real applications. Feedback has driven improvements, and results are shown in Figure 7.5-1. Our process management methodology was benchmarked against SSM Healthcare.
Cust
omer
Sat
isfac
tion
%
0
20
40
80
60
100
S85991
2002 2003Proj.
2004Proj.
GoalComparative Org. — SSM Health Care (2002 Baldrige winner)
= Better
Figure 7.5-1. PBM quality/effectiveness of training
Figure 7.5-2 indicates stability in our on-time submittal of proposals.
% S
ubm
itted
On-
Tim
e80
85
95
90
100
S85998
2001 20022000
Goal = BetterBest in Boeing Figure 7.5-2. Proposal timeliness
Figure 7.5-3 shows how we have improved customer responsiveness in this area by significantly reducing the Request for Proposals (RFP) processing cycle time.
Aver
age #
of D
ays
0
40
20
80
60
100
S86116
2000 20011999 2002 2003Proj.
1998
Goal = Better Figure 7.5-3. Contracting cycle time
Release of engineering drawings is key to the delivery of aircraft or aircraft kits. The associated results for the engineering drawing process are provided in Figures 7.5-4 and 7.5-5. Supplier on-time delivery (Figure 7.5-6) and Supplier acceptance rate (Figure 7.5-7) indicate the high-level of supplier performance in delivering products that meet contract requirements and delivery schedules.

2003 AS Malcolm Baldrige Application Summary
29
% O
n Ti
me
50
90
80
70
60
100
S85995
20011999 2002 2003Proj.
2000
% On-Time Goal = Better Figure 7.5-4. Engineering drawing on-time releases
% o
f Sec
ond
Effo
rt Re
lease
s
0
2
4
8
6
10
S86006
20011999 2002 2003Proj.
2000
Goal = Better Figure 7.5-5. Quality of engineering releases
= Better
% O
n-Ti
me D
elive
ry
0
20
40
80
60
100
S85999
20011999 2002 2003Proj.
2000
GoalBest in Boeing (BEA) Recent Baldrige Recipient
Figure 7.5-6. Supplier on-time delivery rate
= Better
% P
arts
Acc
epte
d
95
98
96
97
99
100
S85981
2001 2002 2003Proj.
2000
Best in Boeing (BCA) Goal Figure 7.5-7. Quality of supplier deliverables
In 2002, delivery of spares and technical data accounted for approximately 80% of our delivered products, so on-time
delivery and quality for this process are critical. Figure 7.5-8 shows the positive trends of our internal quality measures.
= Better
Erro
rs p
er 10
0 Uni
ts
0
1
3
2
5
4
S85956
20011998 1999 20022000Goal
Figure 7.5-8. Quality of technical data
Figure 7.5-9 quantifies how we have saved money and increased affordability through the implementation of Lean principles.
Lean
Sav
ings
$M
02040
8060
100
S86013
20011999 20022000
= BetterAnnual SavingsCumulative Savings
Goal = 5% Savings
Figure 7.5-9. Support equipment affordability
On-time delivery is critical for our Support Equipment processes. A sample Boeing program, part of the 1998 Baldrige award-winning Boeing Airlift and Tanker Programs, was chosen as the model for Support Equipment processes. Through sharing best practices, strong positive trends have resulted (Figure 7.5-10).
% D
elive
red
On-T
ime
80
85
90
95
100
S86014
20011999 2002 2003Proj.
2000
Goal = Better Figure 7.5-10. Support equipment on-time delivery
7.5a(2) EI success can be measured from the employee survey questions that represent the key facets of empowerment.

2003 AS Malcolm Baldrige Application Summary
30
Figure 7.5-11 shows how the total scores for these questions compare across multiple work areas and sites for a sample Boeing program.
Empl
oyee
Invo
lvem
ent
100
120
140
180
160
200
S85902
1999 2000 2001 2002BoeingPremier Industry = Better
Figure 7.5-11. Employee involvement – Sample
Each year the Ethics Challenge is conducted across the Boeing Company to ensure employees receive refresher ethics training. Positive results depicted in Figure 7.5-12 are attributed to enhanced web-based training, an approach that allows more flexibility in our employees’ busy schedules.
Our Information Services/Information Technology (IS/IT) organization measures the effectiveness of its processes through a customer satisfaction index, Figure 7.5-13. The index is the percentage of the total points scored versus total available points from on-line surveys.
Perc
ent o
f Em
ploy
ees
Train
ed
90
92
94
98
96
100
S86008
20011999 2002 2003Proj.
2000
GoalBoeing Comparative = Better Figure 7.5-12. Ethics and guidance training
% o
f Pos
itive
Resp
onse
s
50
60
70
90
80
100
S85903
2001 2002 2004Proj.
2003Proj.
2000
Goal = BetterA&M IT Figure 7.5-13. Quality of IS/IT service
7.5a(3) Our senior leadership defined organizational strategies to reduce cycle time and defects over a three-year period. Using process improvement tools, we completed 108 projects in four years. Results are presented in Figures 7.5-14 and 7.5-15.
Cum
ulat
ive C
ycle
Tim
eRe
duct
ion
% B
aseli
ned
To 19
98
0
20
40
80
60
100
S85992
20011999 20022000Goal = Better
Figure 7.5-14. Cycle time reduction
Cum
ulat
ive D
efec
tRe
duct
ion
%Ba
selin
ed To
1998
0
20
40
80
60
100
S85993
20011999 20022000Goal = Better
Figure 7.5-15. Defect reduction
The savings and revenue generated by our business units via technology insertion are shown in Figure 7.5-16. Technology insertion has also saved our major customers, the US Army and US Air Force.
4
67
5
S86119
Note: Data Was Not Collected at the AS Level Prior to 2001
$ Milli
ons
0
23
1
2002 2003Proj.
2012Proj.
2007Proj.
2001
Goal = Better Figure 7.5-16. Technology insertion savings and revenue

2003 AS Malcolm Baldrige Application Summary
31
7.6 GOVERNANCE AND SOCIAL RESPONSIBILITY RESULTS 7.6a(1) The health of our Internal Audit process is a key measure of fiscal accountability. EACs must be periodically reviewed to assure that they remain accurate as programs are executed.
Internal audits are conducted on legal, financial, and operational issues. Figure 7.6-1 shows the average monthly results per year for AS. For the past three years AS had no delinquent management actions nor let any management actions go past one year before being resolved.
20
40
30
Open Management Actions GP40023027.ai
Delinquent Management ActionsASIDS/A&M
Ave
rag
e M
on
thly
Val
ues
by
Yea
r
0
10
2002 200320012000
= Better
Figure 7.6-1. Internal audit results summary
7.6a(2) Figure 7.6-2 shows the results of our employee survey concerning ethics.
= BetterBoeing AS Industry AverageQ1: Management will act upon reported unethical practicesQ2: I can report unethical practices without fear of reprisalQ3: I feel free to communicate bad news to my management
GP40006010.ai
% P
osi
tive
Res
po
nse
s
20022001200019991998
60
80
70
40
50
Figure 7.6-2. Employee survey ethics indicators
Figure 7.6-3 shows the number of ethics inquiries and allegations made by IDS employees for three years. The increase in both numbers is the result of the merger of two Boeing business units. Ethical inquiries for guidance are encouraged..
= Better= BetterInquiries (A&M/IDS) GP40006011.ai
Allegations (Substantiated)
Nu
mb
er o
f In
qu
irie
s&
Alle
gat
ion
s
1000
2000
2500
1500
0
500
2001 20022000
Figure 7.6-3. Ethics inquiries allegations
Figure 7.6-4 shows the actions taken on incidents of ethical misconduct
Dismissals GP40006012.ai
SuspensionsWritten WarningsVerbal Warnings
Act
ion
s
20
40
50
30
0
10
2001(non-mgrs)
2002(mgrs)
2002(non-mgrs)
2001(mgrs)
Figure 7.6-4. Ethics violations, corrective action taken (IDS)
Figure 7.6-5 shows the Boeing credit ratings compared to that of other leading aerospace companies. 7.6a(3) Figure 7.6-6 shows the results of security audits performed by our government customer on our major sites.
= Better
B-
BBB-A-
BB-
AA-AAA
Credit Rating Comparison S86111
Ratin
g
RCCC- Un
ited
Tech
nolo
gies
BAEBoein
g
Lock
heed
North
rup
Rayt
heon
Figure 7.6-5. Boeing credit rating compared to leading aerospace companies
40
80
100
60
Excellent S86109
10/2003Satisfactory Marginal Unsatisfactory
Per
cen
tag
e
0
20
2002 2003 YTD2001
Boeing AS Boeing AS Boeing AS
Figure 7.6-6. AS Major site government security audit results
The maintenance of an ISO third-party quality system is shown in Figure 7.6-7.

2003 AS Malcolm Baldrige Application Summary
32
= Better
50
100
75
S86106Goal
% C
ompl
iant t
oIS
O 90
00
0
25
20022001200019991998 2004Proj.
2003Proj.
19971996
Figure 7.6-7. Major site ISO 9000 compliance
7.6a(4) Figure 7.6-8 shows Boeing Employee Community Fund donations in dollars per employee at the Boeing level. Figures 7.6-9 and 7.6-10 show Boeing employee giving in comparison with the most generous corporations in America.
= Better S86107
Dolla
rs/E
mpl
oyee
(Boe
ing
Leve
l)
20022001200019991998
150
200250
175
100125
Figure 7.6-8. ECF contributions
= BetterMicrosoftThe Boeing CompanyBank of AmericaProcter & GambleUnited Parcel Service
Publix Super MarketsSBC CommunicationsIBMGeneral ElectricGeneral Motors
S86114
Millio
n Do
llars
Give
nby
Em
ploy
ees
30
50
40
10
20
p )
Figure 7.6-9. Total employee contributions (various companies)
)
� ����������� ���� ���������� ������ �������������� �� ������������� � ������
��� ������������� ������ ����� ����� ����! �" ����� ������ ������ # ���! �
�$%&&'���������
�
()&
')&
*)&
&
)&
Figure 7.6-10. Total employee contributions (various companies)

2003 AS Malcolm Baldrige Application Summary
33
GLOSSARY OF TERMS AND ABBREVIATIONS
A&P Airframe and Powerplant AAP Affirmative Action Plan AD&D Accidental Death and Dismemberment AIA Aerospace Industry Association AIW Accelerated Improvement Workshop AMP Avionics Modernization Program APICS American Production and Inventory
Control Society AS Aerospace Support AS9100 Standard for aerospace quality systems ASA Amended Service Agreement ATS LLC Aviation Technical Services Limited
Liability Company AUP Avionics Upgrade Program BAES BAE Systems, resulted from merger of
British Aerospace and Marconi Electronic Systems
BAL Boeing Australia Limited BAO Boeing Aerospace Operations BASC-SA Boeing Aerospace Support Center -
San Antonio BBEA Boeing Black Employees Association BEA Business Environment Assessment BEHN Boeing Employees Hispanic Network BENExpress Boeing Education Network Express - an
interactive televised training system BESS Boeing Enterprise Staffing System BF Mean Time Between Failures BIP Business Implementation Plan BLC Boeing Leadership Center BPR Business Performance Review BQMS Boeing Quality Management System CAC Computing Architecture Council CAR Corrective Action Request CAS Corporate Accounting Standards CBA Collective Bargaining Agreement CBT Computer Based Training CCP Customer Contact Person CD-ROM Compact Disc, Read-only Memory CEO Chief Executive Officer CFE Contractor Furnished Equipment CLCA Closed Loop Corrective Action CLS&S Contractor Logistics Support and
Services CMM Capability Maturity Model CMMI Capability Maturity Model Integration COTS Commercial Off-The-Shelf
CPAR Contractor Performance Assessment Report - required for all DoD contracts over $5 million
CPI Cost Performance Index CPM Certified Purchasing Manager CQI Continuous Quality Improvement CRM Customer Relationship Management CSMS Customer Satisfaction Management
System DCAA Defense Contract Audit Agency DCMA Defense Contract Management AgencyDCMC Defense Contract Management
Command DoD Department of Defense DSS Defense Security Services EAC Estimate at Completion EADS European Aeronautic Defence and
Space Company ECF Employee Community Fund EEO Equal Employment Opportunities EI Employee Involvement EOC Emergency Operations Center EPA Environmental Protection Agency EPM Enterprise Planning Model EPP Enterprise Planning Process EPT Enterprise Planning Team ESI Employee Satisfaction Index FAA Federal Aviation Administration FIP Functional Implementation Plan FMEA Failure Modes and Effects Analysis GAAP Generally Accepted Accounting
Principles GFE Government Furnished Equipment GSR Government Security Regulation HPWO High Performance Work Organization HR Human Resources IAM International Association of Machinists IBAP Integrated Business Acquisition ProcessIDEP Interactive Display Edit Program IDS Integrated Defense Systems IP Intellectual Property IPT Integrated Product Team IRAD Independent Research and
Development IS Information Systems ISO9001 International Quality System standard IT Information Technology ITAR International Traffic in Arms

2003 AS Malcolm Baldrige Application Summary
34
GLOSSARY OF TERMS AND ABBREVIATIONS (Continued)
KAL Korean Airlines Kirkpatrick Model
Training effectiveness assessment model
LCCS Life Cycle Customer Support LEAD Learning Education and Development LLC Limited Liability Company LMA Lean Manufacturing Assessment LRBP Long Range Business Plan LT Leadership Team LTP Learning Together Program M&M Maintenance and Modifications M&U Modernization and Upgrades MCR Mission Capable Rate MIL-STD Military Standard MVOGS Mission, Vision, Objectives, Gaps, and
Strategies MVP Multiple View Points NSAWC Naval Strike and Air Warfare Center OEM Original Equipment Manufacturer OJT On the-job Training OSHA Occupational Health and Safety
Administration PAS Process Assessment System PBM Process Based Management PC Personal Computer PDP Performance Development Partnership PE Performance Evaluation PMBP Program Management Best Practices PMC Prototyping Management Corporation PMM Program Management Meeting POL Boeing Policy PRO Boeing Procedure PSC Preferred Supplier Certification QA Quality Assurance QMS Quality Management System RAA Responsibility, Authority, and
Accountability RAP Readiness Assessment Process RFE Request For Estimate RFP Request For Proposal RFT Request for Tender ROI Return on investment S&TD Spares and Technical Data SBC Strategic Business Council SCR Sortie Completion Rate SEC Securities Exchange Commission SEI/CMM Software Engineering Institute -
Capability Maturity Model SHEA Safety, Health, and Environmental
Affairs SIPOC Supplier, Input, Process, Output,
Customer SJC Salaried Job Classification SM&P Supplier Management and ProcurementSPC Strategic Planning Council SPEEA Society of Professional Engineering
Employees in Aerospace SPI Schedule Performance Index SPO Systems Program Office SSM SSM Health Care, a 2002 Baldrige
Award recipient SWOT Strengths, Weaknesses, Opportunities,
and Threats TAT Turnaround Time TIDP Technology Innovation Development
Plan TNRCC Texas Natural Resources Compliance
Commission TPP Technology Prioritization Process TS&S Training Systems and Services TTSC Tanker and Transport Service CompanyUS United States USAF United States Air Force USMC United States Marine Corps USN United States Navy VIP Voluntary Improvement Program VOC Volatile Organic Compound VP GM Vice President General Manager VSP Vision Support Plan WINGS Boeing diversity awareness training
program