ownership structures, patterns of control …cep.lse.ac.uk/pubs/download/dp0315.pdf · firms is...
TRANSCRIPT
CENTRE FOR ECONOMIC PERFORMANCE
DISCUSSION PAPER NO. 315
OWNERSHIP STRUCTURES, PATTERNS OF CONTROLAND ENTERPRISE BEHAVIOR IN RUSSIA
November 1996
J.EARLE, S.ESTRIN and L.LESHCHENKO
ABSTRACT
In this paper, we analyse the effects of the massive Russian privatisationprogramme on the ownership of Russian firms and on the behaviour offormerly state owned enterprises. A large random sample of Russianfirms is used to investigate the emerging ownership structures, patternsof control and enterprise behaviour. We find that workers havebecome the dominant owners in a majority of Russian private firms;65% of the total as against 19% being manager owned and 16% beingoutsider owned. Higher ownership appears to confer significantly moreinfluence over decision-making on managers and outsiders, but not onworkers. Most importantly however, we find no evidence thatprivatisation affects any major area of enterprise behaviour orperformance.

This paper was produced as part of the Centre’sProgramme on Economic Reform
OWNERSHIP STRUCTURES, PATTERNS OF CONTROLAND ENTERPRISE BEHAVIOR IN RUSSIA
J. EARLE, S. ESTRIN and L. LESHCHENKO

NOVEMBER 1996
Produced byCentre for Economic Performance
London School of Economics and Political ScienceHoughton Street
LondonWC2A 2AE
©J. Earle, S.Estrin and L.Leshchenko, 1996
ISBN 0 7530 0949 8
OWNERSHIP STRUCTURES, PATTERNS OF CONTROLAND ENTERPRISE BEHAVIOR IN RUSSIA
J. EARLE, S. ESTRIN and L. LESHCHENKO
Page
1. Introduction 1
2. Alternative Ownership Forms and EnterpriseBehaviour: Some Hypotheses 3
3. Institutional Features of Russian Privatization 11
4. Corporate Control in Russian Enterprises 13
5. Ownership and Control in Russian Firms 16
6. Ownership and Enterprise Behavior 19
7. Conclusion 30
Endnotes 34Tables 38Figure 64References 65
The Centre for Economic Performance is financed by the Economicand Social Research Council.
ACKNOWLEDGEMENTS
The authors would like to thank Zuzana Sakova for dedicated researchassistance. Mark Schaffer for detailed comments which led to manyimprovements in the paper. Helpful comments were also received fromDavid Bernstein, Joseph Blasi, Simon Commander, Randall Filer, AlanGelb, Mike Marrese, Mario Nuti, Judith Sedaitis, and participants atseminars at the World Bank, CERGE, Leontief Center in St.Petersburg,and the Center for International Security and Arms Control at StanfordUniversity (CISAC). The World Bank, the Labor Research Program ofthe Central European University Privatization Project, and CISACprovided financial and logistical support. All errors of fact orinterpretation are however our own.
John Earle is at the Central European University and StanfordUniversity, Larisa Leshchenko is at the Central European Universityand Saul Estrin is at the London Business School and the Centre forEconomic Performance.

OWNERSHIP STRUCTURES, PATTERNS OF CONTROLAND ENTERPRISE BEHAVIOR IN RUSSIA
J.Earle, S.Estrin and L.Leshchenko
"We have created a broad basis of shareholders who havean economic interest in the success of the reform" A.Chubais (FT, 30th June 1994)
"Most enterprises continue to be run unchallenged by oldmanagement teams, which often lack the human capital andinterest to initiate significant restructuring" M. Boycko (FT,30th June 1994).
1. INTRODUCTION
According to The Financial Times (June 27, 1994), Russia's massprivatization program, carried out between late 1992 and mid-1994,"sold more than 11,000 state owned enterprises, accounting for around70% of Russian industry, in exchange for cash and 148m freelydistributed vouchers." From a very low level in 1992, employment inthe private sector is estimated to have grown to around 50% of thelabor force (EBRD, cited in IHT). It is unsurprising therefore thatRussia's pro-reform politicians, as well as some Western analysts (seeeg Leiberman and Nellis (1994)) have hailed the program as a success.But for many observers the speed of privatization has been bought atthe price of sub-optimal ownership structures, which may carrydeleterious implications for the restructuring process.
Surprisingly, there has been little empirical analysis as yet ofwhich ownership forms have emerged, nor of the implications for thecontrol and behavior of formerly state owned firms. Governmentsources suggest that some 40 million people, around half the laborforce, have become shareholders (Reuters, 30 June 1994), andaccording to Professor Yasin, head of Yeltsin's advisory economic

2
council, "insiders own on average some 70% of the privatizedenterprises" (reported in FT, 30th June 1994). Data from a sample of142 firms by Blasi and Shleifer (1995) indicate that insiders held onaverage some 65% of the shares in 1993. The ownership question maybe crucial, for economic theory predicts different performance, notmerely depending on whether firms are privately or state owned, butaccording to whether privately owned firms are insider or outsidercontrolled, and whether the controlling group of insiders are managersor workers (see eg Aghion, Blanchard, Burgess (1994)). While all theevidence suggests that it is employees who hold a majority of shares(see eg Blasi (1994)), control is usually argued to be vested primarilyin the hands of senior management (see eg Blasi and Shleifer (1995),Commander, Dhar, Yemtsov (1995)). However, there has not yet beenan attempt to describe the patterns of ownership and control, nor toanalyze the impact on different areas of enterprise decision-making. Itis these three issues - ownership structures, patterns of control andenterprise behavior - and their inter-relationships which are the subjectmatter of this paper.
The following two sections set the context for the empirical work.A framework of analysis is outlined in section 2, which summarizeshypotheses about how alternative majority ownership forms mightinfluence control and behavior, and there is a brief discussion ofinstitutional features of ownership in Russia in the third. The fourthsection addresses the question of who owns Russian firms, on the basisof a sectorally as well as geographically representative structuredrandom sample (see Fan and Fang (1995)). Enterprises arecategorized, according to largest ownership holdings, into State-Owned(SO), Worker-Owned (WO), Manager- Owned (MO), Outsider-Owned(OO), and new (de novo) private firms (DNs); these are the groupingswhich form the basis for the subsequent analysis of control andbehavior. We find that, among all privatized companies, workers hold48% of shares, managers 21% and outsiders 20%; the remaining sharesare still held by the state. Workers hold a dominant stake in 65% ofprivatized firms; managers in 19% and outsiders in 16%. Privatized
3
firms make up almost 60% of firms in the sample; of the remainderalmost two thirds are still in state hands.
In the fifth section we begin to investigate whether majorityownership has yet translated itself into control in Russian firms. Thequalitative evidence suggests that "management and executive boards"have the greatest influence over all types of enterprise decisions,irrespective of the structure of shareholdings. Although consistentwith widespread popular perception, this result emanates from theopinion of managers responding to the survey, suggesting furtherinvestigation into enterprise behavior. This we do in the sixth section,which inquires whether different majority ownership forms lead todifferent economic relationships with the state, and to differenteconomic performance. We find striking evidence that thedevelopment of a politically independent and market orientedenterprise sector is associated with private ownership, most noticeablyin de novo private firms but also in dominant worker owned ones.There are relatively few ownership effects on other indicators ofperformance, however, though this may reflect the relatively shortperiod that the new owners have had to implement restructuring.Policy conclusions are drawn in the seventh section.
2. ALTERNATIVE OWNERSHIP FORMS ANDENTERPRISE BEHAVIOR: SOME HYPOTHESES
Although the literature on transition has stressed thatprivatization is a critical component of the transition process, therehave been few attempts to evaluate the comparative strengths andweaknesses of alternative majority ownership structures for the newlyprivatized companies. Earle and Estrin (1995) argue that the balanceof advantage shifts between different ownership forms according to theproblem under consideration. For example, outsider ownership mayoffer superior access to external capital markets but may also causegreater social dislocation, while worker ownership may slowemployment restructuring. In this section, we provide a simplified
4
comparison of alternative majority ownership forms in achieving fourwidely accepted objectives of the transition1, namely:
- developing a politically independent and market orientedenterprise sector, which we term "depoliticization"2
- long term restructuring- short term restructuring- minimizing transaction costs associated with further
evolution of ownership
The hypothesized impact of each ownership form, relative to oneanother and against the base case of state ownership, is reported inFigure 1. The figure summarizes the analysis which follows, andindicates, for example, the predicted extent of depoliticization inworker owned firms, relative both to state ownership and the otherownership forms. But a few words of caution are needed. Firstly, thefigure summarizes results derived from theoretical models of 100%ownership by one or another group. However in defining our fiveownership forms empirically, we take a majority stake, (or indeed thelargest single stake if other holdings are diversified), as implyingeffective control of the firm. This may be misleading. In practice, thelargest group of owners may have highly diversified holdings, whileminority interests may be highly concentrated, giving the latter effectivecontrol. For example, enterprises classified as worker-owned accordingto ownership stake may actually be managerially controlled. We returnto this issue below.
Moreover, there are many assumptions behind the hypothesizedbehavior in the table, not all of which will always be satisfied. Threecases will suffice. First, the extent of restructuring will typically begreater when product and factor markets are more competitive, ceterisparibus. If sectoral and regional diversity is sufficient, these elementsmight swamp any independent ownership effects. Second, the preciseinstitutional form of different ownership types may significantly affectbehavior. Thus, firms owned collectively by workers with limited share

5
tradeability might be expected to perform much worse than thoseowned by workers on the basis of individually held and freely tradeableshares. Finally, the situation of the firm itself is relevant. Profitabilityclearly assists restructuring regardless of ownership form. On the otherhand, collective employee ownership might be beneficial in situationsof extreme loss-making by geographically isolated firms, because sucha form allows workers to trade wages for employment security. Theseprovisos aside, the figure reports predictions about the relative impactof alternative ownership forms on restructuring. The arguments aresummarized in the following subsections.
2.1 Developing a Politically Independent and Market OrientedEnterprise Sector
A fundamental objective for new ownership structures intransitional economies is to promote the clarification of property rights,and to establish new objectives of the firm. All privatizations assigntitles of ownership to particular individuals. But founding a newrelationship with the state involves ensuring the freedom of firms fromarbitrary interference and a radical reorientation of goals from seekingrents to satisfying the demands of the market, (see Boycko, Shleifer,and Vishny (1993), Frydman and Rapaczynski (1994)).
Relative to state ownership, de novo private and outside privateownership seem likely to be best able to ensure depoliticization of thefirm and reorientation of objectives. To the extent that the new ownersare entrepreneurs, they will less be a part of the old order and perhapsalso have more restricted access to the flow of subsidies3. Insiders willalso have incentives to increase economic profits, since they personallystand to gain via their shareholdings. But they may also have closerties to the state bureaucracy, and greater opportunities to pursuespecial concessions than outsiders or new entrepreneurs.
Within the category of insiders, one might also predict adifference between managerial and worker ownership. If budgetconstraints are soft, it is arguable that transfers of ownership either to

6
managers or to workers will have little or no effect on enterprisebehavior because both sets of new owners will remain motivated tomaximize rents rather than profits or earnings per worker. Insiderprivatization is therefore unlikely to bring many benefits until budgetconstraints are tightened. Under somewhat harder budget constraints,the net returns to profit as against rent seeking will be determined byboth the opportunity costs and the benefits, which are in turn affectedby the prospects of the firm, its environment, the political situation, etc.However, there may be some differences between employee andmanagerial ownership in this respect. Workers represent a new andmore diffuse group of owners than managers, who are generallysurvivors from an earlier period, maintaining their good connectionsand bad habits. The costs to seek rents may be higher for worker ownedfirms than those under managerial ownership because the formerorganization may have more diffuse and heterogeneous objectives.More importantly, the benefits to rent-seeking may be lower inemployee-owned firms because managers, given their longstandingconnections under the previous regime, may be more effective atextracting subsidies. Managers may also be able to achieve higherreturns to rent seeking because they may be better able to appropriatethe rents for themselves personally, or because there are fewer of themamong whom to share the spoils. In such circumstances, insiderprivatization to employee owners, by weakening the old relationships,might be superior to managerial ownership. However, we predict thatboth will prove inferior on this score to outsider privatization.
2.2 Long Term Restructuring
We focus on three issues here: unbundling, organizationalstructure and investment. The boundaries of firms in a market economyare supposed to be determined by efficiency considerations: the costsand benefits of integration. But in socialist economies, as emphasizedby Kornai (1991), the relationship between the managers of firms andtheir superiors, whether the director of a trust or a branch minister,
7
differed little from the relationship between the manager and theforeman or production supervisor under his/her direction. Animportant element in the transition process is therefore to reorganizethe groups of productive units which previously comprised theenterprise sector to form a new industrial structure in which theboundaries of the firms minimize internal transactions costs.
A market orientation should also be reflected in changes inenterprise organizational form. The structure of the organization shouldbe adapted to be able to respond to the changing demands ofcustomers, to ensure adequate mechanisms for managerial control, andto provide appropriate information for rational decision-making. Thismay involve for example the establishment of new functional divisionswithin the firms suitable for finance or marketing, and the developmentof new control and monitoring systems. Finally long-term restructuringinvolves investment in capital equipment, to introduce newtechnologies, to raise quality standards, to broaden productdifferentiation, and to address input wastage and its environmentalconsequences. An important issue is the ability of different ownershipforms to mobilize capital and to introduce new technologies.
Restructuring, both long and short term, are primarily problemsfaced by current and former state owned firms, so we exclude de novoprivate firms from these comparisons.4 Provided outsiders are able toexercise their nominal property rights, outsider ownership is probablythe form best suited to long term restructuring. This is because giventheir profit orientation, outside owners will take the most dispassionateview of existing production and organizational structures, and becausein principle they suffer least from agency problems in their dealingswith external capital markets. Insider owned firms might be predictedto suffer more serious difficulties in raising outside capital because ofthe agency problems faced by lenders and minority investors (see egShleifer and Vasilyev (1995), Hansmann (1990) for summaries).
Ownership by managers is also likely to dominate that ofnonmanagerial employees in redefining the appropriate boundaries ofthe firm. Worker ownership may still be superior to state ownership
8
because rearranging the boundaries of the firm will be possibleprovided the employee gainers can compensate the losers. In principle,even highly egalitarian employee-owned firms with high solidarity maytherefore be able to undertake some restructuring and unbundlingprovided it offers a potential Pareto improvement and some form ofcompensation package can be agreed upon.
In some situations, however, this compensation will not bepossible and potential Pareto improvements will not be convertible intoactual Pareto improvements (for instance, because lump-sum transfersare infeasible or because of severe capital market imperfections). Thebiggest problems are likely to arise due to the difficulties of collectivedecision-making under uncertainty, and particularly when some groupsof workers are earning supra-competitive rents. Many enterprises havea large number of restructuring paths which they could potentiallyfollow, for instance changing product lines, re-organizing companydivisions, or adopting different kinds of new technologies, but each hasdifferent implications for the value of the human capital of variousgroups of workers in the company. Given that the profit associatedwith each path is also greatly uncertain, each group of workers will tryto block paths which seem likely to downgrade their own skills. Thus,it may not be difficult for blocking coalitions to form ex ante,preventing ex post desirable restructuring.
In resolving these agency problems, managerially owned firmshave a clear advantage. They will be motivated to undertake anyrestructuring or rearrangements in the boundaries of the firm whichincrease profits. Supra-competitive wages may be reduced and workerslaid off with little or no compensation. Agency problems apart,managerial ownership can therefore potentially yield restructuringbenefits analogous to those of investor ownership, greater than thoseunder worker ownership.
2.3 Short Term Restructuring
9
The transition process demands that firms become responsive inthe short term to market signals in terms of both the products theychoose to supply and in their use of factor inputs. In firms for whichthe optimal level of output has fallen, the ownership system must beable to effect large decreases in employment and other inputs. Due tothe inherited technologies and the production practices which werewasteful in the use of inputs, including energy and labor, new ownersmust have the incentives and the ability to ensure that costs arereduced, that the factor mix is rationalized, that productivity is raised,and that quality is improved. These are the standard problems ofrestructuring (see eg Belka et al (1994), Estrin et al (1993)).
Once again, one predicts outside owners to have less qualms thaninsiders about reducing employment, and other short term restructuringmeasures. However, they might be unable to exercise their propertyrights in such sensitive areas, especially if insiders refuse to cooperate.Moreover, if product or factor markets are relatively more competitiveand budget constraints hard, insiders may be forced to restructure andimprove their efficiency in order to survive.
Comparing managerial and worker ownership, it is important tostress that both have equivalent incentives to increase economic profitsand to cut non-labor costs. But worker-controlled firms are likely toperpetuate even more than managerially owned ones inefficiencies inthe allocation of labor. However, the flip side is that worker ownerswould probably be able to get rid of managers more easily. In caseswhere managerial turnover is a sine qua non for the firm to be turnedaround, managerial ownership has the disadvantage of entrenching badmanagers.
2.4 Evolution of Governance Form
The transition process involves dynamic adjustment byorganizations to changed and changing economic circumstances. Theoutcome of the process may be path dependent, and the appropriateinstitutional arrangements may gradually change as the process unfolds.
10
In such circumstances, it may not be possible to specify ex ante theoptimal ownership structure but it would be desirable that whateverstructure is first selected should have the flexibility to evolve as thedynamic path of transformation proceeds. The lower the transactioncosts involved in exchanging ownership rights, the less binding theinitial allocation of ownership rights, because markets would emergeto ensure a reallocation to achieve better matching of owners withassets. Institutions concerning property rights should therefore bedesigned to lower those transaction costs and to facilitate thedevelopment of financial markets. The new ownership configurationshould also minimize the probability of degeneration back to stateownership.
Widespread ownership by outsiders, whether de novo or inprivatized firms, is likely to encourage the development of secondarymarkets and thus further the evolutionary process of matching andrematching assets with owners. In contrast, concentrated insiderownership will discourage the development of takeover markets,because the lack of liquidity in small numbers of shares implies that itmay be very difficult in a takeover action to earn the control premiumon minority stakes previously acquired; thus rematching is inhibited.If worker shareholdings are widely dispersed, secondary markets maydevelop more easily than if shares are concentrated in the hands of afew managers. Although still difficult, it may be somewhat easier foroutsiders to take over companies by buying up small numbers of sharesthan by negotiating with a single manager or a small group of managers.The reason is that, while there may be a collective interest of theinsiders to keep out outsiders, individual employees may "free ride" byselling their small holdings to outsiders. Concentrated insider holdingsare more likely to lead to entrenchment because of the informationaladvantage of insiders over outsiders. In an environment of greatuncertainty over the prospects for any company and lack of financialmarkets functioning to provide estimates of value, the concentration ofholdings together with the asymmetry of information may give rise toadverse selection in the market for corporate control.

11
2.5 Summary of Hypotheses
In summary, outside ownership is predicted to provide thegreatest progress towards our four objectives for enterprises intransition; where relevant this performance would be matched by denovo owners. Insider privatization is expected to be superior to stateownership, but worse than majority outsider control. If we compareforms of insider ownership, worker ownership is hypothesized to havedeficiencies in long term restructuring, especially rearranging theboundaries of the firm, and short term restructuring when employmentlevels are at issue, but perhaps to be superior in terms ofdepoliticization and in the evolution of governance structure.
3. INSTITUTIONAL FEATURES OF RUSSIANPRIVATIZATION
The Russian mass privatization involved large-scale giveaways toinsiders on the argument that there was no politically feasiblealternative form of privatization. This is because managers and workershad already accumulated tremendous political influence andenterprises, had gained significant autonomy and de facto propertyrights. Early methods of ownership decentralization under Perestroikahad already emphasized leasing arrangements, eventually resulting ininsider buyouts at highly preferential prices.
The institutional features implied by the State PrivatizationProgram seem straightforward. The legal form of enterprises is anopen, individually owned joint stock company and shares are inprinciple fully tradable, and voting rights (of voting shares) freely andequally exercised. But there are some important qualifications relevantto our hypotheses above, which we list in increasing order ofimportance. First, in addition to the better known ways in whichworkers were able to acquire shares, there was possibility of a kind of
12
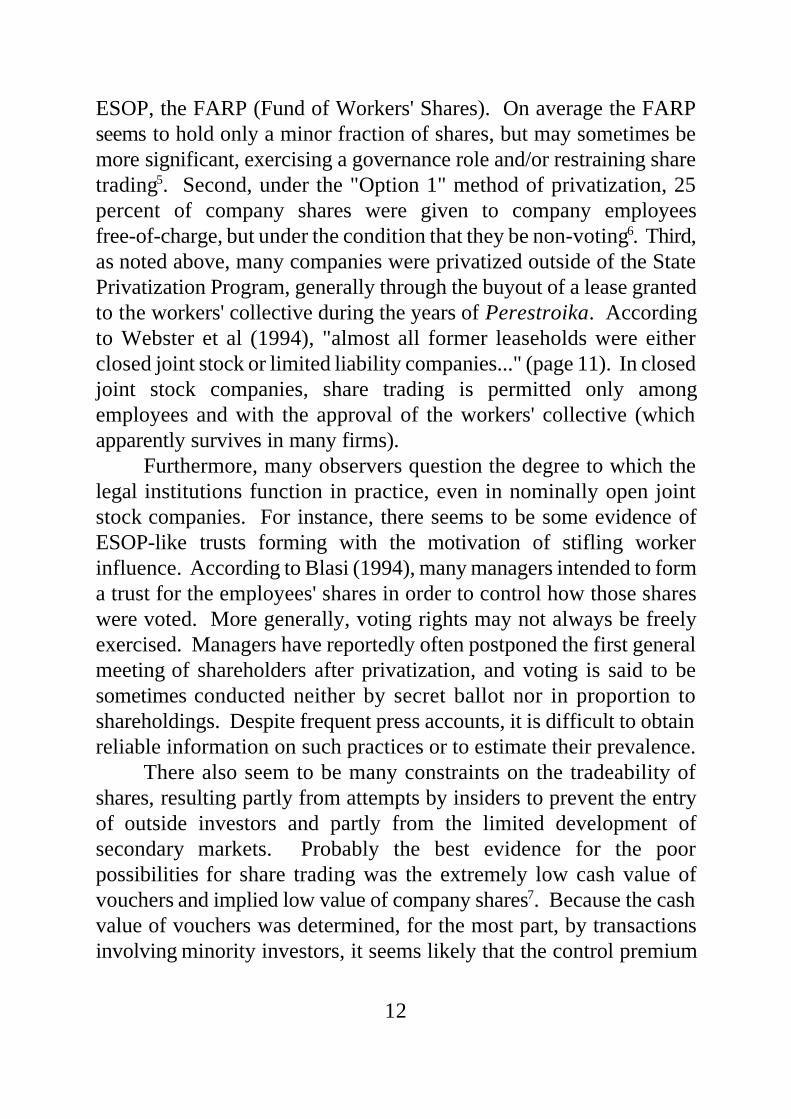
ESOP, the FARP (Fund of Workers' Shares). On average the FARPseems to hold only a minor fraction of shares, but may sometimes bemore significant, exercising a governance role and/or restraining sharetrading5. Second, under the "Option 1" method of privatization, 25percent of company shares were given to company employeesfree-of-charge, but under the condition that they be non-voting6. Third,as noted above, many companies were privatized outside of the StatePrivatization Program, generally through the buyout of a lease grantedto the workers' collective during the years of Perestroika. Accordingto Webster et al (1994), "almost all former leaseholds were eitherclosed joint stock or limited liability companies..." (page 11). In closedjoint stock companies, share trading is permitted only amongemployees and with the approval of the workers' collective (whichapparently survives in many firms).
Furthermore, many observers question the degree to which thelegal institutions function in practice, even in nominally open jointstock companies. For instance, there seems to be some evidence ofESOP-like trusts forming with the motivation of stifling workerinfluence. According to Blasi (1994), many managers intended to forma trust for the employees' shares in order to control how those shareswere voted. More generally, voting rights may not always be freelyexercised. Managers have reportedly often postponed the first generalmeeting of shareholders after privatization, and voting is said to besometimes conducted neither by secret ballot nor in proportion toshareholdings. Despite frequent press accounts, it is difficult to obtainreliable information on such practices or to estimate their prevalence.
There also seem to be many constraints on the tradeability ofshares, resulting partly from attempts by insiders to prevent the entryof outside investors and partly from the limited development ofsecondary markets. Probably the best evidence for the poorpossibilities for share trading was the extremely low cash value ofvouchers and implied low value of company shares7. Because the cashvalue of vouchers was determined, for the most part, by transactionsinvolving minority investors, it seems likely that the control premium
13
in this case is simply enormous: outsiders have little willingness to payfor minority stakes in insider-controlled firms8.
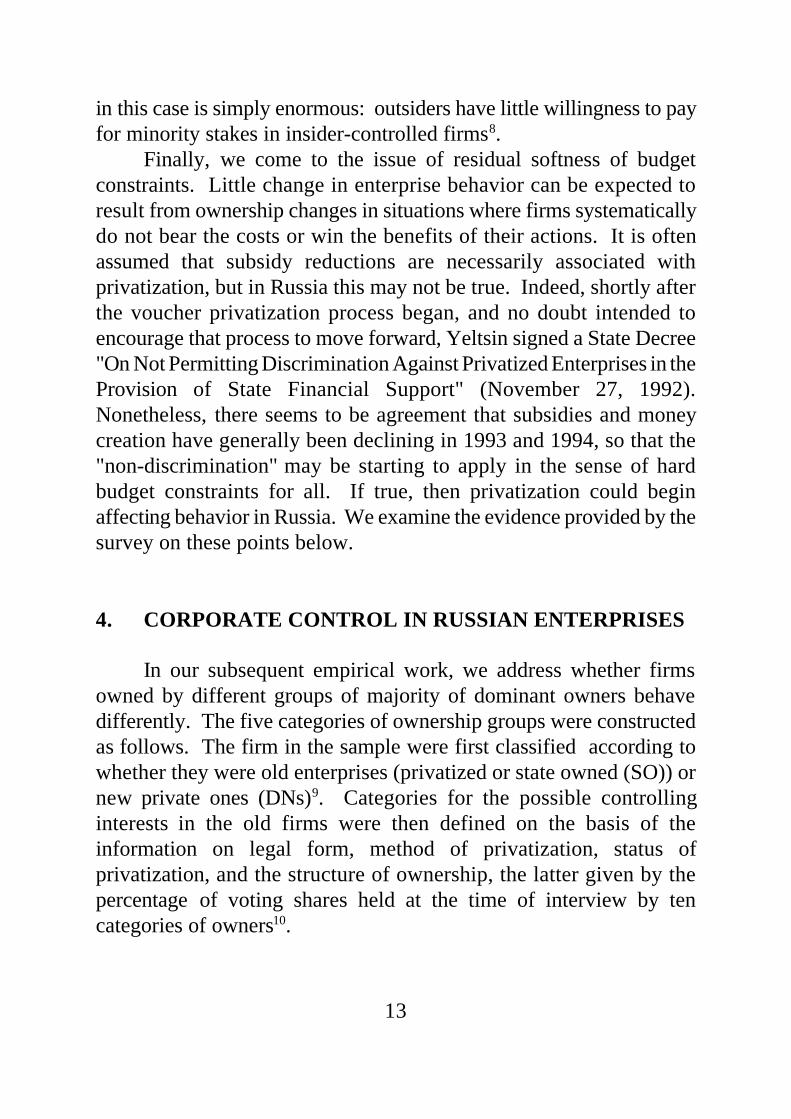
Finally, we come to the issue of residual softness of budgetconstraints. Little change in enterprise behavior can be expected toresult from ownership changes in situations where firms systematicallydo not bear the costs or win the benefits of their actions. It is oftenassumed that subsidy reductions are necessarily associated withprivatization, but in Russia this may not be true. Indeed, shortly afterthe voucher privatization process began, and no doubt intended toencourage that process to move forward, Yeltsin signed a State Decree"On Not Permitting Discrimination Against Privatized Enterprises in theProvision of State Financial Support" (November 27, 1992).Nonetheless, there seems to be agreement that subsidies and moneycreation have generally been declining in 1993 and 1994, so that the"non-discrimination" may be starting to apply in the sense of hardbudget constraints for all. If true, then privatization could beginaffecting behavior in Russia. We examine the evidence provided by thesurvey on these points below.
4. CORPORATE CONTROL IN RUSSIAN ENTERPRISES
In our subsequent empirical work, we address whether firmsowned by different groups of majority of dominant owners behavedifferently. The five categories of ownership groups were constructedas follows. The firm in the sample were first classified according towhether they were old enterprises (privatized or state owned (SO)) ornew private ones (DNs)9. Categories for the possible controllinginterests in the old firms were then defined on the basis of theinformation on legal form, method of privatization, status ofprivatization, and the structure of ownership, the latter given by thepercentage of voting shares held at the time of interview by tencategories of owners10.
14
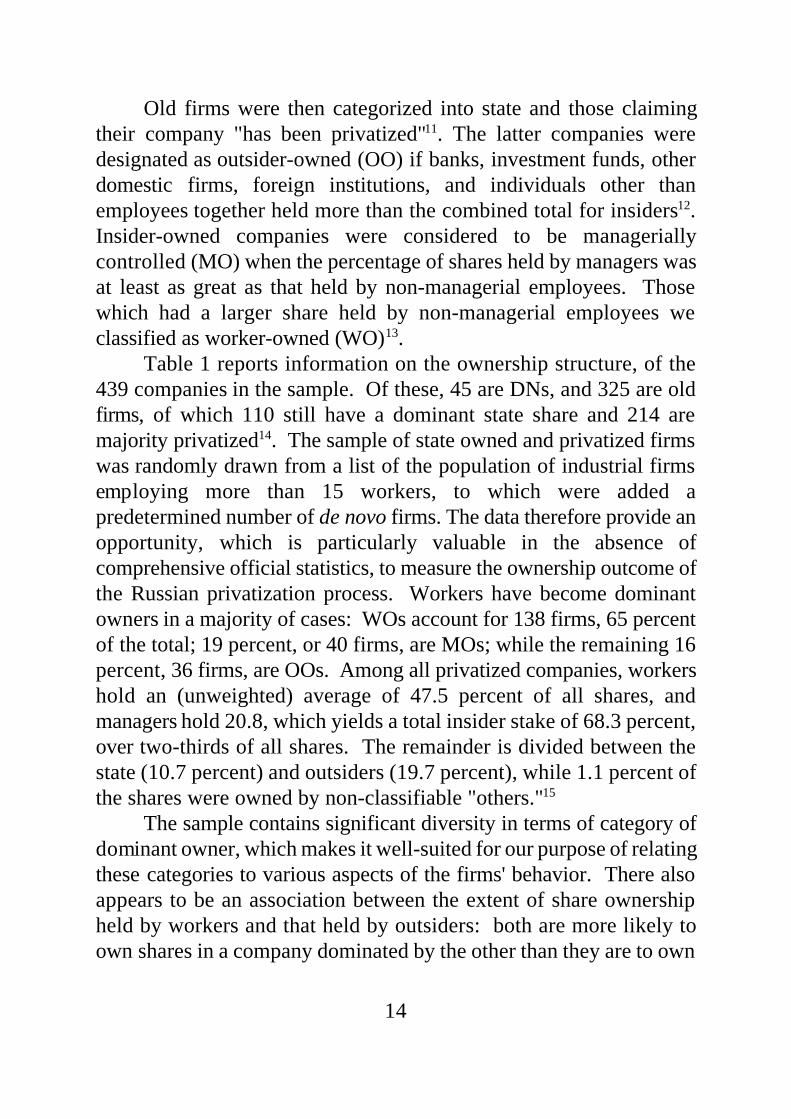
Old firms were then categorized into state and those claimingtheir company "has been privatized"11. The latter companies weredesignated as outsider-owned (OO) if banks, investment funds, otherdomestic firms, foreign institutions, and individuals other thanemployees together held more than the combined total for insiders12.Insider-owned companies were considered to be manageriallycontrolled (MO) when the percentage of shares held by managers wasat least as great as that held by non-managerial employees. Thosewhich had a larger share held by non-managerial employees weclassified as worker-owned (WO)13.
Table 1 reports information on the ownership structure, of the439 companies in the sample. Of these, 45 are DNs, and 325 are oldfirms, of which 110 still have a dominant state share and 214 aremajority privatized14. The sample of state owned and privatized firmswas randomly drawn from a list of the population of industrial firmsemploying more than 15 workers, to which were added apredetermined number of de novo firms. The data therefore provide anopportunity, which is particularly valuable in the absence ofcomprehensive official statistics, to measure the ownership outcome ofthe Russian privatization process. Workers have become dominantowners in a majority of cases: WOs account for 138 firms, 65 percentof the total; 19 percent, or 40 firms, are MOs; while the remaining 16percent, 36 firms, are OOs. Among all privatized companies, workershold an (unweighted) average of 47.5 percent of all shares, andmanagers hold 20.8, which yields a total insider stake of 68.3 percent,over two-thirds of all shares. The remainder is divided between thestate (10.7 percent) and outsiders (19.7 percent), while 1.1 percent ofthe shares were owned by non-classifiable "others."15
The sample contains significant diversity in terms of category ofdominant owner, which makes it well-suited for our purpose of relatingthese categories to various aspects of the firms' behavior. There alsoappears to be an association between the extent of share ownershipheld by workers and that held by outsiders: both are more likely toown shares in a company dominated by the other than they are to own

15
shares in a company dominated by either managers or the state.Managers and outsiders seem particularly loathe to own shares in oneanother's companies. In addition, the state seems to exhibit a slightpreference for share ownership in companies dominated by managersover those dominated by workers and those by outsiders. Together,these results provide some evidence against the somewhat prevalentviews (for instance, in Webster et al (1994)), that managers andworkers are in close coalition with one another in privatized Russianfirms and that managers are more likely than workers to becomeindependent of the state.
Official data on the ownership structure of the newly privatizedcompanies is unavailable. However, our results on ownership sharesare of the same order as those obtained from three earlier surveys thatattempted to obtain some of this information for samples of privatizedcompanies. In Pistor's (1993) sample of 36 firms, all employeestogether received an average of 61.8 percent of all shares, whileoutsiders had 19 percent on average, and the State Property Fundretained 19.3 percent. Blasi's (1994) survey of 127 privatized firmsfound 90 percent with majority employee ownership. On average, allinsiders had 65 percent of shares in his sample, with a median of 60percent.16 Finally, Webster et al (1994) reports on a survey conductedin October 1993 of 92 privatized firms in Moscovskaya andVladimirskaya oblasts. On average, only 10 percent of shares remainedwith the state from these companies, managers had 17 percent, andworkers have 61 percent.
These studies of course rely on small non-random samples, anddid not have information on key aspects of ownership rights, such aswhether shares were voting or non-voting. Our findings also differ,particularly insofar as the managerial stake in the companies in oursample is significantly larger17 and because we did find a significantnumber of outsider-controlled companies among those privatized. Thesurvey was also conducted later, and there may, of course, have beensome evolution of the ownership structure, although most
16
commentators believe such changes have been so far minimal, (seeBlasi and Shleifer (1994)).
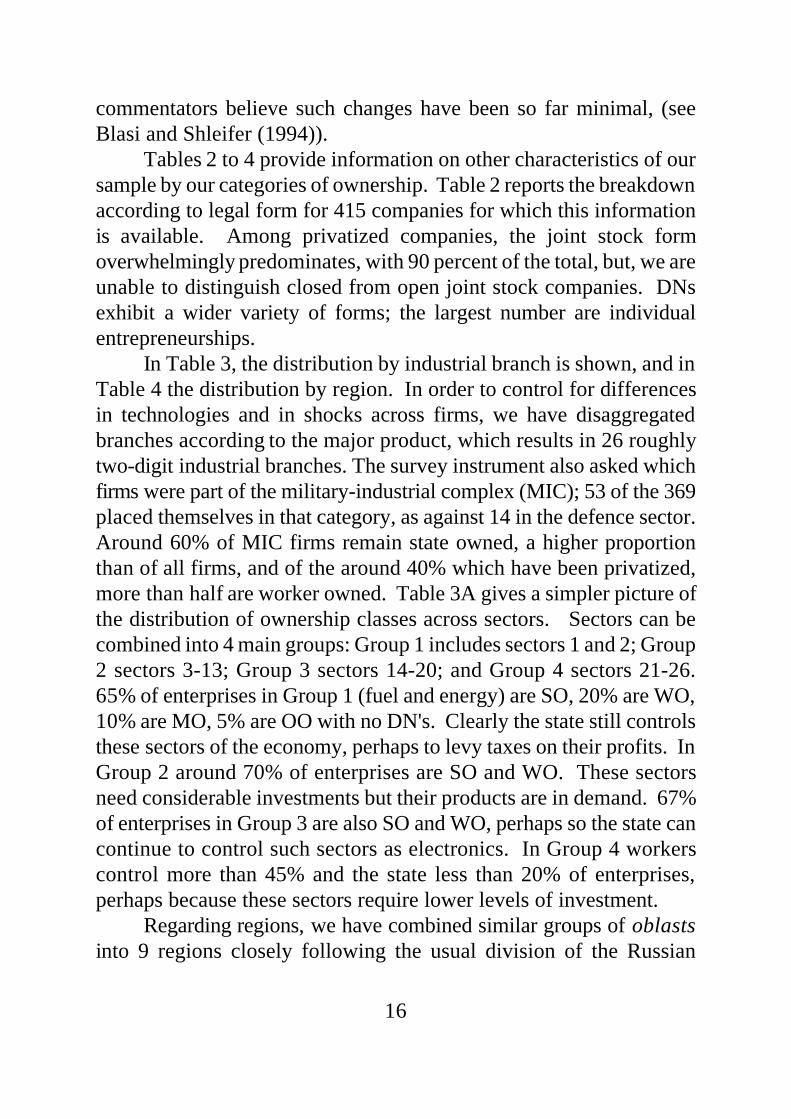
Tables 2 to 4 provide information on other characteristics of oursample by our categories of ownership. Table 2 reports the breakdownaccording to legal form for 415 companies for which this informationis available. Among privatized companies, the joint stock formoverwhelmingly predominates, with 90 percent of the total, but, we areunable to distinguish closed from open joint stock companies. DNsexhibit a wider variety of forms; the largest number are individualentrepreneurships.
In Table 3, the distribution by industrial branch is shown, and inTable 4 the distribution by region. In order to control for differencesin technologies and in shocks across firms, we have disaggregatedbranches according to the major product, which results in 26 roughlytwo-digit industrial branches. The survey instrument also asked whichfirms were part of the military-industrial complex (MIC); 53 of the 369placed themselves in that category, as against 14 in the defence sector.Around 60% of MIC firms remain state owned, a higher proportionthan of all firms, and of the around 40% which have been privatized,more than half are worker owned. Table 3A gives a simpler picture ofthe distribution of ownership classes across sectors. Sectors can becombined into 4 main groups: Group 1 includes sectors 1 and 2; Group2 sectors 3-13; Group 3 sectors 14-20; and Group 4 sectors 21-26.65% of enterprises in Group 1 (fuel and energy) are SO, 20% are WO,10% are MO, 5% are OO with no DN's. Clearly the state still controlsthese sectors of the economy, perhaps to levy taxes on their profits. InGroup 2 around 70% of enterprises are SO and WO. These sectorsneed considerable investments but their products are in demand. 67%of enterprises in Group 3 are also SO and WO, perhaps so the state cancontinue to control such sectors as electronics. In Group 4 workerscontrol more than 45% and the state less than 20% of enterprises,perhaps because these sectors require lower levels of investment.
Regarding regions, we have combined similar groups of oblastsinto 9 regions closely following the usual division of the Russian
17
Federation into 12 economic regions which differ in the level ofeconomic development and infrastructure, the availability of naturaland human resources, their fields of specialization and their geographiclocations. Due to a small number of observations in some regions,however, we have combined the regions of the North and North-West,Central and Central-Chernozem, and Eastern Siberia and Far East. InKaliningrad, we had no observations, and we treat Moscow as aseparate region18.
5. OWNERSHIP AND CONTROL IN RUSSIAN FIRMS
What do these data on the structure of ownership imply for whocontrols Russian firms and for enterprise behavior? Despite therelatively small proportion of managerially dominated firms, and ofmanagerial ownership generally, most observers believe that topmanagers have remained firmly in control (eg Blasi (1994), Boycko,Shleifer and Vishny (1993)). In this section we look at the reporteddegree of "influence" over various types of decisions exercised bydifferent owners, to test whether nominal ownership and effectivecontrols are positively correlated.
"Influence" is measured in our data as a qualitative variable whichcan take on one of three values: "rarely or never influential" (1),"moderate influence" (2), or "dominant, most important" (3). Weassume that these categories are adequate proxies for participation indecision-making concerning the firm's operation and analyze theirrelationship with ownership shares.
Tables 5A, 5B, 5C, and 5D contain the means, by ownership-control type, of the reported influence of several kinds of "actors"19
over four different types of decisions: (A) sales, production, marketing,and current operations; (B) employment, hiring and firing of workers,and social and non-wage benefits; (C) employment, hiring and firing ofmanagement, and managerial compensation; (D) allocation of profits,major investments, sale or lease of major assets, and financial issues
18
generally. One might expect the influence of outside owners to begreater in D than the other decision areas; of workers to be relativelygreater in B; and of managers in A. One would also expect dominantowners to have significantly more influence than other actors in generalon decision-making.
In fact, none of these propositions seems to hold for these data.Rather, in every firm "management and executive boards" are reportedto have the greatest influence on all types of decisions. They areclosely followed by managerial shareholders, while at first glance allother actors dwindle into insignificance.
There are however a few specific areas in which dominantownership category impacts upon control over enterprise decisions.First, we note that worker shareholder control is consistently greatly onaverage than the influence accorded to any other decision-making setof actors, though markedly less than managerial influence. In thisregard, it is particularly worrisome that workers are seen as moderatelyinfluential over the allocation of profit, especially in worker ownedfirms. This sits slightly uneasily with studies which dismiss theinfluence of workers outright (see eg Blasi and Shleifer (1995)). Theflip side is that we find limited evidence of outside owners, eitherindividuals or institutions, having significant influence over enterprisedecisions, though outsiders do have some influence over financialdecisions in OOs, and banks on production and sales. This weakoutside control is despite the fact that the survey suggests that theirshareholdings are considerable (15% on average) and that they aredominant shareholders in around 15% of privatized firms. Thissuggests that, rather than searching for changed shareholdings, one hasto look to changes in control and behavior before applauding thegradual increase in outsider shareholdings in Russian firms. Finally, wenote a continued, if secondary, influence of the state, especially in stateowned firms and in decisions regarding production and the allocationof profit.
We go on to investigate more systematically whether thesemeasures of influence are associated with the magnitude of ownership
19
stakes using correlation analysis. Table 6 contains simple correlationcoefficients between influence and ownership share. The coefficientsare typically low and relatively few are statistically significant20.However, it is interesting to note that the two groups upon whomhigher ownership confers significantly more influence are managers,over the issues of long run resource allocation, and outside individualowners, over all issues except question of short run sales andproduction. Banks as owners also appear to be able to exercise somecontrol via their shareholding over production decisions. Workershareholdings are positively correlated with influence, especially overquestions of managerial employment and long run allocative issues, butthe effect is not quite significant.
These results might be taken as evidence for the common viewthat Russian managers are largely in control of their firms, regardlessof share ownership (see Blasi (1994), Boycko, Shleifer, and Vishny(1993), and Shleifer and Vasilyev (1994)). It must be remembered,however, that in all cases the evidence relies on the self-reportedperceptions of managers themselves. The widespread self-confidenceof managers does not in itself constitute sufficient evidence. Table 6suggests that the higher shareholding yields greater influence, both tooutsiders and to banks, and while the evidence on workershareholdings is weaker, one could imagine a normally quiescentworkforce intervening to prevent drastic restructuring. We therefore goon to examine how closely the objectives of the firm, as demonstratedthrough observable actions, follow the interests of dominantshareholder groups.
6. OWNERSHIP AND ENTERPRISE BEHAVIOR
In this section, we analyze empirically whether differentstructures of shareholding influence enterprise behavior in Russia. Inparticular, we test some of the hypotheses outlined in the secondsection about the relative effects of privatizing to different dominant
20
ownership groups. We report our findings in three subsections,namely,
- changing the nature of the economic relationship betweenthe firm and the state ("depoliticization")
- long and short term restructuring strategies ("reorientation")- short term enterprise performance eg in employment, sales,
exports etc.The latter two subsections conflate the second and third "objectives oftransition" from section 2 above, in a manner dictated by the data.
Unlike in the previous section, where we looked at both thenumber of shares held by each ownership group, and firms categorizedaccording to dominant owner, in the work which follows we look onlyat the five ownership groups by controlling shareholder interest. Ourgeneral approach is to use regression analysis to investigate whetherthere are statistically significant differences in enterprise performanceby dominant ownership category, and if so, whether these differencespersist once we control for sectoral, regional, and firm-specific sourcesof heterogeneity within each ownership class.
Our approach is to estimate four OLS regressions on eachindicator of performance, commencing just with the ownershipdummies, then adding a lagged endogenous variable (where available),then including sectoral and regional dummies and finally alsocontrolling for size by employment in 1991. The simplest equationprovides information on the distribution of performance by ownershiptypes. The second is a dynamic specification which indicates theimpact of ownership on change in performance. Neither of theseequations include any other explanatory variables, and they areintended to describe in a statistically meaningful way the differencesbetween the ownership groups. The third equation tests whetherownership effects on the change in performance can be isolated whena fuller set of explanatory variables has been included as independentvariables to control for firm specific heterogeneity in the data set. Inthe absence of a formal model to guide the choice of independentvariable, and for parsimony and consistency between equations, we
21
prefer to report only regressions which control for competitive marketpressures and locational effects, picked up by sectoral and regionaldummies respectively21. However, since the size of the firm may be animportant variable for certain aspects of Russian transition, especiallywhen comparing de novo with current and former state owned firms,we sometimes also report a final equation which further includes aproxy for firm size, namely employment in 199122. This helps in theanalysis of the relative performance of de novo firms, which couldperform differently because they are new and private, or because theyare new and small (see Richter and Schaffer (1995)23.
6.1. Distancing From the State
In this subsection, we investigate the hypothesis that, relative tostate ownership, outsider owned firms, and especially DNs, will be themost successful in distancing themselves from the state. Betweenmanagerially and worker-owned firms, we want to test whether worker-owned firms become relatively less dependent on the state than theirmanagerially owned counterparts.
Our initial approach is descriptive. In Table 7 we report severalproxies for state influence in, and support for, enterprises. The firstthree variables concern sales of products to state-customers, theargument being that the relationship between the enterprise and thestate will be closer in enterprises producing primarily for procurement,whether military or not. PRFORST2 is the percentage of revenue fromall "government customers," while PRFORST4 is the percentage ofrevenue from the sale of what we infer to be publicly procured goods24.According to both measures, government sales are most important toSOs, followed in order by MOs and OOs, but they are least importantto WOs. Although the standard deviations are large enough to suggestcaution in interpreting the results, on average it does appear that theWOs have the least supply ties to the state among old companies.Surprisingly however, the proportion of total revenue derived fromgovernment sales on the part of DNs is quite high -- 30.8 percent --
22
perhaps providing evidence of some dependency also of the new privatesector on the state in Russia.
PROFORST measures the change in the percentage of revenuederived from sales of publicly procured goods since 199025. Thedecrease averaged only 2.6 percent, with the size of the decline directlyrelated to the current level, so that these sales fell the most in SOs,followed by MOs, OOs, and WOs. Regression results are reported inTable 8.1. In the first column, the only independent variables aredummies for dominant owner groups. We confirm that WOs, OOs, andDNs receive a smaller percentage of their revenue from the state,differences which are significant at the one percent level (for WOs), thefive percent level (for DNs), and the ten percent level (for OOs). Butthese results are level rather than rate of change phenomena; theyvanish in the second column, where PRFORST4 from 1990 is added tothe right-hand side. The lagged dependent variable has a coefficient of.66, which, with a T-statistic of 27.5, accounts for much of thevariation in current sales to the state. This is evidence that there issignificant inertia in sales to the state. The third column shows theresults from adding controls for sector and region, many of which aresignificant, but the most important explanatory variable remains the 4-year lagged dependent variable. In the latter two equations, we do notpick up any significant differences across ownership forms. Thissuggests that the significant rankings by ownership type are selectioneffects by history, region and sector, and the ownership category is notyet significantly affecting the pace of change of sales to the state.
Although it is unlikely to be under the direct influence ofenterprises, the continuing existence of price controls does reflectlingering state involvement in enterprise behavior, as well as an issuefor which influence costs could be quite high. Such controls persistlargely through the ability of local governments to constrain the size ofmarkups. PRICONT in Table 7 is a dummy variable equal to one if thefirm reports that there are "price controls or fixed profit margins on[their] major products," and zero otherwise. By this measure, prices arefar from fully liberalized in Russia, with a full 57 percent of SOs

23
reporting price controls. Distinctly fewer privatized companies, 30-32percent, face controls on their output prices, and the fraction for DNs,24 percent, is still less, although the levels are high in absolute terms.
We now turn to the vexed issue of state support for the enterprisesector. ARRTOST measures the percentage of tax liabilities whichwere more than three months overdue as of April 1, 1994. This followsexactly our predicted pattern. Arrears were highest among SOs at 20percent, followed by MOs and WOs at 13 percent, OOs and DNs at 6percent. The next two variables measure loans received with statesupport. STATLOAN is a dummy variable taking the value of one ifeither of the company's two largest outstanding loans was received fromor mandated or guaranteed by the Central Bank or any state agency andthe value of 0 otherwise. 20 percent of SOs receive such loans, whileonly 13-14 percent of privatized companies and only 9 percent of newprivate firms do. A measure of preferential credits is PREFLOAN, thepercentage of all loans for which the interest rate is below the discountrate of the CBR. Once again, SOs receive the best treatment: 22.1percent of their loans are preferential, compared to 20.6 percent amongOOs, 15.2 percent among WOs, 14.0 percent among DNs, and 6.4percent on average for MOs.
The final set of variables we have to measure the extent ofdepoliticization consists of various indicators of direct governmentassistance to the companies. As shown in Table 7, GOVSUP92,GOVSUP93 and GOVSUP94, are dummy variables equal to one if theenterprise admitted receiving any type of support from the state --subsidies, investments, tax benefits or exemptions, preferential credits,or others -- in 1992, 1993, and 1994, respectively. The percentage ofcompanies reporting support rose from 22 percent in 1992 to 32percent in 1993 before falling back to 26 percent in 1994. The highestpercentage of companies is for the group of SOs, of whom 39 percentreceived support in 1994. Surprisingly, OOs were next with 31percent, followed by MOs and WOs with 20 and DNs as expected wereleast with 16 percent.

24
This pattern is confirmed from estimating logistic regressions withGOVSUP94 as dependent variable are shown in Table 8.2. Alsobefore, the first column shows the simple specification where onlyownership dummies are included on the right-hand side. DNs, WOs,and MOs have a significantly lower probability of receiving statesupport than do SOs, while between SOs and OOs there is nostatistically significant difference. The results in columns 2 and 3,however, make evident that there is quite significant persistence in thereceipt of government support: the lagged dependent variable is highlysignificant in both equations, implying that the same firms receivingsupport in 1993 also tended to receive it in 1994. It is impressive thatthe coefficient on WOs remains statistically significant in theseregressions, implying a systematic regularity that more worker ownedfirms lost support in 1994.
The reported total value (in current mln RBS) of all of the samecategories of government assistance are represented in Table 7 byGOVASS92, GOVASS93, and GOVASS94 for 1992, 1993, and 1994,respectively26. Assistance declined sharply in 1994, to about 20percent of its real value in 1993, once privatization had beenaccomplished. Mean assistance is highest in SOs, next highest in OOs,followed by WOs, MOs, and DNs. Privatized firms receivedsubstantially fewer subsidies than did state-owned enterprises. Becauseownership types also differ by size, we divided government assistanceby employment; GASS94BE equals the ratio of GOVASS94 toemployment in 1994. Scaling by size reduces the difference betweendominant owner types, while preserving their order in the receipt ofassistance. The change in this ratio from 1993 to 1994 is variableGASS43BE, which showed there was little nominal change, but astrong real decline in all the enterprises which we could classify bydominant owner. For example, WOs received only 42 percent of theassistance per employee in 1994 compared to what they received in1993 (measured in 1994 rubles), while OOs received about 32 percent,and MOs about 28 percent. By these measures, Russian budgetconstraints seem to have hardened quite significantly in 1994.

25
The regression results in Table 8.3 provide further support for thisconclusion. In column 1, GOVASS94 is regressed only on ownershipdummies, demonstrating again that the lower level of assistanceprovided to WOs, MOs, and DNs is statistically significantly lower thanthat for SOs, while the OOs show no clear difference. Column 2 addsthe lagged values of the dependent variable, which, as with the previousTable 8.2, reduces most of the ownership dummies to insignificance.The coefficient on WO however remains negative and significant. Inthe following column, however, where sector and regional dummies areadded, even the WO dummy loses significance.
In this sub-section, we have looked at government enterpriserelations in terms of procurement, price controls and subsidy. Thefindings taken together conform with our prior hypotheses - theinfluence of the state via these three channels is most marked in theremaining state owned firms, and least in de novo private firms. Insiderprivatization does act to break the links with the state, though moremarkedly in worker-owned than managerially owned firms.Surprisingly however, the relationship between the state and outsiderfirms remains very strong, comparable to that in state owned firms.This could be explained by selection effects: outsiders may havetended to take control in firms historically closely connected with thestate. In any case, our results demonstrate the powerful inertia in therelationship between the state and the enterprise sector.
6.2. Reorientation of Firm's Objectives and Restructuring
We hypothesized in the second section that privatized firms,particularly those which are outsider-controlled, may be superior tostate-owned firms in most areas of restructuring. In comparing insider-controlled firms, worker ownership might lead to relatively lessunbundling, investment and reduction of labor costs than managerialownership. We test these hypotheses in this section using qualitativedata from the questionnaire recording managers' own views about theirrestructuring strategies. The questions cover four areas of enterprise
26
decision-making: production, marketing, employment policy, andinvestment. Managers are invited to indicate their priorities across avariety of responses in each area, being allowed to respond on a scalefrom 1 (not important) to 3 (very important) for each response. Theresults are tabulated in Table 9, which reports the rank order ofresponses by ownership type and the average response on the 1 to 3scale.
In sharp contrast to the findings concerning depoliticization, wesee little evidence that majority ownership stakes are yet influencingrestructuring strategies among privatized firms, though DNs are clearlysomewhat different. The most striking thing about Table 9 is how littlethe responses vary by ownership type. For example the mean responseacross the ten possible actions under the heading of production strategyvaries between 1.94 and 2.06. The variation is in fact hardly greaterwithin any particular answer. It is perhaps encouraging, however, thatmarketing and investment/finance strategies are on average regarded asslightly more important than production or employment strategies,regardless of ownership type.
Commencing with production strategy, the rank orders ofimportance are remarkably similar in all five ownership types. Theranks in Table 9 rise with the importance attached to a strategy, so wenote that all firms attach least significance in their production strategyto disposing of assets, seeking foreign consultants and closing plants orshops, and most importance to increasing the efficiency of input useand to investments. The only major exceptions are privately ownedfirms, which presumably are not encumbered with poor practices, atleast to the same extent. Hence as we would expect they place lessimportance on investment policy, changing product mix and improvingefficiency of resource use, and emphasize, even more than otherownership groups, technology, product quality and investment.
Privately owned firms are also rather different in terms ofemployment strategies; employment reductions are seen as much lessimportant, presumably because being new organizations, they have notinherited the bloated labor forces of current and former state owned
27
firms. However, apart from this, the similarities across ownership typesare much more revealing than the differences and not entirelyconsistent with the view of unconstrained managerial control. In allownership forms, the most important strategy by far on the labor sideis an increase in wages, followed by the desire to increase wagedifferentials. Outsider-owned firms however place slightly more stresson establishing an internal wage structure than insider-owned firmshowever, and surprisingly slightly less weight on employmentreduction.
Turning to investment strategy, some modest differences begin toappear within the private group. New private firms place particularemphasis on seeking foreign investors and reducing bank borrowing.A similar stress on foreign investment is placed by both state andworker-owned firms. However, managerially owned firms in particular,and outsider firms also, shy away somewhat from foreign involvement;perhaps in the case of the latter category because foreign advice andcapital is less needed and in the case of the former because it wouldthreaten managerial entrenchment. Outside owners also place lessstress on obtaining new loans than any other ownership form.
On the marketing side, all ownership types rate an improvementof marketing and discovering new domestic markets very highly, butplace less emphasis on price adjustments or changing suppliers. Oneintriguing difference, however, is that managerially owned firms placeless weight on increasing exports, while state and worker-owned firmsregard international markets as being of potentially greater importance.
6.3 Enterprise Performance
We conclude our evaluation of the impact of different majorityownership forms by looking, not at the self-reported intentions ofmanagers, but at the behavior of their firms. We report the result ofregression analysis undertaken to analyze various elements of companyperformance in Russia, including sales, employment, exports and pay.Means of the variables under consideration by ownership type are
28
outlined in Table 10, where some differences by ownership type doemerge, though the standard deviations are typically large.
The first variable in Table 10 is sales in 1994. State-owned firmsare much the largest enterprises, followed by worker-owned,managerially owned, outsider-owned and privately owned. The fivetypes of firms in fact increased sales at a similar average rate between1992 and 1994. Size according to employment shows a similar pattern.The Russian firms in our sample are not major exporters outside theformer Soviet Union; on average only 4 percent of sales go to suchcustomers and the maximum observed in the whole sample is only 20percent of total sales. Non-FSU exports are slightly higher on averagein outsider owned and worker owned firms than in SOs or MOs andnegligible in DNs.
The information on profits provided in our survey is poor, but thequestionnaire did ask firms to report whether they were typically profitmakers. The average response to this question is reported in the secondrow of Table 10. As can be seen, according to Russian accountingprocedures most firms normally make profits, and the differences acrossownership types are negligible. Turning to capacity utilization, rates in1994 are very low, averaging around 53 percent across all firms.However, they are higher among DNs and lower in outsider-ownedfirms. The Russian capital stock according to the survey is relativelymodern; only around 32 percent is reported as being more than 15years old. Unsurprisingly, DNs have significantly younger capital onaverage, but SOs, WOs and MOs are all close to the mean. But theproportion of old capital is rather higher in outsider owned firms: 42percent of the total. Finally, average wages for workers and formanagers are highest in DNs and lowest in worker owned firms. State-owned and managerially owned firms are around the mean, while payfor both groups is rather above average in outsider-owned firms.
In the remainder of this section we use regression analysis toinvestigate whether these differences persist once we control forsectoral, regional and firm-specific sources of heterogeneity within each

29
ownership class. Our approach is to estimate the four versions of theperformance equations outlined at the start of this section.
Performance in short term restructuring is analyzed in Tables 11and 12, which explain 1994 sales and non-FSU exports respectively.Commencing with sales, we note from column (1) of Table 11 that denovo private firms are significantly smaller than state owned firms(always the omitted class), as are worker owned firms. However, in thedynamic specification of columns (2) and (3) there are no significantownership effects, though the sign on all privatized firms is positiverelative to SOs. We interpret this to imply that majority ownershipstructures are not yet significantly impacting on the rate of change ofsales, though there is great persistence in turnover as well as significantmarket environment effects from sectors and regions27.
From Table 12 we find that worker-owned, and even more sooutsider-owned firms, export significantly more than the other threeownership types. Despite considerable inertia in export performanceover time, this result persists for worker owned firms in the dynamicspecification, and remains nearly significantly when sectoral andregional fixed effects are taken to account. DNs export notably less; allother ownership forms have a positive sign relative to state ownedfirms. We note from the fourth column that the size of firms is nothowever a significant explanatory variable for non-FSU exports; itsinclusion leaves other results unchanged.
Turning to capacity utilization, we find contrasting ownershipeffects in column(1) of Table 13. There is no significant differencebetween the rate of capacity utilization in WOs, MOs and SOs.However, capacity utilization is significantly lower in outsider ownedfirms, and higher in DNs. The latter is easy to explain - de novo privatefirms did not inherit the same excess capacity and are in fact growing(see Richter and Schaffer (1995)). Perhaps outsiders have takencontrol only of firms with more serious restructuring problems, forinstance having faced a larger output drop or inherited worse capital.It is interesting that these effects typically persist in the dynamicspecifications, so the change in capacity utilization is also correlated
30
significantly with ownership, positively for DNs and negatively foroutsider-owned firms. There is also weak evidence that the furtherdecline in capacity utilization tends to be correlated with employeeownership. Once again, the size of the firm does not impact on theother results, and the size variable is not significant.
It is interesting to ask whether the differences by ownership typeare associated with the vintage of the capital stock. There is someevidence for this view in Table 14, at least with respect to de novoprivate firms. These are found to have a significantly lower proportionof capital more than fifteen years old. However, there is noexplanation of the poor showing of outsider and worker-owned formsvis-a-vis capacity utilization here; the coefficient on OOs is insignificantand on WOs positive and weakly significant. Size of firm is once againnot significant.
A major issue which we predicted would distinguish insider andoutsider privatization was employment. The regressions reported inTable 15 however, provide little support as yet for our hypotheses. Wedo find in column (1) that de novo private firm are significantly smaller.However the equations also reveal very strong persistence ofemployment with significant sectoral effects but no ownership impactin the dynamic specifications. It would not be sensible to include asize effect here, as in other equations, because we measure size of firmby lagged employment to 1991. Finally, we look at insider (managerand worker) remuneration in Tables 16 and 17; one might expect theseto be higher in insider than outsider controlled or state owned firms.In fact, there is no evidence that Russian managers or workers aretaking advantage of their position as yet to pay themselves higherwages. No insider ownership variables are anywhere significant.Interestingly, however, wages of both managers and workers are foundto be higher in de novo private firms, though this is a feature caused byinertia, sector and region rather than adjustment behavior.Interestingly, large firms pay workers more, but not managers.
In summary, therefore, enterprise behavior indicates moreownership effects than we found in terms of managers' self-reported
31
restructuring intentions. However these tend to concern the level ofperformance rather than the pace of adjustment. There is particularlyevidence of differences in behavior between de novo private firms andall other ownership types. Privatization does not yet seem to beaffecting employment or sales adjustment.
7. CONCLUSION
The most widely noted features of Russian privatization havebeen its scale and remarkable speed. In this paper, we have tried toexplore the implications of the privatization program for dominantownership forms, and to analyze the effects of different ownershipstructures for enterprise behavior. Our findings confirm the centralownership role granted by the privatization process to managers andparticularly workers, though it also reveals a higher proportion ofoutsider dominated firms - both privatized and formed de novo - thanexpected. What are the consequences of this ownership structure forenterprise behavior and restructuring, and what are the policyimplication of these findings?
Theory led us to expect much better enterprise performanceacross the board from outsider than state-owned firms, with insider-controlled companies being somewhere in between. The balance ofadvantage between worker and managerial ownership depended on theissue raised, with majority managerial ownership potentially offeringadvantages in long-term and short-term restructuring, but workerownership perhaps superior in achieving a greater degree ofdepoliticization and possibilities for evolution.
Our findings go some way towards confirming these hypotheses.We find significant differences across various aspects of control,behavior and restructuring between state-owned and outsider-ownedfirms, most notably DNs. There are also differences between state andinsider-owned firms, though they are less marked. The balance of
32
advantage between managerially owned and worker-owned firms isunclear overall, but strikingly we confirm that depoliticization is moreassociated with the latter than the former majority ownership form.The results on DNs are particularly encouraging because in other work(see eg Belka, Estrin, Schaffer and Singh (1994)), one of us has arguedthat, in Poland at least, it is the small and middle sized enterprises ofthe de novo private sector which is in fact leading the transitionprocess. Our findings provide an initial indication that the same forcesmay be at work in Russia (see also Richter and Schaffer (1995)).
But our understanding of the Russian privatization process is alsomuch enriched by focusing on the areas in which the data do notsupport our hypotheses. Although still preliminary, the most strikingresult is that the differences between state-owned and privatized firms,regardless of majority ownership form, are typically not very great,especially regarding the key issue of restructuring. This phenomenonis probably explained by the fact that the restructuring which isoccurring at the moment arises primarily from the hardening of budgetconstraints, and this impacts more or less across the board (if notindeed more markedly on state owned firms). Evidence from Poland(see, eg Belka et al (1993), Estrin et al (1993)) suggest that stateowned firms will adjust their behavior in the early phase of transitionsolely in response to hard budget constraints and increased marketcompetition, without any significant impact from changes in ownershipand control. The force of this point is increased when we note that thesurvey was undertaken relatively soon after the mass privatization wascompleted, probably before major behavioral changes could beexpected as a consequence of the new ownership structures.
More subtly, the results for enterprises privatized to outsiders aredisappointing. There is no evidence of greater depoliticization, nor ofdifferences in restructuring strategy, and apart from exports, virtuallyno difference in performance compared with the other privatized firms,the state owned sector. One explanation may be that outsiders havesimply not yet been able to establish effective control over the firms inwhich they have a majority stake; a view consistent with the evidence

33
about managerial dominance over decision-making in the fifth section.There is also some evidence to suggest that outsiders have takenmajority control over somewhat inferior firms, in terms of capacityutilization, overemployment, profitability and so forth. Perhapsinsiders, who by all accounts controlled the firm's privatization processonly accepted majority outsider ownership when the situation of thefirm was so desperate that the wider resources of outsiders were neededto ensure survival of the organization. In this case, the poorperformance of outsiders would be related to the larger scale of the taskin hand, rather than deficiencies of outsider control as a majoritygovernance group.
Finally, we must consider the consequences of worker ownership.Our study reveals that Russian privatization has created an economyprimarily comprising majority worker-owned firms. But the effects onbehavior and restructuring are not yet as disastrous as might have beenpredicted. Many of the reasons we have already noted: for instancethat worker ownership may assist the process of depoliticization, butrestructuring, where it may prove a major impediment, has hardlybegun. Some may take heart from the fact that, even in worker-ownedfirms, managerial control seems assured. However, the fact remainsthat majority worker ownership may present a threat to effectiverestructuring in the future, both in the long term when the key is accessto external capital markets, and in the short term when firms need toaddress the problem of overstaffing.
Policy conclusions follow directly from these findings. First, themass privatization program has of necessity concentrated the attentionof policymakers on the former state-owned sector, but in terms ofperformance and behavior, prospects look better with de novo firms.The government may wish to develop a more systematic strategy forsmall and medium enterprise development, especially in the classicareas of SME weakness: access to outside (loan) capital, managementtraining, and dealing with bureaucracy.
The government may also wish to look more closely at what isgoing on in outsider-controlled firms, to see whether the problems arise
34
from deficiencies in the legal institutions and arrangements forcorporate governance. If so, regulatory changes or more effectiveenforcement of current legal requirements may be required.
Finally, we return to the overhanging threat of majority employeecontrol. We do not feel that the potential governance and behavioralproblems will necessarily be resolved by continued effective managerialcontrol. In situations of conflict between workers and managers, forexample over mass redundancies, either managers will give way to thedominant owner, or they will in some way overrule workers, which iscounter-productive insofar as it acts to undermine emerging propertyrights and the rule of law. The way forward is instead for majorityworker ownership to evolve to new ownership forms, most significantlyoutsider ownership. The key policy is therefore to ensure thatsecondary markets are functioning so that worker shareholdings can betraded, and that purchasers obtain full voting rights with their shares.

35
1. Justification for these objectives and further discussion iscontained in Earle and Estrin (1995)
2. The term "depoliticization" does not precisely capture the conceptwhich we are investigating. According to the Webster New CollegiateDictionary, it means " to take out of the realm of politics". We areconcerned with inculcating a profit orientation and establishing marketdiscipline over firms. This relates to the nature of control overenterprises (eg state versus private), the objectives of the controllinggroup (eg rent versus profit maximizing) and to the environment inwhich they operate (eg soft versus hard budget constraints). For ease ofexposition we henceforth use the term depoliticization to refer to thiscomplex process of firms distancing themselves from the state.
3. Webster and Charap (1993) in an early survey of 99 privatemanufacturing firms in St Petersburg find that the vast majority ofRussian entrepreneurs formerly held high level posts in state ownedenterprises. However, while their skills in the sector are clearlyrelevant, it is unclear that these new entrepreneurs would also be ableto take with them favored access to government grants, let alone rentseeking attitudes.
4. The de novo private sector as a whole, of course, can influenceindustrial and economic restructuring. For example they may invest andminimize labor costs. But they are not adjusting from a former stateowned structure to a market determined optimum, rather adjusting asprofit-maximizers to changing market conditions. As such, we excludethem from the table.
5. Unfortunately, we are able with our data neither to compute theshares held in a FARP nor to assess its effects on behavior.
6. Although the data do not distinguish voting from non-votingshares, we know the method of privatization and were able to make
ENDNOTES
36
adjustments for this factor in our appraisal of corporate control below.
7. According to Boycko, Shleifer, and Vishny (1993), imputing thevalue of the entire Russian capital stock on the basis of the cash valueof vouchers would result in a figure around the net worth of one largeU.S. company.
8. Some evidence may be found in Pistor (1993), who states, for hersample of recently privatized companies, that "trading volumes werelow, and usually occurred among employees and former employees" inthe summer of 1993. Moreover, the prices on the secondary marketswere reportedly still much lower than in the original voucher auctions,again implying extreme shyness on the part of outsiders. Webster et al(1994) also found little evidence of share trading.
9. A major gap in the sample concerns the date of privatization. Wecan assume that most of the privatizations in the State Program wereimplemented from late 1992 until mid-1994, but lease buyouts mayhave taken place earlier.
10. The structure of ownership was not available in someobservations, but often, for instance in unincorporated state enterprises,it could be inferred and imputed. In other cases, firms claimed to beprivatized, but reported that a majority of their shares were still held bythe state; we classified them as state-owned (SO). Problems also arosedue to missing values, answers of an unspecified or ambiguous "other,"and the presence of nonvoting shares. Option 1 in the StatePrivatization Program gave employees 25 percent of the shares free-of-charge, but the shares carried no voting rights; we subtracted thoseshares from the numbers given for insiders, and on this basis reclassifieda number of companies.
11. In the group of potentially privatized, we designated as SO allcompanies in which the federal and regional property fund still owned50 percent or more of the shares.

37
12. Unfortunately, we had no information on which of these entitiesmight themselves still be state-owned, and in our analysis we areimplicitly assuming they are all private.
13. When the data did not permit us to classify companies bydominant owner, including cases of inconsistent answers acrossquestions, the firms are designated "unclassified".
14. The remaining firms are unclassified.
15. The open-ended answers to the ownership (and other) questionsallowed several "other" owners to be classified reliably into one of ourcategories.
16. Thus the distribution is positively skewed, implying that therewere few firms which had a small proportion of insider ownership.Outsiders had an average of 21.5 percent of the shares, and the stateretained 13 percent on average. Blasi also provided information on thedivision of shareholdings between top managers and all otheremployees: top managers had an average of 8.6 percent of all shares(the median was 5 percent).
17. Blasi has pointed out that he defines managers as top managerswhile we refer to all managers. Using our definition, he finds medianmanagerial ownership to be 15%.
18. Our 10 areas were constructed as follows: Moscow (Moscowcity), Center (Vladimirskaya, Voronezhskaya and Moskovskayaoblasts), Urals (Permskaya, Sverdlovskaya oblasts and Bashkorstan),West Siberia (Novosibirskaya, Tyumenskaya, Kemerovskaya oblastsand Altayskiy kraj), East Siberia (Krasnoyarskiy and Primorskiy kraj),Povolzhski (Tatarskaya, Saratovskaya and Samarskaya oblasts), NorthCaucasus (Rostovskaya oblast and Stavropolskiy kraj), North (St.Petersburg and Leningradskaya oblast), North (Arkhangelskaya andVolgogradskaya oblasts), and Volga-Vyatka (Nizhnegordskaya oblast).
19. This includes owners and other actors not specifically identified
38
as owners, but whom we use as proxies for the correspondingownership group, namely local and federal governments and banks.
20. This result remains essentially unchanged when the ownershipshare variables are allowed non-linear effects as follows: less than 10percent was reclassified as "1", 10 to 25 percent as "2", and over 25percent as "3".
21. A persistent problem with this data set is that, because of missingvalues scattered across variables, a change in specification of theequation can lead to major changes in the size of the data set uponwhich the model is estimated. These differences are minimized byincluding only lagged endogenous variables (since firms typicallyreport the previous value for a variable if they report it currently) andsectoral and regional dummies (which we have for all firms). Thenumber of observations will typically be smaller when firm size isincluded in the fourth specification.
22. In the cases where we estimated equations with such aspecification, the data set is a slightly updated version.
23. We are indebted to Mark Schaffer for suggesting this line ofenquiry.
24. The variable is defined as the sum of "Military goods" and "non-military goods purchased by the state (hospital products, schoolbooks,etc.)"; PRFORST4 is therefore smaller than PRFORST2.
25. The change in PRFORST2 is unavailable.
26. Because data are provided in the table only for the first half of1994, the comparisons in this paragraph multiply the amount ofassistance for 1994 by two. When calculating real changes, we employthe relevant price index for the first half of 1994.
27. The fourth equation, controlling for size, is not included in Table11 because of the close relationship between sales and employment. As
39
expected, in the regression employment was found to have a positiveand significant coefficient.
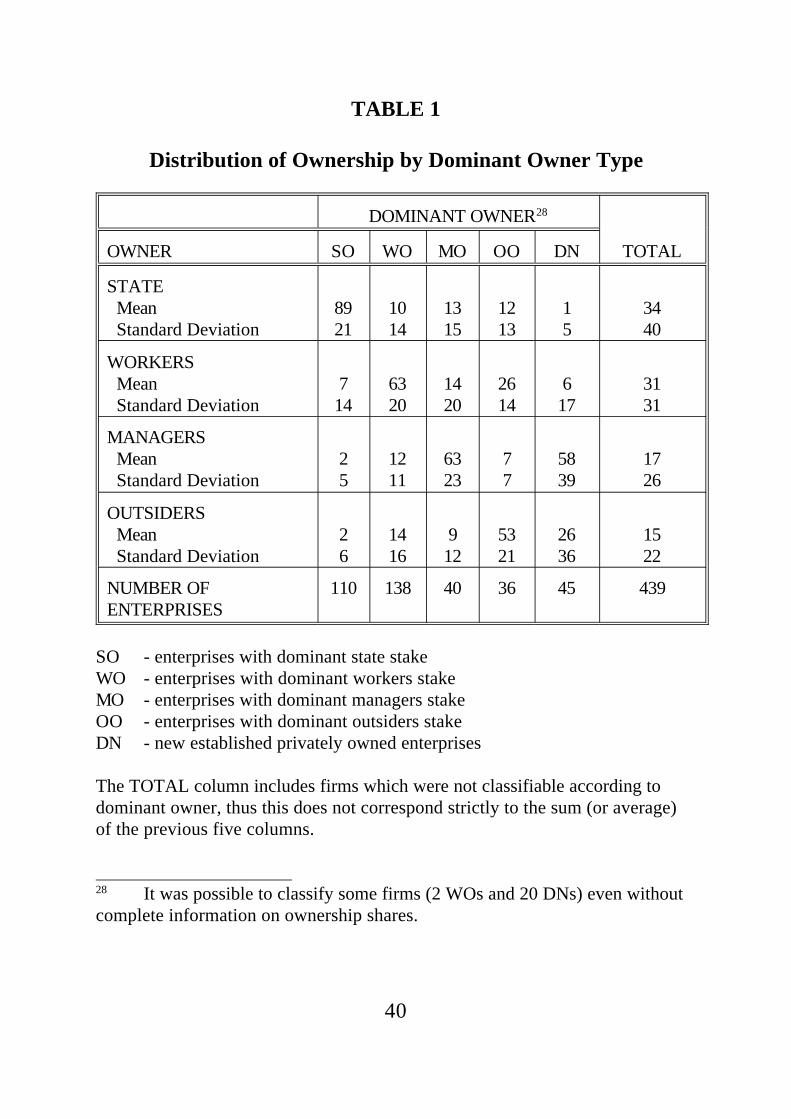
40
TABLE 1
Distribution of Ownership by Dominant Owner Type
DOMINANT OWNER28
OWNER SO WO MO OO DN TOTAL
STATE Mean Standard Deviation
8921
1014
1315
1213
15
3440
WORKERS Mean Standard Deviation
714
6320
1420
2614
617
3131
MANAGERS Mean Standard Deviation
25
1211
6323
77
5839
1726
OUTSIDERS Mean Standard Deviation
26
1416
912
5321
2636
1522
NUMBER OFENTERPRISES
110 138 40 36 45 439
SO - enterprises with dominant state stakeWO - enterprises with dominant workers stakeMO - enterprises with dominant managers stakeOO - enterprises with dominant outsiders stakeDN - new established privately owned enterprises
The TOTAL column includes firms which were not classifiable according todominant owner, thus this does not correspond strictly to the sum (or average)of the previous five columns.
28 It was possible to classify some firms (2 WOs and 20 DNs) even withoutcomplete information on ownership shares.
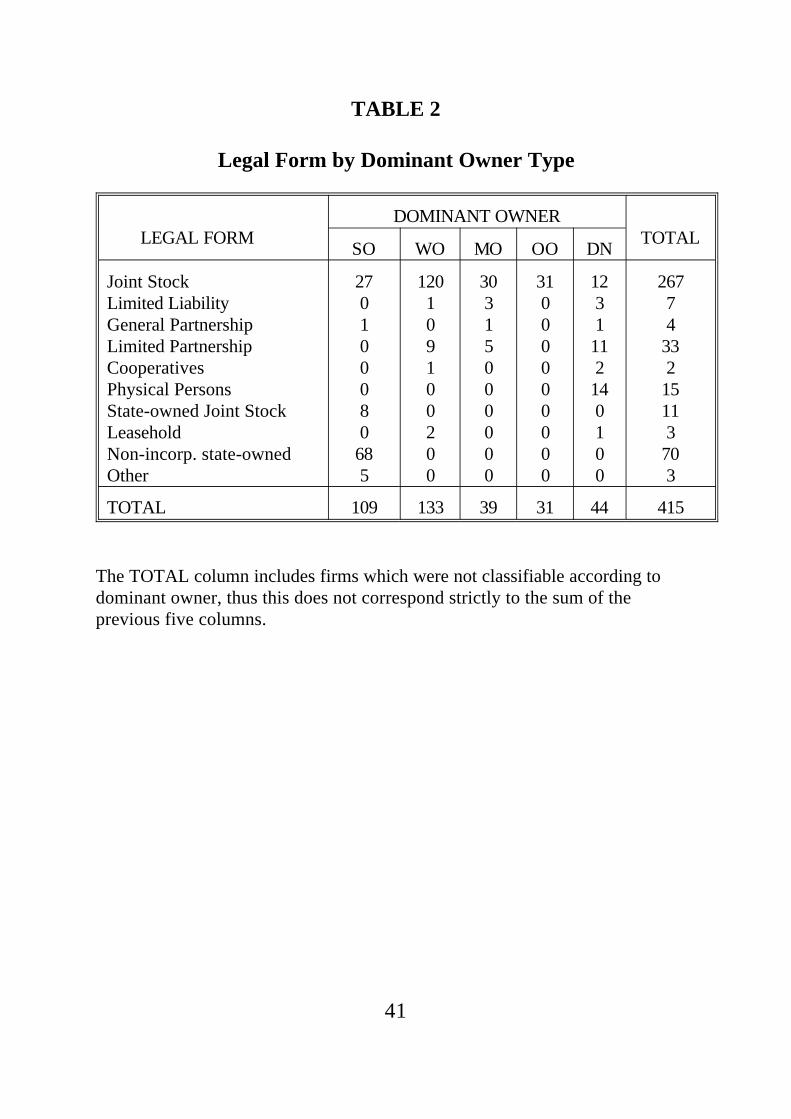
41
TABLE 2
Legal Form by Dominant Owner Type
LEGAL FORMDOMINANT OWNER
TOTALSO WO MO OO DN
Joint StockLimited LiabilityGeneral PartnershipLimited PartnershipCooperativesPhysical Persons State-owned Joint StockLeaseholdNon-incorp. state-ownedOther
270100080
685
120109100200
30315000000
31000000000
1231
112
140100
26774
332
15113
703
TOTAL 109 133 39 31 44 415
The TOTAL column includes firms which were not classifiable according todominant owner, thus this does not correspond strictly to the sum of theprevious five columns.
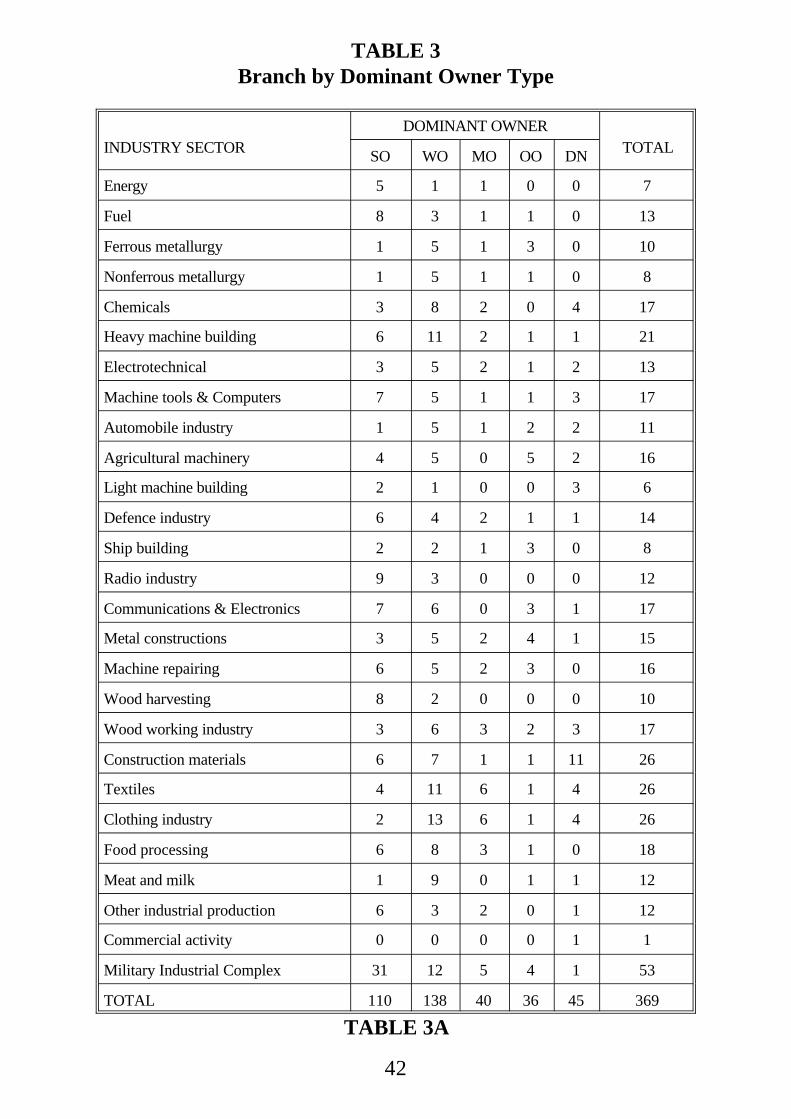
42
TABLE 3Branch by Dominant Owner Type
INDUSTRY SECTORDOMINANT OWNER
TOTALSO WO MO OO DN
Energy 5 1 1 0 0 7
Fuel 8 3 1 1 0 13
Ferrous metallurgy 1 5 1 3 0 10
Nonferrous metallurgy 1 5 1 1 0 8
Chemicals 3 8 2 0 4 17
Heavy machine building 6 11 2 1 1 21
Electrotechnical 3 5 2 1 2 13
Machine tools & Computers 7 5 1 1 3 17
Automobile industry 1 5 1 2 2 11
Agricultural machinery 4 5 0 5 2 16
Light machine building 2 1 0 0 3 6
Defence industry 6 4 2 1 1 14
Ship building 2 2 1 3 0 8
Radio industry 9 3 0 0 0 12
Communications & Electronics 7 6 0 3 1 17
Metal constructions 3 5 2 4 1 15
Machine repairing 6 5 2 3 0 16
Wood harvesting 8 2 0 0 0 10
Wood working industry 3 6 3 2 3 17
Construction materials 6 7 1 1 11 26
Textiles 4 11 6 1 4 26
Clothing industry 2 13 6 1 4 26
Food processing 6 8 3 1 0 18
Meat and milk 1 9 0 1 1 12
Other industrial production 6 3 2 0 1 12
Commercial activity 0 0 0 0 1 1
Military Industrial Complex 31 12 5 4 1 53
TOTAL 110 138 40 36 45 369
TABLE 3A
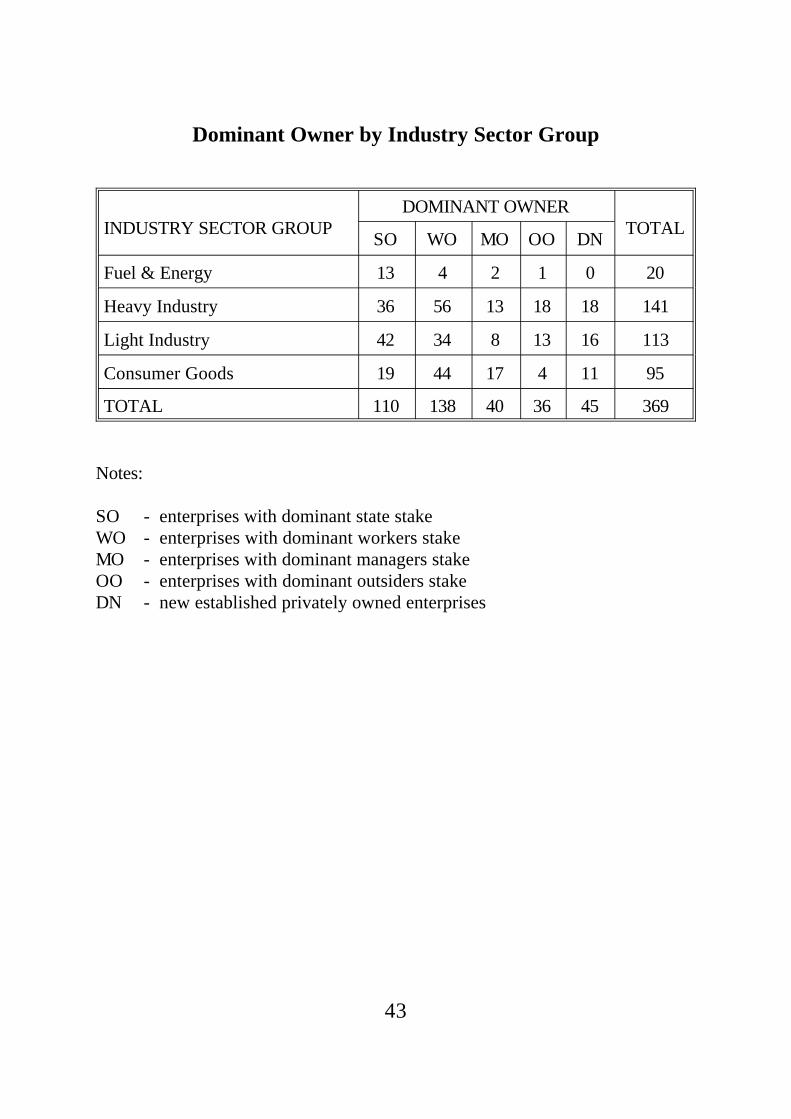
43
Dominant Owner by Industry Sector Group
INDUSTRY SECTOR GROUPDOMINANT OWNER
TOTALSO WO MO OO DN
Fuel & Energy 13 4 2 1 0 20
Heavy Industry 36 56 13 18 18 141
Light Industry 42 34 8 13 16 113
Consumer Goods 19 44 17 4 11 95
TOTAL 110 138 40 36 45 369
Notes:
SO - enterprises with dominant state stakeWO - enterprises with dominant workers stakeMO - enterprises with dominant managers stakeOO - enterprises with dominant outsiders stakeDN - new established privately owned enterprises

44
TABLE 4
Region by Dominant Owner Type
REGION TOTALDOMINANT OWNER
SO WO MO OO DN
NORTH 53 17 16 6 10 4
VOLGA-VYATKA 21 6 9 1 2 3
POVOLZHSKI 49 21 18 5 1 4
NORTH CAUCASUS 36 1 23 5 3 4
URALS 49 18 14 5 6 6
WSIBERIA 43 13 21 3 4 2
ESIBERIA 29 8 6 6 3 6
MOSCOW 43 16 11 6 3 7
CENTRE 46 10 20 3 4 9
TOTAL 369 110 138 40 36 45
Notes:
SO - enterprises with dominant state stakeWO - enterprises with dominant workers stakeMO - enterprises with dominant managers stakeOO - enterprises with dominant outsiders stakeDN - new established privately owned enterprises
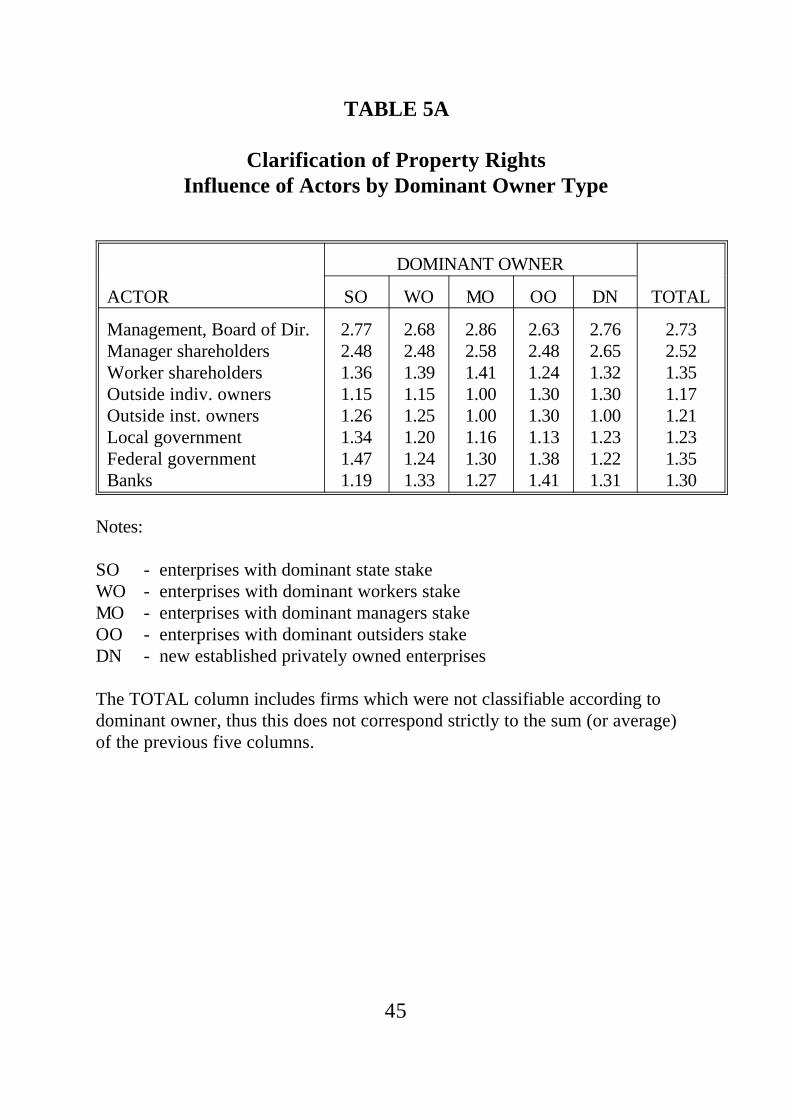
45
TABLE 5A
Clarification of Property RightsInfluence of Actors by Dominant Owner Type
DOMINANT OWNER
ACTOR SO WO MO OO DN TOTAL
Management, Board of Dir.Manager shareholdersWorker shareholdersOutside indiv. ownersOutside inst. ownersLocal governmentFederal governmentBanks
2.772.481.361.151.261.341.471.19
2.682.481.391.151.251.201.241.33
2.862.581.411.001.001.161.301.27
2.632.481.241.301.301.131.381.41
2.762.651.321.301.001.231.221.31
2.732.521.351.171.211.231.351.30
Notes:
SO - enterprises with dominant state stakeWO - enterprises with dominant workers stakeMO - enterprises with dominant managers stakeOO - enterprises with dominant outsiders stakeDN - new established privately owned enterprises
The TOTAL column includes firms which were not classifiable according todominant owner, thus this does not correspond strictly to the sum (or average)of the previous five columns.
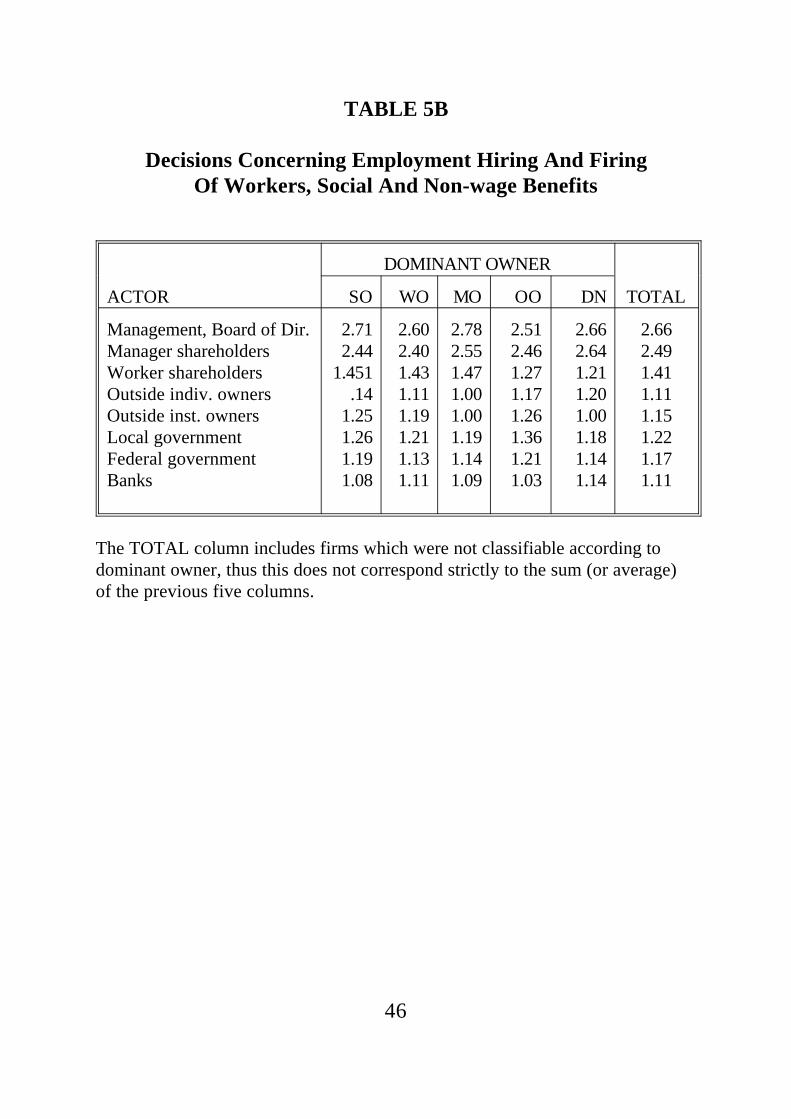
46
TABLE 5B
Decisions Concerning Employment Hiring And FiringOf Workers, Social And Non-wage Benefits
DOMINANT OWNER
ACTOR SO WO MO OO DN TOTAL
Management, Board of Dir.Manager shareholdersWorker shareholdersOutside indiv. ownersOutside inst. ownersLocal governmentFederal governmentBanks
2.712.44
1.451.14
1.251.261.191.08
2.602.401.431.111.191.211.131.11
2.782.551.471.001.001.191.141.09
2.512.461.271.171.261.361.211.03
2.662.641.211.201.001.181.141.14
2.662.491.411.111.151.221.171.11
The TOTAL column includes firms which were not classifiable according todominant owner, thus this does not correspond strictly to the sum (or average)of the previous five columns.
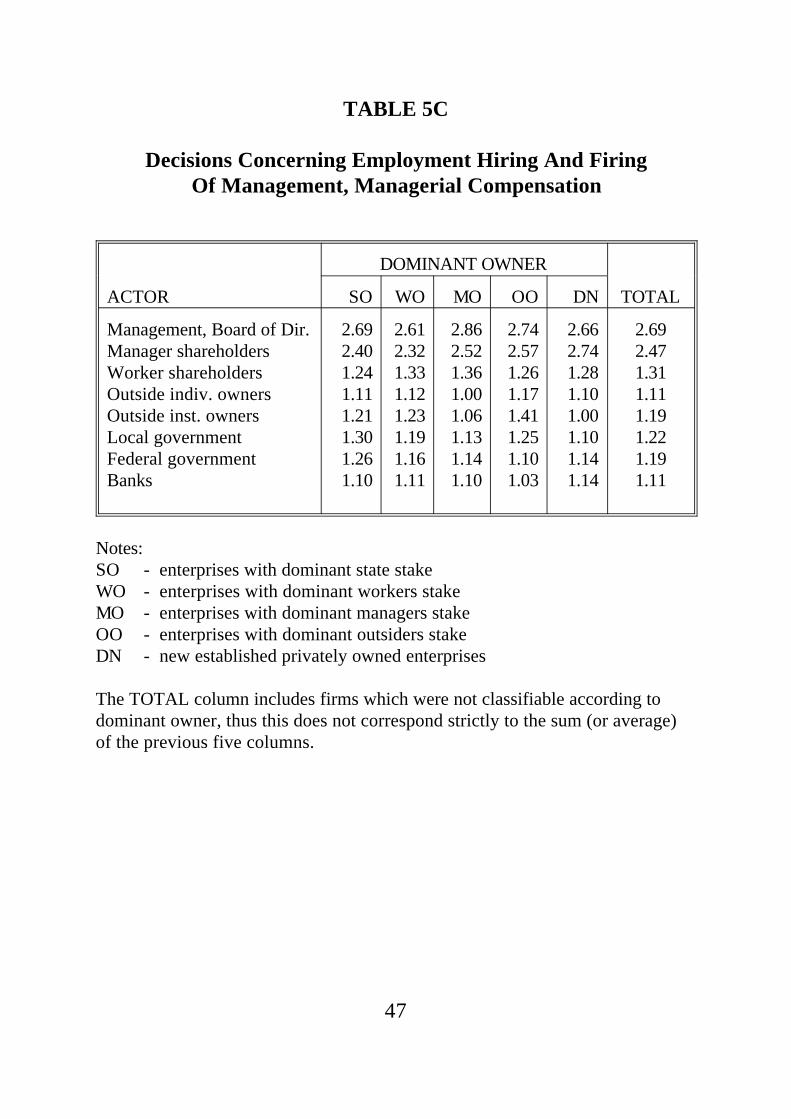
47
TABLE 5C
Decisions Concerning Employment Hiring And FiringOf Management, Managerial Compensation
DOMINANT OWNER
ACTOR SO WO MO OO DN TOTAL
Management, Board of Dir.Manager shareholdersWorker shareholdersOutside indiv. ownersOutside inst. ownersLocal governmentFederal governmentBanks
2.692.401.241.111.211.301.261.10
2.612.321.331.121.231.191.161.11
2.862.521.361.001.061.131.141.10
2.742.571.261.171.411.251.101.03
2.662.741.281.101.001.101.141.14
2.692.471.311.111.191.221.191.11
Notes:SO - enterprises with dominant state stakeWO - enterprises with dominant workers stakeMO - enterprises with dominant managers stakeOO - enterprises with dominant outsiders stakeDN - new established privately owned enterprises
The TOTAL column includes firms which were not classifiable according todominant owner, thus this does not correspond strictly to the sum (or average)of the previous five columns.

48
TABLE 5D
Decisions Concerning Allocation Of Profits, Major Investments,Sales Or Lease Of Major Assets, Financial Issues Generally
DOMINANT OWNER
ACTOR SO WO MO OO DN TOTAL
Management, Board of Dir.Manager shareholdersWorker shareholdersOutside indiv. ownersOutside inst. ownersLocal governmentFederal governmentBanks
2.772.471.421.191.461.341.461.24
2.872.531.681.231.341.271.251.27
2.922.811.631.101.121.231.281.13
2.672.411.261.431.631.331.321.23
2.632.711.261.221.001.291.271.22
2.812.591.531.251.371.291.321.23
Notes:SO - enterprises with dominant state stakeWO - enterprises with dominant workers stakeMO - enterprises with dominant managers stakeOO - enterprises with dominant outsiders stakeDN - new established privately owned enterprises
The TOTAL column includes firms which were not classifiable according todominant owner, thus this does not correspond strictly to the sum (or average) ofthe previous five columns.
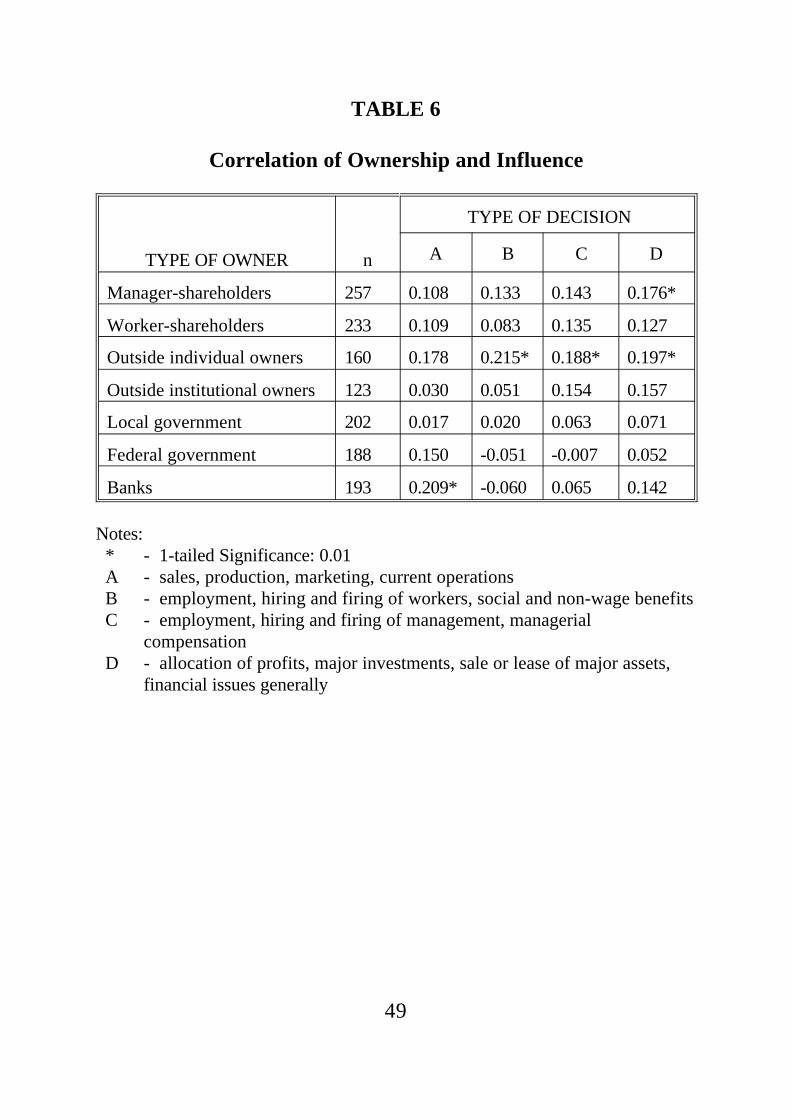
49
TABLE 6
Correlation of Ownership and Influence
TYPE OF OWNER n
TYPE OF DECISION
A B C D
Manager-shareholders 257 0.108 0.133 0.143 0.176*
Worker-shareholders 233 0.109 0.083 0.135 0.127
Outside individual owners 160 0.178 0.215* 0.188* 0.197*
Outside institutional owners 123 0.030 0.051 0.154 0.157
Local government 202 0.017 0.020 0.063 0.071
Federal government 188 0.150 -0.051 -0.007 0.052
Banks 193 0.209* -0.060 0.065 0.142
Notes: * - 1-tailed Significance: 0.01 A - sales, production, marketing, current operations B - employment, hiring and firing of workers, social and non-wage benefits C - employment, hiring and firing of management, managerial
compensation D - allocation of profits, major investments, sale or lease of major assets,
financial issues generally

50
TABLE 7
Depoliticization
DOMINANT OWNER
SO WO MO OO DN TOTAL
PRFORST2 Mean Standard DeviationPRFORST4 Mean Standard DeviationPROFORST Mean Standard DeviationPRICONT Mean Standard DeviationARRTOST Mean Standard DeviationSTATLOAN Mean Standard DeviationPREFLOAN Mean Standard Deviation
32.7242.00
9.9324.66
-5.5617.41
.57
.52
20.0033.67
.20
.40
22.0935.49
22.5635.44
2.2112.34
-1.085.18
.32
.47
13.0327.24
.14
.34
15.2127.54
24.0337.43
7.5821.98
-2.8911.31
.32
.47
13.1624.77
.13
.33
6.4015.79
23.8240.95
3.1013.93
-1.939.90
.30
.47
6.2521.65
.14
.36
20.5825.26
30.7742.09
3.0211.03
.203.26
.24
.43
6.1522.19
.09
.29
14.0031.94
26.2738.61
5.5019.18
-2.5611.56
.38
.48
13.8828.56
.13
.34
16.0328.38
Definitions:PRFORST4 = percentage of production to the state out of the total revenues in 1994;PRFORST(T-4) = percentage of production to the state out of the total revenues in 1990;PROFORST = change in percentage of total revenue provided by these goods in 1994 comparedto 1990.ARRTOST = percentage of liabilities to the state which are overdue more than three months.PRICONT=dummy which takes on value of 1 if there is rice control and 0 otherwise.STATLOAN=dummy which takes on value 1 if enterprise received any loan from government.PREFLOAN=percentage of total loans received at the central bank discount rate.
The TOTAL column includes firms which were not classifiable according to dominant owner,thus this does not correspond strictly to the sum (or average) of the previous five columns.
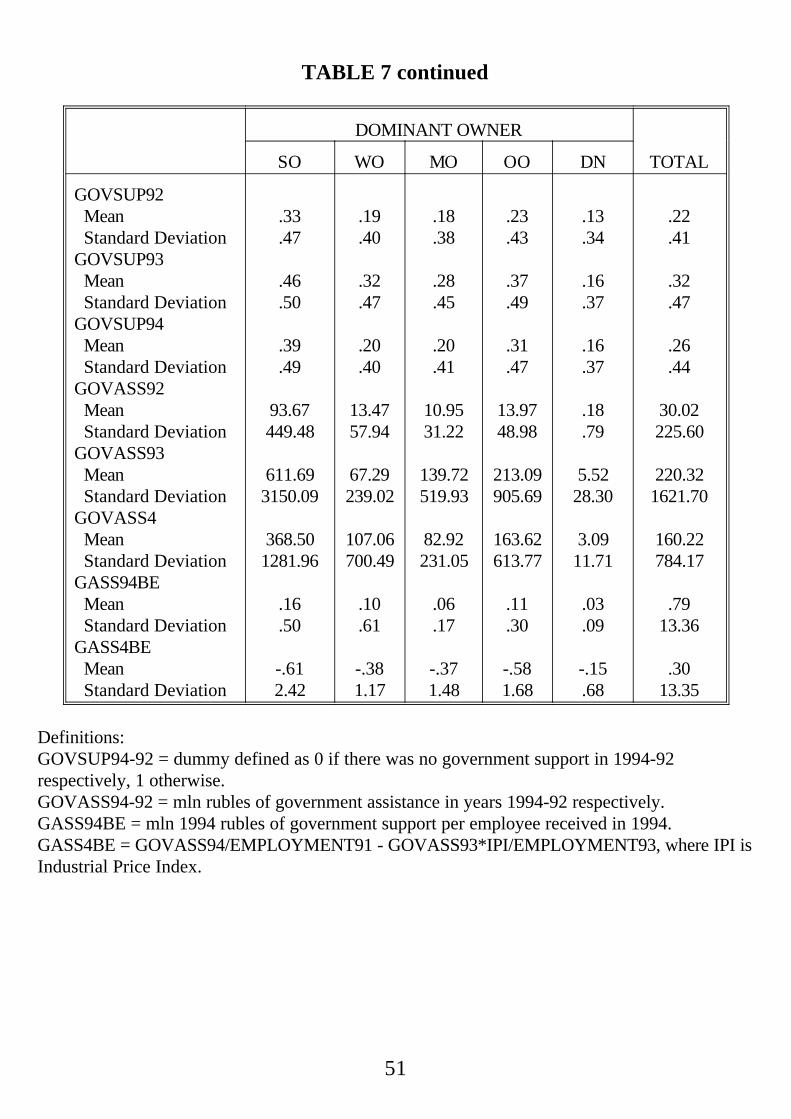
51
TABLE 7 continued
DOMINANT OWNER
SO WO MO OO DN TOTAL
GOVSUP92 Mean Standard DeviationGOVSUP93 Mean Standard DeviationGOVSUP94 Mean Standard DeviationGOVASS92 Mean Standard DeviationGOVASS93 Mean Standard DeviationGOVASS4 Mean Standard DeviationGASS94BE Mean Standard DeviationGASS4BE Mean Standard Deviation
.33
.47
.46
.50
.39
.49
93.67449.48
611.693150.09
368.501281.96
.16
.50
-.612.42
.19
.40
.32
.47
.20
.40
13.4757.94
67.29239.02
107.06700.49
.10
.61
-.381.17
.18
.38
.28
.45
.20
.41
10.9531.22
139.72519.93
82.92231.05
.06
.17
-.371.48
.23
.43
.37
.49
.31
.47
13.9748.98
213.09905.69
163.62613.77
.11
.30
-.581.68
.13
.34
.16
.37
.16
.37
.18
.79
5.5228.30
3.0911.71
.03
.09
-.15.68
.22
.41
.32
.47
.26
.44
30.02225.60
220.321621.70
160.22784.17
.7913.36
.3013.35
Definitions:GOVSUP94-92 = dummy defined as 0 if there was no government support in 1994-92respectively, 1 otherwise.GOVASS94-92 = mln rubles of government assistance in years 1994-92 respectively.GASS94BE = mln 1994 rubles of government support per employee received in 1994.GASS4BE = GOVASS94/EMPLOYMENT91 - GOVASS93*IPI/EMPLOYMENT93, where IPI isIndustrial Price Index.
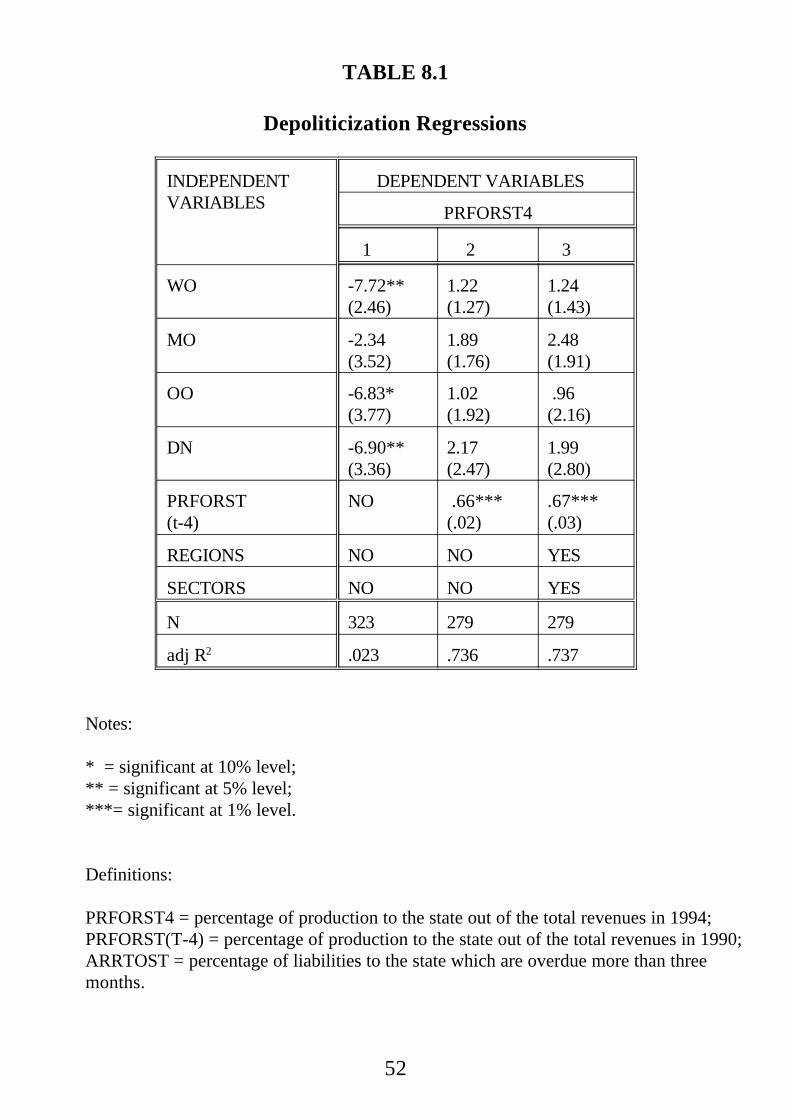
52
TABLE 8.1
Depoliticization Regressions
INDEPENDENTVARIABLES
DEPENDENT VARIABLES
PRFORST4
1 2 3
WO -7.72**(2.46)
1.22(1.27)
1.24(1.43)
MO -2.34(3.52)
1.89(1.76)
2.48(1.91)
OO -6.83*(3.77)
1.02(1.92)
.96(2.16)
DN -6.90**(3.36)
2.17(2.47)
1.99(2.80)
PRFORST(t-4)
NO .66***(.02)
.67***(.03)
REGIONS NO NO YES
SECTORS NO NO YES
N 323 279 279
adj R2 .023 .736 .737
Notes:
* = significant at 10% level;** = significant at 5% level;***= significant at 1% level.
Definitions:
PRFORST4 = percentage of production to the state out of the total revenues in 1994;PRFORST(T-4) = percentage of production to the state out of the total revenues in 1990;ARRTOST = percentage of liabilities to the state which are overdue more than threemonths.

53
TABLE 8.2
Depoliticization Regressions: Existence of Government Support(logits)
INDEPENDENTVARIABLES
DEPENDENT VARIABLE: GOVSUP94
1 2 3
WO -.94***(.29)
-.84**(.38)
-1.21***(.47)
MO -.94**(.44)
-.58(.57)
-.56(.66)
OO -.34(.41)
-.10(.56)
-.47(.66)
DN -1.25(.46)
-.30(.58)
.05(.70)
GOVSUP92 NO .51(.37)
.21(.45)
GOVSUP93 NO 3.16***(.39)
3.64***(.49)
REGIONS NO NO YES
SECTORS NO NO YES
CORRECTPREDICTIONS(PROPORTION)
73.78 86.22 87.57
N 370 370 370
Notes:
* = significant at 10% level;** = significant at 5% level;***= significant at 1% level.
Definitions:
GOVSUP94-92 = dummy defined as 0 if there was no government support in 1994-92respectively, 1 otherwise.
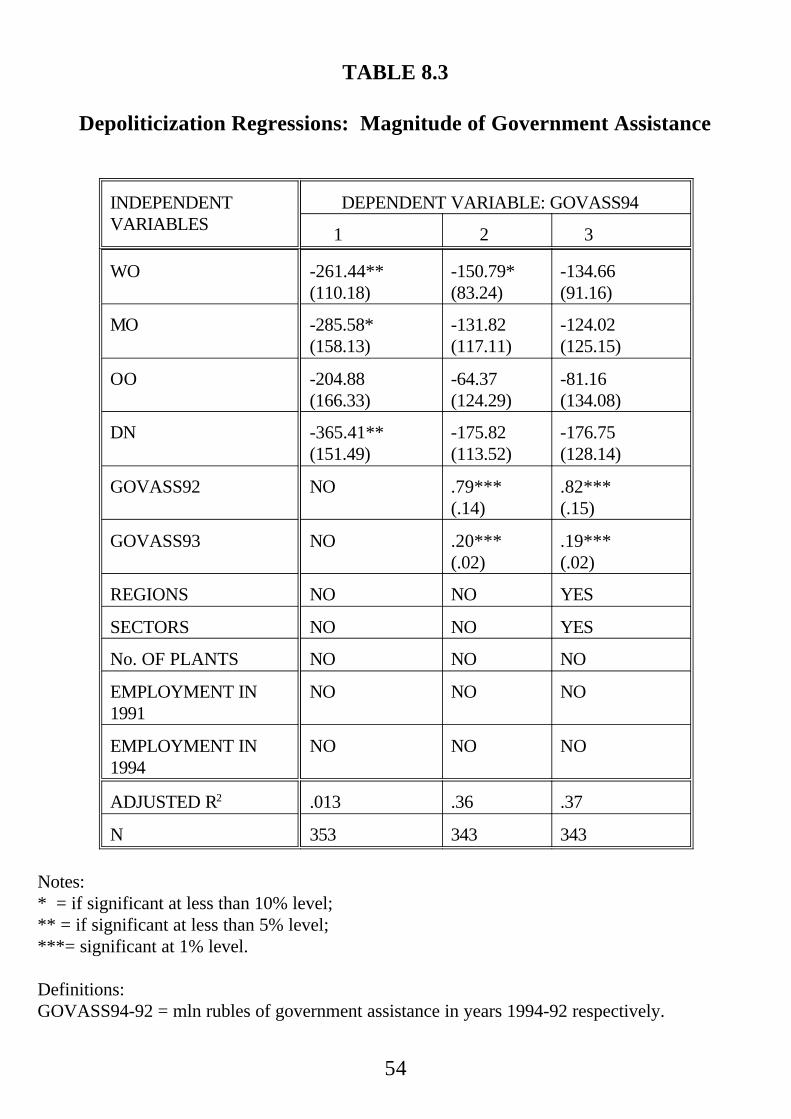
54
TABLE 8.3
Depoliticization Regressions: Magnitude of Government Assistance
INDEPENDENTVARIABLES
DEPENDENT VARIABLE: GOVASS94
1 2 3
WO -261.44**(110.18)
-150.79*(83.24)
-134.66(91.16)
MO -285.58*(158.13)
-131.82(117.11)
-124.02(125.15)
OO -204.88(166.33)
-64.37(124.29)
-81.16(134.08)
DN -365.41**(151.49)
-175.82(113.52)
-176.75(128.14)
GOVASS92 NO .79***(.14)
.82***(.15)
GOVASS93 NO .20***(.02)
.19***(.02)
REGIONS NO NO YES
SECTORS NO NO YES
No. OF PLANTS NO NO NO
EMPLOYMENT IN1991
NO NO NO
EMPLOYMENT IN1994
NO NO NO
ADJUSTED R2 .013 .36 .37
N 353 343 343
Notes:* = if significant at less than 10% level;** = if significant at less than 5% level;***= significant at 1% level.
Definitions:GOVASS94-92 = mln rubles of government assistance in years 1994-92 respectively.
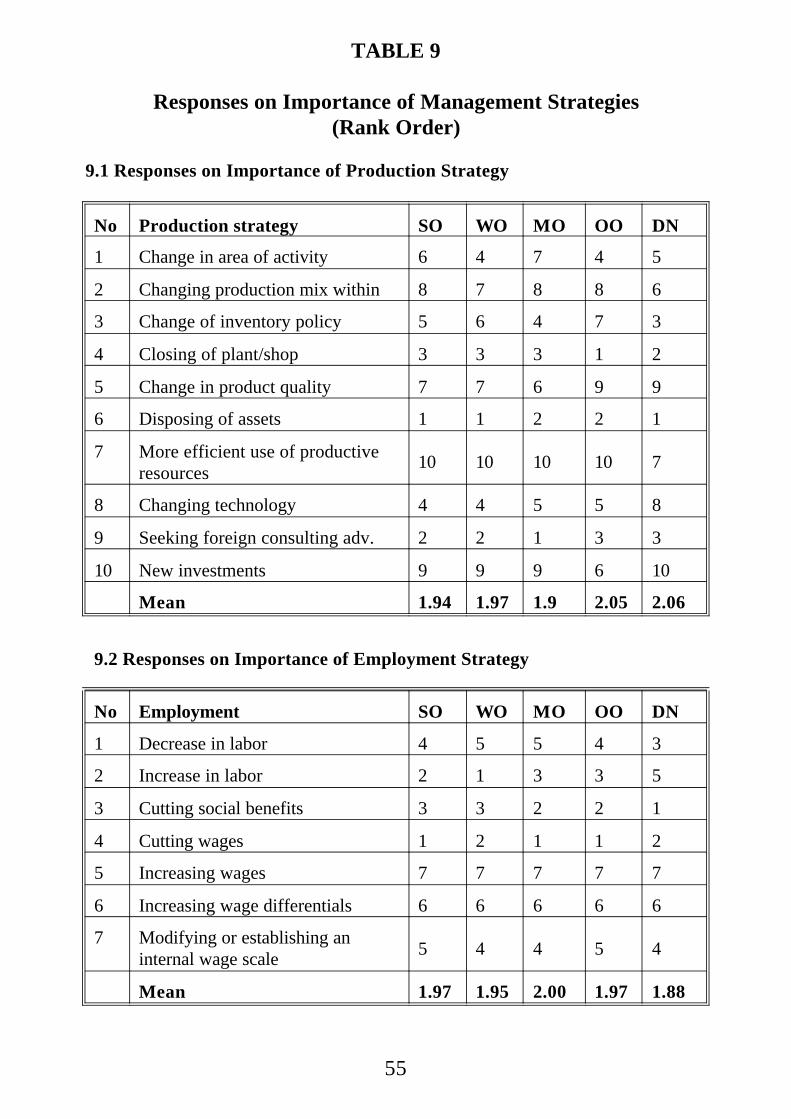
55
TABLE 9
Responses on Importance of Management Strategies(Rank Order)
9.1 Responses on Importance of Production Strategy
No Production strategy SO WO MO OO DN
1 Change in area of activity 6 4 7 4 5
2 Changing production mix within 8 7 8 8 6
3 Change of inventory policy 5 6 4 7 3
4 Closing of plant/shop 3 3 3 1 2
5 Change in product quality 7 7 6 9 9
6 Disposing of assets 1 1 2 2 1
7 More efficient use of productiveresources
10 10 10 10 7
8 Changing technology 4 4 5 5 8
9 Seeking foreign consulting adv. 2 2 1 3 3
10 New investments 9 9 9 6 10
Mean 1.94 1.97 1.9 2.05 2.06
9.2 Responses on Importance of Employment Strategy
No Employment SO WO MO OO DN
1 Decrease in labor 4 5 5 4 3
2 Increase in labor 2 1 3 3 5
3 Cutting social benefits 3 3 2 2 1
4 Cutting wages 1 2 1 1 2
5 Increasing wages 7 7 7 7 7
6 Increasing wage differentials 6 6 6 6 6
7 Modifying or establishing aninternal wage scale 5 4 4 5 4
Mean 1.97 1.95 2.00 1.97 1.88

56
9.3 Responses on Importance of Investment Strategy
No Investment strategy SO WO MO OO DN
1 Reducing new bank borrowing 6 5 6 5 7
2 Reschedule loans 3/4 2 3/4 2 5
3 Obtain new loans from banks 2 4 3/4 1 2
4 Obtain new loans fromnon banks
1 1 1 3 3
5 Lengthening period for payables 5 6 7 7 1
6 Reducing outstanding receivables 8 8 8 8 6
7 Change bank connections 3/4 3 2 4 4
8 Seeking foreign investors 7 7 5 6 8
Mean 2.12 2.15 2.14 2.21 2.07
No Marketing strategy SO WO MO OO DN
1 Improve marketing 7 6 7 7 6
2 Change distribution network 3 5 5 6 4
3 Change suppliers 2 2 3 2 2
4 Seeking new domestic markets 6 7 6 5 7
5 Increasing export efforts 5 4 1 3 3
6 Increase product price relative tocompetitors 1 1 2 1 1
7 Drop product price relative tocompetitors
4 3 4 4 5
Mean 2.06 2.14 2.07 2.13 2.04
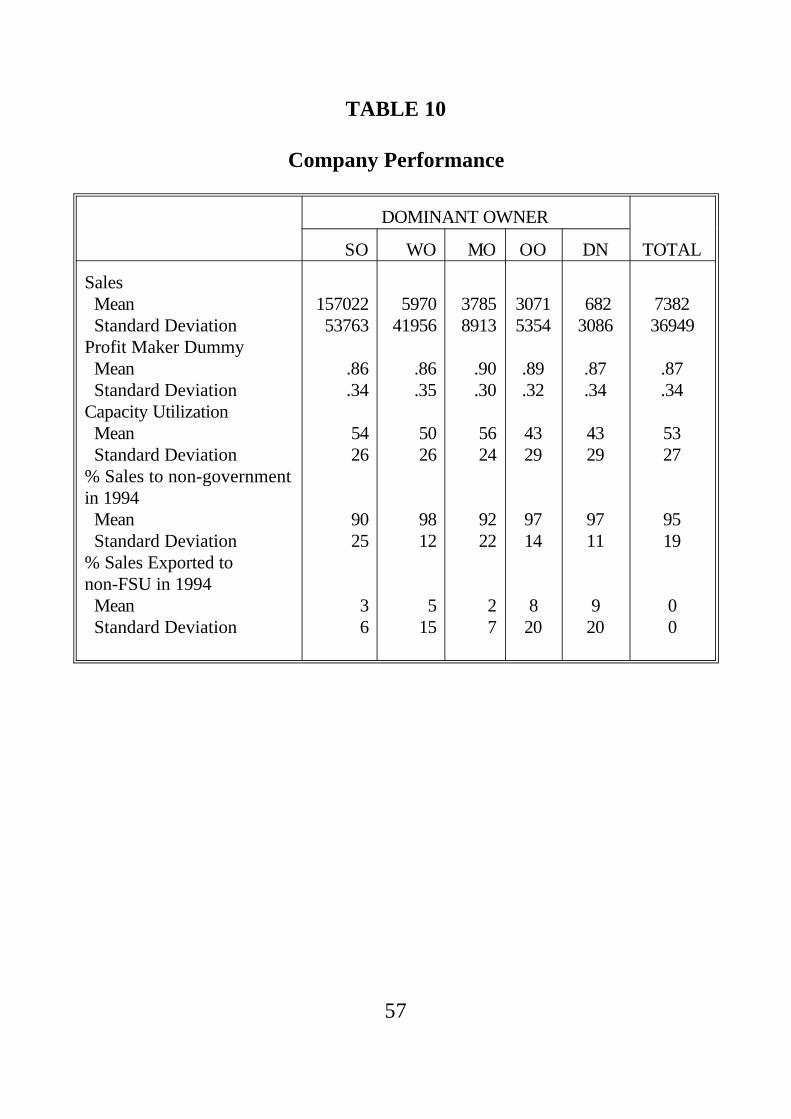
57
TABLE 10
Company Performance
DOMINANT OWNER
SO WO MO OO DN TOTAL
Sales Mean Standard DeviationProfit Maker Dummy Mean Standard DeviationCapacity Utilization Mean Standard Deviation% Sales to non-governmentin 1994 Mean Standard Deviation% Sales Exported tonon-FSU in 1994 Mean Standard Deviation
15702253763
.86
.34
5426
9025
36
597041956
.86
.35
5026
9812
515
37858913
.90
.30
5624
9222
2 7
30715354
.89
.32
4329
9714
820
6823086
.87
.34
4329
9711
920
738236949
.87
.34
5327
9519
00

58
TABLE 10 continued
Company Performance
DOMINANT OWNER
SO WO MO OO DN TOTAL
Percent of CapitalStock aged > 15yrs Mean Standard Dev.Employment in 94 Mean Standard Dev.Wage of workers Mean Standard Dev.Wage of managers Mean Standard Dev.
3629
30167959
135988111337
162957175990
2928
18868196
12706298102
159976132727
3031
12931808
131510102536
174029162253
42316
20723639
144357118705
205718174979
923
98146
173633141316
226103196806
3231
19046269
135545108353
173474159915
Notes:SO - enterprises with dominant state stakeWO - enterprises with dominant workers stakeMO - enterprises with dominant managers stakeOO - enterprises with dominant outsiders stakeDN - new established privately owned enterprises

59
TABLE 11
Sales in 1994
1 2 3
WO -9775*(5581)
2912(2021)
3277(2206)
MO -11916(8063)
3035(3037)
2136(3230)
OO -12631(8357)
2437(3188)
1642(3481)
DN -15020***(7524)
2605(3002)
2691(3385)
Laggedendogenousvariable (1 year)
No 2.76***(0.08)
2.76***(0.08)
Sectors No No Yes**
Regions No No Yes**
Adjusted R2 0.006 0.86 0.86
N 2.98 246 246
Notes:
SO - enterprises with dominant state stakeWO - enterprises with dominant workers stakeMO - enterprises with dominant managers stakeOO - enterprises with dominant outsiders stakeDN - new established privately owned enterprises

60
TABLE 12
Percentage Sales Exported to Non-FSU
1 2 3 4
WO 2.24*(1.64)
-2.71**(1.47)
2.58(1.67)
.10(2.19)
MO .07(2.28)
1.27(2.06)
.58(2.27)
-3(3.39)
OO 6.16***(2.52)
3.48(2.29)
4.09(2.45)
2.77(3.23)
DN -2.55(2.17)
.29(1.98)
-.003(2.34)
-4.08(4.47)
Sectors No No Yes Yes
Regions No No Yes Yes
Size/1000 No No No .14(.12)
Laggedendogenousvariable
No 8.89***(1.01)
8.29***(1.12)
.77***(.14)
Adjusted R2 .02 .21 .17 .12
N 325 325 325 243
Notes
* denotes significance at 10%level*** denotes significance at 5% level*** denotes significance at 1% level

61
TABLE 13
Capacity Utilization in 1994
1 2 3 4
WO -3.50(3.78)
-3.97*(2.43)
-3.17(2.73)
-4.74*(2.81)
MO 1.77(5.37)
-5.46(3.47)
-5.68(3.76)
-7.33*(3.74)
OO -10.63*(5.87)
-3.38(3.80)
-7.42*(4.20)
-7.68*(4.02)
DN 16.00***(5.02)
5.87**(3.23)
8.70**(3.76)
7.03(5.39)
Size/1000 No No No -.14(.17)
Laggedendogenousvariable
No 0.87***(0.04)
0.85***(0.05)
.88***(.05)
Sectors No No Yes Yes
Regions No No Yes** Yes
Adjusted R2 0.06 0.62 0.62 .68
N 294 285 246 235
Notes
* denotes significance at 10%level*** denotes significance at 5% level*** denotes significance at 1% level
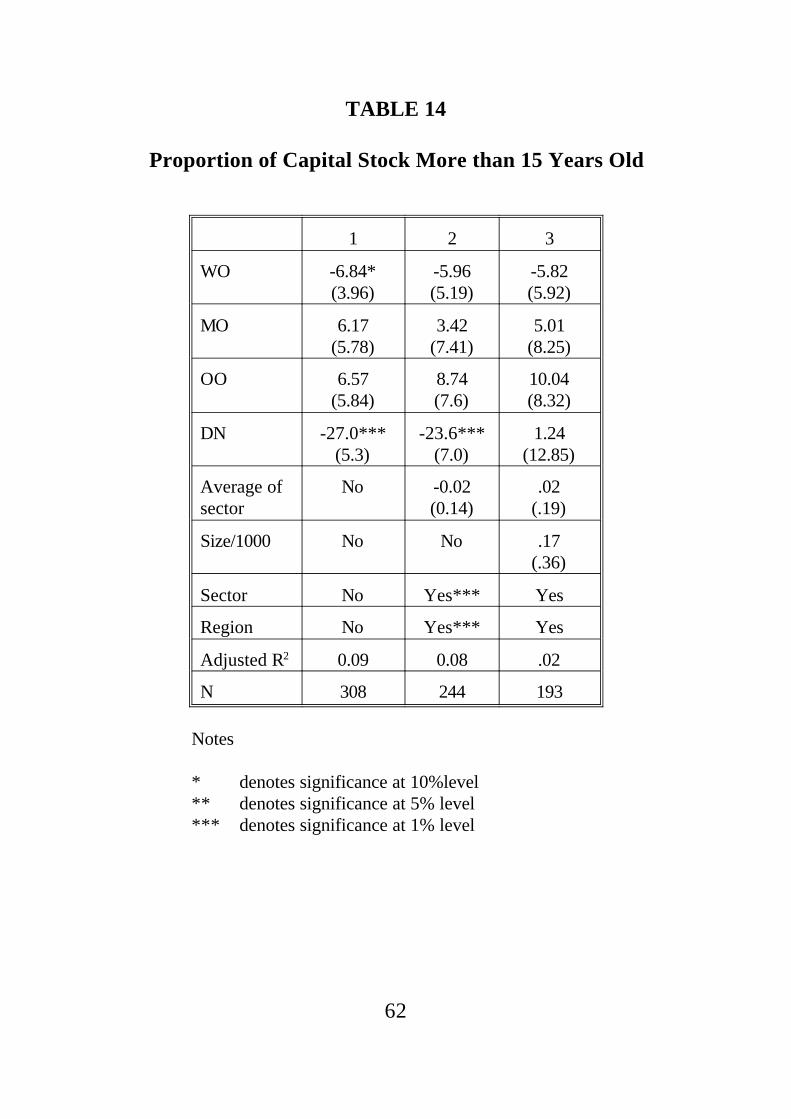
62
TABLE 14
Proportion of Capital Stock More than 15 Years Old
1 2 3
WO -6.84*(3.96)
-5.96(5.19)
-5.82(5.92)
MO 6.17(5.78)
3.42(7.41)
5.01(8.25)
OO 6.57(5.84)
8.74(7.6)
10.04(8.32)
DN -27.0***(5.3)
-23.6***(7.0)
1.24(12.85)
Average ofsector
No -0.02(0.14)
.02(.19)
Size/1000 No No .17(.36)
Sector No Yes*** Yes
Region No Yes*** Yes
Adjusted R2 0.09 0.08 .02
N 308 244 193
Notes
* denotes significance at 10%level** denotes significance at 5% level*** denotes significance at 1% level
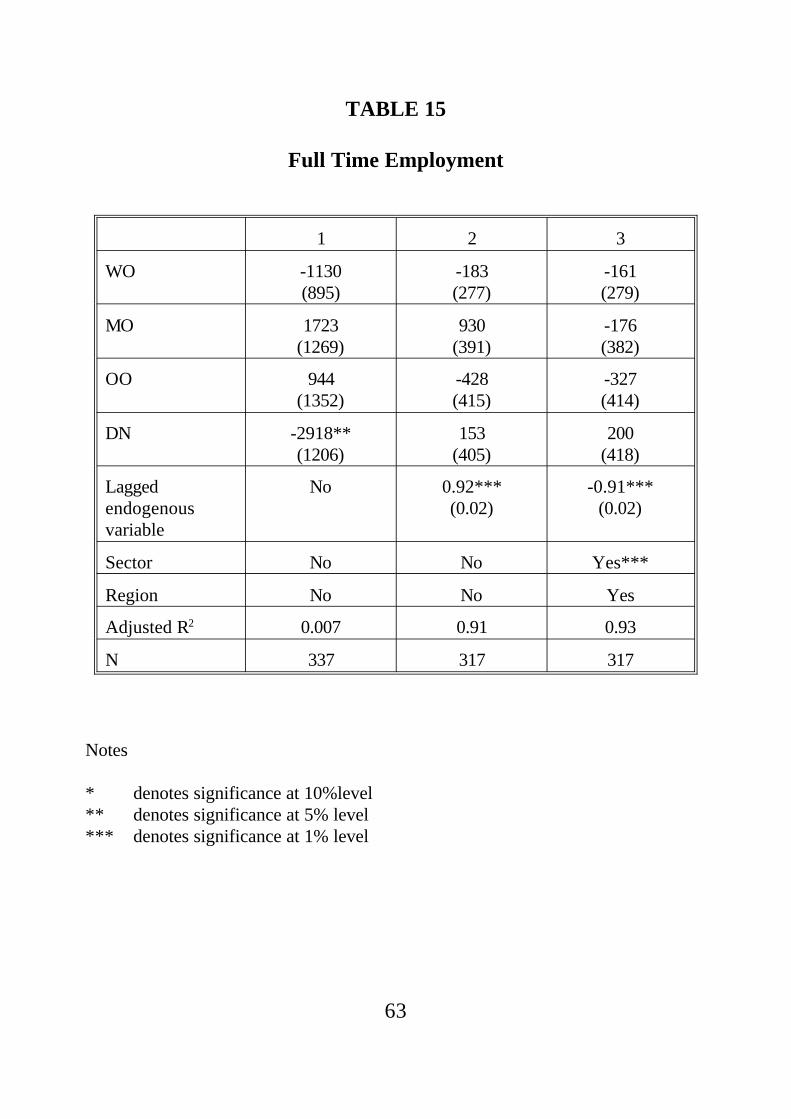
63
TABLE 15
Full Time Employment
1 2 3
WO -1130(895)
-183(277)
-161(279)
MO 1723(1269)
930(391)
-176(382)
OO 944(1352)
-428(415)
-327(414)
DN -2918**(1206)
153(405)
200(418)
Laggedendogenousvariable
No 0.92***(0.02)
-0.91***(0.02)
Sector No No Yes***
Region No No Yes
Adjusted R2 0.007 0.91 0.93
N 337 317 317
Notes
* denotes significance at 10%level** denotes significance at 5% level*** denotes significance at 1% level
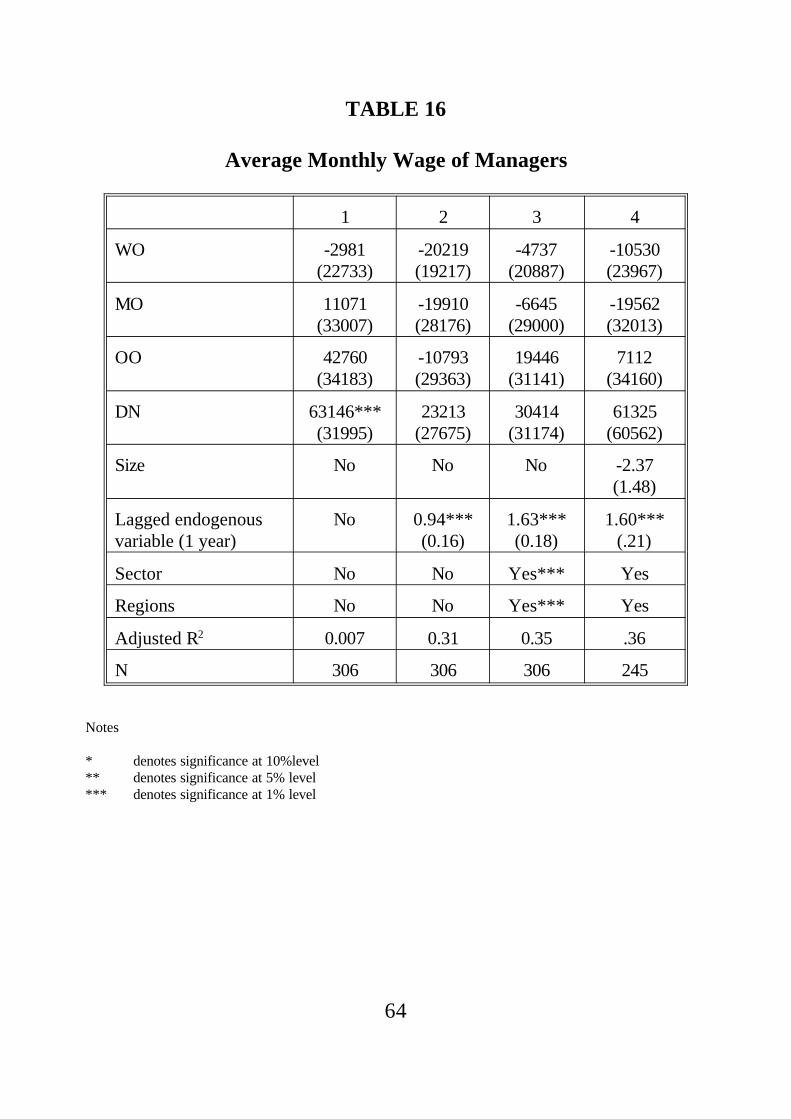
64
TABLE 16
Average Monthly Wage of Managers
1 2 3 4
WO -2981(22733)
-20219(19217)
-4737(20887)
-10530(23967)
MO 11071(33007)
-19910(28176)
-6645(29000)
-19562(32013)
OO 42760(34183)
-10793(29363)
19446(31141)
7112(34160)
DN 63146***(31995)
23213(27675)
30414(31174)
61325(60562)
Size No No No -2.37(1.48)
Lagged endogenousvariable (1 year)
No 0.94***(0.16)
1.63***(0.18)
1.60***(.21)
Sector No No Yes*** Yes
Regions No No Yes*** Yes
Adjusted R2 0.007 0.31 0.35 .36
N 306 306 306 245
Notes
* denotes significance at 10%level** denotes significance at 5% level*** denotes significance at 1% level

65
TABLE 17
Average Monthly Wage of Workers
1 2 3 4
WO -7418(15319)
-14204(14548)
-4352(14872)
-8884(14626)
MO -2969(22690)
-9136(21408)
-11830(20866)
-12636(19778)
OO 98780(23242)
3492(22205)
7872(22343)
8496(21043)
DN 39153**(21741)
29694(68208)
26662(22155)
29514(37275)
Size No No No 1.59*(0.92)
Lagged endogenousvariable (1 year)
No 0.792***(0.12)
0.58(0.12)
1.64***(0.18)
Sectors No No Yes* Yes
Regions No No Yes* Yes
Adjusted R2 0.004 0.13 0.27 0.43
N 310 310 310 248
Notes:
* denotes significance at 10%level** denotes significance at 5% level*** denotes significance at 1% level
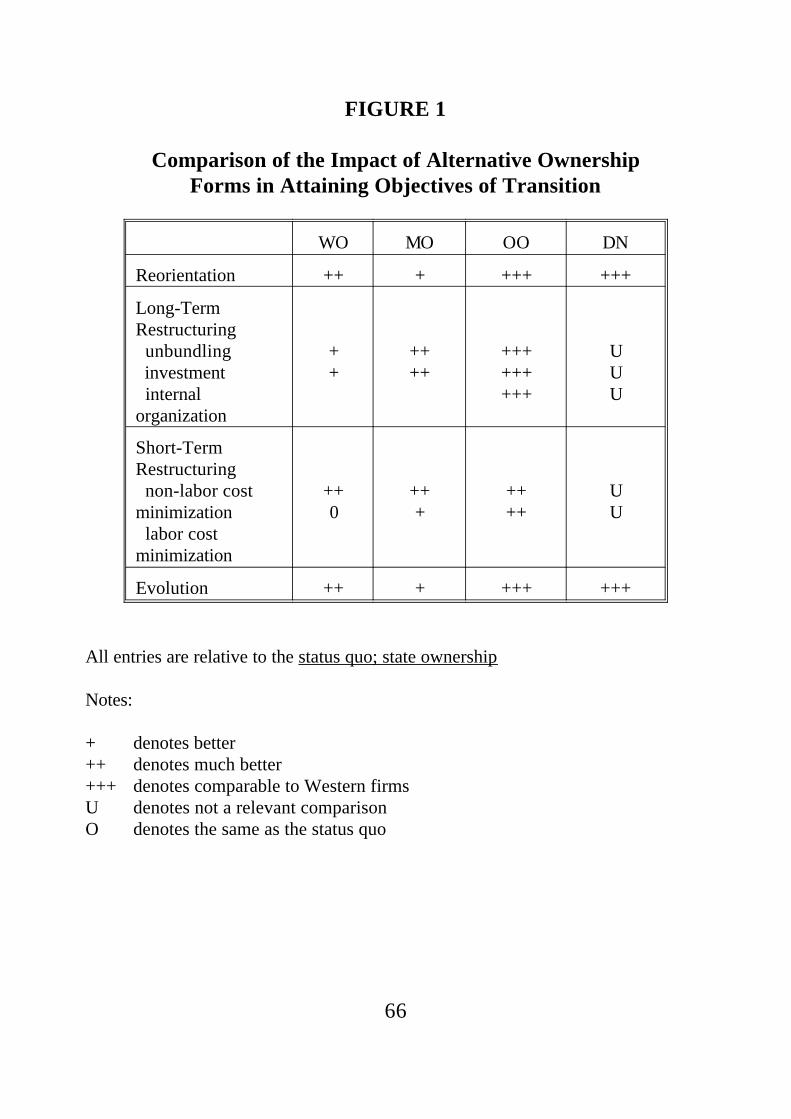
66
FIGURE 1
Comparison of the Impact of Alternative OwnershipForms in Attaining Objectives of Transition
WO MO OO DN
Reorientation ++ + +++ +++
Long-TermRestructuring unbundling investment internalorganization
++
++++
+++++++++
UUU
Short-TermRestructuring non-labor costminimization labor costminimization
++0
+++
++++
UU
Evolution ++ + +++ +++
All entries are relative to the status quo; state ownership
Notes:
+ denotes better++ denotes much better+++ denotes comparable to Western firmsU denotes not a relevant comparisonO denotes the same as the status quo

67
REFERENCES
Aghion, P., and W. Carlin, The Economics of Enterprise Restructuringin Central and Eastern Europe, World Bank mimeo, 1994.
Aghion, P., O. Blanchard and R. Burgess, "Restructuring Enterprisesin Eastern Europe", European Economic Review, 1994.
Belka, M., Estrin, S.,Schaffer, M and Singh, I.J., "EnterpriseAdjustment in Poland: Evidence from a Survey of 200 Privatized,Private and State Owned Firms", LSE Centre For EconomicPerformance Working Paper 658, 1994
Blanchard, O., S. Commander, and F. Coricelli, Unemployment andRestructuring in Eastern Europe, World Bank mimeo, 1994.
Blanchard, O., R. Dornbusch, P. Krugman, R. Layard, and L.Summers, Reforms in Eastern Europe, Cambridge, Massachusettsand London, England: MIT 1991.
Blasi, J., and Shleifer, A. "Corporate Governance in Russia:An Initial Look", mimeo 1995.
Blasi, J., "Ownership, Governance, and Restructuring," in I. Liebermanand J. Nellis, Russia: Creating Private Enterprises and EfficientMarkets, The World Bank, 1994.
Boycko, M., A. Shleifer, and R. Vishny, "Privatizing Russia,"Brookings Papers on Economic Activity, 1993.
Commander, S., Dhar, S. and Yemtsov, R. "How Russian Firms MakeTheir Wage and Employment Decisions", World Bank mimeo,1995.

68
Earle, J.S. and S. Estrin, "Employee Ownership in Transition," paperpresented to the World Bank-Central European UniversityConference on Corporate Governance in Central Europe andRussia, December 1994 (revised February 1995).
Earle, J.S., R. Frydman, and A. Rapaczynski, "Notes on VoucherPrivatization in Eastern Europe," in D. Fair and R. Raymond,editors, The New Europe: Evolving Economic and FinancialSystems in East and West, Kluwer Academic Publishers, 1993a.
Earle, J.S., R. Frydman, and A. Rapaczynski, "Privatization Policies inEastern Europe: Diverse Routes to a Market Economy" inPrivatization in the Transition to a Market Economy: Studies ofPolicies and Preconditions in Eastern Europe, London: PinterPublishers and St. Martin's Press, 1993b.
Estrin, S., (editor), Privatization in Central and Eastern Europe,London: Longman, 1994.
Estrin, S., A. Gelb, and I. J. Singh, "Restructuring, Viability andPrivatization: a Comparative Study on Enterprise Adjustment inTransition," World Bank mimeo, 1993.
Frydman, R., A. Rapaczynski, and J.S. Earle, et al, The PrivatizationProcess in Central Europe, CEU Press, 1993a.
Frydman, R., A. Rapaczynski, and J.S. Earle, et al, The PrivatizationProcess in Russia, Ukraine, and the Baltic Republics, CEU Press,1993b.
Hansmann, H., "When Does Worker Ownership Work?" Yale LawReview,99, no 8, June 1990, 1751-816.

69
Ickes, B. and R. Ryterman, paper delivered to a Conference onPrivatization and Restructuring in Russia at IIASA, July 1993.
Kornai, J., The Socialist System: The Political Economy ofCommunism, Princeton University Press, 1992.
McFaul, M., "Agency Problems in the Privatization of LargeEnterprises in Russia," in M. McFaul and T. Perlmutter (editors),Privatization, Conversion and Enterprise Reform in Russia,Center for International Security and Arms Control, StanfordUniversity, 1994.
OECD, Trends and Policies in Privatization, Vol. 1, No. 3, SpecialFeature on Management and Employee Buyouts in the Contextof Privatization, Paris, 1994.
Pinto, B., M. Belka, and S. Krajewski, "Transforming State Enterprisesin Poland: Evidence on Adjustment by Manufacturing Firms,"Brookings Papers on Economic Activity, 1: 1993, pp. 213-270.
Pistor, K., "Privatization and Corporate Governance in Russia: AnEmpirical Study," in M. McFaul and T. Perlmutter (editors),Privatization, Conversion and Enterprise Reform in Russia,Center for International Security and Arms Control, StanfordUniversity, 1994.
Radygin, A. D., "Privatization and Investment in Russia: Why theModel Needs Revision," in Studies on Russian EconomicDevelopment, Vol. 5, No. 5, 1994.
Richter, A. and Schaffer, M., "Growth, Investment and Newly-Established Firms in Russian Manufacturing", LSE mimeo, 1995.
70
Shleifer, A. and Vasilyev, V., "Managerial Ownership and the RussianPrivatization," paper presented to the World Bank-CentralEuropean University Conference on Corporate Governance inCentral Europe and Russia, December 1994, revised 1995.
Webster, L, Franz, J., Artimov, I and Wackman, H., "Newly-PrivatizedRussian Enterprises: A Survey," World Bank Technical paperno.241, Oct 1994.