overview of the russian and cis automotive industry · passenger car and light commercial vehicle...
TRANSCRIPT

Overview of the Russian and CIS automotive industryMarch 2018

Contents
Foreword 1
Executive summary and key findings 2
Russian economy 3
Current state of the global automotive market 5
Russia in the context of the global automotive industry 8
Passenger car and light commercial vehicle (LCV) market 10
Truck market 16
Bus market 18
Dealership networks 20
Auto loan market 22
CIS automotive markets 24
EY’s services for the automotive industry 27
Contacts 28

Foreword 1
In 2017 the Russian automotive market started to recover, reflecting a general upturn in the economy. Key growth drivers are pent-up demand, rising consumption and spending, and continued strong government support for the sector. The Russian market still has substantial growth potential that can be realized if current favorable macroeconomic trends persist.
This report presents an analysis of the current state and long-term prospects of the Russian and CIS automotive industry. We believe that the industry will continue on a path of steady recovery and sustainable growth, given most international players’ ongoing commitment to develop their businesses in Russia as well as government support for the industry.
EY professionals will be glad to share their market expertise and assist you in meeting your business needs and identifying investment opportunities as well as provide risk, operational and cost management advisory services.
Foreword
Alexei Ivanov
Partner, CIS Transaction Advisory Services Leader
Andrey Tomyshev
Director, Head of the CIS Automotive Group

2 Overview of the Russian and CIS automotive industry
Executive summary and key findingsAfter rebounding in 2010–11, the Russian automotive market slowed in 2012 and saw falling sales from 2013 against a backdrop of general macroeconomic decline. The overall trend in 2017 was one of recovery. A total of 1,600,000 passenger cars and light commercial vehicles (LCVs) were sold in 2017.
According to EY forecasts, sales will continue this upward trend, passing the two million mark by 2020.
Key findings: • In 2017 sales increased along with
growth in real GDP, regaining the level of 2015.
• We are very optimistic about the long-term potential of the Russian market for several reasons: the population’s low level of vehicle ownership, the aging car fleet, continued government support for the sector, and business development by major international players in Russia.
• The market will continue its recovery in 2018 and beyond, with sales of passenger cars potentially passing the two million mark by 2020.
• The rate of recovery will depend on such factors as the ruble rate, oil prices, auto loan interest rates, the amounts and effectiveness of government support, state regulation, including the indexation of recycling fees, and the potential for reducing the cost of vehicle ownership.
• Despite growth in the auto loan market in 2017, the penetration of auto loans in Russia remains lower than in Western countries. However, a gradual decrease in the Central Bank’s key interest rate, the growing role of automakers’ captive banks and the overall recovery of consumer lending will drive up the percentage of auto purchases on credit and stimulate growth in the automotive market.
• A number of dealerships responded to the crisis by leaving the market, while others have optimized the size of their business or been acquired by larger players. Some dealers with substantial loan liabilities are going through
financial restructuring. A number of dealerships, benefiting from the market’s recovery in 2017 and business diversification involving an increase in the proportion of used cars, have improved their financials. To increase their long-term profitability, dealerships need to further develop sales of used cars and financial products and make greater use of data collected by telematic devices.
• Russian makes continued to dominate the commercial vehicle segment in 2017. Sales of commercial vehicles began to recover in 2016 — earlier than did sales of passenger cars – because they are less affected by lower consumer confidence. Truck sales were up an impressive 50.8% in 2017.
• Russian bus production was down 2.8% in 2017, but still has good growth potential due to the considerable age of the current fleet and government support for manufacturers and purchases of equipment. Looking forward, there are plans to electrify the bus fleet in major cities.
• International automakers continue to localize their production, although the process is being hindered by the lack of a high-quality pool of second-tier (and lower) suppliers as well as some materials for the automotive industry.
• Demand on the CIS market also took an upturn in 2017 as the macroeconomic situation and local currencies in most countries stabilized. Ukraine saw the highest car sales in 2017, while Uzbekistan, as usual, had the highest output.

Russian economy 3
Russian economy
The Russian economy followed a trajectory of growth in 2017, with GDP increasing 1.5% after a decline in 2015–16. Growth was driven by rising oil prices, an appreciating exchange rate and adaptation to imposed economic restrictions and accompanied a rise in real wages, a stronger ruble and increased consumer lending. At the same time, real disposal household income was down 1.7% due to declining social payments and business revenues.
Key sectors of the economy that showed the most impressive growth included wholesale and retail trade (3.1%) and transport and logistics (3.7%). Manufacturing and the extractive industries saw more moderate growth — 1.0% and 1.4%, respectively — and construction continued to decline (–0.2%).
Russian economic indicators were seriously impacted by the restrictions, coupled with a sudden drop in oil prices. This severely weakened the Russian ruble and increased the cost of borrowing. On the positive side, the new economic reality made Russian assets more attractive to
potential investors. In the next few years, foreign direct investment is expected to pick up considerably. Russia’s long-term investment attractiveness depends heavily on developing the legislative framework and reducing government involvement in the economy, as well as introducing new technologies in production and management.
In the long run, the expected rise in oil prices, along with the recovery of disposable household income and increasing consumption, will also stimulate economic growth and market attractiveness.

4 Overview of the Russian and CIS automotive industry
Projected key macroeconomic indicators
2012 2013 2014 2015 2016 2017 2018F* 2019F*
Population, million 143.0 143.3 143.7 146.3 146.5 146.8 146.9 147.0
Real GDP growth, % 3.7% 1.8% 0.7% –2.5% –0.2% 1.5% 1.6% 1.5%
GDP per capita, USD 15,278 15,973 14,468 9,527 9,000 10,865 11,994 12,566
Inflation, % 5.1% 6.8% 7.8% 15.5% 7.1% 3.7% 3.7% 4.0%
Industrial Production Index, % 3.4% 0.4% 1.7% –3.4% 1.3% 1.0% 2.4% 1.9%
Brent crude oil price, US$ per barrel 112.0 108.9 98.9 52.7 44.1 54.3 58.3 58.7
Unemployment rate among the economically active population (annual average), %
5.5% 5.5% 5.2% 5.6% 5.9% 5.3% 5.2% 5.0%
RUB/USD exchange rate (annual average) 30.8 31.8 38.4 60.9 66.8 58.3 59.9 60.4
RUB/EUR exchange rate (annual average) 39.6 42.3 51.0 67.5 74.1 66.0 70.3 71.3
Sources: Federal Statistics Service, BMI, MED, EIU, Oxford Economics EIA, Bloomberg, EY analysis, CEEMEA, Development Center of the Higher School of Economics.
*F — Forecast.
Consensus forecast of nominal and real GDP growth in Russia
Nominal GDP Real GDP growth
Sources: Ministry for Economic Development, EIU, Oxford Economics, World Bank, CEEMEA, IMF, EY analysis.
*F — Forecast
2012
2,167
3.7%
1.8%
0.7%
1.5% 1.6% 1.5%
–0.2%
–2.5%
2,2272,027
1,327 1,2961,564 1,726 1,808
2013 2014 2015 2016 2017 2018F* 2019F*
4%
3%
2%
1%
0%
–1%
–2%
–3%
Grow
th, %
USD
bill
ion
2,500
2,000
1,500
1,000
500
0

Current state of the global automotive market 5
Current state of the global automotive market
The global automotive sector grew for the eighth consecutive year in 2017. Sales of passenger cars and LCVs that year were up 2.5%, reaching 95,400,000 vehicles. The growth rate was lower than in 2016 (4%) for the following reasons:
• 1.5% lower sales in North America, following a year of growth, due to falling demand on the US and Mexican markets;
• declining growth rates in the Asian region, largely caused by slowing growth on the Chinese auto market;
• depressed growth rates on the Western European auto market due to shrinking demand in the United Kingdom.
It is important, however, to mention the accelerating growth in Eastern Europe and Latin America. In Eastern Europe, this growth was driven largely by the Russian market’s upward turn and continued growth in Poland and the Czech Republic. In Latin America, the main contributors were the recovery of the Brazilian auto market and continued growth in Argentina.
The region that saw the highest sales is Asia, with China accounting for over 60% of the total. Growth in China slowed from 10.8% in 2016 to 1.9% in 2017, largely due to a hike in automotive sales tax from 5.0% to 7.5%. This had a strong negative impact on cars with an engine capacity of 1.6 liters and less, which make up 67% of the Chinese fleet. These cars are owned by people with low incomes, who are particularly sensitive to changes in price.
Despite its slowing rates, China was the biggest contributor to the world market’s growth, accounting for a quarter of this growth in absolute terms. Other leading contributors were India (+14.2%), Japan (+11.7%), Brazil (+10.2%), Argentina (+7.5%) and Iran (+7.3%). The Indian market grew 10% in 2017 and has potential for further growth in view of rising disposable income, higher demand in rural areas and a low number of vehicles per capita: 34 cars per 1,000 adults, as compared to 617 in Western Europe.
Japanese growth had to do with a low starting point — the previous year’s depressed sales — with an accelerating economy and with the fact that commodity tax, originally to be introduced in April 2017, was postponed until 2019. Further growth will be curbed by a declining population and growing use of public transport.
The Brazilian and Argentinian markets grew as both economies recovered — a trend that should continue in 2018 in view of the favorable macroeconomic forecast. Growth in sales in Iran was the result of economic improvement after US sanctions were lifted in 2016 as well as a low number of vehicles per capita.
A number of regions with mature economies and developed automotive markets experienced a decline in 2017: the US (–1.9%), the UK (–5.6%) and South Korea (–0.4%). The decline in the US, coming off a sales peak in 2016, had to do with rising automobile prices and interest rates. The main reason for the British market’s contraction was slowing economic growth, coupled with higher interest rates and vehicle ownership tax as well as uncertainty in connection with Brexit.
3,200,000 trucks were sold worldwide in 2017, with China accounting for around 45% of that amount.
6 Overview of the Russian and CIS automotive industry
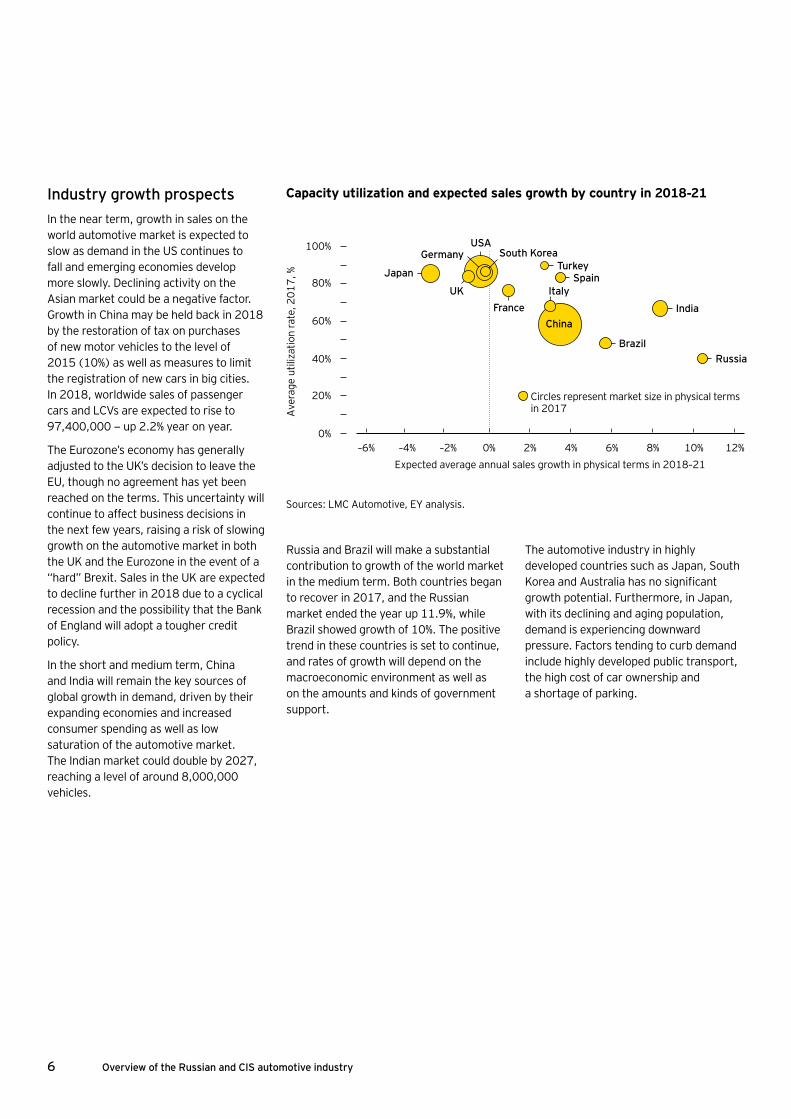
Industry growth prospectsIn the near term, growth in sales on the world automotive market is expected to slow as demand in the US continues to fall and emerging economies develop more slowly. Declining activity on the Asian market could be a negative factor. Growth in China may be held back in 2018 by the restoration of tax on purchases of new motor vehicles to the level of 2015 (10%) as well as measures to limit the registration of new cars in big cities. In 2018, worldwide sales of passenger cars and LCVs are expected to rise to 97,400,000 — up 2.2% year on year.
The Eurozone’s economy has generally adjusted to the UK’s decision to leave the EU, though no agreement has yet been reached on the terms. This uncertainty will continue to affect business decisions in the next few years, raising a risk of slowing growth on the automotive market in both the UK and the Eurozone in the event of a “hard” Brexit. Sales in the UK are expected to decline further in 2018 due to a cyclical recession and the possibility that the Bank of England will adopt a tougher credit policy.
In the short and medium term, China and India will remain the key sources of global growth in demand, driven by their expanding economies and increased consumer spending as well as low saturation of the automotive market. The Indian market could double by 2027, reaching a level of around 8,000,000 vehicles.
Brazil
India
SpainTurkey
South KoreaGermanyUSA
Japan
UK ItalyFrance
Russia
12%–6% –4% –2% 0% 2% 4% 6% 8% 10%
Ave
rage
util
izat
ion
rate
, 201
7, %
Expected average annual sales growth in physical terms in 2018–21
100%
40%
60%
80%
20%
0%
China
Sources: LMC Automotive, EY analysis.
Capacity utilization and expected sales growth by country in 2018-21
Russia and Brazil will make a substantial contribution to growth of the world market in the medium term. Both countries began to recover in 2017, and the Russian market ended the year up 11.9%, while Brazil showed growth of 10%. The positive trend in these countries is set to continue, and rates of growth will depend on the macroeconomic environment as well as on the amounts and kinds of government support.
The automotive industry in highly developed countries such as Japan, South Korea and Australia has no significant growth potential. Furthermore, in Japan, with its declining and aging population, demand is experiencing downward pressure. Factors tending to curb demand include highly developed public transport, the high cost of car ownership and a shortage of parking.
Circles represent market size in physical terms in 2017

Current state of the global automotive market 7
The construction of infrastructure for the growing motor vehicle fleet is becoming a key challenge for emerging countries. Developed markets are largely focused on renewing their car fleets and are more dependent on consumer preferences. A key trend shaping the market — vehicles with electric motors — is expected to develop as follows over a 10-year period:
Key growth drivers for the electric vehicles market
The trend is accelerating as oil prices recover, making traditional fuel more expensive, as a number of countries strengthen their environmental law, and as government incentives are provided. In Norway, for example, thanks to a system of government incentives, sales of electrified vehicles equaled those of cars with internal combustion engines by the end of 2017.
EY forecasts that motor vehicles running on alternative fuels (including electric cars) will account for 24% of all sales in 2025, and China and Europe will be key growth areas. China is already a leader in this area, with sales of 600,000 electric cars in 2017 (+73% year on year).
This trend is reshaping the industry and encouraging closer cooperation between manufacturers and new alliances:
• BMW and Volkswagen: partnership to set up 100 charging stations, including fast charging stations.
• BMW and Nissan: partnership to set up fast charging stations in the US.
• Daimler and QUALCOMM: development of wireless charging technology.
• Audi, LG Chem and Samsung SDI: development of next-generation SUV batteries to increase the maximum range to 500 km.
Other important growth areas on the automotive market include autonomous cars and car sharing to optimize the cost of car ownership. According to our findings, up to 66% of car owners are currently willing to use an autopilot, and car sharing can increase car utilization to 25%–30%, as compared with 4%–5% for personal car use. As a result of these technologies, cars transmit growing quantities of data, driving growth on the telematics market. According to EY forecasts, autonomous cars may account for 15% of global car sales in 2025.~50%
Expansion of charging infrastructure
>20% Reduction in CO2 emissions due to stricter environmental law
CO2
~70% Reduction in the cost of electric batteries to USD 150 per kWh
~ 20–30 min.
Anticipated automobile charging time

8 Overview of the Russian and CIS automotive industry
Russia in the context of the global automotive industry
Demand recovered despite manufacturers’ continued indexation of prices to compensate for ruble devaluation. By the end of 2016, the cumulative price index, as compared with 2014, was around 40%. Average indexation in 2017 was 5%, and weighted average prices grew at a rate below consumer inflation because of a shift in demand toward lower-cost cars.
Russia’s auto market ranked fifth in Europe in 2016 and 2017, behind Germany, the UK, France and Italy. The market’s strong growth potential has to do with pent-up demand from 2013-16, the low number of vehicles per capita, the aging car fleet, and the recovery of basic macroeconomic indicators: oil prices, GDP, real household income, consumer activity and the availability of auto loans.
In 2017, there were 351 passenger cars per 1,000 adults in Russia — 43% lower than in Western Europe (617) and 55% lower than in North America (783). The average age of passenger cars and LCVs in Russia is over 12 years — substantially higher than Western Europe’s figure of 9 years. Credit as a share of car sales increased to 48.9% by the end of 2017, as compared with 44% the year before, as interest rates gradually declined and the business of captive banks developed.
The market’s potential is confirmed by the fact that foreign companies continue to pursue plans for the establishment of local facilities to manufacture motor vehicles and components. In 2017, Mercedes-Benz and Mazda Sollers began constructing plants, and a number of companies an-nounced new plans to establish production facilities in Russia.
After a prolonged decline going back to 2013, the market hit bottom in 2016, with sales of passenger cars and LCVs approaching a 10-year low (1,400,000). The market continued to decline, at 4.5% year on year, in January and February 2017, but turned around in March 2017. The year-on-year growth rate reached 14.7% by May 2017 and remained within a range of 14% to 18.6%, depending on the month, through the end of 2017, resulting in annual growth of 11.9%. Car density by country including Russia’s expected auto market growth
by 2021
Source: LMC Automotive, Oxford Economics, EY analysis.* Based on purchasing power parity (PPP), in 2017 prices
India
Brazil
1,2000 200 400 600 800 1,000
GDP
per c
apita
* (U
SD)
Number of vehicles per 1,000 adults
70,000
60,000
50,000
40,000
30,000
20,000
10, 000
0
China Turkey
South KoreaSpain
ItalyFrance
Japan
Germany
USA
UK
RussiaRussia 2021
Circles represent market size in physical terms in 2017

Russia in the context of the global automotive industry 9
As a further source of growth, Russian automakers are thinking of expanding exports. This would speed up the process of restoring output to cost-effective levels as well as helping to lower cost and create additional incentives for localization. Both Russian and foreign automakers announced plans to boost exports in 2017, and the result in monetary terms was 19% growth in exports of passenger cars and LCVs in that year (to USD 1,320,000,000) and 40% growth in exports of automotive components (to USD 1,292,000,000). Government policy aimed at stimulat-ing exports also contributes to growth. The Strategy for the Development of Automotive Exports, adopted in August 2017, calls for a number of new monetary and non-monetary measures to supple-ment the subsidies that have been in place since 2016 for logistical costs and certi-fication and homologation expenses. The base scenario envisages a total of some RUB 89.6 billion in support through 2025. Subsidies will be provided for preferential loans and leases, for compensation of the EXIAR insurance premium, for participa-tion in international exhibitions and for development of the dealership and service network. According to the strategy, these measures will help the auto industry raise its total exports to USD 4.9 billion by 2025.
The Russian Government is also consider-ing adding an export factor to its criteria for subsidies to auto companies.
In 2017, as in 2013–16, the Russian Government continued to increase its sup-port for the sector. The subsidies in place in 2016 for interest rates on auto loans and car leasing, the fleet renewal program and subsidies for government purchases of motor vehicles were supplemented in 2017 with programs designed to promote demand across all automotive segments: Family Car, My First Car, Russian Farmer, Russian Truck and My Own Business.
New passenger car and Light Commercial Vehicle (LCV) market in leading economies
0 5 10 15million units
20 25 30 35
China
USA
Japan
Germany
India
UK
France
Italy
Brazil
Canada
South Korea
Russia
Spain
Turkey
Central and Eastern Europe
2020F* 2019F* 2018F* 2017 2016 2015
Source: LMC Automotive.*F — forecast.
Risks for the industry include uncertain-ty about future oil prices and the ruble/dollar exchange rate, which will have a major impact on the Russian consumer sector. There is still uncertainty about the government’s new approaches to providing incentives for localization after
the expiration of industrial assembly agreements in 2018–20. Indexation of the recycling fee in 2018 may also become a limiting factor.

10 Overview of the Russian and CIS automotive industry
Passenger car and light commercial vehicle (LCV) market
Total sales of new passenger cars and LCVs, according to AEB statistics, lost 11% in 2016, before rebounding with 11.9% growth in 2017. Key growth drivers were rising oil prices, improving macroeconomic figures and pent-up demand for motor vehicles against a backdrop of increasing consumer activity and strong government support.
As the ruble/dollar exchange rate stabilized in 2017, the number of motor vehicles registered in Russia during the year approached the number sold, according to AEB statistics. There were only 27,000 more vehicles sold than registered in 2017, as compared with 200,000 in 2015 and 100,000 in 2016.
These figures diverged widely in previous years because of the ruble’s sharp devaluation and a temporary decline in car prices in Russia, as denominated in foreign currency, as a result of which some vehicles purchased from Russian dealers were exported to other CIS countries.
Sales of new passenger cars and LCVs in Russia in 2012–17
Passenger cars LCVs
Sources: AEB, EY analysis.
2012
205 193 175 119 118 131
2,734 2,5842,316
1,4821,308
1,465
2013 2014 2015 2016 2017
thou
sand
uni
ts
3,000
2,500
2,000
1,500
1,000
500
0

Passenger car and light commercial vehicle (LCV) market 11
Breakdown of major passenger car makes in Russia
LADA KIA
Hyundai Renault
Toyota Volkswagen
Nissan Škoda
Chevrolet Other
Sources: LMC Automotive, AEB, EY analysis.
201431%
16%
8%
8%
8%
7%7%4%
5%
6%
2016
25%20%
11%
11%
9%7%6%
5%4%2% 2017
24% 21%
12%
11%9%6%
6%
5%
4%2%
201528%
18%
11%
11%
8%6%5%6%
4%3%
Passenger car and LCV sales structure in Russia by origin
Russian makes Imported foreign makes Localized foreign makesSources: LMC Automotive, Federal Customs Service, EY analysis.
2014
20%
30%
50%
201654%
26%
20%
201554%
23%
23%
201757%
26%
17%
The share of domestic and localized foreign makes on the Russian auto market grew in 2015–17. The main reason for this is the price advantage enjoyed by Russian and localized foreign models, as well as a shift in demand to low-end models, against a background of rising car prices and targeted government support to ensure demand for these models.
Russian makes continued to decline as a share of the auto fleet in 2017 as domestic models no longer in production were replaced with new low-end foreign and Russian cars. This trend was reinforced by the launching of a number of new compact crossovers in 2015–17 and by interest in new low-end LADAs, allowing this make to gain market share.

12 Overview of the Russian and CIS automotive industry
Share of premium models in total sales
Sources: LMC Automotive, EY analysis.
2012
7% 7%8%
9%10%
9%
2013 2014 2015 2016 2017
10%
8%
6%
4%
2%
0%
Balance of production and demand on the automotive market
Manufactured Imported
Sales of passenger cars and LCVs Average capacity utilization
Sources: AEB, AUTOSTAT analytic agency, Federal Customs Service, EY estimate.
2012
2132
2939
1120
69%
2778
65%
52%
731 365 280 275
1463
1596
1231
1426
1320
1602
35% 33%39%
2080
936
1822
2491
2013 2014 2015 2016 2017
80%
60%
70%
50%
40%
30%
20%
10%
0%
thou
sand
uni
ts
5,000
4,000
3,000
2,000
1,000
0
Growth in the share of premium brands in 2013–16 was followed by a decline in 2017. This was a result of recovering consumer activity and pent-up demand in the low-cost and mass segments, which had been hit hardest by the crisis, but also rebounded more quickly. The premium segment is largely shielded from the crisis due to the lower price elasticity of demand, but premium models still account for only a modest share of car sales in Russia: 9% in 2017, well below the figure in developed countries. In Europe, for example the premium segment captured 19% of the market in this period. Given what has been said, the share of premium models is likely to continue growing in the long term.
Production and market balanceAccording to LMC, Russia produced 1,350,000 passenger cars and 110,000 LCVs in 2017. Capacity utilization rose, as did the levels of demand and exports, after a decline in these figures in 2016. Exports benefited from macroeconomic stabilization in a number of CIS countries as well as the launching of a strategy approved in August 2017 to promote exports. Exports of all types of motor vehicles and components totaled USD 3.0 billion in 2017, according to the Federal Customs Service, up 25% year on year. The principal growth area was auto components, which rose from USD 0.92 billion to USD 1.29 billion.

Passenger car and light commercial vehicle (LCV) market 13
In 2017 a number of automakers began work on projects to build new plants or announced plans for such construction1:
• Haval is continuing its construction of a plant in Tula Region, to be commissioned in 2018, with an annual capacity of 150,000 vehicles.
• Mercedes-Benz plans to build a new plant in Moscow Region by 2019 with a total annual capacity of 25,000 vehicles. For this purpose, a special investment contract was signed with the government for a period of nine years.
• Mazda Sollers has begun construction of an engine plan in Primorsky Territory with a planned annual capacity of 50,000 powertrains.
• BMW plans to build a full-cycle plant in Kaliningrad Region with a total annual capacity of some 27,000 vehicles. A special investment contract is being considered as a means of realizing this project.
• The Japanese truck manufacturer Hino plans to build a plant in Khimki in 2018 with an annual capacity of 2,000 vehicles.
To boost exports, some Russian producers are looking at the possibility of localizing production abroad, and the Ministry of Industry and Trade is considering setting up a production hub for Russian companies in Mexico.
Outlook for the automotive marketIn terms of growth prospects, the base scenario involves a continuing trend of market recovery in 2018 in view of the favorable forecasts for the economy as a whole, continuing government support and the effect of pent-up demand.
1 https://www.autostat.ru/news/31627/ https://www.vedomosti.ru/auto/articles/2017/10/06/736781-bmw-zavod http://abreview.ru/ab/news/mazda_nachala_stroitelstvo_zavoda_dvigateley/ http://www.innov.ru/news/auto/hino-otkroet-svoy-zavod-v/ http://www.rbc.ru/business/13/01/2017/5878c19a9a7947f6d45a67a0?from=main
Actual and projected sales volumes of passenger cars and LCVs in Russia
3.5
2012
2.9 2.8
1.6
2.5
1.81.4
1.6
2.0
1.3
1.4
2.3 2.5
2013 20172014 2018F* 2019F* 2020F* 2021F*2015 2016
2.5
3.0
2.0
1.5
1.0
0.5
0
mill
ion
units
mill
ion
units
Sold Registered
Sources: AEB, AUTOSTAT analytic agency, LMC Automotive, EY analysis.
*F – Forecast.
Fleet of passenger cars and LCVs in Russia
2012
40.6 43.1 46.144.8 46.945.5 47.845.6 49.0 50.5
2013 20172014 2018F* 2019F* 2020F* 2021F*2015 2016
60
40
50
30
20
10
0
Russian vechicle fleet in 2012–21
Sources: AEB, AUTOSTAT analytic agency, LMC Automotive, EY analysis.
*F — Forecast.

14 Overview of the Russian and CIS automotive industry
Future trends in automobile sales will be determined by the following factors:
• Ruble exchange rates, oil prices and real household disposable income
• The availability and interest rates of auto loans
• The amount and effectiveness of government support
• The development of transport infrastructure and the potential for reducing vehicle ownership costs
• The localization rates of auto companies, which impact cost and prices
• The rates of indexation of recycling fees and changes in government excise duties.
Pent-up demand has not yet been satisfied and will continue to contribute to market recovery in 2018.
The used passenger car segment saw less of a decline during the crisis, falling 20% in 2015, but growing 6% to 5,200,000 in 2016. Growth slowed in January–October 2017 to 1.5% year on year as a result of a partial reorientation of demand toward new cars and a government fleet renewal program designed to support vehicle trade-ins.
The leading makes on the used car market are determined by the size of their fleets. In the first ten months of 2017, the five best sellers on the secondary market and leaders in terms of fleet size were LADA, Toyota, Nissan, Hyundai and Chevrolet. LADA’s share of the car fleet and the secondary market is shrinking, while the proportion of foreign makes is on the rise.

Passenger car and light commercial vehicle (LCV) market 15
Government supportThe government plans to support the sector in 2018, but the amount of support may decline as subsidies for interest rates on auto loans and fleet renewal programs are ended.
Target programs to support specific groups of purchasers will continue: My First Car, Family Car, etc. Key programs to stimulate demand are described below.
In addition to support for demand, the Russian budget for 2018 includes direct subsidies to compensate automakers for loan interest, R&D costs, job retention and energy resources as well as costs involved in manufacturing vehicles meeting Euro 4 and Euro 5 standards.
As before, a large part of the support involves subsidizing demand, which does not create long-term incentives for improving the auto industry’s efficiency, including utilization of excess capacity, localization of needed technologies and materials and development of second-tier and lower-level suppliers. Major players that took part in our study believe that
balanced development of the industry will require, in addition to the export program adopted in 2017, a supplier development program, including such measures as:
• Determination of priority components, technologies and materials to ensure a sufficient demand for and return on investment projects. For this purpose, the potential for consolidating demand for each group of components and materials will have to be assessed in view of the potential growth of the domestic market and exports.
• Coordination of relations between auto companies and first-tier suppliers as part of the joint development of suppliers. An effective system of incentives for the localization of second-tier and lower-level suppliers.
• A road map of the industry of raw and other materials for the automotive industry. Examples are stainless steel and additives for automotive polymers that are not generally produced in Russia.
• A program to optimize suppliers’ capacity, including by means of higher utilization and lower cost.
• A program, drawing on international experience (e.g. the Kaizen system), to enhance the operating efficiency of Russian suppliers. Business process management systems may be implemented with government financing and should have a relatively large effect on costs throughout the value chain as compared to the amount of the subsidies.
• A program to develop the automotive plant equipment and tooling industry.
• A program to relocate used equipment of auto component plants from countries where full-scale transition to electric vehicles is under way and demand for equipment and technology used to manufacture traditional vehicles is falling.
Planned measures to support automotive demand in 2018
Incentive Maximum financing
Programs: My First Car, Family Car, Russian Truck, Russian Farmer, My Own Business
RUB 16.0 billion
Subsidies for purchases of gas-powered vehicles RUB 2.5 billion
Subsidies for purchases of electric vehicles RUB 1.5 billion
Subsidies for the leasing of wheeled vehicles RUB 2.1 billion
Source: Ministry of Trade and Industry.

16 Overview of the Russian and CIS automotive industry
Truck market
The truck2 market is recovering faster than the passenger car market because it is less affected by low consumer confidence.
2 A motor vehicle with a fully loaded weight of over 3.5 tons that is designed for freight transportation, with the exception of models classified as LCVs.
Growth in truck sales — 3.9% in 2016, accelerating to 50.8% in 2017 — was driven by investors’ pent-up demand for commercial vehicles, increased freight traffic and an improvement in macroeconomic indicators affecting truck sales:
• Truck transportation was up 0.8% in 2016, following a 5.9% drop in 2015. Growth accelerated to 3.8% in January–October 2017 year on year
• Wholesale and retail turnover grew 3.1% in 2017
• Investments in fixed assets grew 4.2% in January–September 2017 in real terms.
This strong growth had to do with large projects in the oil & gas and public sectors. The market was greatly invigorated by such major infrastructure projects as the Crimea Bridge, Power of Siberia, and Moscow renovations.
Russian makes traditionally lead the market, but their share of sales in 2017 declined somewhat due to the strong recovery of foreign makes.

Truck market 17
In the short term, the truck market will be adversely affected by uncertainty about oil prices and by the freezing of investment projects in the oil & gas and related sectors. Market recovery may gain momentum from the need to replace aging vehicles and purchase new ones in order to satisfy pent-up demand and relaunch formerly shelved investment projects.
Along with the recovery of the freight sector and investment activity, long-term market growth will be driven by the following factors:
• Low fleet saturation with reliable trucks for long hauls and other uses
• The development of fleet management and operating lease services, especially in the foreign make segment (as road quality and transport and telecommunications infrastructure improve), as well as leasing subsidies
• Gradual development of a dealership and service network in the foreign make segment, stimulating growth in both sales and the number of vehicles serviced.
Historical and projected truck sales in Russia
2012
127109
8088 89
51
98
53
108120
2013 20172014 2018F*2019F* 2020F* 2021F*2015 2016
140
120
80
100
thou
sand
uni
ts
60
40
20
0
Sources: AUTOSTAT analytic agency, EY analysis.
*F — forecast.
Russia’s truck market structure by make*
KAMAZ GAZ
UralAZ MAN
Scania Volvo
Mercedes-Benz MAZ
Isuzu Other
Sources: AUTOSTAT analytic agency, EY analysis.
* Based on registration data for non-military trucks.
201434%
14%5%4%
5%2%
4%
7%
5%
20% 20%
34%
14%4%
5%
4%
7%
5%
2%
2015
5%
201638%
14%5%4%
5%3%
4%
6%
5%
16%
201733%
10%4%6%7%
7%
7%
5%
5%
16%

18 Overview of the Russian and CIS automotive industry
Municipal bus fleets are key purchasers of buses in Russia. The economic crisis forced municipalities to thoroughly revise their budgets, reducing the number of orders placed and the number of buses manufactured.
Bus market
Output started up again in 2016 — 12.8% growth year on year — followed by a minor 2.8% decline in 2017. Market recovery was driven largely by pent-up demand for buses to renew the fleet as well as orders ahead of the 2018 FIFA World Cup (2,150 buses of various classes were purchased in 2016).
The government provided support via a program to stimulate demand for gas-powered buses and vehicles for the utilities sector as well as via the School Bus Project. No less important were programs for fleet renewal in Moscow and St. Petersburg.

Bus market 19
Due to restrictions on bus imports for state and municipal needs, the percentage of imported buses is negligible, but the share of localized foreign makes is on the rise.
In the long term, apart from general economic factors, the rate of recovery of bus sales will be determined by the amount of government support and the need to replace the aging fleet. Currently the average age of buses in Russia is over 15 years, and most older buses are Russian makes.
There is a marked trend on the market to introduce electric buses in cities. Mosgortrans State Unitary Enterprise thus announced plans to acquire 300 electric buses in 2018 and then 300 per year through 20203.
3 https://www.mos.ru/mayor/themes/2299/4346050/
Bus production trends in Russia
Источники: ASM-Holding, AUTOSTAT analytic agency, EY analysis.
2013
5544
3744 43
2014 2015 2016 2017
60
thou
sand
uni
ts 40
50
30
20
10
0
Bus sales in Russia
Russian makes Imported foreign makes
Localized foreign makes
Sources: Association of Russian Automakers, EY analysis.
* Sales in 2017 were estimated using data for September-October 2017.
201462%
28%
10%
201574%
21%
5%
201673%
22%
5%
2017*67%
27%
6%

20 Overview of the Russian and CIS automotive industry
Companies were unprepared for the crisis in part because of their high level of debt for projects to develop the network prior to ruble devaluation. EY surveyed dealerships in cooperation with the Russian Auto Dealers Association and found that, in the period of rapid market decline, over half of respondents had a debt/EBITDA ratio between 3 and 5, while for 22% of respondents this ratio exceeded 5. More than half of dealerships were negotiating changes to the terms of debt servicing with creditors.
Dealerships’ low business diversification had to do with their longstanding ability to earn a substantial profit from sales of new cars, whereas revenue on the Western market is generated mainly from sales of used vehicles, maintenance and after-sales services. By way of comparison: the share of used cars sold through dealership networks is around 13% in Russia, 40% in the UK and 50% in some Western European countries. In Russia, authorized dealerships generally service vehicles
under warranty that are three years old or less, whereas in Germany almost half of all vehicles less than eight years old are serviced by authorized dealers.
Despite the major market decline, large enterprises are opening new centers and increasing their market share by purchasing vacated centers, thus driving industry consolidation. There is also a persistent trend of growth in the share of used vehicles sold via authorized dealerships; in 2014–17 these sales grew 10 percentage points.
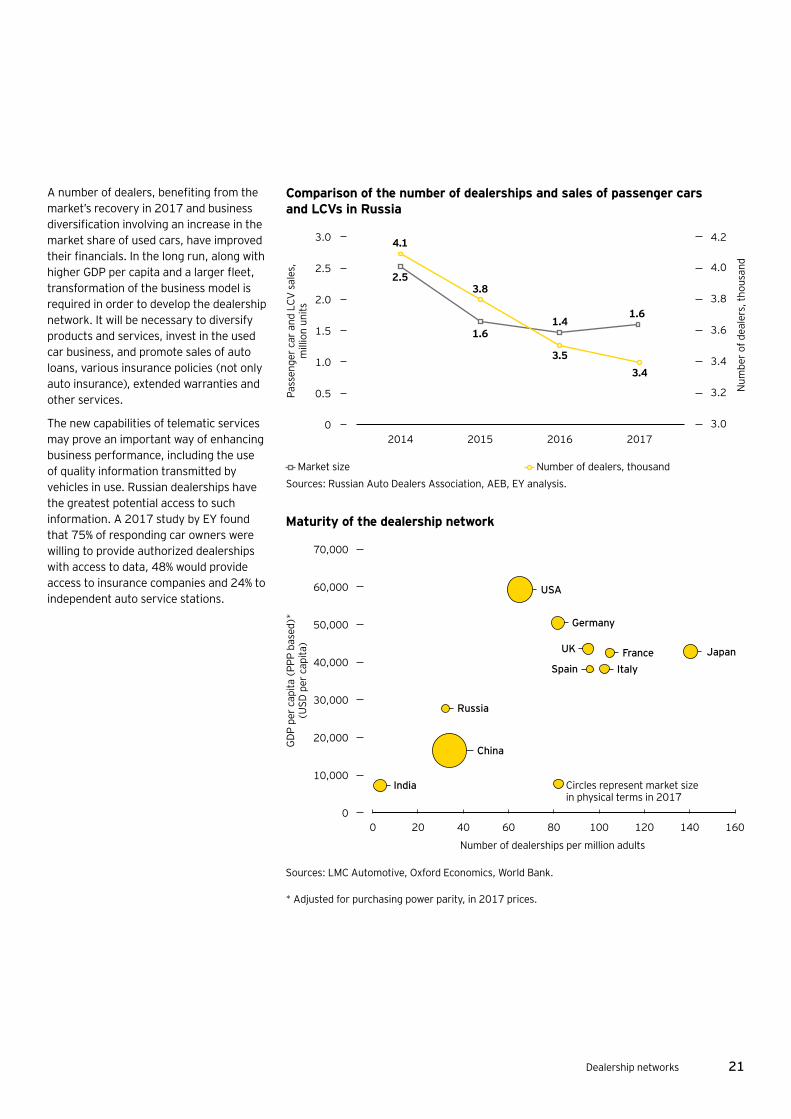
A comparison of Russia and Western countries shows a relatively low penetration of dealership centers in Russia: only 28 dealerships per million adults, as compared with 80–120 in Western Europe. This means that the market has growth potential that will come into play as the economy and the automotive market recover and as the fleet size and number of vehicles per capita increase.
Dealership networks
In 2017 the dealership network — too large for current market capacity — continued to contract. The least successful players left the market: companies that were having financial difficulties and couldn’t adapt to the crisis because of low business diversification and high debt burdens. Some players, major companies included, optimized their business size, and some are going through financial restructuring.
Dealership networks 21
A number of dealers, benefiting from the market’s recovery in 2017 and business diversification involving an increase in the market share of used cars, have improved their financials. In the long run, along with higher GDP per capita and a larger fleet, transformation of the business model is required in order to develop the dealership network. It will be necessary to diversify products and services, invest in the used car business, and promote sales of auto loans, various insurance policies (not only auto insurance), extended warranties and other services.
The new capabilities of telematic services may prove an important way of enhancing business performance, including the use of quality information transmitted by vehicles in use. Russian dealerships have the greatest potential access to such information. A 2017 study by EY found that 75% of responding car owners were willing to provide authorized dealerships with access to data, 48% would provide access to insurance companies and 24% to independent auto service stations.
Comparison of the number of dealerships and sales of passenger cars and LCVs in Russia
Market size Number of dealers, thousandSources: Russian Auto Dealers Association, AEB, EY analysis.
2014
4.1
2.5
1.61.4
1.6
3.8
3.53.4
2015 2016 2017
Pass
enge
r car
and
LCV
sal
es,
mill
ion
units
4.2
4.0
3.8
3.6
3.4
3.2
3.0
Num
ber o
f dea
lers
, tho
usan
d
3.0
2.5
2.0
1.5
1.0
0.5
0
Maturity of the dealership network
Sources: LMC Automotive, Oxford Economics, World Bank.
* Adjusted for purchasing power parity, in 2017 prices.
India
China
Russia
USA
Germany
UK
SpainFrance Japan
Italy
1600 20 40 60 80 100
GDP
per c
apita
(PP
P ba
sed)
* (U
SD p
er c
apita
)
Number of dealerships per million adults
70,000
60,000
50,000
40,000
30,000
20,000
10,000
0120 140
Circles represent market size in physical terms in 2017

22 Overview of the Russian and CIS automotive industry
Credit as a share of total automobile sales dropped substantially in 2014 as a result of the limited availability of auto loans due to higher interest rates and lower real household disposable income, against a background of Russian ruble devaluation. In 2015–17 the percentage of sales on credit regained the pre-crisis level and approached 50%. This recovery was aided by strong government support, including a program to subsidize auto loan rates and the targeted support programs My First Car and Family Car, which offer a discount off the down payment on a car purchased on credit: 10% of the cost of the car. Growing credit sales also enhanced the role of captive banks, motivating them to develop special credit offers under partners’ brands.
Since the 2014 ruble devaluation, the Russian auto loan market has seen stricter requirements for borrowers and a growing share of credit sales in the used-car segment, in addition to higher interest rates, growing overdue balances and larger loans. The market potential for purchases of used cars on credit is based on the following factors:
• low sales of used cars in Russia
• the level of loan penetration in the used-car segment, which is only a third of the level in the new-car segment
• steady growth in used car sales via dealerships
Commercial banks have by far the largest share among credit institutions on the Russian auto loan market, while the West is dominated by automakers’ captive banks. Car sales involving captive loans
accounted for around 75% of sales on credit in the West and only 26% in Russia. This indicates that captive lending, which is more beneficial for consumers in terms of costs and other factors, has substantial growth potential. Seven captive banks have emerged in Russia over the past decade, and, with the exception of 2015, they have accounted for an increasing share of total auto loans.
Russia’s potential for further growth in sales on credit can be seen in the fact that the percentage of such sales lags far behind the figures for developed countries. Credit accounted for around 86% of all sales in the US and UK, 64% in Germany and 59% in France. A factor that could limit this growth in 2018 is cancellation of the program of government subsidies for auto loan rates.
Auto loan market
Credit sales as a share of total sales of passenger cars in Russia (based on car registration data)
New car sales New car credit sales
Credit sales share in total sales
Sources: AEB, AUTOSTAT analytic agency, National Bureau of Credit Histories.
2.5
1.10.8
2.3
35.2% 37.1%
44.0%
48.9%
41.8%
0.5 0.6 0.7
1.3 1.31.6
50%
40%
30%
20%
10%
0%
mill
ion
units
3.0
2.4
1.8
1.2
0.6
02013 2014 2015 2016 2017

Auto loan market 23
Auto loan portfolio vs captive banks’ share in the aggregate auto loan portfolio in Russia (as of the end of the period)
Auto loan potrfolio Captive bank’s share in aggregate auto loan portfolio
Sources: Bank of Russia, banki.ru, Frank Research Group, ОКБ.
935 915
21%18%
24%
26%
17%
712619 632
2013 2014 2015 2016 2017
30%
25%
20%
15%
10%
5%
0%
Port
folio
, RU
B bi
llion
1,000
800
600
400
200
0
New car credit sales, % Number of new cars registered (thousand units)
Sources: National Bureau of Credit Histories, EY analysis.
Share of automotive credit sales by region, 9М2017
Republic of Bashkortostan
thousand units
Republic of Tatarstan
St. Petersburtg
Sverdlovsk Region
KrasnodarTerritory
Samara Region
Moscow Region
Rostov Region
Moscow
38.261.4%
59.3%
50.8%
50.4%
49.9%
48.2%
44.1%
37.6%
27.7%
50.1
30.9
34.8
27.9
70.6
38.0
83.2
149.9
Key players on the auto loan market, 6М2017
Universal bank Captive bank
Sources: Bank of Russia, EY analysis.
Bank UralsibBank PSA Finance Rus
Rosbank (except Cetelem)
Volkswagen Bank RusCredit Europe Bank
Plus BankBMW Bank
Sovcombank
Rusfinance BankCetelem
VTB 24
Soyuz Bank
Sviaz-BankBystroBank
MS Bank Rus
Locko Bank
Mercedes-Benz Bank Rus
UniCredit BankRN Bank
Toyota Bank
Sberbank (except Cetelem)
0 2% 4% 6% 8% 10% 12% 14% 16%
Port
folio
gro
wth
(H
1 20
16–H
1 20
17),
%
Market share, %
80%
60%
40%
20%
0%
–20%
–40%
–80%
–60%

24 Overview of the Russian and CIS automotive industry
In 2017 the CIS market showed signs of recovery as the economy and exchange rates stabilized. The auto markets of Ukraine, Kazakhstan, Belarus and Uzbekistan saw combined sales of some 231,000 motor vehicles in 2017, representing growth of 16.5%. Prior to this, sales had fallen from 476,000 vehicles in 2013 to 198,000 in 2016. Output increased as well — from 113,000 in 2016 to 166,000 in 2017.
CIS automotive markets
Movements in CIS currency exchange rates against the US dollar
Inde
x
2014 2015 2016 2017
100
80
60
40
20
0
Janu
ary
Febr
uary
Mar
chA
pril
May
June
July
Aug
ust
Sept
embe
rO
ctob
erN
ovem
ber
Dece
mbe
rJa
nuar
yFe
brua
ryM
arch
Apr
ilM
ayJu
neJu
lyA
ugus
tSe
ptem
ber
Oct
ober
Nov
embe
rDe
cem
ber
Janu
ary
Febr
uary
Mar
chA
pril
May
June
July
Aug
ust
Sept
embe
rO
ctob
erN
ovem
ber
Dece
mbe
rJa
nuar
yFe
brua
ryM
arch
Apr
ilM
ayJu
neJu
lyA
ugus
tSe
ptem
ber
Oct
ober
Nov
embe
rDe
cem
ber
Russia Belarus Kazakhstan Uzbekistan Ukraine
Sources: Bloomberg, EY analysis.
The main reasons for the contraction before 2017 were the depreciation of national currencies, macroeconomic deterioration and declining purchasing power. Growing imports of cars purchased from Russian dealerships partially offset
the drop in sales over this period, because currency devaluation against the Russian ruble occurred later in some CIS countries and because car prices denominated in foreign currency declined in Russia.

CIS automotive markets 25
KazakhstanFollowing the devaluation of the tenge, the years 2015–16 saw a dramatic drop in sales in Kazakhstan ‒ from 163,000 vehicles in 2014 to 43,000 in 2016 — which in 2016 was largely due to the newly introduced recycling fee and the ensuing falloff in imports. The chief result of 2017 was the recovery of the market, which totaled 46,000 vehicles in 2017, representing 7% growth.
The most popular makes in 2017 were Toyota, LADA, Ravon and Hyundai (19%, 18%, 9% and 7%, respectively), demonstrating that consumers prefer low-end models.
AZIA AVTO (which mostly assembles Chevrolet, KIA, LADA and Skoda) and SaryarkaAvtoProm (Hyundai, Chevrolet, Peugeot, SsangYong, Ravon, Toyota and other makes) remain the largest automakers and plan to expand their assembly capacity and add new models to their product range in order to replace imports. Localization of the country’s auto industry is at a level of 36%, and government support programs for manufacturers are designed to bring this up to 50%.
According to forecasts of the Kazakhstan Auto Business Association, the auto market will continue to expand in 2018, with growth of 15%–20%. Growth will be supported by the recycling program launched in late 2016 and the program for preferential auto loans and leases.
BelarusPassenger car sales in Belarus grew substantially in 2014, reaching 50,000 vehicles — up from 29,000 in 2013. The main reason for this was a sharp rise in imports of cars purchased from Russian dealerships. Sales remained flat in 2015 for the same reason, but then plunged in 2016. The introduction of recycling fees was an additional factor contributing to the drop in 2016.
Sales in 2017 are estimated at around 34,000 — up 29% year on year.
A temporary decline in output in 2017, as capacity was being increased, resulted in lower figures for the country as a whole. A major increase in capacity from 10,000 to 60,000 vehicles per year will allow for renewed output in the future.
UkraineUntil 2014, Ukraine had been the largest motor vehicle market in the CIS outside Russia, but the continuing economic recession caused an 80% drop in passenger car and LCV sales, and by 2015 they amounted to 50,000 vehicles. In 2016 growth picked up again, with car sales up 42.5% year on year, followed by 24.6% growth in 2017.
Sales leaders in 2017 were Toyota (11.9%), Renault (10.8%), Volkswagen (7.6%) and Skoda (7%). Historically, the bulk of Ukrainian demand for low-end models has been met by domestic production. Brands in the middle- and high-price segments were imported largely from Europe and Russia. During the recession, production in Ukraine declined more substantially than sales. Several manufacturers went bankrupt (e.g. Kremenchuk Automobile Plant in 2014, which assembled SsangYong and Great Wall), while others reduced output significantly.
In 2018 demand may grow 10%–20% year on year. Household purchasing power and government support for local manufacturers need to increase in order to sustain growth.

26 Overview of the Russian and CIS automotive industry
Sales of passenger cars and LCVs in selected CIS countries, units
2013 2014 2015 2016 2017 (estimate)
Belarus 28,810 50,000 50,000 26,513 34,255
Kazakhstan 163,911 162,542 145,915 43,368 46,377
Ukraine 225,861 102,772 50,322 71,700 89,326
Uzbekistan 57,500 58,100 58,773 56,300 60,638
Total 476,082 339,740 254,495 197,881 230,596
Sources: LMC Automotive, AUTOSTAT analytic agency, BMI.
Production of passenger cars and LCVs in selected CIS countries, units
2013 2014 2015 2016 2017 (estimate)
Belarus 2,476 9,126 10,255 10,090 4,813
Kazakhstan 37,469 37,782 12,453 10,289 17,062
Ukraine 46,619 26,262 5,921 4,517 7,669
Uzbekistan 246,691 248,828 185,400 88,152 135,981
Total 333,255 321,998 214,029 113,048 165,525
Sources: LMC Automotive, AUTOSTAT analytic agency, BMI.
UzbekistanIn 2015–17 the passenger car and LCV market in Uzbekistan remained essentially unchanged, with 61,000 vehicles sold in 2017. The fact that devaluation of Uzbekistan’s currency occurred only in H2 2017 — much later than in other countries — helped the market during the crisis.
After falling exports to Russia resulted in a major contraction in 2015–16, production partially rebounded in 2017, reaching 136,000 vehicles. This is still well below the figure of 249,000 that was achieved in 2014, but growth will continue as the Russian market recovers.
General Motors Uzbekistan, which produces Chevrolet and Ravon (formerly Daewoo), is the main manufacturer in Uzbekistan, with an annual capacity of 250,000 vehicles. Chevrolet’s output fell when this make left the Russian market in 2015. Ravon replaced Daewoo in mid 2016, but it is still lagging in terms of popularity among Russian consumers. Production and exports will grow as the Russian market recovers and Ravon gains in popularity: this make had sales of 15,000 vehicles in Russia in 2017, as compared with 2,000 in 2016.
Support for the Uzbek market will be provided in the form of reduced excise tax on passenger cars made by General Motors Uzbekistan.

EY’s services for the automotive industry 27
EY experts take a focused and integrated approach to providing professional services for the automotive industry.
Our reputation as an industry expert is based on our people’s high qualifications.
Teams of EY industry advisors who have a wealth of experience working with automakers and component producers develop optimal solutions and assist clients with their implementation.
EY’s services for the automotive industry
Our Global Automotive Center has over 9,400 professionals that deliver exceptional client service worldwide.
EY’s Global Automotive Center is dedicated to delivering insights and practical solutions in assurance, tax and transaction support. We also offer corporate finance, M&A, real estate, information security and business risk management advisory services.
Our clientsEY is a leader in serving automotive and transport companies:• ‒ EY is the leading auditor of automotive
and transportation businesses listed in the 2017 Forbes Global 2000, auditing 32% of these companies.*
• ‒ EY is the leading auditor of automotive and transportation businesses listed in the 2017 Fortune 1000, auditing 38% of these companies.*
• ‒ EY is the leading auditor of automotive and transportation business listed in the Russell 3000 Index in 2017, auditing 30% of these companies.
EY has a global network of professionals serving the automotive industry in Russia and other countries. We offer our clients audit and review services, advise them on tax issues faced by legal entities and individuals, assist with legal matters and help clients understand the specifics of local legislation, provide financial solutions, due diligence services and market overviews and develop business strategy so that our clients can do business successfully in the CIS. Our key services include detailed market analysis and preparation of forecasts, business development and expansion plans, feasibility studies, the search for business partners, tax planning, analysis of customs regulation and verification of VAT settlements.EY is a member of the Association of European Businesses in Russia (AEB) Autocomponents Committee.
* Auditor data as of November 2017.

28 Overview of the Russian and CIS automotive industry
Contacts
Alexei Ivanov
Partner, CIS Transaction Advisory Services Leader Tel.: +7 (495) 228 3661 [email protected]
Olga Arkhangelskaya
Partner, Head of the Transportation and Infrastructure Group in the CIS Tel: +7 (495) 755 9854 [email protected]
Andrey Tomyshev
Director, Head of the CIS Automotive Group Tel. : +7 495 755 9673 [email protected]


EY | Assurance | Tax | Transactions | Advisory
About EYEY is a global leader in assurance, tax, transaction and advisory services. The insights and quality services we deliver help build trust and confidence in the capital markets and in economies the world over. We develop outstanding leaders who team to deliver on our promises to all of our stakeholders. In so doing, we play a critical role in building a better working world for our people, for our clients and for our communities.
EY works together with companies across the CIS and assists them in realizing their business goals. 4,500 professionals work at 19 CIS offices (in Moscow, St. Petersburg, Novosibirsk, Ekaterinburg, Kazan, Krasnodar, Rostov-on-Don, Togliatti, Vladivostok, Almaty, Astana, Atyrau, Bishkek, Baku, Kyiv, Tashkent, Tbilisi, Yerevan and Minsk).
EY refers to the global organization, and may refer to one or more, of the member firms of Ernst & Young Global Limited, each of which is a separate legal entity. Ernst & Young Global Limited, a UK company limited by guarantee, does not provide services to clients. For more information about our organization, please visit ey.com.
How EY’s Global Automotive Center can help your businessThe global recession reset the automotive sector landscape. As the sector recovers, automotive companies across the value chain must focus on profitable and sustainable growth, financial and operational stability, investments in new technologies and seizing opportunities in high-growth markets. If you lead an automotive business, you need to anticipate trends, identify implications and make informed decisions that support your business goals. Our Global Automotive Center enables our worldwide network of more than 9,400 sector-focused assurance, tax, transaction and advisory professionals possessing powerful insights and deep sector knowledge. These insights, combined with our technical experience in every major global automotive market, will help you accelerate strategies and improve performance. Whichever segment of the automotive sector you are in — from component suppliers to manufacturers and retailers of passenger cars and LCVs — we can provide the assistance you need to realize your potential.
© 2018 Ernst & Young Valuation and Advisory Services LLC. All Rights Reserved.
This publication contains information in summary form and is therefore intended for general guidance only. It is not intended to be a substitute for detailed research or the exercise of professional judgment. EY disclaims any responsibility for loss occasioned to any person acting or refraining from action as a result of any material in this publication. On any specific matter, reference should be made to the appropriate advisor.