overview of climate change impacts, vulnerability and ... · overview of climate change impacts,...
TRANSCRIPT

1
Danida fellowship course, training on climate change for journalists from Africa, Asia and Latin America
Overview of climate change impacts, Overview of climate change impacts, vulnerability and adaptation in Europevulnerability and adaptation in Europe
André Jol
European Environment Agency
22
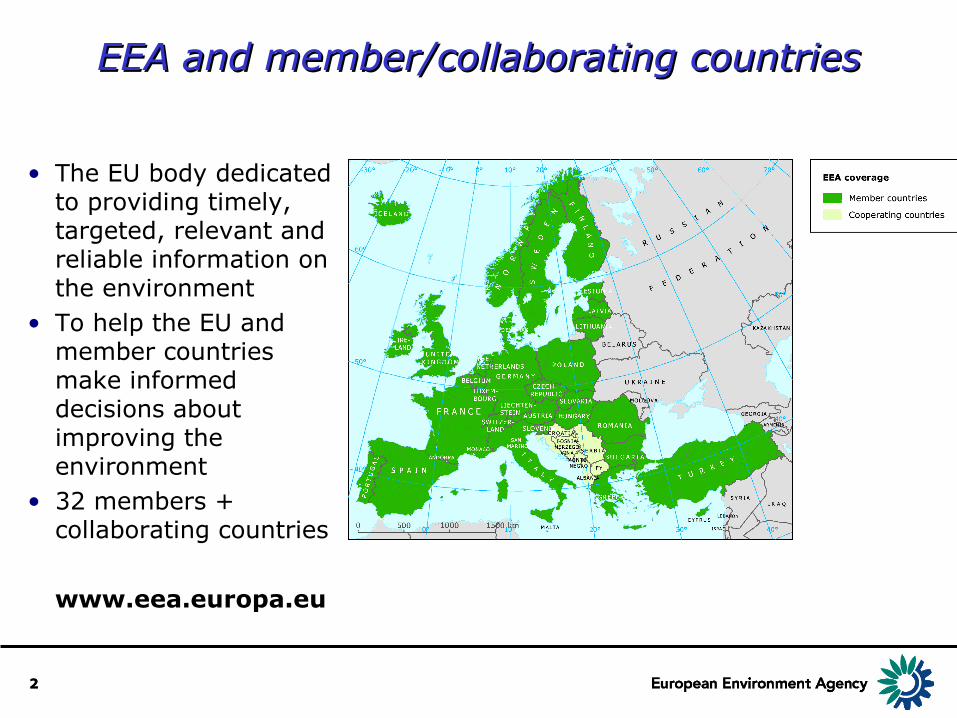
EEA and member/collaborating countriesEEA and member/collaborating countries
• The EU body dedicated to providing timely, targeted, relevant and reliable information on the environment
• To help the EU and member countries make informed decisions about improving the environment
• 32 members + collaborating countries
www.eea.europa.eu

3
• Jointly by EEA, JRC and WHO Europe• Observed and projected trends by
40 indicators• Vulnerable regions and sectors• Summary of national adaptation
plans• Overview of main data gaps
• Based on existing EU and national research (different scenarios)
• Regular updates foreseen (web publication)
Impacts of Europe’s changing climate

4
Figure 3: Key im
pacts as a function of increasing global average tem
perature change
1
1Above 1980
-1999 levels. To express the cha
nge relative to the period 1850-1899, IPCC
WG
II adds 0.5 degrees C
EU +2°C target
Above +Above +2ºC impacts will be large2ºC impacts will be large
5
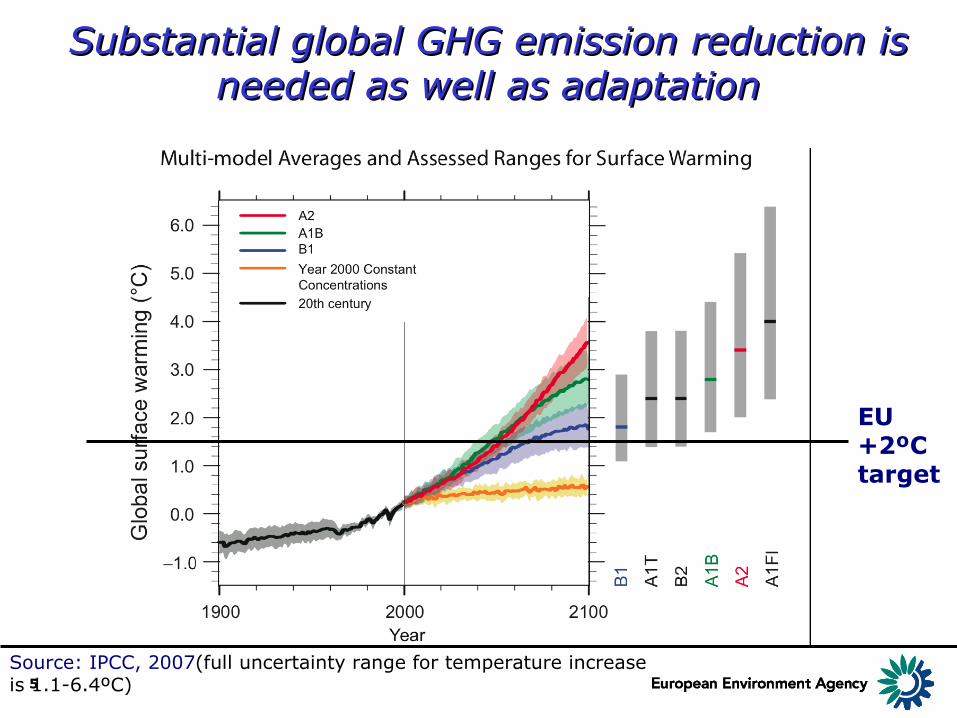
Substantial global GHG emission reduction is Substantial global GHG emission reduction is needed as well as adaptationneeded as well as adaptation
Source: IPCC, 2007(full uncertainty range for temperature increase is 1.1-6.4ºC)
EU +2ºC target

6
Europe key past and projected impactsEurope key past and projected impacts
Main biogeographic regions of Europe (EEA member countries)
Most vulnerable areas• Southern Europe• Mountain areas
(Alps, etc)• Coastal zones• River floodplains• Arctic region
7
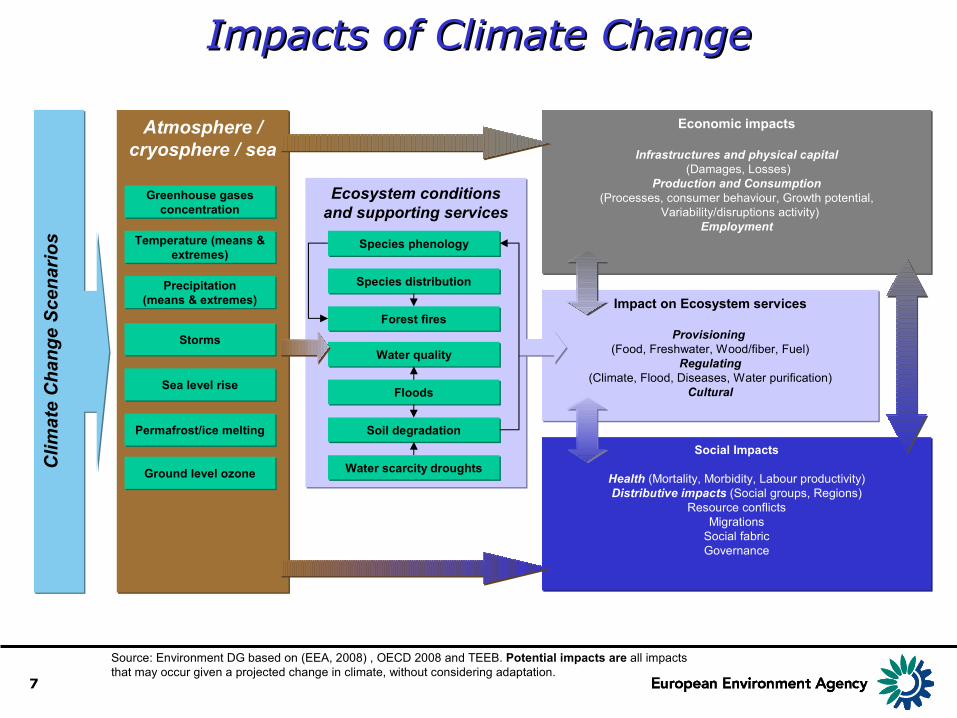
Atmosphere / cryosphere / sea
Impacts of Climate ChangeImpacts of Climate Change
Source: Environment DG based on (EEA, 2008) , OECD 2008 and TEEB. Potential impacts are all impacts that may occur given a projected change in climate, without considering adaptation.
Ecosystem conditions and supporting services
Impact on Ecosystem services
Provisioning (Food, Freshwater, Wood/fiber, Fuel)
Regulating(Climate, Flood, Diseases, Water purification)
Cultural
Economic impacts
Infrastructures and physical capital (Damages, Losses)
Production and Consumption(Processes, consumer behaviour, Growth potential,
Variability/disruptions activity)Employment
Storms
Floods
Water scarcity droughts
Species phenology
Water quality
Forest fires
Soil degradation
Species distribution
Permafrost/ice meltingSocial Impacts
Health (Mortality, Morbidity, Labour productivity)Distributive impacts (Social groups, Regions)
Resource conflictsMigrations
Social fabricGovernance
Greenhouse gases concentration
Temperature (means & extremes)
Precipitation(means & extremes)
Sea level rise
Ground level ozone
Clim
ate
Cha
nge
Scen
ario
s
8
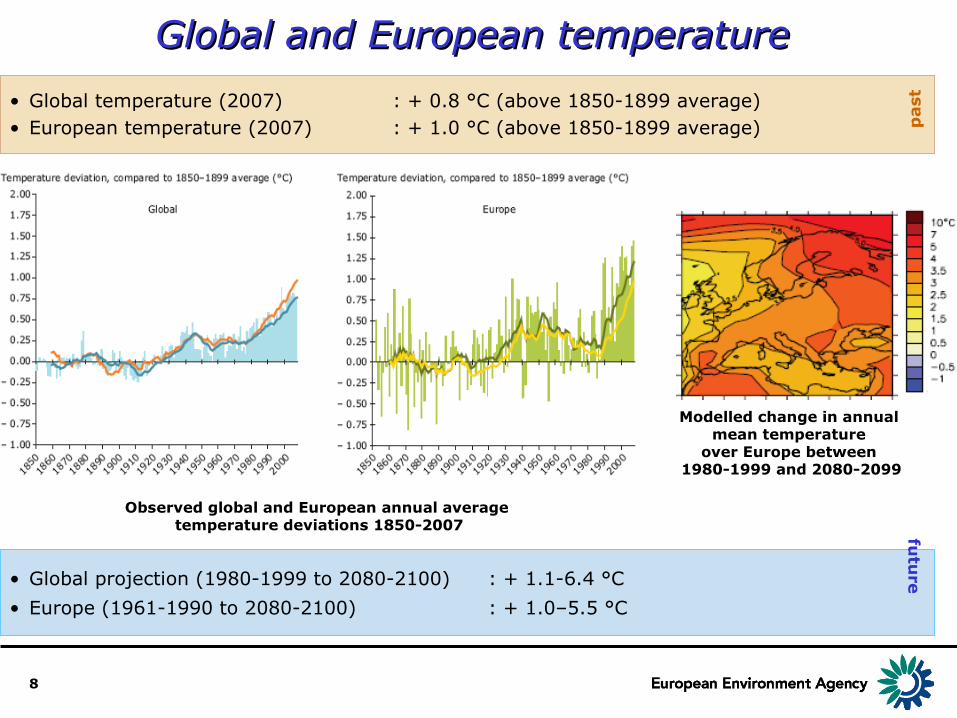
• Global projection (1980-1999 to 2080-2100) : + 1.1-6.4 °C• Europe (1961-1990 to 2080-2100) : + 1.0–5.5 °C
• Global temperature (2007) : + 0.8 °C (above 1850-1899 average)• European temperature (2007) : + 1.0 °C (above 1850-1899 average)
Global and European temperature Global and European temperature fu
ture
past
Modelled change in annual mean temperature
over Europe between 1980-1999 and 2080-2099
Observed global and European annual average temperature deviations 1850-2007

9
• Extremes of cold became less frequent and warm extremes more frequent• Number of hot days almost tripled between 1880 and 2005
Temperature extremes in EuropeTemperature extremes in Europe
• Increase in frequency, intensity and duration of heat-waves• Further decrease of number of cold days and frost extremes
futu
rep
ast
Observed changes in duration of warm spells in summer in the period 1976 - 2006
Projected changes in number of tropical nights between periods
1961-1990 and 2071-2100

10
European precipitationEuropean precipitation
• Projection (1980-1999) to (2080-2099) : 5-20% increase for northern Europe and 5-30% decrease in southern Europe
• northern Europe 10-40 % wetter, southern Europe up to 20 % drier (1900–2000)
futu
rep
ast
Modelled precipitation change between 1980-1999 and 2080-2099
annual summer
Observed changes in annual precipitation between 1961-2006

11
GlaciersGlaciers
• A 3°C increase in average summer temperature could reduce the existing glacier cover of the Alps by 80%
• With continuing climate change nearly all smaller glaciers and one third of glacier area in Norway could disappear by 2100
• The vast majority of European glaciers is in retreat (accelerated since 1980s)• Since 1850 the glaciers in the Alps lost about two thirds of their volume
futu
rep
ast
Cumulative specific net mass balance of glaciers from all European glaciated regions 1946-2006
Modelled remains of the glacier cover in the European Alps for an increase
in average summer air temperature of 1 to 5ºC

12
Arctic sea iceArctic sea ice
• Summer ice is projected to continue to shrink and may even disappear at the height of the summer melt season in the coming decades• There will be still substantial ice in winter
• Arctic sea ice extent has declined at an accelerating rate, especially in summer• The record low ice cover in September 2007 was half of the size of a normal minimum extent
in the 1950s
futu
rep
ast
Observed and projected Arctic September sea-ice extent 1900-2100 The 2007 minimum sea-ice extent

13
Greenland ice sheet Greenland ice sheet
• No reliable prediction of the future of ice sheets can be made, since internal processes are poorly understood
• In the long term, melting ice sheets have the largest potential to increase SLR
futu
re
• The Greenland ice sheet is losing 100 billion tons of ice per year since the 1990s• The contribution of ice-loss from Greenland to global SLR is estimated at 0.14-0.28 mm/year for the period 1993-2003 and has since increased
past
Area of Greenland ice sheet melting 1979-2007

14
Sea level riseSea level rise
• Sea level will rise 0.18 to 0.59 m from 1980-2000 to 2100 (IPCC)• Recent projections indicate a future SLR that may exceed the IPCC upper limit
• Global average SLR during the 20th century was about 1.7mm/year• Recent satellite and tide-gauge data indicate a higher average rate of about 3.1 mm/year in
the past 15 years
futu
rep
ast
Sea level changes in Europe 1992-2007
Projected global average sea-level rise 1990-2100
15
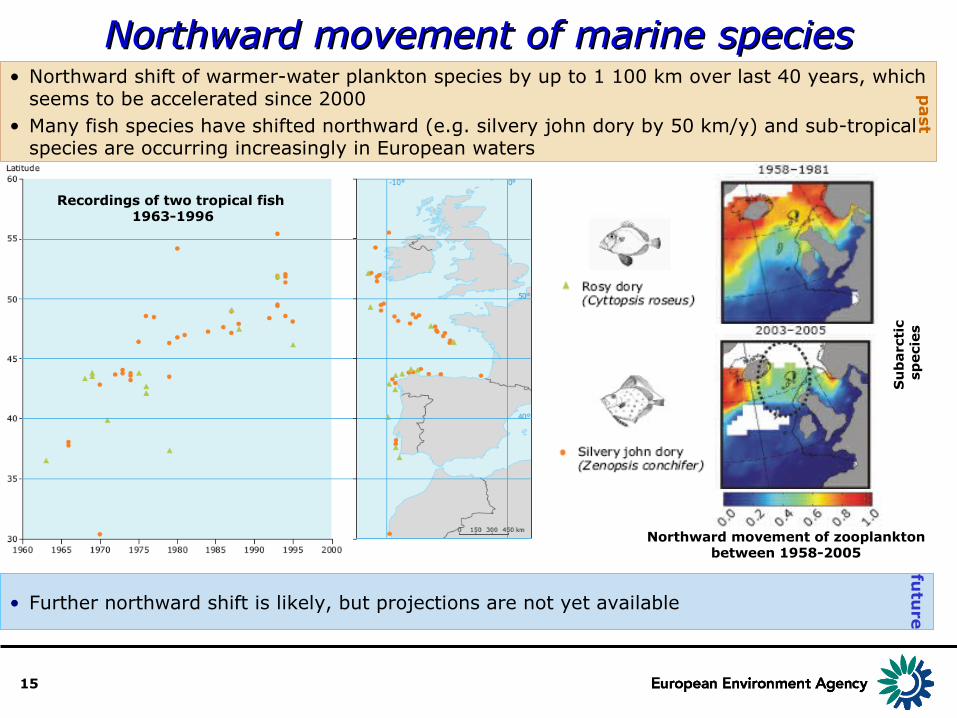
Northward movement of marine speciesNorthward movement of marine species
• Further northward shift is likely, but projections are not yet available
• Northward shift of warmer-water plankton species by up to 1 100 km over last 40 years, which seems to be accelerated since 2000
• Many fish species have shifted northward (e.g. silvery john dory by 50 km/y) and sub-tropical species are occurring increasingly in European waters
past
futu
re
Recordings of two tropical fish 1963-1996
Su
barc
tic
speci
es
Northward movement of zooplankton between 1958-2005
16
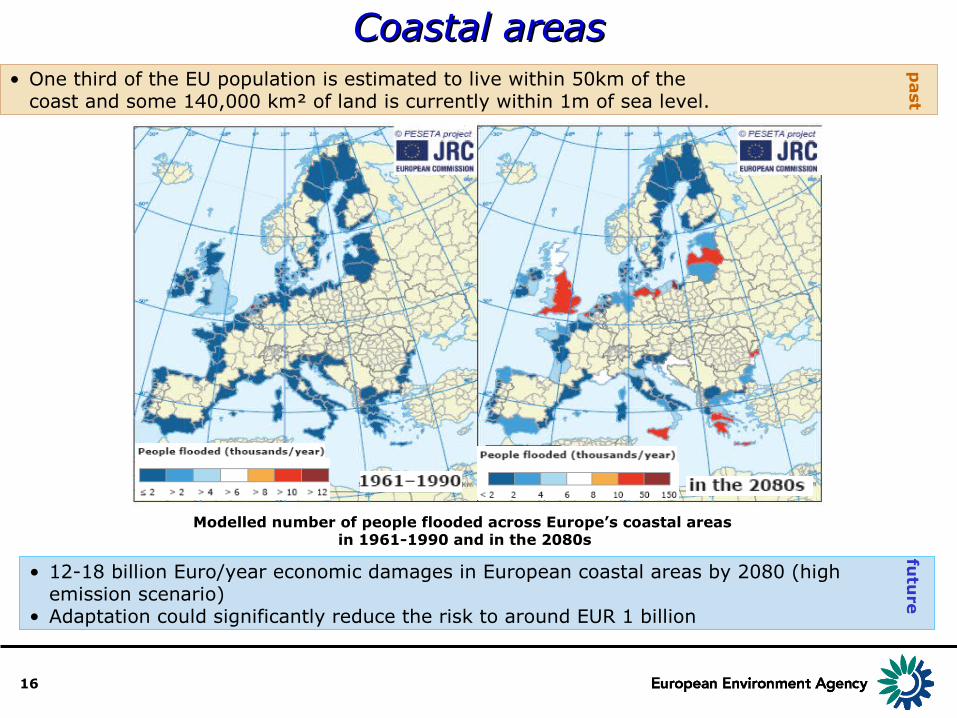
Coastal areasCoastal areas
• 12-18 billion Euro/year economic damages in European coastal areas by 2080 (high emission scenario)
• Adaptation could significantly reduce the risk to around EUR 1 billion
• One third of the EU population is estimated to live within 50km of the coast and some 140,000 km² of land is currently within 1m of sea level.
past
futu
re
Modelled number of people flooded across Europe’s coastal areas in 1961-1990 and in the 2080s
17
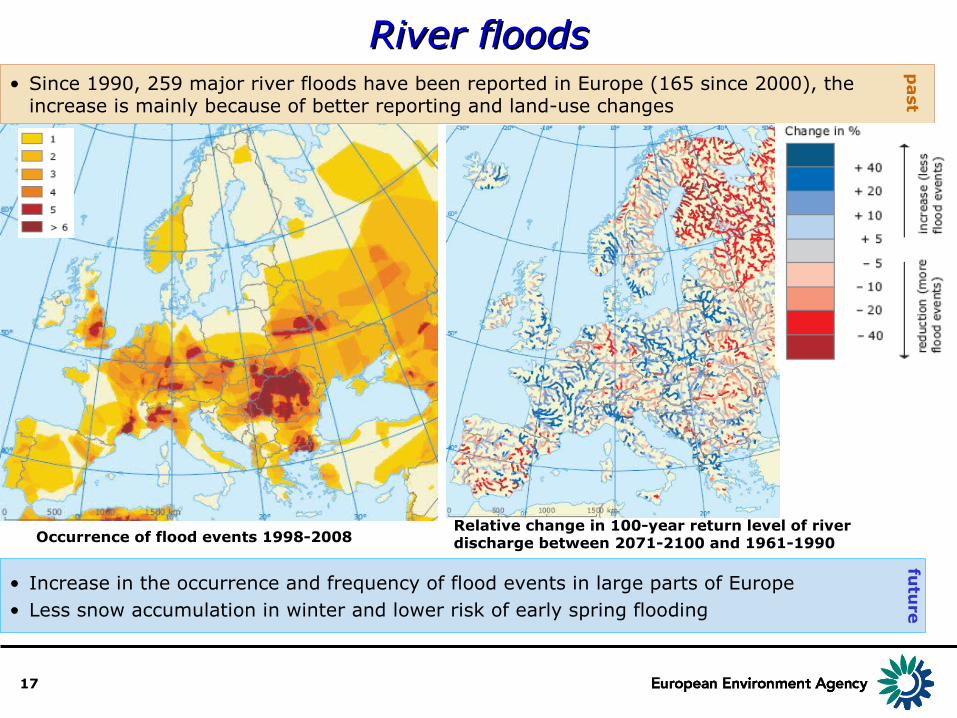
River floodsRiver floods
• Increase in the occurrence and frequency of flood events in large parts of Europe• Less snow accumulation in winter and lower risk of early spring flooding
• Since 1990, 259 major river floods have been reported in Europe (165 since 2000), the increase is mainly because of better reporting and land-use changes
past
futu
re
Occurrence of flood events 1998-2008Relative change in 100-year return level of river discharge between 2071-2100 and 1961-1990
18
19
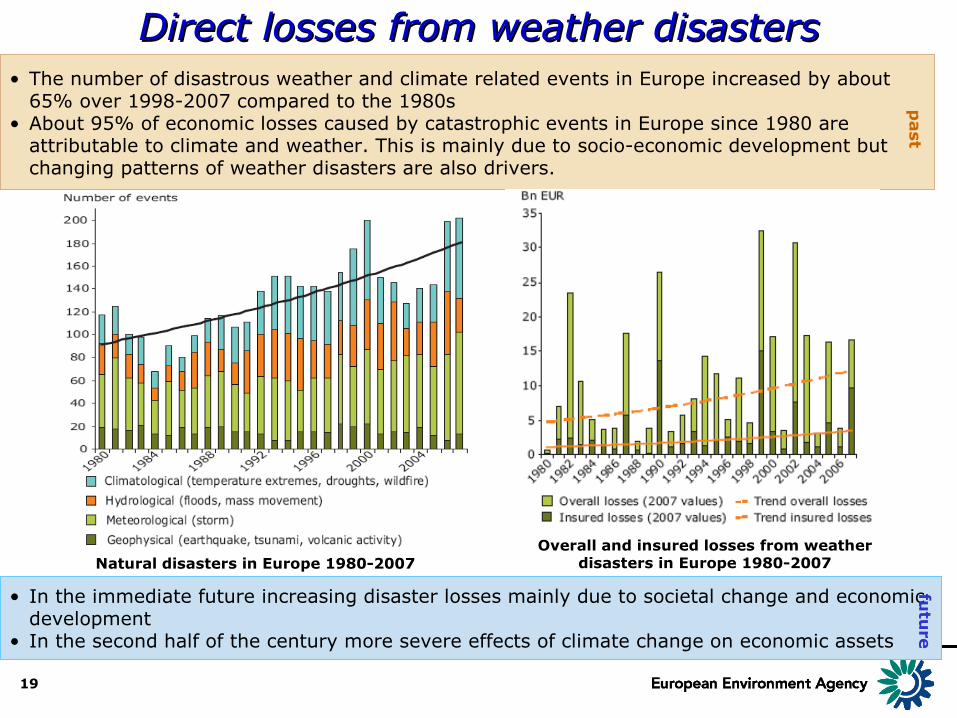
Direct losses from weather disastersDirect losses from weather disasters
• In the immediate future increasing disaster losses mainly due to societal change and economic development
• In the second half of the century more severe effects of climate change on economic assets
• The number of disastrous weather and climate related events in Europe increased by about 65% over 1998-2007 compared to the 1980s
• About 95% of economic losses caused by catastrophic events in Europe since 1980 are attributable to climate and weather. This is mainly due to socio-economic development but changing patterns of weather disasters are also drivers.
past
futu
re
Natural disasters in Europe 1980-2007Overall and insured losses from weather
disasters in Europe 1980-2007
20
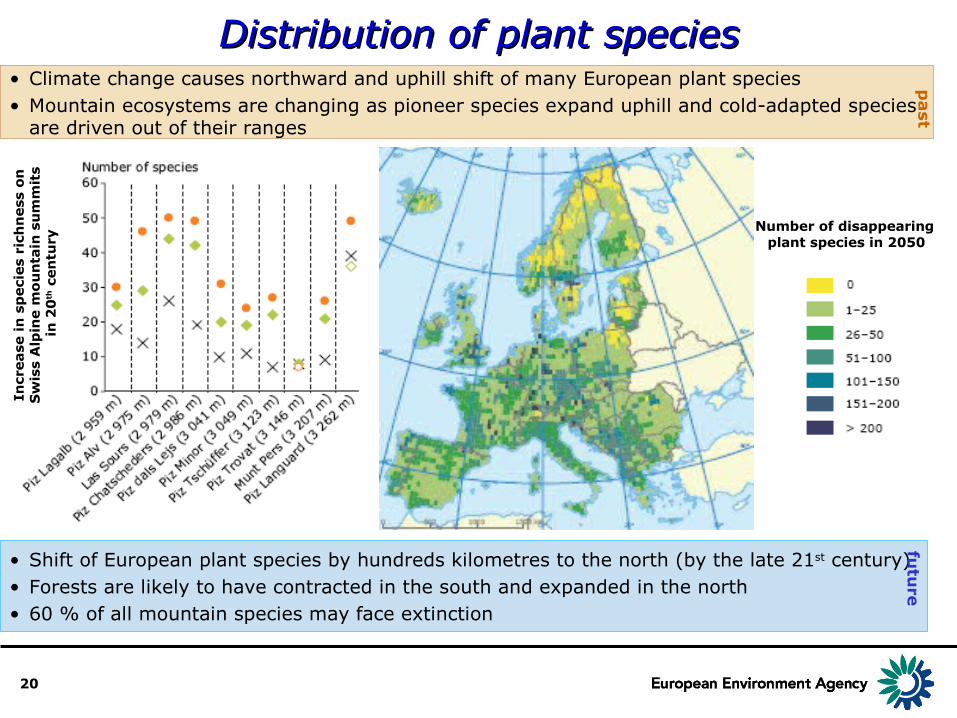
Distribution of plant speciesDistribution of plant species
• Shift of European plant species by hundreds kilometres to the north (by the late 21st century)• Forests are likely to have contracted in the south and expanded in the north• 60 % of all mountain species may face extinction
• Climate change causes northward and uphill shift of many European plant species• Mountain ecosystems are changing as pioneer species expand uphill and cold-adapted species
are driven out of their ranges
past
futu
re
Incr
ease
in
sp
eci
es
rich
ness
on
S
wis
s A
lpin
e m
ou
nta
in s
um
mit
s in
20
th c
en
tury
Number of disappearing plant species in 2050

21
Plant phenologyPlant phenology
• Trends in seasonal events will continue to advance due to climate change
• 78% of leaf unfolding and flowering records show advancing trends and only 3% a significant delay
• Advance of spring and summer was 2.5 days per decade (1971 to 2000)• The pollen season starts 10 days earlier and is longer than 50 years ago
past
futu
re
Phenological sensitivity to temperature changes

22
Distribution of animal speciesDistribution of animal species
• Distribution changes are projected to continue• Shift in suitable conditions for breeding birds nearly 550 km northeast (2100)• Up to 9% of 120 native European mammals risk extinction during 21st century
• Birds, insects, mammals and other groups are moving northwards and uphill • A combination of climate change, habitat fragmentation and other obstacles will impede the
movement’ possible leading to progressive decline of biodiversity
past
futu
re
Latitudinal shifts in northern range margins in United Kingdom for selected groups of animal species over the past 40 years
Projected impact of climate change on the potential
distribution of reptiles and amphibians in 2050
23
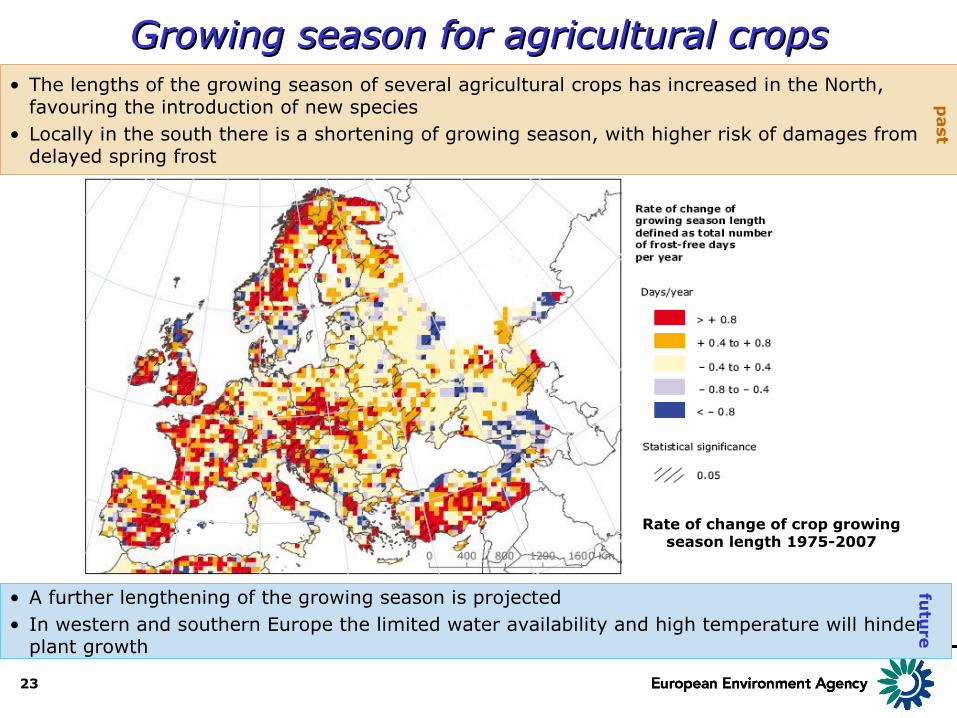
Growing season for agricultural cropsGrowing season for agricultural crops
• A further lengthening of the growing season is projected • In western and southern Europe the limited water availability and high temperature will hinder
plant growth
• The lengths of the growing season of several agricultural crops has increased in the North, favouring the introduction of new species
• Locally in the south there is a shortening of growing season, with higher risk of damages from delayed spring frost
past
futu
re
Rate of change of crop growing season length 1975-2007

24
Forest fire dangerForest fire danger
• More severe fire weather, more area burned, more ignitions and longer fire seasons• Increases in the fire potential during summer month, especially in southern and central
Europe• Probably an increase in the frequency of extreme fire danger days in spring and autumn
• Fire danger increased during the past 50 years particularly in the Mediterranean and central Europe
past
futu
re
Projected changes in fire danger for 2071-2100
Average annual change (1958-2006) of fire danger level (SSR) in % per year
autumn
summer

25
Tourism and recreationTourism and recreation
• The suitability of the Mediterranean for tourism will decline during summer, but increase during spring and autumn. This can lead to shifts in the major flows of tourism within the EU.
• Adaptation responses such as economic diversification will be critical to limit economic losses
• Changes in climate reducing the attractiveness of many of the Mediterranean's major resorts, while improving it in other regions.
past
futu
re
Simulated conditions for summer tourism in Europe (IPCC SRES A2 scenario)

2626
Heat and healthHeat and health
• Increases in the number of heat-related death; mortality risk increases by between 0.2-5.5 % for every 1°C increase above a location-specific threshold
• 86,000 net extra deaths per year in the EU with a global mean temperature increase of 3°C in 2071-2100 relative to 1961-1990
• More than 70,000 excess deaths were reported from 12 European countries in the hot summer of 2003• Long heat waves (more than 5 days) have an impact 1.5-5 times greater than shorter events
past
futu
re
Daily mortality rates in selected European cities by Daily mortality rates in selected European cities by apparent temperature in summer timeapparent temperature in summer time
Relationship between number of Relationship between number of temperature-related daily deaths and temperature-related daily deaths and
daily temperaturedaily temperature

27
White Paper Adapting to climate change: Towards a European framework for action (Phase 1, 2009-2012)• Strengthen the Knowledge/Evidence Base (by 2011):
• Clearing House Mechanism, a repository and platform for knowledge on impacts, vulnerability and adaptation
• Research on data, methods, prediction tools, mapping, costs and effectiveness of adaptation measures
• Monitoring of adaptation actions• Mainstream climate adaptation into key policy areas:
• Health• Agriculture and forests• Biodiversity, ecosystems and water • Coastal and marine areas• Physical infrastructure (transport, energy etc)
• Advance work internationally within UNFCCC and bilateral/regional (including mainstreaming and financing)
• Impact and Adaptation Steering Group (IASG) (e.g. development of national adaptation strategies)

28

29
Delta committee plan for Netherlands (2008)

30
UK approaches to biodiversity and climate change adaptation
Defra, 2007 Defra, 2008 Natural England, 2009

31
Responses by biodiversity/ecosystems to climate change and main adaptation principles (UK)
Natural England, 2009 Defra, 2008

32
EU proposals for a COP15 climate agreementTargets by developed countries • IPCC: developed countries to reduce 25-40% by 2020 (from 1990)• EU climate change and energy package for 2020 (-20% emissions; 20%
renewables; 20% energy efficiency improvements)• Max +2C from pre-industrial level; global emission to peak before 2020
and reduce by at least 50% reduction by 2050 (developed countries: - 80 to 95% by 2050)
Appropriate actions by developing countries • Limit growth in their collective emissions to 15-30% below business as
usual levels by 2020 (except LDCs)• Include action on reduction of greenhouse gas emissions from
deforestationAddress the financing of actions by developing countries• To mitigate greenhouse gas emissions and adapt to climate change (if
exceeding a country’s domestic capabilities)• Mainstream adaptation in other policies and support the least developed
countries small island developing statesBuild an effective global carbon market and reform the Kyoto’s
Clean Development MechanismInclude emissions from international aviation and shipping